• Cat-intel
  • MedIntelliX
  • Resources
  • About Us
  • Hero Background
    English
    Chinese
    French
    Japanese
    Korean
    German
    Spanish

    CAR T Cell Therapy Market Trends

    ID: MRFR/HC/6630-CR
    200 Pages
    Rahul Gotadki
    July 2025

    CAR T Cell Therapy Market Size, Growth Research Report By Therapeutic Area (Oncology, Autoimmune Diseases, Infectious Diseases), By Cell Source (Autologous, Allogeneic, Gene-Edited), By Indication (Acute Lymphoblastic Leukemia, Non-Hodgkin Lymphoma, Multiple Myeloma), By End User (Hospitals, Research Institutes, Cancer Treatment Centers) and By Regional (North America, Europe, South America, As...

    Share:
    Download PDF ×

    We do not share your information with anyone. However, we may send you emails based on your report interest from time to time. You may contact us at any time to opt-out.

    CAR T Cell Therapy Market Infographic
    Purchase Options

    Market Trends

    Key Emerging Trends in the CAR T Cell Therapy Market

    Unlocking New Frontiers in Cancer Treatment: The Surge of FDA Approvals in CAR T Cell Therapies

    In recent years, the landscape of cancer treatment has witnessed a transformative wave, driven by a surge in FDA approvals for therapies utilizing Chimeric Antigen Receptor (CAR) T cells. This paradigm shift is reshaping the possibilities for cancer patients, offering targeted and personalized treatment approaches. Let's delve into the dynamics of increasing FDA approvals in cancer treatment therapies, the notable players in this realm, and the anticipated impact on the global market.

    A Glimpse into FDA-Approved CAR T Cell Therapies

    The Food and Drug Administration (FDA) has been at the forefront of ushering in a new era in cancer treatment by approving several drugs and therapies. Among the notable approvals are Tisagenlecleucel (Kymriah), Axicabtagene ciloleucel (Yescarta), and Tocilizumab (Actemra), each contributing to the expanding arsenal against cancer.

    Tisagenlecleucel (Kymriah): This FDA-approved CAR T cell therapy targets CD19 antigen types and is a formidable force in treating adult patients with B-cell lymphoma. Notably, it also extends its application to patients suffering from B-cell precursor acute lymphoblastic leukemia (ALL).

    Axicabtagene ciloleucel (Yescarta): Another CD19-directed CAR T cell therapy, Axicabtagene ciloleucel, focuses on adult patients battling B-cell lymphoma. Its approval marks a significant stride in offering targeted treatment for this specific demographic.

    Tocilizumab (Actemra): This therapy is designed to address cytokine release syndrome (CRS), a life-threatening condition associated with CAR T-cell therapy. Tocilizumab is approved for both adult and pediatric patients aged 2 years and above.

    These FDA approvals signify a crucial shift towards recognizing the potential of CAR T cell therapies in diverse cancer scenarios, driving advancements that are reshaping the treatment landscape.

    Expanding Applications: CAR T Cell Therapy for Pancreatic Cancer

    Beyond the realms of lymphomas and leukemia, CAR T cell therapy is extending its reach to pancreatic cancer. The rise in pancreatic cancer cases has fueled the exploration of innovative treatment methodologies. Researchers are leveraging the adaptability and specificity of CAR T cells to develop effective strategies for addressing the challenges posed by pancreatic cancer.

    Strategic Approvals Propel Market Growth

    The strategic FDA approvals are not isolated events; they are integral to the broader narrative of advancing cancer treatment. The recent accelerated approval granted to loncastuximab tesirine-lpyl (Zynlonta) by ADC Therapeutics SA on April 23, 2021, further exemplifies the momentum in this space. Zynlonta, a CD19-directed antibody and alkylating agent conjugate, adds a potent tool to the array of therapies available for cancer treatment.

    As these approvals align with the growing demand for combination immunotherapy approaches, they pave the way for a more nuanced and effective response to the complexities of cancer. Researchers and pharmaceutical companies are pushing the boundaries, exploring innovative avenues, and receiving regulatory nods that validate the potential of these advancements.

    Panoramic Impact on Global Market Dynamics

    The burgeoning FDA approvals in CAR T cell therapies are catalysts for the global market's trajectory. The ripple effect is anticipated to manifest in heightened adoption rates, increased investment, and a surge in research and development activities. With each approval, the confidence in CAR T cell therapies as a viable and potent option for cancer treatment grows.

    Conclusion: A Transformative Horizon for Cancer Patients

    In conclusion, the surge in FDA approvals for CAR T cell therapies marks a transformative horizon in cancer treatment. The approval landscape, extending beyond traditional applications, reflects a commitment to exploring novel solutions for diverse cancer types. As the momentum builds, patients can look forward to a future where personalized and targeted therapies redefine the possibilities in the battle against cancer. The strategic convergence of regulatory support, innovative research, and market dynamics heralds a promising era for those on the frontline of the fight against this formidable adversary.

    Author
    Rahul Gotadki
    Assistant Manager

    He holds an experience of about 7+ years in Market Research and Business Consulting, working under the spectrum of Life Sciences and Healthcare domains. Rahul conceptualizes and implements a scalable business strategy and provides strategic leadership to the clients. His expertise lies in market estimation, competitive intelligence, pipeline analysis, customer assessment, etc. In addition to the above, his other responsibility includes strategic tracking of high growth markets & advising clients on the potential areas of focus they could direct their business initiatives

    Leave a Comment

    FAQs

    What is the expected market size of the CAR T Cell Therapy Market by 2024?

    The CAR T Cell Therapy Market is expected to be valued at 9.24 USD billion by the year 2024.

    What will be the market size of the CAR T Cell Therapy Market in 2035?

    By 2035, the CAR T Cell Therapy Market is projected to reach 45.0 USD billion.

    What is the expected compound annual growth rate (CAGR) for the CAR T Cell Therapy Market from 2025 to 2035?

    The expected CAGR for the CAR T Cell Therapy Market from 2025 to 2035 is 15.48%.

    Which region will dominate the CAR T Cell Therapy Market in terms of revenue by 2035?

    North America is anticipated to dominate the CAR T Cell Therapy Market, valued at 22.5 USD billion by 2035.

    What are the projected market values for Oncology within the CAR T Cell Therapy Market by 2035?

    The market for Oncology within the CAR T Cell Therapy Market is projected to reach 24.0 USD billion by 2035.

    Which key players are leading the CAR T Cell Therapy Market?

    Major players in the CAR T Cell Therapy Market include Novartis, Gilead Sciences, and Bristol Myers Squibb, among others.

    How much is the Autoimmune Diseases segment expected to be worth in the CAR T Cell Therapy Market by 2035?

    The Autoimmune Diseases segment is expected to reach 10.0 USD billion in the CAR T Cell Therapy Market by 2035.

    What will be the market size for Infectious Diseases within the CAR T Cell Therapy Market in 2035?

    In 2035, the market size for Infectious Diseases within the CAR T Cell Therapy Market is estimated to be 11.0 USD billion.

    What is the projected market value of the Asia Pacific region in the CAR T Cell Therapy Market by 2035?

    The Asia Pacific region is projected to have a market value of 8.0 USD billion by 2035 in the CAR T Cell Therapy Market.

    What challenges and opportunities are present in the CAR T Cell Therapy Market?

    The CAR T Cell Therapy Market faces challenges related to regulatory hurdles while also presenting opportunities for innovation and expanded applications.

    Market Summary

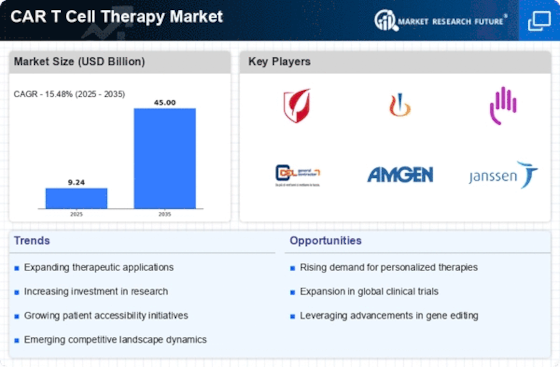
    As per MRFR analysis, the CAR T Cell Therapy Market was estimated at 9.238 USD Billion in 2024. The CAR T Cell Therapy industry is projected to grow from 10.67 USD Billion in 2025 to 45.0 USD Billion by 2035, exhibiting a compound annual growth rate (CAGR) of 15.48 during the forecast period 2025 - 2035.

    Key Market Trends & Highlights

    The CAR T Cell Therapy Market is poised for substantial growth driven by technological advancements and increasing investment in biotechnology.

    • North America remains the largest market for CAR T Cell Therapy, reflecting a robust healthcare infrastructure and high treatment adoption rates.
    • The Asia-Pacific region is emerging as the fastest-growing market, fueled by increasing healthcare investments and a rising patient population.
    • Oncology continues to dominate the CAR T Cell Therapy segment, while therapies for autoimmune diseases are experiencing rapid growth.
    • Key market drivers include the rising incidence of cancer and advancements in research and development, which are propelling the market forward.

    Market Size & Forecast

    2024 Market Size 9.238 (USD Billion)
    2035 Market Size 45.0 (USD Billion)
    CAGR (2025 - 2035) 15.48%
    Largest Regional Market Share in 2024 North America

    Major Players

    <p>Gilead Sciences (US), Novartis (CH), Bristol-Myers Squibb (US), Celgene (US), Amgen (US), Janssen Pharmaceuticals (US), AbbVie (US), Sangamo Therapeutics (US), Celyad Oncology (BE)</p>

    Market Trends

    The CAR T Cell Therapy Market is currently experiencing a transformative phase, characterized by rapid advancements in technology and an increasing understanding of the therapeutic potential of engineered T cells. This innovative approach to cancer treatment harnesses the body's immune system to target and eliminate malignant cells, leading to promising outcomes for patients with certain types of hematological malignancies. As research progresses, the market is likely to expand, driven by ongoing clinical trials and the introduction of new therapies. Regulatory bodies are also playing a crucial role in shaping the landscape, as they evaluate the safety and efficacy of these novel treatments. Moreover, the CAR T Cell Therapy Market is witnessing a surge in collaborations between biotechnology firms and academic institutions. These partnerships aim to enhance research capabilities and expedite the development of next-generation therapies. The growing prevalence of cancer and the demand for personalized medicine further fuel this market's growth. As stakeholders continue to invest in research and development, the CAR T Cell Therapy Market appears poised for significant evolution, potentially leading to broader applications beyond hematological cancers, including solid tumors.

    Technological Advancements

    The CAR T Cell Therapy Market is benefiting from continuous technological innovations that enhance the efficacy and safety of treatments. New methodologies in gene editing and cell engineering are emerging, which may lead to more effective therapies with fewer side effects.

    Collaborative Research Efforts

    There is a noticeable trend of increased collaboration between pharmaceutical companies and research institutions. These partnerships are likely to accelerate the development of CAR T therapies, fostering innovation and expanding treatment options for patients.

    Regulatory Developments

    Regulatory agencies are actively shaping the CAR T Cell Therapy Market by establishing guidelines that ensure the safety and efficacy of new therapies. This regulatory framework may influence the pace of market growth and the introduction of novel treatments.

    The ongoing advancements in CAR T cell therapy are poised to revolutionize treatment paradigms for hematological malignancies, potentially offering new hope to patients with limited therapeutic options.

    U.S. Food and Drug Administration (FDA)

    CAR T Cell Therapy Market Market Drivers

    Rising Incidence of Cancer

    The increasing prevalence of various cancers is a primary driver for the CAR T Cell Therapy Market. As cancer cases rise, the demand for innovative treatment options intensifies. According to recent statistics, cancer is projected to affect millions annually, necessitating advanced therapies. CAR T cell therapy, known for its ability to target specific cancer cells, offers a promising solution. This therapy has shown remarkable efficacy in treating hematological malignancies, with response rates exceeding 80% in some cases. The growing patient population seeking effective treatments propels the CAR T Cell Therapy Market forward, as healthcare providers look for cutting-edge solutions to combat this escalating health crisis.

    Growing Awareness and Acceptance

    The growing awareness and acceptance of CAR T cell therapies among healthcare professionals and patients significantly impact the CAR T Cell Therapy Market. Educational initiatives and outreach programs have increased understanding of the benefits and potential of CAR T therapies. As more clinicians become familiar with these advanced treatments, the likelihood of their adoption in clinical practice rises. Additionally, patient advocacy groups play a vital role in promoting awareness, leading to increased demand for CAR T therapies. This heightened acceptance is likely to drive market growth, as more patients seek out these innovative options for their cancer treatment.

    Regulatory Support and Approvals

    Regulatory support plays a pivotal role in shaping the CAR T Cell Therapy Market. Regulatory agencies are increasingly recognizing the potential of CAR T therapies, expediting the approval process for new treatments. Recent approvals for several CAR T products have set a precedent, encouraging further development in this field. The streamlined regulatory pathways not only facilitate quicker access to therapies for patients but also instill confidence in investors and manufacturers. As more CAR T therapies gain regulatory approval, the market is expected to expand, providing patients with access to innovative treatment options that were previously unavailable.

    Increasing Investment in Biotechnology

    The surge in investment within the biotechnology sector is a crucial driver for the CAR T Cell Therapy Market. Venture capital and private equity funding have reached unprecedented levels, with billions directed towards companies specializing in CAR T cell therapies. This influx of capital facilitates the acceleration of clinical trials and the commercialization of new therapies. Furthermore, partnerships between biotech firms and academic institutions foster collaborative research, enhancing the development of innovative CAR T products. As financial backing continues to grow, the CAR T Cell Therapy Market is likely to witness rapid advancements, leading to a wider array of treatment options for patients.

    Advancements in Research and Development

    Ongoing advancements in research and development significantly influence the CAR T Cell Therapy Market. Continuous innovations in genetic engineering and cell processing technologies enhance the efficacy and safety profiles of CAR T therapies. Recent studies indicate that novel CAR constructs and combination therapies are being explored, potentially expanding the treatment landscape. The investment in R&D is substantial, with billions allocated to developing next-generation CAR T therapies. This focus on innovation not only improves patient outcomes but also attracts interest from pharmaceutical companies, thereby driving market growth. As new therapies emerge, the CAR T Cell Therapy Market is poised for expansion, catering to a broader range of malignancies.

    Market Segment Insights

    By Therapeutic Area: Oncology (Largest) vs. Autoimmune Diseases (Fastest-Growing)

    <p>The CAR T Cell Therapy Market is primarily dominated by the oncology segment, which commands a significant portion of the total market share. Within oncology, therapies targeting hematologic malignancies have gained robust acceptance, driven by high clinical efficacy and multiple FDA approvals. In contrast, the autoimmune diseases segment, while currently smaller in total market share, is emerging rapidly as innovative CAR T therapies are developed to address conditions such as rheumatoid arthritis and lupus. This shift reflects the evolving landscape of CAR T therapy applications beyond traditional oncology.</p>

    <p>Oncology: Dominant vs. Autoimmune Diseases: Emerging</p>

    <p>Oncology remains the dominant therapeutic area for CAR T cell therapy, attributed to its established applications in the treatment of various blood cancers like lymphomas and leukemias. The success of products such as Kymriah and Yescarta has solidified oncology's leading position, showcasing superior patient outcomes and broader clinical use. Meanwhile, the autoimmune diseases segment is rapidly emerging, with research focusing on harnessing CAR T cell technology to modify immune responses. This area is characterized by innovative clinical trials and collaborations aiming to deliver groundbreaking therapies, indicating a strong potential for future market expansion as more treatments receive regulatory approval.</p>

    By Cell Source: Autologous (Largest) vs. Allogeneic (Fastest-Growing)

    <p>In the CAR T Cell Therapy Market, the cell source segment is primarily divided into three categories: Autologous, Allogeneic, and Gene-Edited. Autologous CAR T cell therapies hold the largest share, driven by their established presence and effective track records in treating hematologic malignancies. Meanwhile, Allogeneic therapies are rapidly gaining traction, noted for their potential to treat a broader patient population and reduce treatment times, making them appealing alternatives in the competitive landscape. The growth trends within this segment illustrate a two-fold path: while Autologous therapies continue to dominate due to their personalized approach, Allogeneic therapies are emerging as the fastest-growing segment, fueled by advancements in gene-editing technologies and the need for off-the-shelf solutions. This shift signifies a changing investor interest as they seek scalable options that can effectively meet the rising demand for CAR T cell therapies in oncology and beyond.</p>

    <p>Autologous (Dominant) vs. Allogeneic (Emerging)</p>

    <p>The Autologous CAR T cell therapy segment remains dominant in the market due to its personalized nature, where cells are harvested from the patient and modified before reinfusion. This method has proven effective in various cases of hematological cancers. Autologous therapies benefit from long-standing clinical data demonstrating their efficacy and safety. In contrast, the Allogeneic segment is rapidly emerging, differing by using cells from healthy donors, which enables the possibility of off-the-shelf treatments that can be administered immediately. This innovation not only caters to a larger patient demographic but also reduces the duration of treatment preparation, addressing a critical gap in the market. Both segments represent significant progress in cell therapy technologies, responding to the evolving needs of patients and clinicians.</p>

    By Indication: Acute Lymphoblastic Leukemia (Largest) vs. Non-Hodgkin Lymphoma (Fastest-Growing)

    <p>In the CAR T Cell Therapy Market, the indications for treatment are increasingly pivotal. Acute Lymphoblastic Leukemia (ALL) has established itself as the largest segment, holding the most significant market share due to its higher prevalence among patients requiring innovative therapies. Non-Hodgkin Lymphoma (NHL), while smaller in share, is rapidly gaining traction, reflecting a shift in therapeutic focus as healthcare professionals seek advanced and effective treatment options for this heterogeneous cancer group. The growth trends within this segment are driven largely by ongoing clinical trials and a surge in product approvals that cater to unmet medical needs. The market is embracing novel formulations and combination therapies aimed at improving efficacy and accessibility for patients with ALL and NHL. As research continues to unfold, new indications and treatment regimens are expected to enhance the therapeutic landscape, further driving market expansion.</p>

    <p>Acute Lymphoblastic Leukemia (Dominant) vs. Non-Hodgkin Lymphoma (Emerging)</p>

    <p>Acute Lymphoblastic Leukemia (ALL) remains the dominant indication in the CAR T Cell Therapy Market due to its substantial patient population and the critical need for innovative therapies. With established CAR T products showing high response rates, ALL has attracted significant research and investment. Conversely, Non-Hodgkin Lymphoma (NHL) is emerging rapidly, characterized by a diverse patient base and varying subtypes that present unique challenges and opportunities for tailored therapies. The ongoing development of CAR T therapies for NHL is fueled by promising clinical data and the expanding indication scope, which is anticipated to bolster market share as new products are introduced and adopted in clinical practice.</p>

    By End User: Hospitals (Largest) vs. Cancer Treatment Centers (Fastest-Growing)

    <p>In the CAR T Cell Therapy market, hospitals hold the largest share among the end-user segment, primarily due to their established infrastructure and access to a broader patient demographic. They provide advanced healthcare services, facilitate quicker patient management, and are equipped with experts specializing in innovative therapies. In contrast, cancer treatment centers are emerging as a vital component, showing significant growth as they focus exclusively on oncological care, establishing a more concentrated approach to CAR T therapies.</p>

    <p>End User: Hospitals (Dominant) vs. Cancer Treatment Centers (Emerging)</p>

    <p>Hospitals are currently the dominant force in the CAR T Cell Therapy market, benefiting from extensive healthcare networks and a high patient turnover. Their capability to adopt and implement CAR T therapies is enhanced by their access to cutting-edge facilities and specialized staff. On the other hand, cancer treatment centers emerge as a growing segment, positioned uniquely to cater specifically to cancer patients. These centers are rapidly expanding their CAR T Cell Therapy offerings, driven by increasing specialized training for healthcare professionals and focused patient care. Their reputation for personalized treatment fosters trust and ongoing patient referral, which is critical for market expansion.</p>

    Get more detailed insights about CAR T Cell Therapy Market Research Report - Global Forecast till 2035

    Regional Insights

    The CAR T Cell Therapy Market is exhibiting substantial growth across various regions, with North America capturing the majority holding at a valuation of 4.5 USD Billion in 2024 and projected to rise significantly to 22.5 USD Billion by 2035. This dominance can be attributed to advanced healthcare infrastructure and an increasing prevalence of hematological cancers.

    Europe follows with a valuation of 2.5 USD Billion in 2024, expected to reach 10.5 USD billion by 2035, reflecting strong investments in Research and Development and the adoption of innovative therapies.In South America, the market is valued at 0.5 USD Billion in 2024, with a potential increase to 2.0 USD billion by 2035, indicating growing awareness and access to CAR T cell therapies. The Asia Pacific region holds a value of 1.5 USD Billion in 2024, projected to expand to 8.0 USD billion by 2035, driven by a rising population and improving healthcare facilities.

    Lastly, the Middle East and Africa, starting at 0.24 USD billion in 2024 and potentially reaching 2.0 USD billion by 2035, reflect emerging opportunities and an increasing focus on cancer treatment solutions.Each of these regional markets presents unique growth drivers and challenges, positioning the CAR T Cell Therapy Market for significant advancements in the coming years.

    CAR T Cell Therapy Market Regional Insights

    Source: Primary Research, Secondary Research, Market Research Future Database, and Analyst Review

    Key Players and Competitive Insights

    The CAR T Cell Therapy Market is witnessing significant growth driven by advancements in biotechnology and an increasing understanding of cancer immunotherapy. As a cellular therapy that modifies a patient's T cells to better recognize and attack cancer cells, CAR T cell therapy has become a key focus area for many pharmaceutical firms, leading to a highly competitive landscape.

    The market is characterized by rapid innovation, with companies striving to enhance the efficacy and safety profiles of their CAR T cell products while also competing to expand their market reach. Regulatory approvals, clinical trial outcomes, and strategic partnerships are critical factors influencing competitive dynamics. The presence of established players alongside emerging biotech companies creates both opportunities and challenges in this evolving market.Novartis is a prominent player in the CAR T Cell Therapy Market, known for its pioneering efforts in developing CAR T therapies.

    With its flagship product receiving robust market approval, Novartis has established a significant foothold in the CAR T space.

    The company leverages its extensive research and development capabilities to stay at the forefront of immunotherapy advancements, focusing on improving patient outcomes and expanding indications for existing products. Its strategic partnerships with academic institutions and other biotech firms bolster its innovation capabilities and enhance its market presence.

    Furthermore, Novartis benefits from a strong global brand reputation, a robust sales and distribution network, and a commitment to investing in next-generation therapies that position it well within the competitive dynamics of the CAR T cell therapy market.Regeneron Pharmaceuticals is also making notable strides in the CAR T Cell Therapy Market, driven by its strong commitment to leading-edge biopharmaceutical development. The company is focusing on expanding its pipeline and aims to introduce innovative CAR T therapies to address unmet medical needs.

    Regeneron has been actively involved in collaborations with other biotech firms and institutions to enhance its research capabilities and accelerate the development of CAR T cell therapies.

    The company is well-regarded for its solid fiscal foundation and infrastructure that supports extensive research operations. Key products in its emerging portfolio are poised to compete aggressively in the market. Additionally, Regeneron's strategic mergers and acquisitions have strengthened its position, allowing it to leverage synergies in product development and expand its technological capabilities in CAR T cell therapy, reinforcing its standing on a global scale.

    Key Companies in the CAR T Cell Therapy Market market include

    Industry Developments

    The Global CAR T-Cell Therapy Market is witnessing significant advancements, driven by continued regulatory progress and promising clinical trial outcomes. In October 2023, Gilead Sciences, through its Kite Pharma division, released encouraging data from its ongoing trials of Yescarta and Tecartus, indicating improved patient responses in relapsed lymphoma cases. Novartis has continued to expand the application of Kymriah, its FDA-approved CAR T therapy, by conducting trials in broader hematologic indications.

    In September 2023, Bristol Myers Squibb reported positive results from a pivotal Phase III study of Abecma in multiple myeloma patients, reinforcing its strong position in the CAR T landscape. Additionally, Regeneron Pharmaceuticals has been investing in early-stage CAR T programs targeting solid tumors, signaling a broader industry push beyond hematologic cancers.

    The market remains highly dynamic, with increased investment in R&D from companies such as Amgen, Roche, and Bristol Myers Squibb, reflecting the growing global demand for personalized cancer treatments. Strategic partnerships, regulatory approvals, and pipeline expansion are expected to shape the future of this high-growth sector.

    Future Outlook

    CAR T Cell Therapy Market Future Outlook

    <p>The CAR T Cell Therapy Market is projected to grow at a 15.48% CAGR from 2024 to 2035, driven by technological advancements, increasing cancer prevalence, and expanding clinical applications.</p>

    New opportunities lie in:

    • <p>Development of personalized CAR T therapies for niche cancer types.</p>
    • <p>Expansion of manufacturing capabilities to reduce production costs.</p>
    • <p>Strategic partnerships with healthcare providers for integrated treatment solutions.</p>

    <p>By 2035, the CAR T Cell Therapy Market is expected to achieve substantial growth and innovation.</p>

    Market Segmentation

    CAR T Cell Therapy Market End User Outlook

    • Hospitals
    • Research Institutes
    • Cancer Treatment Centers

    CAR T Cell Therapy Market Indication Outlook

    • Acute Lymphoblastic Leukemia
    • Non-Hodgkin Lymphoma
    • Multiple Myeloma

    CAR T Cell Therapy Market Cell Source Outlook

    • Autologous
    • Allogeneic
    • Gene-Edited

    CAR T Cell Therapy Market Therapeutic Area Outlook

    • Oncology
    • Autoimmune Diseases
    • Infectious Diseases

    Report Scope

    MARKET SIZE 20249.238(USD Billion)
    MARKET SIZE 202510.67(USD Billion)
    MARKET SIZE 203545.0(USD Billion)
    COMPOUND ANNUAL GROWTH RATE (CAGR)15.48% (2024 - 2035)
    REPORT COVERAGERevenue Forecast, Competitive Landscape, Growth Factors, and Trends
    BASE YEAR2024
    Market Forecast Period2025 - 2035
    Historical Data2019 - 2024
    Market Forecast UnitsUSD Billion
    Key Companies ProfiledMarket analysis in progress
    Segments CoveredMarket segmentation analysis in progress
    Key Market OpportunitiesAdvancements in personalized medicine enhance efficacy and expand applications in the CAR T Cell Therapy Market.
    Key Market DynamicsRising demand for personalized medicine drives innovation and competition in the CAR T Cell Therapy market.
    Countries CoveredNorth America, Europe, APAC, South America, MEA

    FAQs

    What is the expected market size of the CAR T Cell Therapy Market by 2024?

    The CAR T Cell Therapy Market is expected to be valued at 9.24 USD billion by the year 2024.

    What will be the market size of the CAR T Cell Therapy Market in 2035?

    By 2035, the CAR T Cell Therapy Market is projected to reach 45.0 USD billion.

    What is the expected compound annual growth rate (CAGR) for the CAR T Cell Therapy Market from 2025 to 2035?

    The expected CAGR for the CAR T Cell Therapy Market from 2025 to 2035 is 15.48%.

    Which region will dominate the CAR T Cell Therapy Market in terms of revenue by 2035?

    North America is anticipated to dominate the CAR T Cell Therapy Market, valued at 22.5 USD billion by 2035.

    What are the projected market values for Oncology within the CAR T Cell Therapy Market by 2035?

    The market for Oncology within the CAR T Cell Therapy Market is projected to reach 24.0 USD billion by 2035.

    Which key players are leading the CAR T Cell Therapy Market?

    Major players in the CAR T Cell Therapy Market include Novartis, Gilead Sciences, and Bristol Myers Squibb, among others.

    How much is the Autoimmune Diseases segment expected to be worth in the CAR T Cell Therapy Market by 2035?

    The Autoimmune Diseases segment is expected to reach 10.0 USD billion in the CAR T Cell Therapy Market by 2035.

    What will be the market size for Infectious Diseases within the CAR T Cell Therapy Market in 2035?

    In 2035, the market size for Infectious Diseases within the CAR T Cell Therapy Market is estimated to be 11.0 USD billion.

    What is the projected market value of the Asia Pacific region in the CAR T Cell Therapy Market by 2035?

    The Asia Pacific region is projected to have a market value of 8.0 USD billion by 2035 in the CAR T Cell Therapy Market.

    What challenges and opportunities are present in the CAR T Cell Therapy Market?

    The CAR T Cell Therapy Market faces challenges related to regulatory hurdles while also presenting opportunities for innovation and expanded applications.

    1. FACTOR ANALYSIS
      1. \r\n\r\n\r\nValue chain Analysis
      2. \r\n\r\n\r\nPorter's
      3. Five Forces Analysis
      4. \r\n\r\n\r\nBargaining Power of Suppliers
      5. \r\n\r\n\r\nBargaining
      6. Power of Buyers
      7. \r\n\r\n\r\nThreat of New Entrants
      8. \r\n\r\n\r\nThreat
      9. of Substitutes
      10. \r\n\r\n\r\nIntensity of Rivalry
      11. \r\n\r\n\r\n\r\n\r\nCOVID-19
      12. Impact Analysis
      13. \r\n\r\n\r\nMarket Impact Analysis
      14. \r\n\r\n\r\nRegional
      15. Impact
      16. \r\n\r\n\r\nOpportunity and Threat Analysis
      17. \r\n\r\n\r\n\r\n\r\n\r\n\r\n
      18. \r\n
      19. \r\n\r\n\r\nCAR
    2. T Cell Therapy Market, BY Therapeutic Area (USD Billion)
      1. \r\n\r\n\r\nOncology
      2. \r\n\r\n\r\nAutoimmune
      3. Diseases
      4. \r\n\r\n\r\nInfectious Diseases
      5. \r\n\r\n\r\n\r\n\r\nCAR
    3. T Cell Therapy Market, BY Cell Source (USD Billion)
      1. \r\n\r\n\r\nAutologous
      2. \r\n\r\n\r\nAllogeneic
      3. \r\n\r\n\r\nGene-Edited
      4. \r\n\r\n\r\n\r\n\r\nCAR
    4. T Cell Therapy Market, BY Indication (USD Billion)
      1. \r\n\r\n\r\nAcute
      2. Lymphoblastic Leukemia
      3. \r\n\r\n\r\nNon-Hodgkin Lymphoma
      4. \r\n\r\n\r\nMultiple
      5. Myeloma
      6. \r\n\r\n\r\n\r\n\r\nCAR T Cell Therapy
    5. Market, BY End User (USD Billion)
      1. \r\n\r\n\r\nHospitals
      2. \r\n\r\n\r\nResearch
      3. Institutes
      4. \r\n\r\n\r\nCancer Treatment Centers
      5. \r\n\r\n\r\n\r\n\r\nCAR
    6. T Cell Therapy Market, BY Regional (USD Billion)
      1. \r\n\r\n\r\nNorth
      2. America
      3. \r\n\r\n\r\nUS
      4. \r\n\r\n\r\nCanada
      5. \r\n\r\n\r\n\r\n\r\nEurope
      6. \r\n\r\n\r\nGermany
      7. \r\n\r\n\r\nUK
      8. \r\n\r\n\r\nFrance
      9. \r\n\r\n\r\nRussia
      10. \r\n\r\n\r\nItaly
      11. \r\n\r\n\r\nSpain
      12. \r\n\r\n\r\nRest
      13. of Europe
      14. \r\n\r\n\r\n\r\n\r\nAPAC
      15. \r\n\r\n\r\nChina
      16. \r\n\r\n\r\nIndia
      17. \r\n\r\n\r\nJapan
      18. \r\n\r\n\r\nSouth
      19. Korea
      20. \r\n\r\n\r\nMalaysia
      21. \r\n\r\n\r\nThailand
      22. \r\n\r\n\r\nIndonesia
      23. \r\n\r\n\r\nRest
      24. of APAC
      25. \r\n\r\n\r\n\r\n\r\nSouth America
      26. \r\n\r\n\r\nBrazil
      27. \r\n\r\n\r\nMexico
      28. \r\n\r\n\r\nArgentina
      29. \r\n\r\n\r\nRest
      30. of South America
      31. \r\n\r\n\r\n\r\n\r\nMEA
      32. \r\n\r\n\r\nGCC
      33. Countries
      34. \r\n\r\n\r\nSouth Africa
      35. \r\n\r\n\r\nRest
      36. of MEA
      37. \r\n\r\n\r\n\r\n\r\n\r\n\r\n
      38. \r\n
      39. \r\n\r\n\r\nCompetitive
      40. Landscape
      41. \r\n\r\n\r\nOverview
      42. \r\n\r\n\r\nCompetitive
      43. Analysis
      44. \r\n\r\n\r\nMarket share Analysis
      45. \r\n\r\n\r\nMajor
      46. Growth Strategy in the CAR T Cell Therapy Market
      47. \r\n\r\n\r\nCompetitive
      48. Benchmarking
      49. \r\n\r\n\r\nLeading Players in Terms of Number of Developments
      50. in the CAR T Cell Therapy Market
      51. \r\n\r\n\r\nKey developments and
      52. growth strategies
      53. \r\n\r\n\r\nNew Product Launch/Service Deployment
      54. \r\n\r\n\r\nMerger
      55. & Acquisitions
      56. \r\n\r\n\r\nJoint Ventures
      57. \r\n\r\n\r\n\r\n\r\nMajor
      58. Players Financial Matrix
      59. \r\n\r\n\r\nSales and Operating Income
      60. \r\n\r\n\r\nMajor
      61. Players R&D Expenditure. 2023
      62. \r\n\r\n\r\n\r\n\r\n\r\n\r\nCompany
      63. Profiles
      64. \r\n\r\n\r\nPfizer
      65. \r\n\r\n\r\nFinancial
      66. Overview
      67. \r\n\r\n\r\nProducts Offered
      68. \r\n\r\n\r\nKey
      69. Developments
      70. \r\n\r\n\r\nSWOT Analysis
      71. \r\n\r\n\r\nKey
      72. Strategies
      73. \r\n\r\n\r\n\r\n\r\nIntellia Therapeutics
      74. \r\n\r\n\r\nFinancial
      75. Overview
      76. \r\n\r\n\r\nProducts Offered
      77. \r\n\r\n\r\nKey
      78. Developments
      79. \r\n\r\n\r\nSWOT Analysis
      80. \r\n\r\n\r\nKey
      81. Strategies
      82. \r\n\r\n\r\n\r\n\r\nRoche
      83. \r\n\r\n\r\nFinancial
      84. Overview
      85. \r\n\r\n\r\nProducts Offered
      86. \r\n\r\n\r\nKey
      87. Developments
      88. \r\n\r\n\r\nSWOT Analysis
      89. \r\n\r\n\r\nKey
      90. Strategies
      91. \r\n\r\n\r\n\r\n\r\nGilead Sciences
      92. \r\n\r\n\r\nFinancial
      93. Overview
      94. \r\n\r\n\r\nProducts Offered
      95. \r\n\r\n\r\nKey
      96. Developments
      97. \r\n\r\n\r\nSWOT Analysis
      98. \r\n\r\n\r\nKey
      99. Strategies
      100. \r\n\r\n\r\n\r\n\r\nCelyad
      101. \r\n\r\n\r\nFinancial
      102. Overview
      103. \r\n\r\n\r\nProducts Offered
      104. \r\n\r\n\r\nKey
      105. Developments
      106. \r\n\r\n\r\nSWOT Analysis
      107. \r\n\r\n\r\nKey
      108. Strategies
      109. \r\n\r\n\r\n\r\n\r\nBristol Myers Squibb
      110. \r\n\r\n\r\nFinancial
      111. Overview
      112. \r\n\r\n\r\nProducts Offered
      113. \r\n\r\n\r\nKey
      114. Developments
      115. \r\n\r\n\r\nSWOT Analysis
      116. \r\n\r\n\r\nKey
      117. Strategies
      118. \r\n\r\n\r\n\r\n\r\nSangamo Therapeutics
      119. \r\n\r\n\r\nFinancial
      120. Overview
      121. \r\n\r\n\r\nProducts Offered
      122. \r\n\r\n\r\nKey
      123. Developments
      124. \r\n\r\n\r\nSWOT Analysis
      125. \r\n\r\n\r\nKey
      126. Strategies
      127. \r\n\r\n\r\n\r\n\r\nAllogene Therapeutics
      128. \r\n\r\n\r\nFinancial
      129. Overview
      130. \r\n\r\n\r\nProducts Offered
      131. \r\n\r\n\r\nKey
      132. Developments
      133. \r\n\r\n\r\nSWOT Analysis
      134. \r\n\r\n\r\nKey
      135. Strategies
      136. \r\n\r\n\r\n\r\n\r\nCelgene
      137. \r\n\r\n\r\nFinancial
      138. Overview
      139. \r\n\r\n\r\nProducts Offered
      140. \r\n\r\n\r\nKey
      141. Developments
      142. \r\n\r\n\r\nSWOT Analysis
      143. \r\n\r\n\r\nKey
      144. Strategies
      145. \r\n\r\n\r\n\r\n\r\nNovartis
      146. \r\n\r\n\r\nFinancial
      147. Overview
      148. \r\n\r\n\r\nProducts Offered
      149. \r\n\r\n\r\nKey
      150. Developments
      151. \r\n\r\n\r\nSWOT Analysis
      152. \r\n\r\n\r\nKey
      153. Strategies
      154. \r\n\r\n\r\n\r\n\r\nBluebird Bio
      155. \r\n\r\n\r\nFinancial
      156. Overview
      157. \r\n\r\n\r\nProducts Offered
      158. \r\n\r\n\r\nKey
      159. Developments
      160. \r\n\r\n\r\nSWOT Analysis
      161. \r\n\r\n\r\nKey
      162. Strategies
      163. \r\n\r\n\r\n\r\n\r\nMerck
      164. \r\n\r\n\r\nFinancial
      165. Overview
      166. \r\n\r\n\r\nProducts Offered
      167. \r\n\r\n\r\nKey
      168. Developments
      169. \r\n\r\n\r\nSWOT Analysis
      170. \r\n\r\n\r\nKey
      171. Strategies
      172. \r\n\r\n\r\n\r\n\r\nAstraZeneca
      173. \r\n\r\n\r\nFinancial
      174. Overview
      175. \r\n\r\n\r\nProducts Offered
      176. \r\n\r\n\r\nKey
      177. Developments
      178. \r\n\r\n\r\nSWOT Analysis
      179. \r\n\r\n\r\nKey
      180. Strategies
      181. \r\n\r\n\r\n\r\n\r\nAmgen
      182. \r\n\r\n\r\nFinancial
      183. Overview
      184. \r\n\r\n\r\nProducts Offered
      185. \r\n\r\n\r\nKey
      186. Developments
      187. \r\n\r\n\r\nSWOT Analysis
      188. \r\n\r\n\r\nKey
      189. Strategies
      190. \r\n\r\n\r\n\r\n\r\nJuno Therapeutics
      191. \r\n\r\n\r\nFinancial
      192. Overview
      193. \r\n\r\n\r\nProducts Offered
      194. \r\n\r\n\r\nKey
      195. Developments
      196. \r\n\r\n\r\nSWOT Analysis
      197. \r\n\r\n\r\nKey
      198. Strategies
      199. \r\n\r\n\r\n\r\n\r\n\r\n\r\nAppendix
      200. \r\n\r\n\r\nReferences
      201. \r\n\r\n\r\nRelated
      202. Reports
      203. \r\n\r\n\r\n\r\n\r\nLIST Of tables
      204. \r\n
      205. \r\n\r\n\r\nLIST
    7. OF ASSUMPTIONS
      1. \r\n\r\n\r\nNorth America CAR T Cell Therapy Market
      2. SIZE ESTIMATES & FORECAST, BY THERAPEUTIC AREA, 2019-2035 (USD Billions)
      3. \r\n\r\n\r\nNorth
    8. America CAR T Cell Therapy Market SIZE ESTIMATES & FORECAST, BY CELL SOURCE,
      1. \r\n\r\n\r\nNorth America CAR T Cell Therapy
    9. Market SIZE ESTIMATES & FORECAST, BY INDICATION, 2019-2035 (USD Billions)
      1. \r\n\r\n\r\nNorth
    10. America CAR T Cell Therapy Market SIZE ESTIMATES & FORECAST, BY END USER, 2019-2035
      1. (USD Billions)
      2. \r\n\r\n\r\nNorth America CAR T Cell Therapy Market
      3. SIZE ESTIMATES & FORECAST, BY REGIONAL, 2019-2035 (USD Billions)
      4. \r\n\r\n\r\nUS
    11. CAR T Cell Therapy Market SIZE ESTIMATES & FORECAST, BY THERAPEUTIC AREA, 2019-2035
      1. (USD Billions)
      2. \r\n\r\n\r\nUS CAR T Cell Therapy Market SIZE ESTIMATES
      3. & FORECAST, BY CELL SOURCE, 2019-2035 (USD Billions)
      4. \r\n\r\n\r\nUS
    12. CAR T Cell Therapy Market SIZE ESTIMATES & FORECAST, BY INDICATION, 2019-2035
      1. (USD Billions)
      2. \r\n\r\n\r\nUS CAR T Cell Therapy Market SIZE ESTIMATES
      3. & FORECAST, BY END USER, 2019-2035 (USD Billions)
      4. \r\n\r\n\r\nUS
    13. CAR T Cell Therapy Market SIZE ESTIMATES & FORECAST, BY REGIONAL, 2019-2035
      1. (USD Billions)
      2. \r\n\r\n\r\nCanada CAR T Cell Therapy Market SIZE
      3. ESTIMATES & FORECAST, BY THERAPEUTIC AREA, 2019-2035 (USD Billions)
      4. \r\n\r\n\r\nCanada
    14. CAR T Cell Therapy Market SIZE ESTIMATES & FORECAST, BY CELL SOURCE, 2019-2035
      1. (USD Billions)
      2. \r\n\r\n\r\nCanada CAR T Cell Therapy Market SIZE
      3. ESTIMATES & FORECAST, BY INDICATION, 2019-2035 (USD Billions)
      4. \r\n\r\n\r\nCanada
    15. CAR T Cell Therapy Market SIZE ESTIMATES & FORECAST, BY END USER, 2019-2035
      1. (USD Billions)
      2. \r\n\r\n\r\nCanada CAR T Cell Therapy Market SIZE
      3. ESTIMATES & FORECAST, BY REGIONAL, 2019-2035 (USD Billions)
      4. \r\n\r\n\r\nEurope
    16. CAR T Cell Therapy Market SIZE ESTIMATES & FORECAST, BY THERAPEUTIC AREA, 2019-2035
      1. (USD Billions)
      2. \r\n\r\n\r\nEurope CAR T Cell Therapy Market SIZE
      3. ESTIMATES & FORECAST, BY CELL SOURCE, 2019-2035 (USD Billions)
      4. \r\n\r\n\r\nEurope
    17. CAR T Cell Therapy Market SIZE ESTIMATES & FORECAST, BY INDICATION, 2019-2035
      1. (USD Billions)
      2. \r\n\r\n\r\nEurope CAR T Cell Therapy Market SIZE
      3. ESTIMATES & FORECAST, BY END USER, 2019-2035 (USD Billions)
      4. \r\n\r\n\r\nEurope
    18. CAR T Cell Therapy Market SIZE ESTIMATES & FORECAST, BY REGIONAL, 2019-2035
      1. (USD Billions)
      2. \r\n\r\n\r\nGermany CAR T Cell Therapy Market SIZE
      3. ESTIMATES & FORECAST, BY THERAPEUTIC AREA, 2019-2035 (USD Billions)
      4. \r\n\r\n\r\nGermany
    19. CAR T Cell Therapy Market SIZE ESTIMATES & FORECAST, BY CELL SOURCE, 2019-2035
      1. (USD Billions)
      2. \r\n\r\n\r\nGermany CAR T Cell Therapy Market SIZE
      3. ESTIMATES & FORECAST, BY INDICATION, 2019-2035 (USD Billions)
      4. \r\n\r\n\r\nGermany
    20. CAR T Cell Therapy Market SIZE ESTIMATES & FORECAST, BY END USER, 2019-2035
      1. (USD Billions)
      2. \r\n\r\n\r\nGermany CAR T Cell Therapy Market SIZE
      3. ESTIMATES & FORECAST, BY REGIONAL, 2019-2035 (USD Billions)
      4. \r\n\r\n\r\nUK
    21. CAR T Cell Therapy Market SIZE ESTIMATES & FORECAST, BY THERAPEUTIC AREA, 2019-2035
      1. (USD Billions)
      2. \r\n\r\n\r\nUK CAR T Cell Therapy Market SIZE ESTIMATES
      3. & FORECAST, BY CELL SOURCE, 2019-2035 (USD Billions)
      4. \r\n\r\n\r\nUK
    22. CAR T Cell Therapy Market SIZE ESTIMATES & FORECAST, BY INDICATION, 2019-2035
      1. (USD Billions)
      2. \r\n\r\n\r\nUK CAR T Cell Therapy Market SIZE ESTIMATES
      3. & FORECAST, BY END USER, 2019-2035 (USD Billions)
      4. \r\n\r\n\r\nUK
    23. CAR T Cell Therapy Market SIZE ESTIMATES & FORECAST, BY REGIONAL, 2019-2035
      1. (USD Billions)
      2. \r\n\r\n\r\nFrance CAR T Cell Therapy Market SIZE
      3. ESTIMATES & FORECAST, BY THERAPEUTIC AREA, 2019-2035 (USD Billions)
      4. \r\n\r\n\r\nFrance
    24. CAR T Cell Therapy Market SIZE ESTIMATES & FORECAST, BY CELL SOURCE, 2019-2035
      1. (USD Billions)
      2. \r\n\r\n\r\nFrance CAR T Cell Therapy Market SIZE
      3. ESTIMATES & FORECAST, BY INDICATION, 2019-2035 (USD Billions)
      4. \r\n\r\n\r\nFrance
    25. CAR T Cell Therapy Market SIZE ESTIMATES & FORECAST, BY END USER, 2019-2035
      1. (USD Billions)
      2. \r\n\r\n\r\nFrance CAR T Cell Therapy Market SIZE
      3. ESTIMATES & FORECAST, BY REGIONAL, 2019-2035 (USD Billions)
      4. \r\n\r\n\r\nRussia
    26. CAR T Cell Therapy Market SIZE ESTIMATES & FORECAST, BY THERAPEUTIC AREA, 2019-2035
      1. (USD Billions)
      2. \r\n\r\n\r\nRussia CAR T Cell Therapy Market SIZE
      3. ESTIMATES & FORECAST, BY CELL SOURCE, 2019-2035 (USD Billions)
      4. \r\n\r\n\r\nRussia
    27. CAR T Cell Therapy Market SIZE ESTIMATES & FORECAST, BY INDICATION, 2019-2035
      1. (USD Billions)
      2. \r\n\r\n\r\nRussia CAR T Cell Therapy Market SIZE
      3. ESTIMATES & FORECAST, BY END USER, 2019-2035 (USD Billions)
      4. \r\n\r\n\r\nRussia
    28. CAR T Cell Therapy Market SIZE ESTIMATES & FORECAST, BY REGIONAL, 2019-2035
      1. (USD Billions)
      2. \r\n\r\n\r\nItaly CAR T Cell Therapy Market SIZE ESTIMATES
      3. & FORECAST, BY THERAPEUTIC AREA, 2019-2035 (USD Billions)
      4. \r\n\r\n\r\nItaly
    29. CAR T Cell Therapy Market SIZE ESTIMATES & FORECAST, BY CELL SOURCE, 2019-2035
      1. (USD Billions)
      2. \r\n\r\n\r\nItaly CAR T Cell Therapy Market SIZE ESTIMATES
      3. & FORECAST, BY INDICATION, 2019-2035 (USD Billions)
      4. \r\n\r\n\r\nItaly
    30. CAR T Cell Therapy Market SIZE ESTIMATES & FORECAST, BY END USER, 2019-2035
      1. (USD Billions)
      2. \r\n\r\n\r\nItaly CAR T Cell Therapy Market SIZE ESTIMATES
      3. & FORECAST, BY REGIONAL, 2019-2035 (USD Billions)
      4. \r\n\r\n\r\nSpain
    31. CAR T Cell Therapy Market SIZE ESTIMATES & FORECAST, BY THERAPEUTIC AREA, 2019-2035
      1. (USD Billions)
      2. \r\n\r\n\r\nSpain CAR T Cell Therapy Market SIZE ESTIMATES
      3. & FORECAST, BY CELL SOURCE, 2019-2035 (USD Billions)
      4. \r\n\r\n\r\nSpain
    32. CAR T Cell Therapy Market SIZE ESTIMATES & FORECAST, BY INDICATION, 2019-2035
      1. (USD Billions)
      2. \r\n\r\n\r\nSpain CAR T Cell Therapy Market SIZE ESTIMATES
      3. & FORECAST, BY END USER, 2019-2035 (USD Billions)
      4. \r\n\r\n\r\nSpain
    33. CAR T Cell Therapy Market SIZE ESTIMATES & FORECAST, BY REGIONAL, 2019-2035
      1. (USD Billions)
      2. \r\n\r\n\r\nRest of Europe CAR T Cell Therapy Market
      3. SIZE ESTIMATES & FORECAST, BY THERAPEUTIC AREA, 2019-2035 (USD Billions)
      4. \r\n\r\n\r\nRest
    34. of Europe CAR T Cell Therapy Market SIZE ESTIMATES & FORECAST, BY CELL SOURCE,
      1. \r\n\r\n\r\nRest of Europe CAR T Cell Therapy
    35. Market SIZE ESTIMATES & FORECAST, BY INDICATION, 2019-2035 (USD Billions)
      1. \r\n\r\n\r\nRest
    36. of Europe CAR T Cell Therapy Market SIZE ESTIMATES & FORECAST, BY END USER,
      1. \r\n\r\n\r\nRest of Europe CAR T Cell Therapy
    37. Market SIZE ESTIMATES & FORECAST, BY REGIONAL, 2019-2035 (USD Billions)
      1. \r\n\r\n\r\nAPAC
    38. CAR T Cell Therapy Market SIZE ESTIMATES & FORECAST, BY THERAPEUTIC AREA, 2019-2035
      1. (USD Billions)
      2. \r\n\r\n\r\nAPAC CAR T Cell Therapy Market SIZE ESTIMATES
      3. & FORECAST, BY CELL SOURCE, 2019-2035 (USD Billions)
      4. \r\n\r\n\r\nAPAC
    39. CAR T Cell Therapy Market SIZE ESTIMATES & FORECAST, BY INDICATION, 2019-2035
      1. (USD Billions)
      2. \r\n\r\n\r\nAPAC CAR T Cell Therapy Market SIZE ESTIMATES
      3. & FORECAST, BY END USER, 2019-2035 (USD Billions)
      4. \r\n\r\n\r\nAPAC
    40. CAR T Cell Therapy Market SIZE ESTIMATES & FORECAST, BY REGIONAL, 2019-2035
      1. (USD Billions)
      2. \r\n\r\n\r\nChina CAR T Cell Therapy Market SIZE ESTIMATES
      3. & FORECAST, BY THERAPEUTIC AREA, 2019-2035 (USD Billions)
      4. \r\n\r\n\r\nChina
    41. CAR T Cell Therapy Market SIZE ESTIMATES & FORECAST, BY CELL SOURCE, 2019-2035
      1. (USD Billions)
      2. \r\n\r\n\r\nChina CAR T Cell Therapy Market SIZE ESTIMATES
      3. & FORECAST, BY INDICATION, 2019-2035 (USD Billions)
      4. \r\n\r\n\r\nChina
    42. CAR T Cell Therapy Market SIZE ESTIMATES & FORECAST, BY END USER, 2019-2035
      1. (USD Billions)
      2. \r\n\r\n\r\nChina CAR T Cell Therapy Market SIZE ESTIMATES
      3. & FORECAST, BY REGIONAL, 2019-2035 (USD Billions)
      4. \r\n\r\n\r\nIndia
    43. CAR T Cell Therapy Market SIZE ESTIMATES & FORECAST, BY THERAPEUTIC AREA, 2019-2035
      1. (USD Billions)
      2. \r\n\r\n\r\nIndia CAR T Cell Therapy Market SIZE ESTIMATES
      3. & FORECAST, BY CELL SOURCE, 2019-2035 (USD Billions)
      4. \r\n\r\n\r\nIndia
    44. CAR T Cell Therapy Market SIZE ESTIMATES & FORECAST, BY INDICATION, 2019-2035
      1. (USD Billions)
      2. \r\n\r\n\r\nIndia CAR T Cell Therapy Market SIZE ESTIMATES
      3. & FORECAST, BY END USER, 2019-2035 (USD Billions)
      4. \r\n\r\n\r\nIndia
    45. CAR T Cell Therapy Market SIZE ESTIMATES & FORECAST, BY REGIONAL, 2019-2035
      1. (USD Billions)
      2. \r\n\r\n\r\nJapan CAR T Cell Therapy Market SIZE ESTIMATES
      3. & FORECAST, BY THERAPEUTIC AREA, 2019-2035 (USD Billions)
      4. \r\n\r\n\r\nJapan
    46. CAR T Cell Therapy Market SIZE ESTIMATES & FORECAST, BY CELL SOURCE, 2019-2035
      1. (USD Billions)
      2. \r\n\r\n\r\nJapan CAR T Cell Therapy Market SIZE ESTIMATES
      3. & FORECAST, BY INDICATION, 2019-2035 (USD Billions)
      4. \r\n\r\n\r\nJapan
    47. CAR T Cell Therapy Market SIZE ESTIMATES & FORECAST, BY END USER, 2019-2035
      1. (USD Billions)
      2. \r\n\r\n\r\nJapan CAR T Cell Therapy Market SIZE ESTIMATES
      3. & FORECAST, BY REGIONAL, 2019-2035 (USD Billions)
      4. \r\n\r\n\r\nSouth
    48. Korea CAR T Cell Therapy Market SIZE ESTIMATES & FORECAST, BY THERAPEUTIC AREA,
      1. \r\n\r\n\r\nSouth Korea CAR T Cell Therapy
    49. Market SIZE ESTIMATES & FORECAST, BY CELL SOURCE, 2019-2035 (USD Billions)
      1. \r\n\r\n\r\nSouth
    50. Korea CAR T Cell Therapy Market SIZE ESTIMATES & FORECAST, BY INDICATION, 2019-2035
      1. (USD Billions)
      2. \r\n\r\n\r\nSouth Korea CAR T Cell Therapy Market
      3. SIZE ESTIMATES & FORECAST, BY END USER, 2019-2035 (USD Billions)
      4. \r\n\r\n\r\nSouth
    51. Korea CAR T Cell Therapy Market SIZE ESTIMATES & FORECAST, BY REGIONAL, 2019-2035
      1. (USD Billions)
      2. \r\n\r\n\r\nMalaysia CAR T Cell Therapy Market SIZE
      3. ESTIMATES & FORECAST, BY THERAPEUTIC AREA, 2019-2035 (USD Billions)
      4. \r\n\r\n\r\nMalaysia
    52. CAR T Cell Therapy Market SIZE ESTIMATES & FORECAST, BY CELL SOURCE, 2019-2035
      1. (USD Billions)
      2. \r\n\r\n\r\nMalaysia CAR T Cell Therapy Market SIZE
      3. ESTIMATES & FORECAST, BY INDICATION, 2019-2035 (USD Billions)
      4. \r\n\r\n\r\nMalaysia
    53. CAR T Cell Therapy Market SIZE ESTIMATES & FORECAST, BY END USER, 2019-2035
      1. (USD Billions)
      2. \r\n\r\n\r\nMalaysia CAR T Cell Therapy Market SIZE
      3. ESTIMATES & FORECAST, BY REGIONAL, 2019-2035 (USD Billions)
      4. \r\n\r\n\r\nThailand
    54. CAR T Cell Therapy Market SIZE ESTIMATES & FORECAST, BY THERAPEUTIC AREA, 2019-2035
      1. (USD Billions)
      2. \r\n\r\n\r\nThailand CAR T Cell Therapy Market SIZE
      3. ESTIMATES & FORECAST, BY CELL SOURCE, 2019-2035 (USD Billions)
      4. \r\n\r\n\r\nThailand
    55. CAR T Cell Therapy Market SIZE ESTIMATES & FORECAST, BY INDICATION, 2019-2035
      1. (USD Billions)
      2. \r\n\r\n\r\nThailand CAR T Cell Therapy Market SIZE
      3. ESTIMATES & FORECAST, BY END USER, 2019-2035 (USD Billions)
      4. \r\n\r\n\r\nThailand
    56. CAR T Cell Therapy Market SIZE ESTIMATES & FORECAST, BY REGIONAL, 2019-2035
      1. (USD Billions)
      2. \r\n\r\n\r\nIndonesia CAR T Cell Therapy Market SIZE
      3. ESTIMATES & FORECAST, BY THERAPEUTIC AREA, 2019-2035 (USD Billions)
      4. \r\n\r\n\r\nIndonesia
    57. CAR T Cell Therapy Market SIZE ESTIMATES & FORECAST, BY CELL SOURCE, 2019-2035
      1. (USD Billions)
      2. \r\n\r\n\r\nIndonesia CAR T Cell Therapy Market SIZE
      3. ESTIMATES & FORECAST, BY INDICATION, 2019-2035 (USD Billions)
      4. \r\n\r\n\r\nIndonesia
    58. CAR T Cell Therapy Market SIZE ESTIMATES & FORECAST, BY END USER, 2019-2035
      1. (USD Billions)
      2. \r\n\r\n\r\nIndonesia CAR T Cell Therapy Market SIZE
      3. ESTIMATES & FORECAST, BY REGIONAL, 2019-2035 (USD Billions)
      4. \r\n\r\n\r\nRest
    59. of APAC CAR T Cell Therapy Market SIZE ESTIMATES & FORECAST, BY THERAPEUTIC
      1. AREA, 2019-2035 (USD Billions)
      2. \r\n\r\n\r\nRest of APAC CAR T Cell
    60. Therapy Market SIZE ESTIMATES & FORECAST, BY CELL SOURCE, 2019-2035 (USD Billions)
      1. \r\n\r\n\r\nRest
    61. of APAC CAR T Cell Therapy Market SIZE ESTIMATES & FORECAST, BY INDICATION,
      1. \r\n\r\n\r\nRest of APAC CAR T Cell Therapy
    62. Market SIZE ESTIMATES & FORECAST, BY END USER, 2019-2035 (USD Billions)
      1. \r\n\r\n\r\nRest
    63. of APAC CAR T Cell Therapy Market SIZE ESTIMATES & FORECAST, BY REGIONAL, 2019-2035
      1. (USD Billions)
      2. \r\n\r\n\r\nSouth America CAR T Cell Therapy Market
      3. SIZE ESTIMATES & FORECAST, BY THERAPEUTIC AREA, 2019-2035 (USD Billions)
      4. \r\n\r\n\r\nSouth
    64. America CAR T Cell Therapy Market SIZE ESTIMATES & FORECAST, BY CELL SOURCE,
      1. \r\n\r\n\r\nSouth America CAR T Cell Therapy
    65. Market SIZE ESTIMATES & FORECAST, BY INDICATION, 2019-2035 (USD Billions)
      1. \r\n\r\n\r\nSouth
    66. America CAR T Cell Therapy Market SIZE ESTIMATES & FORECAST, BY END USER, 2019-2035
      1. (USD Billions)
      2. \r\n\r\n\r\nSouth America CAR T Cell Therapy Market
      3. SIZE ESTIMATES & FORECAST, BY REGIONAL, 2019-2035 (USD Billions)
      4. \r\n\r\n\r\nBrazil
    67. CAR T Cell Therapy Market SIZE ESTIMATES & FORECAST, BY THERAPEUTIC AREA, 2019-2035
      1. (USD Billions)
      2. \r\n\r\n\r\nBrazil CAR T Cell Therapy Market SIZE
      3. ESTIMATES & FORECAST, BY CELL SOURCE, 2019-2035 (USD Billions)
      4. \r\n\r\n\r\nBrazil
    68. CAR T Cell Therapy Market SIZE ESTIMATES & FORECAST, BY INDICATION, 2019-2035
      1. (USD Billions)
      2. \r\n\r\n\r\nBrazil CAR T Cell Therapy Market SIZE
      3. ESTIMATES & FORECAST, BY END USER, 2019-2035 (USD Billions)
      4. \r\n\r\n\r\nBrazil
    69. CAR T Cell Therapy Market SIZE ESTIMATES & FORECAST, BY REGIONAL, 2019-2035
      1. (USD Billions)
      2. \r\n\r\n\r\nMexico CAR T Cell Therapy Market SIZE
      3. ESTIMATES & FORECAST, BY THERAPEUTIC AREA, 2019-2035 (USD Billions)
      4. \r\n\r\n\r\nMexico
    70. CAR T Cell Therapy Market SIZE ESTIMATES & FORECAST, BY CELL SOURCE, 2019-2035
      1. (USD Billions)
      2. \r\n\r\n\r\nMexico CAR T Cell Therapy Market SIZE
      3. ESTIMATES & FORECAST, BY INDICATION, 2019-2035 (USD Billions)
      4. \r\n\r\n\r\nMexico
    71. CAR T Cell Therapy Market SIZE ESTIMATES & FORECAST, BY END USER, 2019-2035
      1. (USD Billions)
      2. \r\n\r\n\r\nMexico CAR T Cell Therapy Market SIZE
      3. ESTIMATES & FORECAST, BY REGIONAL, 2019-2035 (USD Billions)
      4. \r\n\r\n\r\nArgentina
    72. CAR T Cell Therapy Market SIZE ESTIMATES & FORECAST, BY THERAPEUTIC AREA, 2019-2035
      1. (USD Billions)
      2. \r\n\r\n\r\nArgentina CAR T Cell Therapy Market SIZE
      3. ESTIMATES & FORECAST, BY CELL SOURCE, 2019-2035 (USD Billions)
      4. \r\n\r\n\r\nArgentina
    73. CAR T Cell Therapy Market SIZE ESTIMATES & FORECAST, BY INDICATION, 2019-2035
      1. (USD Billions)
      2. \r\n\r\n\r\nArgentina CAR T Cell Therapy Market SIZE
      3. ESTIMATES & FORECAST, BY END USER, 2019-2035 (USD Billions)
      4. \r\n\r\n\r\nArgentina
    74. CAR T Cell Therapy Market SIZE ESTIMATES & FORECAST, BY REGIONAL, 2019-2035
      1. (USD Billions)
      2. \r\n\r\n\r\nRest of South America CAR T Cell Therapy
    75. Market SIZE ESTIMATES & FORECAST, BY THERAPEUTIC AREA, 2019-2035 (USD Billions)
      1. \r\n\r\n\r\nRest
    76. of South America CAR T Cell Therapy Market SIZE ESTIMATES & FORECAST, BY CELL
      1. SOURCE, 2019-2035 (USD Billions)
      2. \r\n\r\n\r\nRest of South America
    77. CAR T Cell Therapy Market SIZE ESTIMATES & FORECAST, BY INDICATION, 2019-2035
      1. (USD Billions)
      2. \r\n\r\n\r\nRest of South America CAR T Cell Therapy
    78. Market SIZE ESTIMATES & FORECAST, BY END USER, 2019-2035 (USD Billions)
      1. \r\n\r\n\r\nRest
    79. of South America CAR T Cell Therapy Market SIZE ESTIMATES & FORECAST, BY REGIONAL,
      1. \r\n\r\n\r\nMEA CAR T Cell Therapy Market
      2. SIZE ESTIMATES & FORECAST, BY THERAPEUTIC AREA, 2019-2035 (USD Billions)
      3. \r\n\r\n\r\nMEA
    80. CAR T Cell Therapy Market SIZE ESTIMATES & FORECAST, BY CELL SOURCE, 2019-2035
      1. (USD Billions)
      2. \r\n\r\n\r\nMEA CAR T Cell Therapy Market SIZE ESTIMATES
      3. & FORECAST, BY INDICATION, 2019-2035 (USD Billions)
      4. \r\n\r\n\r\nMEA
    81. CAR T Cell Therapy Market SIZE ESTIMATES & FORECAST, BY END USER, 2019-2035
      1. (USD Billions)
      2. \r\n\r\n\r\nMEA CAR T Cell Therapy Market SIZE ESTIMATES
      3. & FORECAST, BY REGIONAL, 2019-2035 (USD Billions)
      4. \r\n\r\n\r\nGCC
    82. Countries CAR T Cell Therapy Market SIZE ESTIMATES & FORECAST, BY THERAPEUTIC
      1. AREA, 2019-2035 (USD Billions)
      2. \r\n\r\n\r\nGCC Countries CAR T Cell
    83. Therapy Market SIZE ESTIMATES & FORECAST, BY CELL SOURCE, 2019-2035 (USD Billions)
      1. \r\n\r\n\r\nGCC
    84. Countries CAR T Cell Therapy Market SIZE ESTIMATES & FORECAST, BY INDICATION,
      1. \r\n\r\n\r\nGCC Countries CAR T Cell Therapy
    85. Market SIZE ESTIMATES & FORECAST, BY END USER, 2019-2035 (USD Billions)
      1. \r\n\r\n\r\nGCC
    86. Countries CAR T Cell Therapy Market SIZE ESTIMATES & FORECAST, BY REGIONAL,
      1. \r\n\r\n\r\nSouth Africa CAR T Cell Therapy
    87. Market SIZE ESTIMATES & FORECAST, BY THERAPEUTIC AREA, 2019-2035 (USD Billions)
      1. \r\n\r\n\r\nSouth
    88. Africa CAR T Cell Therapy Market SIZE ESTIMATES & FORECAST, BY CELL SOURCE,
      1. \r\n\r\n\r\nSouth Africa CAR T Cell Therapy
    89. Market SIZE ESTIMATES & FORECAST, BY INDICATION, 2019-2035 (USD Billions)
      1. \r\n\r\n\r\nSouth
    90. Africa CAR T Cell Therapy Market SIZE ESTIMATES & FORECAST, BY END USER, 2019-2035
      1. (USD Billions)
      2. \r\n\r\n\r\nSouth Africa CAR T Cell Therapy Market
      3. SIZE ESTIMATES & FORECAST, BY REGIONAL, 2019-2035 (USD Billions)
      4. \r\n\r\n\r\nRest
    91. of MEA CAR T Cell Therapy Market SIZE ESTIMATES & FORECAST, BY THERAPEUTIC AREA,
      1. \r\n\r\n\r\nRest of MEA CAR T Cell Therapy
    92. Market SIZE ESTIMATES & FORECAST, BY CELL SOURCE, 2019-2035 (USD Billions)
      1. \r\n\r\n\r\nRest
    93. of MEA CAR T Cell Therapy Market SIZE ESTIMATES & FORECAST, BY INDICATION, 2019-2035
      1. (USD Billions)
      2. \r\n\r\n\r\nRest of MEA CAR T Cell Therapy Market
      3. SIZE ESTIMATES & FORECAST, BY END USER, 2019-2035 (USD Billions)
      4. \r\n\r\n\r\nRest
    94. of MEA CAR T Cell Therapy Market SIZE ESTIMATES & FORECAST, BY REGIONAL, 2019-2035
      1. (USD Billions)
      2. \r\n\r\n\r\nPRODUCT LAUNCH/PRODUCT DEVELOPMENT/APPROVAL
      3. \r\n\r\n\r\nACQUISITION/PARTNERSHIP
      4. \r\n\r\n\r\n
      5. \r\n
      6. \r\n
      7. \r\n
      8. \r\n
      9. \r\n
      10. \r\n
      11. \r\n
      12. \r\n
      13. \r\n
      14. \r\n
      15. \r\n
      16. \r\n
      17. \r\n
      18. \r\n
      19. \r\n
      20. \r\n
      21. \r\n
      22. \r\n
      23. \r\n
      24. \r\n
      25. \r\n
      26. \r\n
      27. \r\n
      28. \r\n
      29. \r\n
      30. \r\n
      31. \r\n
      32. \r\n
      33. \r\nLIST
      34. Of figures
      35. \r\n
      36. \r\n\r\n\r\nMARKET SYNOPSIS
      37. \r\n\r\n\r\nNORTH
    95. AMERICA CAR T CELL THERAPY MARKET ANALYSIS
      1. \r\n\r\n\r\nUS CAR T CELL
      2. THERAPY MARKET ANALYSIS BY THERAPEUTIC AREA
      3. \r\n\r\n\r\nUS CAR T
      4. CELL THERAPY MARKET ANALYSIS BY CELL SOURCE
      5. \r\n\r\n\r\nUS CAR T
      6. CELL THERAPY MARKET ANALYSIS BY INDICATION
      7. \r\n\r\n\r\nUS CAR T CELL
      8. THERAPY MARKET ANALYSIS BY END USER
      9. \r\n\r\n\r\nUS CAR T CELL THERAPY
      10. MARKET ANALYSIS BY REGIONAL
      11. \r\n\r\n\r\nCANADA CAR T CELL THERAPY
      12. MARKET ANALYSIS BY THERAPEUTIC AREA
      13. \r\n\r\n\r\nCANADA CAR T CELL
      14. THERAPY MARKET ANALYSIS BY CELL SOURCE
      15. \r\n\r\n\r\nCANADA CAR T CELL
      16. THERAPY MARKET ANALYSIS BY INDICATION
      17. \r\n\r\n\r\nCANADA CAR T CELL
      18. THERAPY MARKET ANALYSIS BY END USER
      19. \r\n\r\n\r\nCANADA CAR T CELL
      20. THERAPY MARKET ANALYSIS BY REGIONAL
      21. \r\n\r\n\r\nEUROPE CAR T CELL
    96. THERAPY MARKET ANALYSIS
      1. \r\n\r\n\r\nGERMANY CAR T CELL THERAPY MARKET
      2. ANALYSIS BY THERAPEUTIC AREA
      3. \r\n\r\n\r\nGERMANY CAR T CELL THERAPY
      4. MARKET ANALYSIS BY CELL SOURCE
      5. \r\n\r\n\r\nGERMANY CAR T CELL THERAPY
      6. MARKET ANALYSIS BY INDICATION
      7. \r\n\r\n\r\nGERMANY CAR T CELL THERAPY
      8. MARKET ANALYSIS BY END USER
      9. \r\n\r\n\r\nGERMANY CAR T CELL THERAPY
      10. MARKET ANALYSIS BY REGIONAL
      11. \r\n\r\n\r\nUK CAR T CELL THERAPY MARKET
      12. ANALYSIS BY THERAPEUTIC AREA
      13. \r\n\r\n\r\nUK CAR T CELL THERAPY MARKET
      14. ANALYSIS BY CELL SOURCE
      15. \r\n\r\n\r\nUK CAR T CELL THERAPY MARKET
      16. ANALYSIS BY INDICATION
      17. \r\n\r\n\r\nUK CAR T CELL THERAPY MARKET ANALYSIS
      18. BY END USER
      19. \r\n\r\n\r\nUK CAR T CELL THERAPY MARKET ANALYSIS BY
      20. REGIONAL
      21. \r\n\r\n\r\nFRANCE CAR T CELL THERAPY MARKET ANALYSIS BY
      22. THERAPEUTIC AREA
      23. \r\n\r\n\r\nFRANCE CAR T CELL THERAPY MARKET ANALYSIS
      24. BY CELL SOURCE
      25. \r\n\r\n\r\nFRANCE CAR T CELL THERAPY MARKET ANALYSIS
      26. BY INDICATION
      27. \r\n\r\n\r\nFRANCE CAR T CELL THERAPY MARKET ANALYSIS
      28. BY END USER
      29. \r\n\r\n\r\nFRANCE CAR T CELL THERAPY MARKET ANALYSIS
      30. BY REGIONAL
      31. \r\n\r\n\r\nRUSSIA CAR T CELL THERAPY MARKET ANALYSIS
      32. BY THERAPEUTIC AREA
      33. \r\n\r\n\r\nRUSSIA CAR T CELL THERAPY MARKET
      34. ANALYSIS BY CELL SOURCE
      35. \r\n\r\n\r\nRUSSIA CAR T CELL THERAPY MARKET
      36. ANALYSIS BY INDICATION
      37. \r\n\r\n\r\nRUSSIA CAR T CELL THERAPY MARKET
      38. ANALYSIS BY END USER
      39. \r\n\r\n\r\nRUSSIA CAR T CELL THERAPY MARKET
      40. ANALYSIS BY REGIONAL
      41. \r\n\r\n\r\nITALY CAR T CELL THERAPY MARKET
      42. ANALYSIS BY THERAPEUTIC AREA
      43. \r\n\r\n\r\nITALY CAR T CELL THERAPY
      44. MARKET ANALYSIS BY CELL SOURCE
      45. \r\n\r\n\r\nITALY CAR T CELL THERAPY
      46. MARKET ANALYSIS BY INDICATION
      47. \r\n\r\n\r\nITALY CAR T CELL THERAPY
      48. MARKET ANALYSIS BY END USER
      49. \r\n\r\n\r\nITALY CAR T CELL THERAPY
      50. MARKET ANALYSIS BY REGIONAL
      51. \r\n\r\n\r\nSPAIN CAR T CELL THERAPY
      52. MARKET ANALYSIS BY THERAPEUTIC AREA
      53. \r\n\r\n\r\nSPAIN CAR T CELL
      54. THERAPY MARKET ANALYSIS BY CELL SOURCE
      55. \r\n\r\n\r\nSPAIN CAR T CELL
      56. THERAPY MARKET ANALYSIS BY INDICATION
      57. \r\n\r\n\r\nSPAIN CAR T CELL
      58. THERAPY MARKET ANALYSIS BY END USER
      59. \r\n\r\n\r\nSPAIN CAR T CELL
      60. THERAPY MARKET ANALYSIS BY REGIONAL
      61. \r\n\r\n\r\nREST OF EUROPE CAR
      62. T CELL THERAPY MARKET ANALYSIS BY THERAPEUTIC AREA
      63. \r\n\r\n\r\nREST
      64. OF EUROPE CAR T CELL THERAPY MARKET ANALYSIS BY CELL SOURCE
      65. \r\n\r\n\r\nREST
      66. OF EUROPE CAR T CELL THERAPY MARKET ANALYSIS BY INDICATION
      67. \r\n\r\n\r\nREST
      68. OF EUROPE CAR T CELL THERAPY MARKET ANALYSIS BY END USER
      69. \r\n\r\n\r\nREST
      70. OF EUROPE CAR T CELL THERAPY MARKET ANALYSIS BY REGIONAL
      71. \r\n\r\n\r\nAPAC
    97. CAR T CELL THERAPY MARKET ANALYSIS
      1. \r\n\r\n\r\nCHINA CAR T CELL THERAPY
      2. MARKET ANALYSIS BY THERAPEUTIC AREA
      3. \r\n\r\n\r\nCHINA CAR T CELL
      4. THERAPY MARKET ANALYSIS BY CELL SOURCE
      5. \r\n\r\n\r\nCHINA CAR T CELL
      6. THERAPY MARKET ANALYSIS BY INDICATION
      7. \r\n\r\n\r\nCHINA CAR T CELL
      8. THERAPY MARKET ANALYSIS BY END USER
      9. \r\n\r\n\r\nCHINA CAR T CELL
      10. THERAPY MARKET ANALYSIS BY REGIONAL
      11. \r\n\r\n\r\nINDIA CAR T CELL
      12. THERAPY MARKET ANALYSIS BY THERAPEUTIC AREA
      13. \r\n\r\n\r\nINDIA CAR
      14. T CELL THERAPY MARKET ANALYSIS BY CELL SOURCE
      15. \r\n\r\n\r\nINDIA CAR
      16. T CELL THERAPY MARKET ANALYSIS BY INDICATION
      17. \r\n\r\n\r\nINDIA CAR
      18. T CELL THERAPY MARKET ANALYSIS BY END USER
      19. \r\n\r\n\r\nINDIA CAR
      20. T CELL THERAPY MARKET ANALYSIS BY REGIONAL
      21. \r\n\r\n\r\nJAPAN CAR
      22. T CELL THERAPY MARKET ANALYSIS BY THERAPEUTIC AREA
      23. \r\n\r\n\r\nJAPAN
      24. CAR T CELL THERAPY MARKET ANALYSIS BY CELL SOURCE
      25. \r\n\r\n\r\nJAPAN
      26. CAR T CELL THERAPY MARKET ANALYSIS BY INDICATION
      27. \r\n\r\n\r\nJAPAN
      28. CAR T CELL THERAPY MARKET ANALYSIS BY END USER
      29. \r\n\r\n\r\nJAPAN
      30. CAR T CELL THERAPY MARKET ANALYSIS BY REGIONAL
      31. \r\n\r\n\r\nSOUTH
      32. KOREA CAR T CELL THERAPY MARKET ANALYSIS BY THERAPEUTIC AREA
      33. \r\n\r\n\r\nSOUTH
      34. KOREA CAR T CELL THERAPY MARKET ANALYSIS BY CELL SOURCE
      35. \r\n\r\n\r\nSOUTH
      36. KOREA CAR T CELL THERAPY MARKET ANALYSIS BY INDICATION
      37. \r\n\r\n\r\nSOUTH
      38. KOREA CAR T CELL THERAPY MARKET ANALYSIS BY END USER
      39. \r\n\r\n\r\nSOUTH
      40. KOREA CAR T CELL THERAPY MARKET ANALYSIS BY REGIONAL
      41. \r\n\r\n\r\nMALAYSIA
      42. CAR T CELL THERAPY MARKET ANALYSIS BY THERAPEUTIC AREA
      43. \r\n\r\n\r\nMALAYSIA
      44. CAR T CELL THERAPY MARKET ANALYSIS BY CELL SOURCE
      45. \r\n\r\n\r\nMALAYSIA
      46. CAR T CELL THERAPY MARKET ANALYSIS BY INDICATION
      47. \r\n\r\n\r\nMALAYSIA
      48. CAR T CELL THERAPY MARKET ANALYSIS BY END USER
      49. \r\n\r\n\r\nMALAYSIA
      50. CAR T CELL THERAPY MARKET ANALYSIS BY REGIONAL
      51. \r\n\r\n\r\nTHAILAND
      52. CAR T CELL THERAPY MARKET ANALYSIS BY THERAPEUTIC AREA
      53. \r\n\r\n\r\nTHAILAND
      54. CAR T CELL THERAPY MARKET ANALYSIS BY CELL SOURCE
      55. \r\n\r\n\r\nTHAILAND
      56. CAR T CELL THERAPY MARKET ANALYSIS BY INDICATION
      57. \r\n\r\n\r\nTHAILAND
      58. CAR T CELL THERAPY MARKET ANALYSIS BY END USER
      59. \r\n\r\n\r\nTHAILAND
      60. CAR T CELL THERAPY MARKET ANALYSIS BY REGIONAL
      61. \r\n\r\n\r\nINDONESIA
      62. CAR T CELL THERAPY MARKET ANALYSIS BY THERAPEUTIC AREA
      63. \r\n\r\n\r\nINDONESIA
      64. CAR T CELL THERAPY MARKET ANALYSIS BY CELL SOURCE
      65. \r\n\r\n\r\nINDONESIA
      66. CAR T CELL THERAPY MARKET ANALYSIS BY INDICATION
      67. \r\n\r\n\r\nINDONESIA
      68. CAR T CELL THERAPY MARKET ANALYSIS BY END USER
      69. \r\n\r\n\r\nINDONESIA
      70. CAR T CELL THERAPY MARKET ANALYSIS BY REGIONAL
      71. \r\n\r\n\r\nREST OF
      72. APAC CAR T CELL THERAPY MARKET ANALYSIS BY THERAPEUTIC AREA
      73. \r\n\r\n\r\nREST
      74. OF APAC CAR T CELL THERAPY MARKET ANALYSIS BY CELL SOURCE
      75. \r\n\r\n\r\nREST
      76. OF APAC CAR T CELL THERAPY MARKET ANALYSIS BY INDICATION
      77. \r\n\r\n\r\nREST
      78. OF APAC CAR T CELL THERAPY MARKET ANALYSIS BY END USER
      79. \r\n\r\n\r\nREST
      80. OF APAC CAR T CELL THERAPY MARKET ANALYSIS BY REGIONAL
      81. \r\n\r\n\r\nSOUTH
    98. AMERICA CAR T CELL THERAPY MARKET ANALYSIS
      1. \r\n\r\n\r\nBRAZIL CAR
      2. T CELL THERAPY MARKET ANALYSIS BY THERAPEUTIC AREA
      3. \r\n\r\n\r\nBRAZIL
      4. CAR T CELL THERAPY MARKET ANALYSIS BY CELL SOURCE
      5. \r\n\r\n\r\nBRAZIL
      6. CAR T CELL THERAPY MARKET ANALYSIS BY INDICATION
      7. \r\n\r\n\r\nBRAZIL
      8. CAR T CELL THERAPY MARKET ANALYSIS BY END USER
      9. \r\n\r\n\r\nBRAZIL
      10. CAR T CELL THERAPY MARKET ANALYSIS BY REGIONAL
      11. \r\n\r\n\r\nMEXICO
      12. CAR T CELL THERAPY MARKET ANALYSIS BY THERAPEUTIC AREA
      13. \r\n\r\n\r\nMEXICO
      14. CAR T CELL THERAPY MARKET ANALYSIS BY CELL SOURCE
      15. \r\n\r\n\r\nMEXICO
      16. CAR T CELL THERAPY MARKET ANALYSIS BY INDICATION
      17. \r\n\r\n\r\nMEXICO
      18. CAR T CELL THERAPY MARKET ANALYSIS BY END USER
      19. \r\n\r\n\r\nMEXICO
      20. CAR T CELL THERAPY MARKET ANALYSIS BY REGIONAL
      21. \r\n\r\n\r\nARGENTINA
      22. CAR T CELL THERAPY MARKET ANALYSIS BY THERAPEUTIC AREA
      23. \r\n\r\n\r\nARGENTINA
      24. CAR T CELL THERAPY MARKET ANALYSIS BY CELL SOURCE
      25. \r\n\r\n\r\nARGENTINA
      26. CAR T CELL THERAPY MARKET ANALYSIS BY INDICATION
      27. \r\n\r\n\r\nARGENTINA
      28. CAR T CELL THERAPY MARKET ANALYSIS BY END USER
      29. \r\n\r\n\r\nARGENTINA
      30. CAR T CELL THERAPY MARKET ANALYSIS BY REGIONAL
      31. \r\n\r\n\r\nREST OF
      32. SOUTH AMERICA CAR T CELL THERAPY MARKET ANALYSIS BY THERAPEUTIC AREA
      33. \r\n\r\n\r\nREST
      34. OF SOUTH AMERICA CAR T CELL THERAPY MARKET ANALYSIS BY CELL SOURCE
      35. \r\n\r\n\r\nREST
      36. OF SOUTH AMERICA CAR T CELL THERAPY MARKET ANALYSIS BY INDICATION
      37. \r\n\r\n\r\nREST
      38. OF SOUTH AMERICA CAR T CELL THERAPY MARKET ANALYSIS BY END USER
      39. \r\n\r\n\r\nREST
      40. OF SOUTH AMERICA CAR T CELL THERAPY MARKET ANALYSIS BY REGIONAL
      41. \r\n\r\n\r\nMEA
    99. CAR T CELL THERAPY MARKET ANALYSIS
      1. \r\n\r\n\r\nGCC COUNTRIES CAR
      2. T CELL THERAPY MARKET ANALYSIS BY THERAPEUTIC AREA
      3. \r\n\r\n\r\nGCC
      4. COUNTRIES CAR T CELL THERAPY MARKET ANALYSIS BY CELL SOURCE
      5. \r\n\r\n\r\nGCC
      6. COUNTRIES CAR T CELL THERAPY MARKET ANALYSIS BY INDICATION
      7. \r\n\r\n\r\nGCC
      8. COUNTRIES CAR T CELL THERAPY MARKET ANALYSIS BY END USER
      9. \r\n\r\n\r\nGCC
      10. COUNTRIES CAR T CELL THERAPY MARKET ANALYSIS BY REGIONAL
      11. \r\n\r\n\r\nSOUTH
      12. AFRICA CAR T CELL THERAPY MARKET ANALYSIS BY THERAPEUTIC AREA
      13. \r\n\r\n\r\nSOUTH
      14. AFRICA CAR T CELL THERAPY MARKET ANALYSIS BY CELL SOURCE
      15. \r\n\r\n\r\nSOUTH
      16. AFRICA CAR T CELL THERAPY MARKET ANALYSIS BY INDICATION
      17. \r\n\r\n\r\nSOUTH
      18. AFRICA CAR T CELL THERAPY MARKET ANALYSIS BY END USER
      19. \r\n\r\n\r\nSOUTH
      20. AFRICA CAR T CELL THERAPY MARKET ANALYSIS BY REGIONAL
      21. \r\n\r\n\r\nREST
      22. OF MEA CAR T CELL THERAPY MARKET ANALYSIS BY THERAPEUTIC AREA
      23. \r\n\r\n\r\nREST
      24. OF MEA CAR T CELL THERAPY MARKET ANALYSIS BY CELL SOURCE
      25. \r\n\r\n\r\nREST
      26. OF MEA CAR T CELL THERAPY MARKET ANALYSIS BY INDICATION
      27. \r\n\r\n\r\nREST
      28. OF MEA CAR T CELL THERAPY MARKET ANALYSIS BY END USER
      29. \r\n\r\n\r\nREST
      30. OF MEA CAR T CELL THERAPY MARKET ANALYSIS BY REGIONAL
      31. \r\n\r\n\r\nKEY
    100. BUYING CRITERIA OF CAR T CELL THERAPY MARKET
      1. \r\n\r\n\r\nRESEARCH
      2. PROCESS OF MRFR
      3. \r\n\r\n\r\nDRO ANALYSIS OF CAR T CELL THERAPY MARKET
      4. \r\n\r\n\r\nDRIVERS
      5. IMPACT ANALYSIS: CAR T CELL THERAPY MARKET
      6. \r\n\r\n\r\nRESTRAINTS
      7. IMPACT ANALYSIS: CAR T CELL THERAPY MARKET
      8. \r\n\r\n\r\nSUPPLY / VALUE
      9. CHAIN: CAR T CELL THERAPY MARKET
      10. \r\n\r\n\r\nCAR T CELL THERAPY MARKET,
      11. BY THERAPEUTIC AREA, 2025 (% SHARE)
      12. \r\n\r\n\r\nCAR T CELL THERAPY
    101. MARKET, BY THERAPEUTIC AREA, 2019 TO 2035 (USD Billions)
      1. \r\n\r\n\r\nCAR
    102. T CELL THERAPY MARKET, BY CELL SOURCE, 2025 (% SHARE)
      1. \r\n\r\n\r\nCAR
    103. T CELL THERAPY MARKET, BY CELL SOURCE, 2019 TO 2035 (USD Billions)
      1. \r\n\r\n\r\nCAR
    104. T CELL THERAPY MARKET, BY INDICATION, 2025 (% SHARE)
      1. \r\n\r\n\r\nCAR
    105. T CELL THERAPY MARKET, BY INDICATION, 2019 TO 2035 (USD Billions)
      1. \r\n\r\n\r\nCAR
    106. T CELL THERAPY MARKET, BY END USER, 2025 (% SHARE)
      1. \r\n\r\n\r\nCAR
    107. T CELL THERAPY MARKET, BY END USER, 2019 TO 2035 (USD Billions)
      1. \r\n\r\n\r\nCAR
    108. T CELL THERAPY MARKET, BY REGIONAL, 2025 (% SHARE)
      1. \r\n\r\n\r\nCAR
    109. T CELL THERAPY MARKET, BY REGIONAL, 2019 TO 2035 (USD Billions)
      1. \r\n\r\n\r\nBENCHMARKING
      2. OF MAJOR COMPETITORS
      3. \r\n\r\n\r\n

    CAR T Cell Therapy Market Segmentation

    • CAR T Cell Therapy Market By Therapeutic Area (USD Billion, 2019-2035)

      • Oncology
      • Autoimmune Diseases
      • Infectious Diseases
    • CAR T Cell Therapy Market By Cell Source (USD Billion, 2019-2035)

      • Autologous
      • Allogeneic
      • Gene-Edited
    • CAR T Cell Therapy Market By Indication (USD Billion, 2019-2035)

      • Acute Lymphoblastic Leukemia
      • Non-Hodgkin Lymphoma
      • Multiple Myeloma
    • CAR T Cell Therapy Market By End User (USD Billion, 2019-2035)

      • Hospitals
      • Research Institutes
      • Cancer Treatment Centers
    • CAR T Cell Therapy Market By Regional (USD Billion, 2019-2035)

      • North America
      • Europe
      • South America
      • Asia Pacific
      • Middle East and Africa

    CAR T Cell Therapy Market Regional Outlook (USD Billion, 2019-2035)

    • North America Outlook (USD Billion, 2019-2035)

      • North America CAR T Cell Therapy Market by Therapeutic Area Type

        • Oncology
        • Autoimmune Diseases
        • Infectious Diseases
      • North America CAR T Cell Therapy Market by Cell Source Type

        • Autologous
        • Allogeneic
        • Gene-Edited
      • North America CAR T Cell Therapy Market by Indication Type

        • Acute Lymphoblastic Leukemia
        • Non-Hodgkin Lymphoma
        • Multiple Myeloma
      • North America CAR T Cell Therapy Market by End User Type

        • Hospitals
        • Research Institutes
        • Cancer Treatment Centers
      • North America CAR T Cell Therapy Market by Regional Type

        • US
        • Canada
      • US Outlook (USD Billion, 2019-2035)
      • US CAR T Cell Therapy Market by Therapeutic Area Type

        • Oncology
        • Autoimmune Diseases
        • Infectious Diseases
      • US CAR T Cell Therapy Market by Cell Source Type

        • Autologous
        • Allogeneic
        • Gene-Edited
      • US CAR T Cell Therapy Market by Indication Type

        • Acute Lymphoblastic Leukemia
        • Non-Hodgkin Lymphoma
        • Multiple Myeloma
      • US CAR T Cell Therapy Market by End User Type

        • Hospitals
        • Research Institutes
        • Cancer Treatment Centers
      • CANADA Outlook (USD Billion, 2019-2035)
      • CANADA CAR T Cell Therapy Market by Therapeutic Area Type

        • Oncology
        • Autoimmune Diseases
        • Infectious Diseases
      • CANADA CAR T Cell Therapy Market by Cell Source Type

        • Autologous
        • Allogeneic
        • Gene-Edited
      • CANADA CAR T Cell Therapy Market by Indication Type

        • Acute Lymphoblastic Leukemia
        • Non-Hodgkin Lymphoma
        • Multiple Myeloma
      • CANADA CAR T Cell Therapy Market by End User Type

        • Hospitals
        • Research Institutes
        • Cancer Treatment Centers
    • Europe Outlook (USD Billion, 2019-2035)

      • Europe CAR T Cell Therapy Market by Therapeutic Area Type

        • Oncology
        • Autoimmune Diseases
        • Infectious Diseases
      • Europe CAR T Cell Therapy Market by Cell Source Type

        • Autologous
        • Allogeneic
        • Gene-Edited
      • Europe CAR T Cell Therapy Market by Indication Type

        • Acute Lymphoblastic Leukemia
        • Non-Hodgkin Lymphoma
        • Multiple Myeloma
      • Europe CAR T Cell Therapy Market by End User Type

        • Hospitals
        • Research Institutes
        • Cancer Treatment Centers
      • Europe CAR T Cell Therapy Market by Regional Type

        • Germany
        • UK
        • France
        • Russia
        • Italy
        • Spain
        • Rest of Europe
      • GERMANY Outlook (USD Billion, 2019-2035)
      • GERMANY CAR T Cell Therapy Market by Therapeutic Area Type

        • Oncology
        • Autoimmune Diseases
        • Infectious Diseases
      • GERMANY CAR T Cell Therapy Market by Cell Source Type

        • Autologous
        • Allogeneic
        • Gene-Edited
      • GERMANY CAR T Cell Therapy Market by Indication Type

        • Acute Lymphoblastic Leukemia
        • Non-Hodgkin Lymphoma
        • Multiple Myeloma
      • GERMANY CAR T Cell Therapy Market by End User Type

        • Hospitals
        • Research Institutes
        • Cancer Treatment Centers
      • UK Outlook (USD Billion, 2019-2035)
      • UK CAR T Cell Therapy Market by Therapeutic Area Type

        • Oncology
        • Autoimmune Diseases
        • Infectious Diseases
      • UK CAR T Cell Therapy Market by Cell Source Type

        • Autologous
        • Allogeneic
        • Gene-Edited
      • UK CAR T Cell Therapy Market by Indication Type

        • Acute Lymphoblastic Leukemia
        • Non-Hodgkin Lymphoma
        • Multiple Myeloma
      • UK CAR T Cell Therapy Market by End User Type

        • Hospitals
        • Research Institutes
        • Cancer Treatment Centers
      • FRANCE Outlook (USD Billion, 2019-2035)
      • FRANCE CAR T Cell Therapy Market by Therapeutic Area Type

        • Oncology
        • Autoimmune Diseases
        • Infectious Diseases
      • FRANCE CAR T Cell Therapy Market by Cell Source Type

        • Autologous
        • Allogeneic
        • Gene-Edited
      • FRANCE CAR T Cell Therapy Market by Indication Type

        • Acute Lymphoblastic Leukemia
        • Non-Hodgkin Lymphoma
        • Multiple Myeloma
      • FRANCE CAR T Cell Therapy Market by End User Type

        • Hospitals
        • Research Institutes
        • Cancer Treatment Centers
      • RUSSIA Outlook (USD Billion, 2019-2035)
      • RUSSIA CAR T Cell Therapy Market by Therapeutic Area Type

        • Oncology
        • Autoimmune Diseases
        • Infectious Diseases
      • RUSSIA CAR T Cell Therapy Market by Cell Source Type

        • Autologous
        • Allogeneic
        • Gene-Edited
      • RUSSIA CAR T Cell Therapy Market by Indication Type

        • Acute Lymphoblastic Leukemia
        • Non-Hodgkin Lymphoma
        • Multiple Myeloma
      • RUSSIA CAR T Cell Therapy Market by End User Type

        • Hospitals
        • Research Institutes
        • Cancer Treatment Centers
      • ITALY Outlook (USD Billion, 2019-2035)
      • ITALY CAR T Cell Therapy Market by Therapeutic Area Type

        • Oncology
        • Autoimmune Diseases
        • Infectious Diseases
      • ITALY CAR T Cell Therapy Market by Cell Source Type

        • Autologous
        • Allogeneic
        • Gene-Edited
      • ITALY CAR T Cell Therapy Market by Indication Type

        • Acute Lymphoblastic Leukemia
        • Non-Hodgkin Lymphoma
        • Multiple Myeloma
      • ITALY CAR T Cell Therapy Market by End User Type

        • Hospitals
        • Research Institutes
        • Cancer Treatment Centers
      • SPAIN Outlook (USD Billion, 2019-2035)
      • SPAIN CAR T Cell Therapy Market by Therapeutic Area Type

        • Oncology
        • Autoimmune Diseases
        • Infectious Diseases
      • SPAIN CAR T Cell Therapy Market by Cell Source Type

        • Autologous
        • Allogeneic
        • Gene-Edited
      • SPAIN CAR T Cell Therapy Market by Indication Type

        • Acute Lymphoblastic Leukemia
        • Non-Hodgkin Lymphoma
        • Multiple Myeloma
      • SPAIN CAR T Cell Therapy Market by End User Type

        • Hospitals
        • Research Institutes
        • Cancer Treatment Centers
      • REST OF EUROPE Outlook (USD Billion, 2019-2035)
      • REST OF EUROPE CAR T Cell Therapy Market by Therapeutic Area Type

        • Oncology
        • Autoimmune Diseases
        • Infectious Diseases
      • REST OF EUROPE CAR T Cell Therapy Market by Cell Source Type

        • Autologous
        • Allogeneic
        • Gene-Edited
      • REST OF EUROPE CAR T Cell Therapy Market by Indication Type

        • Acute Lymphoblastic Leukemia
        • Non-Hodgkin Lymphoma
        • Multiple Myeloma
      • REST OF EUROPE CAR T Cell Therapy Market by End User Type

        • Hospitals
        • Research Institutes
        • Cancer Treatment Centers
    • APAC Outlook (USD Billion, 2019-2035)

      • APAC CAR T Cell Therapy Market by Therapeutic Area Type

        • Oncology
        • Autoimmune Diseases
        • Infectious Diseases
      • APAC CAR T Cell Therapy Market by Cell Source Type

        • Autologous
        • Allogeneic
        • Gene-Edited
      • APAC CAR T Cell Therapy Market by Indication Type

        • Acute Lymphoblastic Leukemia
        • Non-Hodgkin Lymphoma
        • Multiple Myeloma
      • APAC CAR T Cell Therapy Market by End User Type

        • Hospitals
        • Research Institutes
        • Cancer Treatment Centers
      • APAC CAR T Cell Therapy Market by Regional Type

        • China
        • India
        • Japan
        • South Korea
        • Malaysia
        • Thailand
        • Indonesia
        • Rest of APAC
      • CHINA Outlook (USD Billion, 2019-2035)
      • CHINA CAR T Cell Therapy Market by Therapeutic Area Type

        • Oncology
        • Autoimmune Diseases
        • Infectious Diseases
      • CHINA CAR T Cell Therapy Market by Cell Source Type

        • Autologous
        • Allogeneic
        • Gene-Edited
      • CHINA CAR T Cell Therapy Market by Indication Type

        • Acute Lymphoblastic Leukemia
        • Non-Hodgkin Lymphoma
        • Multiple Myeloma
      • CHINA CAR T Cell Therapy Market by End User Type

        • Hospitals
        • Research Institutes
        • Cancer Treatment Centers
      • INDIA Outlook (USD Billion, 2019-2035)
      • INDIA CAR T Cell Therapy Market by Therapeutic Area Type

        • Oncology
        • Autoimmune Diseases
        • Infectious Diseases
      • INDIA CAR T Cell Therapy Market by Cell Source Type

        • Autologous
        • Allogeneic
        • Gene-Edited
      • INDIA CAR T Cell Therapy Market by Indication Type

        • Acute Lymphoblastic Leukemia
        • Non-Hodgkin Lymphoma
        • Multiple Myeloma
      • INDIA CAR T Cell Therapy Market by End User Type

        • Hospitals
        • Research Institutes
        • Cancer Treatment Centers
      • JAPAN Outlook (USD Billion, 2019-2035)
      • JAPAN CAR T Cell Therapy Market by Therapeutic Area Type

        • Oncology
        • Autoimmune Diseases
        • Infectious Diseases
      • JAPAN CAR T Cell Therapy Market by Cell Source Type

        • Autologous
        • Allogeneic
        • Gene-Edited
      • JAPAN CAR T Cell Therapy Market by Indication Type

        • Acute Lymphoblastic Leukemia
        • Non-Hodgkin Lymphoma
        • Multiple Myeloma
      • JAPAN CAR T Cell Therapy Market by End User Type

        • Hospitals
        • Research Institutes
        • Cancer Treatment Centers
      • SOUTH KOREA Outlook (USD Billion, 2019-2035)
      • SOUTH KOREA CAR T Cell Therapy Market by Therapeutic Area Type

        • Oncology
        • Autoimmune Diseases
        • Infectious Diseases
      • SOUTH KOREA CAR T Cell Therapy Market by Cell Source Type

        • Autologous
        • Allogeneic
        • Gene-Edited
      • SOUTH KOREA CAR T Cell Therapy Market by Indication Type

        • Acute Lymphoblastic Leukemia
        • Non-Hodgkin Lymphoma
        • Multiple Myeloma
      • SOUTH KOREA CAR T Cell Therapy Market by End User Type

        • Hospitals
        • Research Institutes
        • Cancer Treatment Centers
      • MALAYSIA Outlook (USD Billion, 2019-2035)
      • MALAYSIA CAR T Cell Therapy Market by Therapeutic Area Type

        • Oncology
        • Autoimmune Diseases
        • Infectious Diseases
      • MALAYSIA CAR T Cell Therapy Market by Cell Source Type

        • Autologous
        • Allogeneic
        • Gene-Edited
      • MALAYSIA CAR T Cell Therapy Market by Indication Type

        • Acute Lymphoblastic Leukemia
        • Non-Hodgkin Lymphoma
        • Multiple Myeloma
      • MALAYSIA CAR T Cell Therapy Market by End User Type

        • Hospitals
        • Research Institutes
        • Cancer Treatment Centers
      • THAILAND Outlook (USD Billion, 2019-2035)
      • THAILAND CAR T Cell Therapy Market by Therapeutic Area Type

        • Oncology
        • Autoimmune Diseases
        • Infectious Diseases
      • THAILAND CAR T Cell Therapy Market by Cell Source Type

        • Autologous
        • Allogeneic
        • Gene-Edited
      • THAILAND CAR T Cell Therapy Market by Indication Type

        • Acute Lymphoblastic Leukemia
        • Non-Hodgkin Lymphoma
        • Multiple Myeloma
      • THAILAND CAR T Cell Therapy Market by End User Type

        • Hospitals
        • Research Institutes
        • Cancer Treatment Centers
      • INDONESIA Outlook (USD Billion, 2019-2035)
      • INDONESIA CAR T Cell Therapy Market by Therapeutic Area Type

        • Oncology
        • Autoimmune Diseases
        • Infectious Diseases
      • INDONESIA CAR T Cell Therapy Market by Cell Source Type

        • Autologous
        • Allogeneic
        • Gene-Edited
      • INDONESIA CAR T Cell Therapy Market by Indication Type

        • Acute Lymphoblastic Leukemia
        • Non-Hodgkin Lymphoma
        • Multiple Myeloma
      • INDONESIA CAR T Cell Therapy Market by End User Type

        • Hospitals
        • Research Institutes
        • Cancer Treatment Centers
      • REST OF APAC Outlook (USD Billion, 2019-2035)
      • REST OF APAC CAR T Cell Therapy Market by Therapeutic Area Type

        • Oncology
        • Autoimmune Diseases
        • Infectious Diseases
      • REST OF APAC CAR T Cell Therapy Market by Cell Source Type

        • Autologous
        • Allogeneic
        • Gene-Edited
      • REST OF APAC CAR T Cell Therapy Market by Indication Type

        • Acute Lymphoblastic Leukemia
        • Non-Hodgkin Lymphoma
        • Multiple Myeloma
      • REST OF APAC CAR T Cell Therapy Market by End User Type

        • Hospitals
        • Research Institutes
        • Cancer Treatment Centers
    • South America Outlook (USD Billion, 2019-2035)

      • South America CAR T Cell Therapy Market by Therapeutic Area Type

        • Oncology
        • Autoimmune Diseases
        • Infectious Diseases
      • South America CAR T Cell Therapy Market by Cell Source Type

        • Autologous
        • Allogeneic
        • Gene-Edited
      • South America CAR T Cell Therapy Market by Indication Type

        • Acute Lymphoblastic Leukemia
        • Non-Hodgkin Lymphoma
        • Multiple Myeloma
      • South America CAR T Cell Therapy Market by End User Type

        • Hospitals
        • Research Institutes
        • Cancer Treatment Centers
      • South America CAR T Cell Therapy Market by Regional Type

        • Brazil
        • Mexico
        • Argentina
        • Rest of South America
      • BRAZIL Outlook (USD Billion, 2019-2035)
      • BRAZIL CAR T Cell Therapy Market by Therapeutic Area Type

        • Oncology
        • Autoimmune Diseases
        • Infectious Diseases
      • BRAZIL CAR T Cell Therapy Market by Cell Source Type

        • Autologous
        • Allogeneic
        • Gene-Edited
      • BRAZIL CAR T Cell Therapy Market by Indication Type

        • Acute Lymphoblastic Leukemia
        • Non-Hodgkin Lymphoma
        • Multiple Myeloma
      • BRAZIL CAR T Cell Therapy Market by End User Type

        • Hospitals
        • Research Institutes
        • Cancer Treatment Centers
      • MEXICO Outlook (USD Billion, 2019-2035)
      • MEXICO CAR T Cell Therapy Market by Therapeutic Area Type

        • Oncology
        • Autoimmune Diseases
        • Infectious Diseases
      • MEXICO CAR T Cell Therapy Market by Cell Source Type

        • Autologous
        • Allogeneic
        • Gene-Edited
      • MEXICO CAR T Cell Therapy Market by Indication Type

        • Acute Lymphoblastic Leukemia
        • Non-Hodgkin Lymphoma
        • Multiple Myeloma
      • MEXICO CAR T Cell Therapy Market by End User Type

        • Hospitals
        • Research Institutes
        • Cancer Treatment Centers
      • ARGENTINA Outlook (USD Billion, 2019-2035)
      • ARGENTINA CAR T Cell Therapy Market by Therapeutic Area Type

        • Oncology
        • Autoimmune Diseases
        • Infectious Diseases
      • ARGENTINA CAR T Cell Therapy Market by Cell Source Type

        • Autologous
        • Allogeneic
        • Gene-Edited
      • ARGENTINA CAR T Cell Therapy Market by Indication Type

        • Acute Lymphoblastic Leukemia
        • Non-Hodgkin Lymphoma
        • Multiple Myeloma
      • ARGENTINA CAR T Cell Therapy Market by End User Type

        • Hospitals
        • Research Institutes
        • Cancer Treatment Centers
      • REST OF SOUTH AMERICA Outlook (USD Billion, 2019-2035)
      • REST OF SOUTH AMERICA CAR T Cell Therapy Market by Therapeutic Area Type

        • Oncology
        • Autoimmune Diseases
        • Infectious Diseases
      • REST OF SOUTH AMERICA CAR T Cell Therapy Market by Cell Source Type

        • Autologous
        • Allogeneic
        • Gene-Edited
      • REST OF SOUTH AMERICA CAR T Cell Therapy Market by Indication Type

        • Acute Lymphoblastic Leukemia
        • Non-Hodgkin Lymphoma
        • Multiple Myeloma
      • REST OF SOUTH AMERICA CAR T Cell Therapy Market by End User Type

        • Hospitals
        • Research Institutes
        • Cancer Treatment Centers
    • MEA Outlook (USD Billion, 2019-2035)

      • MEA CAR T Cell Therapy Market by Therapeutic Area Type

        • Oncology
        • Autoimmune Diseases
        • Infectious Diseases
      • MEA CAR T Cell Therapy Market by Cell Source Type

        • Autologous
        • Allogeneic
        • Gene-Edited
      • MEA CAR T Cell Therapy Market by Indication Type

        • Acute Lymphoblastic Leukemia
        • Non-Hodgkin Lymphoma
        • Multiple Myeloma
      • MEA CAR T Cell Therapy Market by End User Type

        • Hospitals
        • Research Institutes
        • Cancer Treatment Centers
      • MEA CAR T Cell Therapy Market by Regional Type

        • GCC Countries
        • South Africa
        • Rest of MEA
      • GCC COUNTRIES Outlook (USD Billion, 2019-2035)
      • GCC COUNTRIES CAR T Cell Therapy Market by Therapeutic Area Type

        • Oncology
        • Autoimmune Diseases
        • Infectious Diseases
      • GCC COUNTRIES CAR T Cell Therapy Market by Cell Source Type

        • Autologous
        • Allogeneic
        • Gene-Edited
      • GCC COUNTRIES CAR T Cell Therapy Market by Indication Type

        • Acute Lymphoblastic Leukemia
        • Non-Hodgkin Lymphoma
        • Multiple Myeloma
      • GCC COUNTRIES CAR T Cell Therapy Market by End User Type

        • Hospitals
        • Research Institutes
        • Cancer Treatment Centers
      • SOUTH AFRICA Outlook (USD Billion, 2019-2035)
      • SOUTH AFRICA CAR T Cell Therapy Market by Therapeutic Area Type

        • Oncology
        • Autoimmune Diseases
        • Infectious Diseases
      • SOUTH AFRICA CAR T Cell Therapy Market by Cell Source Type

        • Autologous
        • Allogeneic
        • Gene-Edited
      • SOUTH AFRICA CAR T Cell Therapy Market by Indication Type

        • Acute Lymphoblastic Leukemia
        • Non-Hodgkin Lymphoma
        • Multiple Myeloma
      • SOUTH AFRICA CAR T Cell Therapy Market by End User Type

        • Hospitals
        • Research Institutes
        • Cancer Treatment Centers
      • REST OF MEA Outlook (USD Billion, 2019-2035)
      • REST OF MEA CAR T Cell Therapy Market by Therapeutic Area Type

        • Oncology
        • Autoimmune Diseases
        • Infectious Diseases
      • REST OF MEA CAR T Cell Therapy Market by Cell Source Type

        • Autologous
        • Allogeneic
        • Gene-Edited
      • REST OF MEA CAR T Cell Therapy Market by Indication Type

        • Acute Lymphoblastic Leukemia
        • Non-Hodgkin Lymphoma
        • Multiple Myeloma
      • REST OF MEA CAR T Cell Therapy Market by End User Type

        • Hospitals
        • Research Institutes
        • Cancer Treatment Centers
    Infographic

    Free Sample Request

    Kindly complete the form below to receive a free sample of this Report

    Get Free Sample

    Customer Strories

    “I am very pleased with how market segments have been defined in a relevant way for my purposes (such as "Portable Freezers & refrigerators" and "last-mile"). In general the report is well structured. Thanks very much for your efforts.”

    Victoria Milne

    Founder
    Case Study
    Chemicals and Materials

    Compare Licence

    ×
    Features License Type
    Single User Multiuser License Enterprise User
    Price $4,950 $5,950 $7,250
    Maximum User Access Limit 1 User Upto 10 Users Unrestricted Access Throughout the Organization
    Free Customization
    Direct Access to Analyst
    Deliverable Format
    Platform Access
    Discount on Next Purchase 10% 15% 15%
    Printable Versions