• Cat-intel
  • MedIntelliX
  • Resources
  • About Us
  • Hero Background
    English
    Chinese
    French
    Japanese
    Korean
    German
    Spanish

    Automated Suturing Devices Market Share

    ID: MRFR/MED/0700-HCR
    80 Pages
    Rahul Gotadki
    October 2025

    Automated Suturing Devices Market Research Report Information by Type (Disposable and Reusable), Application (Cardiac, Orthopedic, Ophthalmic, Dental and Gynecological), End-Use (Hospitals & Clinics, Ambulatory Surgical Centers and others) and Region (Americas, Europe, Asia-Pacific and Middle East & Africa) - Forecast till 2035

    Share:
    Download PDF ×

    We do not share your information with anyone. However, we may send you emails based on your report interest from time to time. You may contact us at any time to opt-out.

    Automated Suturing Devices Market Infographic
    $ 4,950.0
    $ 5,950.0
    $ 7,250.0

    Market Share

    Automated Suturing Devices Market Share Analysis

    The Automated Suturing Devices market is undergoing significant growth, driven by advancements in surgical technology and the increasing demand for efficient and precise suturing methods. Market players are strategically implementing various positioning strategies to capitalize on this trend and establish a competitive advantage in the evolving landscape of surgical devices. Within the Automated Suturing Devices market the firms aim at diversifying their product lines by developing different types of automated suturing devices. This involves robotic-assisted suturing systems as well as handheld automated suturing devices and laparoscopic suturing devices. Both the various devices in use facilitate the product development stage to provide companies with the opportunity to serve unmet surgical procedure and environment needs hence positioning themselves as all inclusive solution providers. With regard to primary market positioning strategy, constant investment in research and development to move the process of automated suturing forward is the one adopted. Therefore, corporates continuously try to increase the accuracy, lower the operational times, and make the gadgets friendlier. Technological development guarantees their competitive edge and strengthens their image as the latest surgical devices. Comprehending the worldwide need of innovative surgical technologies, firms develop measures to make their international market penetration. Such types of activities must includes the marketing design which involves the creation of partnerships, collaborations and distribution networks to ensure appropriate market penetration and accessibility to automated suturing devices for various regions. Such agreements are crucial for the market’s success because production requires surgeons and surgical team and healthcare facilities. This is achieved by working with leading members in the medical field to glean from their knowledge on clinical needs, product development, and credibility within the surgical community to tackle a market share. In market positioning, the user-friendly interfaces and training programs are key elements to be given priority. It also tries to build suturing devices that will work automatically they are simple to operate, and demand little training as well as have user friendly controls. This has a positive impact adoption is increased and brand loyalty is built among surgical professionals. Following strict regulatory policies and safe automated suturing devices form the basic methods for market positioning. Companies spend on the certification, the deep and regular solving of safety issues, the constant upgrading of the device to the level that would keep the trust of healthcare providers and users. There would be a big positioning of products from automated suturing devices in real-time monitoring of the devices. The companies create devices that serve the surgeon s feedback on several factors in suturing, including suture tension, tissue response, and other key parameters; therefore, the suturing process as a whole may be made as precise and time-saving as possible. Leveraging data analytics is integral for informed decision-making. Companies analyze user data, market trends, and competitive landscapes to refine marketing strategies and adapt product development. Data-driven insights enable companies to stay responsive to the evolving needs of the Automated Suturing Devices market.

    Market Summary

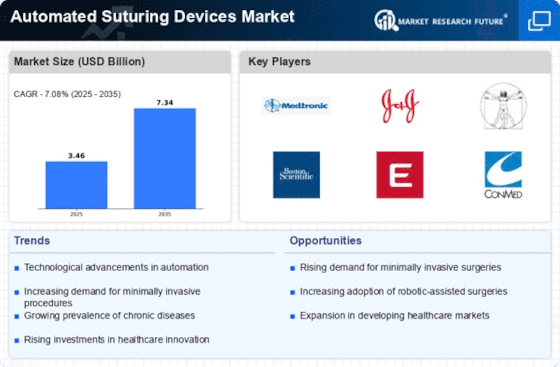
    The Global Automated Suturing Devices Market is projected to grow from 3.4 USD Billion in 2024 to 7.22 USD Billion by 2035.

    Key Market Trends & Highlights

    Automated Suturing Devices Key Trends and Highlights

    • The market is expected to experience a compound annual growth rate (CAGR) of 7.08% from 2025 to 2035.
    • By 2035, the market valuation is anticipated to reach 7.22 USD Billion, indicating robust growth.
    • In 2024, the market is valued at 3.4 USD Billion, reflecting a strong foundation for future expansion.
    • Growing adoption of automated suturing devices due to advancements in surgical procedures is a major market driver.

    Market Size & Forecast

    2024 Market Size 3.4 (USD Billion)
    2035 Market Size 7.22 (USD Billion)
    CAGR (2025-2035) 7.08%
    Largest Regional Market Share in 2024 latin_america)

    Major Players

    Medtronic, Baxter International, Inc, SuturTek, Inc, Smith and Nephew, Inc, EndoEvolution, R.Bard, Inc, Surgical Specialties Corporation, Becton, Dickson, and Company, Apollo Endosurgery, Inc, Ethicon, LSI Solutions, Inc, Boston Scientific, DemeTECH Corporation, Mellon Medical B.V., Braun Melsungen AG

    Market Trends

    The increasing demand for minimally invasive surgical procedures is driving innovation in automated suturing devices, which are poised to enhance surgical precision and reduce recovery times.

    U.S. Food and Drug Administration (FDA)

    Automated Suturing Devices Market Market Drivers

    Cost-Effectiveness

    Cost-effectiveness is a significant factor influencing the Global Automated Suturing Devices Market Industry. Automated suturing devices can potentially reduce overall surgical costs by minimizing operation times and decreasing the likelihood of complications. Hospitals and surgical centers are increasingly recognizing the long-term financial benefits of investing in these technologies. As the market matures, the cost of automated suturing devices is expected to decrease, making them more accessible to healthcare facilities worldwide. This trend may lead to a broader adoption of these devices, further driving market growth.

    Market Growth Projections

    The Global Automated Suturing Devices Market Industry is projected to experience a compound annual growth rate (CAGR) of 7.08% from 2025 to 2035. This growth is indicative of the increasing adoption of automated suturing technologies across various surgical specialties. Factors such as technological advancements, rising surgical procedures, and a growing emphasis on patient safety are expected to contribute to this upward trend. As healthcare systems worldwide continue to evolve, the demand for innovative and efficient suturing solutions is likely to remain strong, positioning the market for sustained growth in the coming years.

    Rising Surgical Procedures

    An increase in the number of surgical procedures globally is a key driver for the Global Automated Suturing Devices Market Industry. As populations age and the prevalence of chronic diseases rises, the demand for surgical interventions continues to grow. In 2024, the market is projected to reach 3.4 USD Billion, reflecting the increasing reliance on automated suturing devices to streamline surgical processes. Furthermore, the trend towards outpatient surgeries is likely to bolster the adoption of these devices, as they facilitate quicker recovery and shorter hospital stays, aligning with the evolving healthcare landscape.

    Technological Advancements

    The Global Automated Suturing Devices Market Industry is experiencing rapid technological advancements that enhance the efficiency and precision of surgical procedures. Innovations such as robotic-assisted suturing systems and smart sutures are gaining traction, allowing for minimally invasive surgeries with reduced recovery times. For instance, the integration of artificial intelligence in suturing devices is expected to improve accuracy and reduce human error. This trend is likely to drive market growth, as healthcare providers increasingly adopt these advanced solutions to improve patient outcomes and operational efficiency.

    Increased Focus on Patient Safety

    The Global Automated Suturing Devices Market Industry is witnessing a heightened focus on patient safety and quality of care. Automated suturing devices are designed to minimize human error and enhance the consistency of suturing techniques, thereby improving surgical outcomes. Regulatory bodies are increasingly emphasizing the importance of safety standards in surgical procedures, which may lead to greater adoption of automated solutions. As healthcare providers strive to meet these standards, the demand for reliable and efficient suturing devices is likely to rise, contributing to market expansion.

    Growing Demand in Emerging Markets

    Emerging markets are becoming increasingly important for the Global Automated Suturing Devices Market Industry. As healthcare infrastructure improves and access to advanced medical technologies expands, countries in regions such as Asia-Pacific and Latin America are witnessing a surge in demand for automated suturing devices. By 2035, the market is anticipated to reach 7.22 USD Billion, driven by the growing awareness of the benefits of automated suturing in enhancing surgical efficiency. This trend indicates a shift towards modern surgical practices in these regions, presenting significant opportunities for manufacturers and suppliers.

    Market Segment Insights

    Regional Insights

    Key Companies in the Automated Suturing Devices Market market include

    Industry Developments

    Future Outlook

    Automated Suturing Devices Market Future Outlook

    The Automated Suturing Devices Market is projected to grow at a 7.08% CAGR from 2024 to 2035, driven by technological advancements, increasing surgical procedures, and rising demand for minimally invasive surgeries.

    New opportunities lie in:

    • Develop AI-integrated suturing devices to enhance precision and reduce surgical time.
    • Expand product lines to include biodegradable sutures for eco-friendly surgical options.
    • Leverage telemedicine platforms for remote surgical training and device usage guidance.

    By 2035, the Automated Suturing Devices Market is expected to achieve substantial growth, reflecting evolving surgical practices and technological integration.

    Market Segmentation

    Report Scope

    Attribute/Metric Details
    Market Size 2023 3.23 (USD Billion)
    Market Size 2024 3.4 (USD Billion)
    Market Size 2032 6.01 (USD Billion)
    Compound Annual Growth Rate (CAGR) 6.3 % (2024 - 2032)
    Report Coverage Revenue Forecast, Competitive Landscape, Growth Factors, and Trends
    Base Year 2023
    Market Forecast Period 2024 - 2032
    Historical Data 2019 - 2023
    Geographies Covered North America, Europe, Asia-Pacific, and Rest of the World (RoW)
      Key Vendors Ethicon, Inc., Medtronic plc, B. Braun Melsungen AG, Smith& Nephew plc, Boston Scientific Corporation, DemeTECH Corporation, EndoEvolution, LLC., Apollo Endosurgery, Inc., Surgical Specialties Corporation, and Mellon Medical B.V
    Key Market Opportunities Technology advancement in surgical devices having applications in various fields of medicine such as dentistry, gynaecology, cardiology, urology, and others.
    Key Market Drivers The growing geriatric population and rise in the number of surgical procedures. Increase in the adoption rate of minimally invasive procedures.

    Market Highlights

    Author

    Rahul Gotadki
    Assistant Manager

    She holds an experience of about 6+ years in market research and business consulting, working under the spectrum of information communication technology, telecommunications and semiconductor domains. aarti conceptualizes and implements a scalable business strategy and provides strategic leadership to the clients. her expertise lies in market estimation, competitive intelligence, pipeline analysis, customer assessment, etc.

    Leave a Comment

    Latest Comments

    John Doe
    john@example.com

    This is a great article! Really helped me understand the topic better.

    Posted on July 23, 2025, 10:15 AM
    Jane Smith
    jane@domain.com

    Thanks for sharing this. I’ve bookmarked it for later reference.

    Posted on July 22, 2025, 7:45 PM

    FAQs

    What is the Automated Suturing Devices Market valuation in 2030?

    The Automated Suturing Devices Market valuation USD 6.01 Billion by 2032.

    What was the predicted CAGR of the Automated Suturing Devices Market during the forecast period covering 2022-2030?

    Automated Suturing Devices Market is Expected CAGR is 6.30% during the forecast period of 2024-2032

    Who are key players of the Automated Suturing Devices Market?

    Medtronic plc, B. Braun Melsungen AG, Smith& Nephew plc, Boston Scientific Corporation, DemeTECH Corporation, EndoEvolution, LLC., Apollo Endosurgery, Inc., Surgical Specialties Corporation, and Mellon Medical B.V

    Which type would dominate the Automated Suturing Devices Market?

    The reusable segment would dominate.

    Which application would enjoy better exposure in the Automated Suturing Devices Market?

    The cardiac segment would lead.

    1. |-
    2. TABLE OF CONTENTS
    3. REPORT PROLOGUE
    4. MARKET INTRODUCTION
    5. 2.1.    Definition
    6. 2.2.    Scope of the Study
    7. 2.2.1.    Research Objective
    8. 2.2.2.    Assumptions
    9. 2.2.3.    Limitations   
    10. RESEARCH METHODOLOGY
    11. 3.1.    Overview
    12. 3.2.    Primary Research
    13. 3.3.    Secondary Research
    14. 3.4.    Market Size Estimation
    15. MARKET DYNAMICS
    16. 4.1.    Overview
    17. 4.2.    Drivers
    18. 4.3.    Restraints
    19. 4.4.    Opportunities
    20. MARKET FACTOR ANALYSIS
    21. 5.1.    Porter’s Five Forces Analysis
    22. 5.1.1.    Bargaining Power of Suppliers
    23. 5.1.2.    Bargaining Power of Buyers
    24. 5.1.3.    Threat of New Entrants
    25. 5.1.4.    Threat of Substitutes
    26. 5.1.5.    Intensity of Rivalry
    27. 5.2.    Value Chain Analysis 
    28. GLOBAL AUTOMATED SUTURING DEVICES MARKET, BY TYPE
    29. 6.1.    Overview
    30. 6.2.    Disposable
    31. Market Estimates & Forecast, by Region, 2020-2027
    32. Market Estimates & Forecast, by Country, 2020-2027
    33. 6.3.    Reusable
    34. Market Estimates & Forecast, by Region, 2020-2027
    35. Market Estimates & Forecast, by Country, 2020-2027
    36. GLOBAL AUTOMATED SUTURING DEVICES MARKET, BY APPLICATION
    37. 7.1.    Overview
    38. 7.2.    Cardiac
    39. Market Estimates & Forecast, by Region, 2020-2027
    40. Market Estimates & Forecast, by Country, 2020-2027
    41. 7.3.    Orthopedic
    42. Market Estimates & Forecast, by Region, 2020-2027
    43. Market Estimates & Forecast, by Country, 2020-2027
    44. 7.4.    Ophthalmic
    45. Market Estimates & Forecast, by Region, 2020-2027
    46. Market Estimates & Forecast, by Country, 2020-2027
    47. 7.5.    Dental
    48. Market Estimates & Forecast, by Region, 2020-2027
    49. Market Estimates & Forecast, by Country, 2020-2027
    50. 7.6.    Gynecological
    51. Market Estimates & Forecast, by Region, 2020-2027
    52. Market Estimates & Forecast, by Country, 2020-2027
    53. 7.7.    Others
    54. Market Estimates & Forecast, by Region, 2020-2027
    55. Market Estimates & Forecast, by Country, 2020-2027
    56. GLOBAL AUTOMATED SUTURING DEVICES MARKET, BY END USE
    57. 8.1.    Overview
    58. 8.2.    Hospitals & Clinics
    59. Market Estimates & Forecast, by Region, 2020-2027
    60. Market Estimates & Forecast, by Country, 2020-2027
    61. 8.3.    Ambulatory Surgical Centres
    62. Market Estimates & Forecast, by Region, 2020-2027
    63. Market Estimates & Forecast, by Country, 2020-2027
    64. 8.4.    Others
    65. Market Estimates & Forecast, by Region, 2020-2027
    66. Market Estimates & Forecast, by Country, 2020-2027
    67. GLOBAL AUTOMATED SUTURING DEVICES MARKET, BY REGION
    68. 9.1.    Overview
    69. 9.2.    Americas
    70. 9.2.1.    North America
    71. 9.2.1.1.    US
    72. 9.2.1.2.    Canada
    73. 9.2.2.    Latin America
    74. 9.3.    Europe
    75. 9.3.1.    Western Europe
    76. 9.3.1.1.    Germany
    77. 9.3.1.2.    France
    78. 9.3.1.3.    Italy
    79. 9.3.1.4.    Spain
    80. 9.3.1.5.    UK
    81. 9.3.1.6.    Rest of Western Europe
    82. 9.3.2.    Eastern Europe
    83. 9.4.    Asia-Pacific
    84. 9.4.1.    Japan
    85. 9.4.2.    China
    86. 9.4.3.    India
    87. 9.4.4.    Australia
    88. 9.4.5.    South Korea
    89. 9.4.6.    Rest of Asia-Pacific
    90. 9.5.    Middle East & Africa
    91. 9.5.1.    Middle East
    92. 9.5.2.    Africa
    93. COMPANY LANDSCAPE
    94. 10.1.    Overview   
    95. 10.2.    Competitive Analysis
    96. 10.3.    Market Share Analysis
    97. 10.4.    Major Growth Strategy in the Global Automated Suturing Devices Market
    98. 10.5.    Competitive Benchmarking
    99. 10.6.    Leading Players in terms of Number of Developments in the Global Automated Suturing Devices Market
    100. 10.7.    Key Developments and Growth Strategies
    101. 10.7.1.    Product Launch/Service Deployment
    102. 10.7.2.    Mergers and Acquisitions
    103. 10.7.3.    Joint Ventures
    104. 10.8.    Major Players Financial Matrix & Market Ratio
    105. 10.8.1.    Sales & Operating Income 2020
    106. 10.8.2.    Major Players R&D Expenditure 2020
    107. 10.9.    Major Players Capital Market Ratio
    108. COMPANY PROFILES
    109. 11.1.     Ethicon, Inc.
    110. 11.1.1.    Company Overview   
    111. 11.1.2.    Product Overview   
    112. 11.1.3.    Financial Overview
    113. 11.1.4.    Key Developments   
    114. 11.1.5.    SWOT Analysis
    115. 11.1.6.    Key Strategies
    116. 11.2.    Medtronic plc
    117. 11.2.1.    Company Overview
    118. 11.2.2.    Product Overview   
    119. 11.2.3.    Financial Overview
    120. 11.2.4.    Key Developments   
    121. 11.2.5.    SWOT Analysis   
    122. 11.2.6.    Key Strategies
    123. 11.3.    B. Braun Melsungen AG
    124. 11.3.1.    Company Overview
    125. 11.3.2.    Product Overview   
    126. 11.3.3.    Financial Overview
    127. 11.3.4.    Key Developments   
    128. 11.3.5.    SWOT Analysis   
    129. 11.3.6.    Key Strategies
    130. 11.4.    Smith& Nephew plc
    131. 11.4.1.    Company Overview
    132. 11.4.2.    Product Overview   
    133. 11.4.3.    Financial Overview
    134. 11.4.4.    Key Developments   
    135. 11.4.5.    SWOT Analysis   
    136. 11.4.6.    Key Strategies
    137. 11.5.    Apollo Endosurgery, Inc.
    138. 11.5.1.    Company Overview
    139. 11.5.2.    Product Overview   
    140. 11.5.3.    Financial Overview
    141. 11.5.4.    Key Developments   
    142. 11.5.5.    SWOT Analysis   
    143. 11.5.6.    Key Strategies
    144. 11.6.    DemeTECH Corporation
    145. 11.6.1.    Company Overview
    146. 11.6.2.    Product Overview   
    147. 11.6.3.    Financial Overview
    148. 11.6.4.    Key Developments   
    149. 11.6.5.    SWOT Analysis   
    150. 11.6.6.    Key Strategies
    151. 11.7.     EndoEvolution, LLC.
    152. 11.7.1.    Company Overview
    153. 11.7.2.    Product Overview   
    154. 11.7.3.    Financial Overview
    155. 11.7.4.    Key Developments   
    156. 11.7.5.    SWOT Analysis   
    157. 11.7.6.    Key Strategies
    158. 11.8.    Apollo Endosurgery, Inc.
    159. 11.8.1.    Company Overview
    160. 11.8.2.    Product Overview   
    161. 11.8.3.    Financial Overview
    162. 11.8.4.    Key Developments   
    163. 11.8.5.    SWOT Analysis   
    164. 11.8.6.    Key Strategies
    165. 11.9.     Surgical Specialties Corporation
    166. 11.9.1.    Company Overview
    167. 11.9.2.    Product Overview   
    168. 11.9.3.    Financial Overview
    169. 11.9.4.    Key Developments   
    170. 11.9.5.    SWOT Analysis   
    171. 11.9.6.    Key Strategies
    172. 11.10.     Mellon Medical B.V.
    173. 11.10.1.    Company Overview
    174. 11.10.2.    Product Overview   
    175. 11.10.3.    Financial Overview
    176. 11.10.4.    Key Developments   
    177. 11.10.5.    SWOT Analysis   
    178. 11.10.6.    Key Strategies
    179. APPENDIX
    180. 12.1.    References
    181. 12.2.    Related Reports
    182. List of Tables and Figures
      1. TABLE 1    GLOBAL AUTOMATED SUTURING DEVICES MARKET SYNOPSIS, 2020-2027
      2. TABLE 2    GLOBAL AUTOMATED SUTURING DEVICES MARKET ESTIMATES & FORECAST, 2020-2027        (USD MILLION)       
      3. TABLE 3    GLOBAL AUTOMATED SUTURING DEVICES MARKET, BY TYPE, 2020-2027 (USD MILLION)
      4. TABLE 4    TABLE 3    GLOBAL AUTOMATED SUTURING DEVICES MARKET, BY APPLICATION, 2020-2027 (USD MILLION)
      5. TABLE 5    GLOBAL AUTOMATED SUTURING DEVICES MARKET, BY END USE, 2020-2027 (USD MILLION)
      6. TABLE 6    GLOBAL AUTOMATED SUTURING DEVICES MARKET, BY REGION, 2020-2027 (USD MILLION)
      7. TABLE 7    NORTH AMERICA: AUTOMATED SUTURING DEVICES MARKET, BY TYPE, 2020-2027         (USD MILLION)   
      8. TABLE 8    NORTH AMERICA: AUTOMATED SUTURING DEVICES MARKET, BY APPLICATION, 2020-2027     (USD MILLION)    
      9. TABLE 9    NORTH AMERICA: AUTOMATED SUTURING DEVICES MARKET, BY END USE, 2020-2027     (USD MILLION)          
      10. TABLE 10    US: AUTOMATED SUTURING DEVICES MARKET, BY TYPE, 2020-2027 (USD MILLION)  
      11. TABLE 11     US: AUTOMATED SUTURING DEVICES MARKET, BY APPLICATION, 2020-2027 (USD MILLION)
      12. TABLE 12    US: AUTOMATED SUTURING DEVICES MARKET, BY END USE, 2020-2027 (USD MILLION)          
      13. TABLE 13    CANADA: AUTOMATED SUTURING DEVICES MARKET, BY TYPE, 2020-2027 (USD MILLION)
      14. TABLE 14     CANADA: AUTOMATED SUTURING DEVICES MARKET, BY APPLICATION, 2020-2027         (USD MILLION)
      15. TABLE 15    CANADA: AUTOMATED SUTURING DEVICES MARKET, BY END USE, 2020-2027         (USD MILLION)          
      16. TABLE 16    LATIN AMERICA: AUTOMATED SUTURING DEVICES MARKET, BY TYPE, 2020-2027         (USD MILLION)    
      17. TABLE 17    LATIN AMERICA: AUTOMATED SUTURING DEVICES MARKET, BY APPLICATION, 2020-2027     (USD MILLION)  
      18. TABLE 18    LATIN AMERICA: AUTOMATED SUTURING DEVICES MARKET, BY END USE, 2020-2027     (USD MILLION)
      19. TABLE 19    EUROPE: AUTOMATED SUTURING DEVICES MARKET, BY TYPE, 2020-2027 (USD MILLION)  
      20. TABLE 20    EUROPE: AUTOMATED SUTURING DEVICES MARKET, BY   APPLICATION, 2020-2027         (USD MILLION)       
      21. TABLE 21    EUROPE: AUTOMATED SUTURING DEVICES MARKET, BY END USE, 2020-2027         (USD MILLION)          
      22. TABLE 22    WESTERN EUROPE: AUTOMATED SUTURING DEVICES MARKET, BY TYPE, 2020-2027         (USD MILLION)          
      23. TABLE 23    WESTERN EUROPE: AUTOMATED SUTURING DEVICES MARKET, BY APPLICATION, 2020-2027     (USD MILLION)
      24. TABLE 24    WESTERN EUROPE: AUTOMATED SUTURING DEVICES MARKET, BY END USE, 2020-2027     (USD MILLION)                 
      25. TABLE 25    EASTERN EUROPE: AUTOMATED SUTURING DEVICES MARKET, BY TYPE, 2020-2027         (USD MILLION) 
      26. TABLE 26    EASTERN EUROPE: AUTOMATED SUTURING DEVICES MARKET, BY APPLICATION, 2020-2027     (USD MILLION)       
      27. TABLE 27    EASTERN EUROPE: AUTOMATED SUTURING DEVICES MARKET, BY END USE, 2020-2027     (USD MILLION)                                                             
      28. TABLE 28    ASIA-PACIFIC: AUTOMATED SUTURING DEVICES MARKET, BY TYPE, 2020-2027         (USD MILLION)          
      29. TABLE 29    ASIA-PACIFIC: AUTOMATED SUTURING DEVICES MARKET, BY APPLICATION, 2020-2027     (USD MILLION)
      30. TABLE 30    ASIA-PACIFIC: AUTOMATED SUTURING DEVICES MARKET, BY END USE, 2020-2027         (USD MILLION)                                                                                         
      31. TABLE 31    MIDDLE EAST & AFRICA: AUTOMATED SUTURING DEVICES MARKET, BY TYPE, 2020-2027     (USD MILLION)     
      32. TABLE 32    MIDDLE EAST & AFRICA: AUTOMATED SUTURING DEVICES MARKET, BY APPLICATION,     2020-2027 (USD MILLION)      
      33. TABLE 33    MIDDLE EAST & AFRICA: AUTOMATED SUTURING DEVICES MARKET, BY END USE, 2020-2027     (USD MILLION)          
      34. FIGURE 1    RESEARCH PROCESS
      35. FIGURE 2    MARKET STRUCTURE FOR THE GLOBAL AUTOMATED SUTURING DEVICES MARKET
      36. FIGURE 3    MARKET DYNAMICS FOR THE GLOBAL AUTOMATED SUTURING DEVICES MARKET
      37. FIGURE 4    GLOBAL AUTOMATED SUTURING DEVICES MARKET SHARE, BY TYPE, 2020 (%)
      38. FIGURE 5     GLOBAL AUTOMATED SUTURING DEVICES MARKET SHARE, BY APPLICATION, 2020 (%)
      39. FIGURE 6    GLOBAL AUTOMATED SUTURING DEVICES MARKET SHARE, BY END USE, 2020 (%)
      40. FIGURE 7    GLOBAL AUTOMATED SUTURING DEVICES MARKET SHARE, BY REGION, 2020 (%)
      41. FIGURE 8    AMERICAS: AUTOMATED SUTURING DEVICES MARKET SHARE BY REGION, 2020 (%)
      42. FIGURE 9    NORTH AMERICA: AUTOMATED SUTURING DEVICES MARKET SHARE, BY COUNTRY, 2020 (%)
      43. FIGURE 10    EUROPE: AUTOMATED SUTURING DEVICES MARKET SHARE, BY REGION, 2020 (%)
      44. FIGURE 11    WESTERN EUROPE: AUTOMATED SUTURING DEVICES MARKET SHARE, BY COUNTRY, 2020 (%)
      45. FIGURE 12    ASIA-PACIFIC: AUTOMATED SUTURING DEVICES MARKET SHARE, BY COUNTRY, 2020 (%)
      46. FIGURE 13    MIDDLE EAST & AFRICA: AUTOMATED SUTURING DEVICES MARKET SHARE, BY COUNTRY, 2020 (%)
      47. FIGURE 14    GLOBAL AUTOMATED SUTURING DEVICES MARKET: COMPANY SHARE ANALYSIS, 2020 (%)
      48. FIGURE 15     ETHICON, INC.: KEY FINANCIALS
      49. FIGURE 16     ETHICON, INC.: SEGMENTAL REVENUE
      50. FIGURE 17     ETHICON, INC.: REGIONAL REVENUE
      51. FIGURE 18     MEDTRONIC PLC: KEY FINANCIALS
      52. FIGURE 19     MEDTRONIC PLC: SEGMENTAL REVENUE
      53. FIGURE 20     MEDTRONIC PLC: REGIONAL REVENUE
      54. FIGURE 21     B. BRAUN MELSUNGEN AG: KEY FINANCIALS
      55. FIGURE 22     B. BRAUN MELSUNGEN AG: SEGMENTAL REVENUE
      56. FIGURE 23     B. BRAUN MELSUNGEN AG: REGIONAL REVENUE
      57. FIGURE 24    SMITH& NEPHEW PLC: KEY FINANCIALS
      58. FIGURE 25    SMITH& NEPHEW PLC: SEGMENTAL REVENUE
      59. FIGURE 26    SMITH& NEPHEW PLC: REGIONAL REVENUE
      60. FIGURE 27    BOSTON SCIENTIFIC CORPORATION: KEY FINANCIALS
      61. FIGURE 28    BOSTON SCIENTIFIC CORPORATION: SEGMENTAL REVENUE
      62. FIGURE 29    BOSTON SCIENTIFIC CORPORATION: REGIONAL REVENUE
      63. FIGURE 30     ENDOEVOLUTION, LLC: KEY FINANCIALS
      64. FIGURE 31     ENDOEVOLUTION, LLC: SEGMENTAL REVENUE
      65. FIGURE 32     ENDOEVOLUTION, LLC: REGIONAL REVENUE
      66. FIGURE 33    APOLLO ENDOSURGERY, INC.: KEY FINANCIALS
      67. FIGURE 34    APOLLO ENDOSURGERY, INC.: SEGMENTAL REVENUE
      68. FIGURE 35    APOLLO ENDOSURGERY, INC.: REGIONAL REVENUE
      69. FIGURE 36     SURGICAL SPECIALTIES CORPORATION: KEY FINANCIALS
      70. FIGURE 37     SURGICAL SPECIALTIES CORPORATION: SEGMENTAL REVENUE
      71. FIGURE 38     SURGICAL SPECIALTIES CORPORATION: REGIONAL REVENUE
      72. FIGURE 39     MELLON MEDICAL B.V.: KEY FINANCIALS
      73. FIGURE 40     MELLON MEDICAL B.V.: SEGMENTAL REVENUE
      74. FIGURE 41     MELLON MEDICAL B.V.: REGIONAL REVENUE

    Automated Suturing Devices Market Segmentation

    Market Segmentation Overview

    • Detailed segmentation data will be available in the full report
    • Comprehensive analysis by multiple parameters
    • Regional and country-level breakdowns
    • Market size forecasts by segment
    Infographic

    Free Sample Request

    Kindly complete the form below to receive a free sample of this Report

    Get Free Sample

    Customer Strories

    “I am very pleased with how market segments have been defined in a relevant way for my purposes (such as "Portable Freezers & refrigerators" and "last-mile"). In general the report is well structured. Thanks very much for your efforts.”

    Victoria Milne

    Founder
    Case Study
    Chemicals and Materials