• Cat-intel
  • MedIntelliX
  • Resources
  • About Us
  • Request Free Sample ×

    Kindly complete the form below to receive a free sample of this Report

    Leading companies partner with us for data-driven Insights

    clients tt-cursor

    Asset Reliability Management Market

    ID: MRFR/ICT/33445-HCR
    100 Pages
    Aarti Dhapte
    September 2025

    Asset Reliability Management Market Research Report: By Solution Type (Software, Services, Consulting), By Deployment Type (On-Premise, Cloud-Based), By End User (Manufacturing, Energy Utilities, Transportation, Telecommunications), By Industry (Oil, Gas, Aerospace, Mining, Manufacturing) and By Regional (North America, Europe, South America, Asia Pacific, Middle East and Africa) - Forecast to 2034.

    Share:
    Download PDF ×

    We do not share your information with anyone. However, we may send you emails based on your report interest from time to time. You may contact us at any time to opt-out.

    Asset Reliability Management Market Research Report - Global Forecast till 2034 Infographic
    Purchase Options
    $ 4,950.0
    $ 5,950.0
    $ 7,250.0
    Table of Contents

    Asset Reliability Management Market Summary

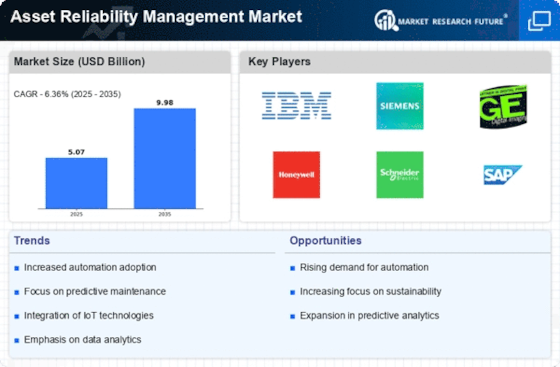
    The Global Asset Reliability Management Market is projected to grow from 4.77 USD Billion in 2024 to 9.98 USD Billion by 2035, indicating robust growth potential.

    Key Market Trends & Highlights

    Asset Reliability Management Key Trends and Highlights

    • The market is expected to experience a compound annual growth rate (CAGR) of 6.94% from 2025 to 2035.
    • By 2035, the market valuation is anticipated to reach 9.98 USD Billion, nearly doubling from its 2024 value.
    • In 2024, the market is valued at 4.77 USD Billion, reflecting a strong foundation for future growth.
    • Growing adoption of predictive maintenance technologies due to the need for enhanced operational efficiency is a major market driver.

    Market Size & Forecast

    2024 Market Size 4.77 (USD Billion)
    2035 Market Size 9.98 (USD Billion)
    CAGR (2025-2035) 6.94%

    Major Players

    SAS Institute, Osisoft, Duke Energy, SAP, Honeywell, Cummins, IBM, General Electric, Emerson Electric, ABB, Schneider Electric, Siemens, Rockwell Automation, Bentley Systems

    Asset Reliability Management Market Trends

    The Asset Reliability Management Market is driven by several key factors. One of the main drivers is the increasing demand for operational efficiency across various industries. Companies are seeking ways to minimize downtime and maintenance costs, ensuring that their assets are operating at peak performance. Additionally, the need for regulatory compliance and safety standards has amplified the focus on asset reliability. Organizations are investing in technology and solutions that can help them monitor and manage their assets more effectively. This focus on efficiency and compliance is pushing businesses to adopt reliable asset management strategies.

    There are numerous opportunities to be explored in this growing market. With advancements in technology, particularly in the areas of IoT and AI, companies can leverage predictive analytics to anticipate asset failures before they occur. This shift towards proactive maintenance presents a significant opportunity for service providers to deliver innovative solutions. Furthermore, emerging markets are recognizing the importance of asset reliability, creating potential growth avenues for businesses that offer tailored solutions to meet specific local needs. As companies shift from reactive to proactive management approaches, there are substantial growth prospects for those able to provide comprehensive asset management services.

    Recent trends indicate a shift towards digital transformation in asset management. More organizations are embracing cloud-based solutions, enabling real-time data analysis and remote monitoring. The integration of machine learning and artificial intelligence into asset reliability management practices is gaining traction, allowing for smarter decision-making. Organizations are also increasingly focused on sustainability, seeking ways to optimize asset performance while minimizing environmental impact. The growing prominence of data analytics is influencing how companies approach maintenance and reliability, highlighting the importance of data-driven strategies in effective asset management.

    These trends suggest that the market is evolving rapidly, opening new doors for innovation and improvement in asset reliability management practices.

    The increasing emphasis on operational efficiency and risk mitigation is driving organizations to adopt advanced asset reliability management strategies, thereby enhancing overall productivity and sustainability.

    U.S. Department of Energy

    Asset Reliability Management Market Drivers

    Market Growth Projections

    Integration of IoT Technologies

    The integration of Internet of Things (IoT) technologies plays a pivotal role in the Global Asset Reliability Management Market Industry. IoT devices facilitate real-time monitoring and data collection from assets, enabling organizations to make informed decisions regarding maintenance and operations. This technological advancement allows for enhanced visibility into asset conditions and performance metrics. As a result, the market is expected to grow significantly, with projections indicating a value of 9.98 USD Billion by 2035. The adoption of IoT solutions is particularly evident in sectors such as transportation and utilities, where asset reliability is critical.

    Advancements in Data Analytics and AI

    Advancements in data analytics and artificial intelligence (AI) are transforming the Global Asset Reliability Management Market Industry. These technologies enable organizations to analyze vast amounts of data generated by assets, leading to actionable insights that enhance reliability and performance. AI-driven predictive analytics can identify patterns and anomalies, allowing for timely interventions and maintenance. As organizations increasingly leverage these technologies, the market is poised for substantial growth, driven by the need for improved asset management strategies. The integration of AI and data analytics is likely to become a cornerstone of asset reliability management in the coming years.

    Growing Demand for Predictive Maintenance

    The Global Asset Reliability Management Market Industry experiences a growing demand for predictive maintenance strategies, which utilize advanced analytics and machine learning to forecast equipment failures. This proactive approach not only enhances operational efficiency but also reduces downtime and maintenance costs. As organizations increasingly recognize the value of predictive maintenance, the market is projected to reach 4.77 USD Billion in 2024. Companies across various sectors, including manufacturing and energy, are investing in these technologies to optimize asset performance and ensure reliability, thereby driving the growth of the Global Asset Reliability Management Market Industry.

    Regulatory Compliance and Safety Standards

    Regulatory compliance and safety standards are increasingly influencing the Global Asset Reliability Management Market Industry. Organizations are compelled to adhere to stringent regulations aimed at ensuring the safety and reliability of their assets. This compliance not only mitigates risks but also enhances the overall reliability of operations. As industries face mounting pressure to meet these standards, investments in asset reliability management solutions are likely to rise. Consequently, this trend contributes to the anticipated compound annual growth rate of 6.94% from 2025 to 2035, reflecting the market's responsiveness to regulatory demands.

    Focus on Sustainability and Environmental Impact

    The emphasis on sustainability and minimizing environmental impact is reshaping the Global Asset Reliability Management Market Industry. Companies are increasingly adopting practices that not only enhance asset reliability but also align with environmental goals. This shift is driven by consumer preferences and regulatory pressures for sustainable operations. By implementing asset management strategies that prioritize sustainability, organizations can improve their operational efficiency while reducing their carbon footprint. This trend is expected to bolster market growth, as businesses recognize the dual benefits of reliability and sustainability in their operations.

    Market Segment Insights

    Asset Reliability Management Market Solution Type Insights  

    The Asset Reliability Management Market is witnessing robust growth, driven by its diverse solution types, which include Software, Services, and Consulting. As of 2023, the total market value stands at approximately 4.48 USD Billion, with significant contributions from each solution type. Software holds a considerable share, valued at 1.79 USD Billion, and is projected to reach 3.12 USD Billion by 2032. This segment plays a critical role in enhancing operational performance and efficiency, allowing organizations to manage their assets effectively through innovative tools and technologies.

    Services, valued at 1.45 USD Billion in 2023, are crucial for implementing asset management strategies and ensuring continuous operational support. By 2032, the Services segment is expected to grow to 2.52 USD Billion, reflecting its essential role in providing expert guidance and ongoing assistance to businesses in asset management. Consulting, representing a value of 1.24 USD Billion in 2023 and anticipated to rise to 2.16 USD Billion by 2032, highlights the importance of strategic planning and expert advice in the asset reliability management landscape.

    This segment is essential for organizations looking to improve asset performance and mitigate risk in an increasingly complex environment. Together, these solution types create a comprehensive framework for enhancing asset reliability, maximizing uptime, and providing companies with a competitive edge in their industries. The overall market dynamics indicate a steady demand for each solution type, but Software is leading the charge as it adapts to technological advancements, thus dominating the market growth.

    The interplay of these segments allows for greater customization of asset management solutions tailored to meet the unique needs of businesses, showcasing the resilience and adaptability of the Asset Reliability Management Market. The trends are further supported by the increasing focus on digital transformation and operational efficiency, creating ample opportunities for growth across all solution types while addressing the distinct challenges faced by organizations today.

    Figure 2 Asset Reliability Management Market By Solution Type (2023-2032)

    Asset Reliability Management Market Deployment Type Insights  

    The Asset Reliability Management Market, valued at 4.48 billion USD in 2023, showcases a dynamic landscape prominently characterized by various deployment types. The market segmentation reveals a strong inclination towards On-Premise and Cloud-Based deployment methods, reflecting a growing trend in organizations opting for flexible and scalable solutions to enhance asset management strategies. On-premise solutions often appeal to enterprises prioritizing data security and control, as these systems allow full ownership of data and customization. In contrast, Cloud-Based deployments cater to organizations seeking accessibility, collaboration, and reduced IT overhead, which significantly contributes to the increasing acceptance of these solutions.

    As technology evolves, the shift toward Cloud-Based approaches is notably significant, driven by the rising demand for real-time data access and analytics. The distinct advantages presented by each deployment type underscore their essential roles in the Asset Reliability Management Market's growth trajectory. With the market expected to reach 7.8 billion USD by 2032, the ongoing advancements in deployment technologies represent both opportunities and challenges in fueling market expansion.

    Asset Reliability Management Market End User Insights  

    The Asset Reliability Management Market is valued at approximately 4.48 USD Billion in 2023 and is expected to experience steady growth. The End User segment encompasses various industries, including Manufacturing, Energy  Utilities, Transportation, and Telecommunications, each playing a vital role in the overall market dynamics. Manufacturing holds a significant share as organizations focus on optimizing processes and minimizing downtime. The Energy  Utilities sector is critical for maintaining infrastructure and ensuring safety and compliance, as reliability management directly impacts service continuity. Transportation relies heavily on Asset Reliability Management for efficiency, improving operations and reducing maintenance costs.

    Meanwhile, Telecommunications is essential for managing network reliability, catering to the increasing demand for uninterrupted services. Overall, the diverse applications across these industries reveal the importance of Asset Reliability Management in enhancing operational efficiencies, reducing costs, and improving service quality, contributing to the overall growth of the Asset Reliability Management Market revenue. Furthermore, trends such as digital transformation and technology integration continue to drive the market, presenting numerous opportunities and challenges for stakeholders.

    Asset Reliability Management Market Industry Insights  

    The Asset Reliability Management Market, particularly within the Industry segment, is experiencing noteworthy expansion, with a valuation projected at approximately 4.48 billion USD in 2023. This market is expected to significantly grow, reaching about 7.8 billion USD by 2032. The Oil  Gas sector plays a pivotal role in this market, focusing on maintenance and ensuring asset longevity, addressing the high stakes of equipment failure. Aerospace also contributes significantly, emphasizing reliability for safety and regulatory compliance. Meanwhile, Mining capitalizes on asset management to optimize operational output and mitigate risks associated with heavy machinery.

    Manufacturing is also vital, adopting advanced technologies to enhance productivity and maintenance strategies. The overall market growth is supported by a shifting focus toward predictive maintenance and technological advancements, although challenges such as high implementation costs may pose hurdles. These factors collectively illustrate the dynamics and potential of the Asset Reliability Management Market.

    Get more detailed insights about Asset Reliability Management Market Research Report - Global Forecast till 2034

    Regional Insights

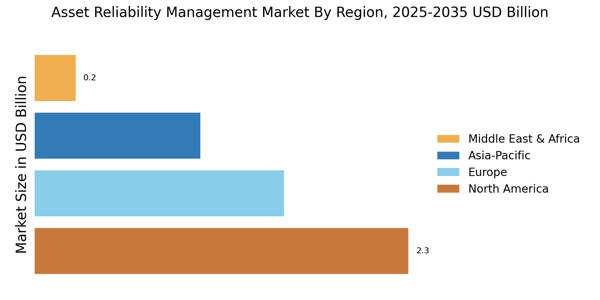
    The Asset Reliability Management Market is positioned for steady growth across various regions, with a total market valuation of 4.48 USD Billion in 2023. North America emerges as a leading region, holding a market value of 1.75 USD Billion, and its significance is underscored by the expected rise to 3.0 USD Billion by 2032, making it a majority holding in the market. Europe follows as another key player, valued at 1.25 USD Billion in 2023 and projected to reach 2.0 USD Billion by 2032, highlighting the region’s increasing focus on asset efficiency.

    The APAC region also shows substantial potential, starting at 1.0 USD Billion and growing to 1.6 USD Billion, driven by rapid industrialization and technological advancement. Meanwhile, South America, with a modest valuation of 0.25 USD Billion in 2023 and an anticipated growth of 0.5 USD Billion, still represents opportunities for expansion in asset management solutions. Lastly, the MEA region, beginning at 0.23 USD Billion and set to increase to 0.7 USD Billion, indicates a growing demand for reliability management services as industries evolve in this area.

    The segmentation illustrates varying degrees of market dominance, with North America and Europe leading the charge, while emerging opportunities remain in APAC, South America, and MEA, positioning the Asset Reliability Management Market for resilient advancements.

    Figure 3 Asset Reliability Management Market By Regional Insights (2023-2032)

    Asset Reliability Management Market Regional Insights

    Source: Primary Research, Secondary Research, Market Research Future Database and Analyst Review

    Key Players and Competitive Insights

    The Asset Reliability Management Market is witnessing significant growth, driven by the increasing need for optimizing asset performance and minimizing downtime in various industries. As organizations across the globe seek to boost efficiency and reduce operational costs, the demand for robust asset reliability management solutions is escalating. The competitive landscape is characterized by a mix of well-established players and innovative newcomers, all striving to enhance their product offerings and tap into emerging market opportunities.

    Companies are focusing on leveraging advanced technologies such as artificial intelligence, machine learning, and the Internet of Things to improve asset management practices, thus gaining a competitive edge. Understanding these competitive dynamics is crucial for stakeholders looking to navigate this evolving market. SAS Institute has established a strong presence in the Asset Reliability Management Market by leveraging its sophisticated analytics platform. The company's offerings are widely recognized for their ability to provide data-driven insights that facilitate informed decision-making and predictive maintenance.

    SAS Institute's strengths lie in its advanced analytics capabilities that allow businesses to harness vast amounts of data effectively, leading to improved asset performance and reliability. The integration of machine learning algorithms in their solutions helps customers identify potential issues before they escalate into significant problems, thereby reducing downtime and maintenance costs. These attributes make SAS Institute a formidable competitor in the asset reliability space as it continues to innovate and cater to the evolving needs of various industries.

    Osisoft, another key player in the Asset Reliability Management Market, is known for its data management and analytics solutions that focus on real-time operational intelligence. The company is distinguished by its comprehensive platform that enables organizations to collect, analyze, and visualize operational data, allowing them to make proactive decisions to enhance asset reliability. Osisoft's strengths lie in its ability to connect disparate data sources and provide a unified view of assets, which significantly aids in monitoring performance and identifying areas for improvement.

    Furthermore, the company’s commitment to integrating cloud technologies into its offerings positions it favorably amid the ongoing digital transformation trends in asset management. As businesses increasingly turn to cloud-based solutions for better scalability and flexibility, Osisoft is well-positioned to cater to these demands while driving enhanced operational efficiency.

    Key Companies in the Asset Reliability Management Market market include

    Industry Developments

    The Asset Reliability Management Market has seen significant recent developments, including advancements in technology that enhance predictive maintenance and asset performance management. Companies such as IBM and Siemens are leveraging AI and IoT to innovate their asset management solutions, improving efficiency and reliability. ABB and Schneider Electric continue to expand their smart technology offerings, capitalizing on the growing need for real-time data analytics in asset management. Meanwhile, Honeywell and Emerson Electric are focusing on integrating sustainability into their asset reliability services, responding to increasing regulatory pressures and consumer demand for greener solutions.

    In terms of acquisitions, SAS Institute announced plans to expand its capabilities through strategic partnerships that augment its analytics solutions. Cummins has also pursued collaboration with technology providers to enhance its asset reliability solutions. The overall market is experiencing growth, driven by the increasing awareness of the importance of maintaining equipment and infrastructure reliability, leading to an estimated rise in market valuation and investment opportunities. The combination of technological innovation and strategic collaborations is shaping a more robust landscape for asset reliability management companies like Duke Energy, General Electric, and Rockwell Automation.


    Future Outlook

    Asset Reliability Management Market Future Outlook

    The Asset Reliability Management Market is projected to grow at a 6.94% CAGR from 2024 to 2035, driven by technological advancements, increased automation, and a focus on sustainability.

    New opportunities lie in:

    • Develop predictive maintenance solutions leveraging AI and IoT technologies.
    • Expand service offerings to include comprehensive asset lifecycle management.
    • Invest in training programs to enhance workforce skills in reliability engineering.

    By 2035, the market is expected to achieve substantial growth, reflecting enhanced asset management practices globally.

    Market Segmentation

    Asset Reliability Management Market End User Outlook

    • Manufacturing
    • Energy Utilities  
    • Transportation
    • Telecommunications
    • Asset Reliability Management Market Industry Outlook

    Asset Reliability Management Market Industry Outlook

    • Oil Gas  
    • Aerospace
    • Mining
    • Manufacturing
    • Asset Reliability Management Market Regional Outlook

    Asset Reliability Management Market Regional Outlook

    • North America
    • Europe
    • South America
    • Asia Pacific
    • Middle East and Africa

    Asset Reliability Management Market Solution Type Outlook

    • Software
    • Services
    • Consulting
    • Asset Reliability Management Market Deployment Type Outlook

    Asset Reliability Management Market Deployment Type Outlook

    • On-Premise
    • Cloud-Based
    • Asset Reliability Management Market End User Outlook

    Report Scope

    Asset Reliability Management Market Report Scope
    Report Attribute/Metric Details
    Market Size 2024 5.65 (USD Billion)
    Market Size 2025 5.38 (USD Billion)
    Market Size 2034 9.38 (USD Billion)
    Compound Annual Growth Rate (CAGR) 6.36% (2025 - 2034)
    Report Coverage Revenue Forecast, Competitive Landscape, Growth Factors, and Trends
    Base Year 2024
    Market Forecast Period 2025 - 2034
    Historical Data 2019 - 2023
    Market Forecast Units USD Billion
    Key Companies Profiled SAS Institute, Osisoft, Duke Energy, SAP, Honeywell, Cummins, IBM, General Electric, Emerson Electric, ABB, Schneider Electric, Siemens, Rockwell Automation, Bentley Systems
    Segments Covered Solution Type, Deployment Type, End User, Industry, Regional
    Key Market Opportunities Predictive maintenance technology integration, Increasing demand for IoT solutions, Growing emphasis on operational efficiency, Rising regulatory compliance requirements, Adoption of AI-driven analytics tools
    Key Market Dynamics Growing need for asset optimization, Increasing focus on predictive maintenance, Rising investments in IoT technologies, Regulatory compliance pressures, Enhancing asset lifecycle management
    Countries Covered North America, Europe, APAC, South America, MEA
     

    Market Highlights

    Author
    Aarti Dhapte
    Team Lead - Research

    She holds an experience of about 6+ years in Market Research and Business Consulting, working under the spectrum of Information Communication Technology, Telecommunications and Semiconductor domains. Aarti conceptualizes and implements a scalable business strategy and provides strategic leadership to the clients. Her expertise lies in market estimation, competitive intelligence, pipeline analysis, customer assessment, etc.

    Leave a Comment

    FAQs

    1. What is the expected market size of the Asset Reliability Management Market by 2034?

    • The Asset Reliability Management Market is expected to be valued at 9.38 USD Billion by 2034.

    2. What is the projected CAGR for the Asset Reliability Management Market from 2025 to 2034?

    • The expected CAGR for the Asset Reliability Management Market from 2025 to 2034 is 6.36%.

    3. Which region represents the largest market share in the Asset Reliability Management Market in 2023?

    • North America represents the largest market share in the Asset Reliability Management Market, with a value of 1.75 USD Billion in 2023.

    4. How much is the Asset Reliability Management Market expected to grow in Europe by 2032?

    • The Asset Reliability Management Market in Europe is expected to grow to 2.0 USD Billion by 2032.

    5. What is the market size for the Software segment of the Asset Reliability Management Market in 2023?

    • The Software segment of the Asset Reliability Management Market is valued at 1.79 USD Billion in 2023.

    6. Which key players are majorly competing in the Asset Reliability Management Market?

    • Key players in the Asset Reliability Management Market include SAS Institute, Osisoft, IBM, and General Electric.

    7. What is the expected market size for the Consulting segment by 2032?

    • The Consulting segment of the Asset Reliability Management Market is expected to reach 2.16 USD Billion by 2032.

    8. What growth is anticipated for the APAC region of the Asset Reliability Management Market by 2032?

    • The APAC region is anticipated to grow to 1.6 USD Billion in the Asset Reliability Management Market by 2032.

    9. What is the expected value of the Services segment in the Asset Reliability Management Market in 2024?

    • The Services segment of the Asset Reliability Management Market is expected to be valued at approximately 1.85 USD Billion in 2024.

    10. What are the key growth drivers for the Asset Reliability Management Market?

    • Key growth drivers for the Asset Reliability Management Market include technological advancements and the increasing need for asset optimization.

    1. 'TABLE OF CONTENTS
    2. EXECUTIVE
    3. SUMMARY
    4. Market Overview
    5. Key Findings
    6. Market Segmentation
    7. Competitive Landscape
    8. Challenges and Opportunities
      1. Future Outlook
    9. MARKET INTRODUCTION
      1. Definition
      2. Scope of the study
        1. Research Objective
        2. Assumption
        3. Limitations
    10. RESEARCH METHODOLOGY
      1. Overview
      2. Data Mining
      3. Secondary Research
      4. Primary Research
        1. Primary Interviews and Information Gathering
    11. Process
    12. Breakdown of Primary Respondents
      1. Forecasting Model
      2. Market Size Estimation
        1. Bottom-Up Approach
        2. Top-Down Approach
      3. Data Triangulation
      4. Validation
    13. MARKET DYNAMICS
      1. Overview
      2. Drivers
      3. Restraints
      4. Opportunities
    14. MARKET FACTOR ANALYSIS
      1. Value chain Analysis
      2. Porter''s Five Forces Analysis
        1. Bargaining Power of Suppliers
        2. Bargaining
    15. Power of Buyers
    16. Threat of New Entrants
      1. Threat of Substitutes
        1. Intensity of Rivalry
      2. COVID-19 Impact Analysis
        1. Market Impact Analysis
        2. Regional
    17. Impact
    18. Opportunity and Threat Analysis
    19. ASSET RELIABILITY MANAGEMENT MARKET, BY SOLUTION
    20. TYPE (USD BILLION)
    21. Software
    22. Services
    23. Consulting
    24. ASSET RELIABILITY MANAGEMENT MARKET, BY DEPLOYMENT TYPE (USD BILLION)
      1. On-Premise
      2. Cloud-Based
    25. ASSET RELIABILITY
    26. MANAGEMENT MARKET, BY END USER (USD BILLION)
      1. Manufacturing
      2. Energy Utilities
      3. Transportation
      4. Telecommunications
    27. ASSET RELIABILITY MANAGEMENT MARKET, BY INDUSTRY
    28. (USD BILLION)
    29. Oil Gas
    30. Aerospace
    31. Mining
    32. Manufacturing
    33. ASSET RELIABILITY MANAGEMENT MARKET, BY REGIONAL (USD BILLION)
      1. North America
        1. US
        2. Canada
      2. Europe
        1. Germany
        2. UK
        3. France
        4. Russia
        5. Italy
        6. Spain
        7. Rest of Europe
      3. APAC
        1. China
        2. India
        3. Japan
        4. South
    34. Korea
    35. Malaysia
    36. Thailand
    37. Indonesia
    38. Rest of APAC
    39. South America
    40. Brazil
    41. Mexico
    42. Argentina
    43. Rest of South America
    44. MEA
    45. GCC Countries
    46. South Africa
    47. Rest of MEA
    48. COMPETITIVE LANDSCAPE
      1. Overview
      2. Competitive Analysis
      3. Market share Analysis
      4. Major Growth Strategy in the Asset Reliability
    49. Management Market
    50. Competitive Benchmarking
      1. Leading Players in Terms of Number of Developments in the Asset
    51. Reliability Management Market
      1. Key developments and growth strategies
        1. New Product Launch/Service Deployment
        2. Merger Acquisitions
        3. Joint
    52. Ventures
    53. Major Players Financial Matrix
      1. Sales and Operating Income
        1. Major Players RD Expenditure. 2023
    54. COMPANY PROFILES
      1. SAS
    55. Institute
    56. Financial Overview
    57. Products Offered
    58. Key Developments
    59. SWOT Analysis
    60. Key Strategies
    61. Osisoft
    62. Financial Overview
    63. Products Offered
    64. Key Developments
    65. SWOT Analysis
    66. Key Strategies
    67. Duke Energy
    68. Financial Overview
    69. Products Offered
    70. Key Developments
    71. SWOT Analysis
    72. Key Strategies
    73. SAP
    74. Financial Overview
    75. Products Offered
    76. Key Developments
    77. SWOT Analysis
    78. Key Strategies
    79. Honeywell
    80. Financial Overview
    81. Products Offered
    82. Key Developments
    83. SWOT Analysis
    84. Key Strategies
    85. Cummins
    86. Financial Overview
    87. Products Offered
    88. Key Developments
    89. SWOT Analysis
    90. Key Strategies
    91. IBM
    92. Financial Overview
    93. Products Offered
    94. Key Developments
    95. SWOT Analysis
    96. Key Strategies
    97. General Electric
    98. Financial Overview
    99. Products Offered
    100. Key Developments
    101. SWOT Analysis
    102. Key Strategies
    103. Emerson Electric
    104. Financial Overview
    105. Products Offered
    106. Key Developments
    107. SWOT Analysis
    108. Key Strategies
    109. ABB
    110. Financial Overview
    111. Products Offered
    112. Key Developments
    113. SWOT Analysis
    114. Key Strategies
    115. Schneider Electric
    116. Financial Overview
    117. Products Offered
    118. Key Developments
    119. SWOT Analysis
    120. Key Strategies
    121. Siemens
    122. Financial Overview
    123. Products Offered
    124. Key Developments
    125. SWOT Analysis
    126. Key Strategies
    127. Rockwell Automation
    128. Financial Overview
    129. Products Offered
    130. Key Developments
    131. SWOT Analysis
    132. Key Strategies
    133. Bentley Systems
    134. Financial Overview
    135. Products Offered
    136. Key Developments
    137. SWOT Analysis
    138. Key Strategies
    139. References
    140. Related Reports
    141. LIST
    142. OF TABLES
    143. LIST OF ASSUMPTIONS
    144. & FORECAST, BY SOLUTION TYPE, 2019-2032 (USD BILLIONS)
    145. MARKET SIZE ESTIMATES & FORECAST, BY DEPLOYMENT TYPE, 2019-2032 (USD BILLIONS)
    146. AMERICA ASSET RELIABILITY MANAGEMENT MARKET SIZE ESTIMATES & FORECAST, BY END
    147. USER, 2019-2032 (USD BILLIONS)
    148. & FORECAST, BY INDUSTRY, 2019-2032 (USD BILLIONS)
    149. MARKET SIZE ESTIMATES & FORECAST, BY REGIONAL, 2019-2032 (USD BILLIONS)
    150. MANAGEMENT MARKET SIZE ESTIMATES & FORECAST, BY SOLUTION TYPE, 2019-2032 (USD
    151. BILLIONS)
    152. US ASSET RELIABILITY MANAGEMENT MARKET SIZE ESTIMATES & FORECAST, BY DEPLOYMENT
    153. TYPE, 2019-2032 (USD BILLIONS)
    154. FORECAST, BY END USER, 2019-2032 (USD BILLIONS)
    155. SIZE ESTIMATES & FORECAST, BY INDUSTRY, 2019-2032 (USD BILLIONS)
    156. MANAGEMENT MARKET SIZE ESTIMATES & FORECAST, BY REGIONAL, 2019-2032 (USD BILLIONS)
    157. CANADA ASSET RELIABILITY MANAGEMENT MARKET SIZE ESTIMATES & FORECAST, BY SOLUTION
    158. TYPE, 2019-2032 (USD BILLIONS)
    159. & FORECAST, BY DEPLOYMENT TYPE, 2019-2032 (USD BILLIONS)
    160. MANAGEMENT MARKET SIZE ESTIMATES & FORECAST, BY END USER, 2019-2032 (USD BILLIONS)
    161. CANADA ASSET RELIABILITY MANAGEMENT MARKET SIZE ESTIMATES & FORECAST, BY INDUSTRY,
    162. 2032 (USD BILLIONS)
    163. & FORECAST, BY REGIONAL, 2019-2032 (USD BILLIONS)
    164. SIZE ESTIMATES & FORECAST, BY SOLUTION TYPE, 2019-2032 (USD BILLIONS)
    165. RELIABILITY MANAGEMENT MARKET SIZE ESTIMATES & FORECAST, BY DEPLOYMENT TYPE,
    166. 2032 (USD BILLIONS)
    167. & FORECAST, BY END USER, 2019-2032 (USD BILLIONS)
    168. SIZE ESTIMATES & FORECAST, BY INDUSTRY, 2019-2032 (USD BILLIONS)
    169. RELIABILITY MANAGEMENT MARKET SIZE ESTIMATES & FORECAST, BY REGIONAL, 2019-2032
    170. (USD BILLIONS)
    171. GERMANY ASSET RELIABILITY MANAGEMENT MARKET SIZE ESTIMATES & FORECAST, BY
    172. SOLUTION TYPE, 2019-2032 (USD BILLIONS)
    173. ESTIMATES & FORECAST, BY DEPLOYMENT TYPE, 2019-2032 (USD BILLIONS)
    174. RELIABILITY MANAGEMENT MARKET SIZE ESTIMATES & FORECAST, BY END USER, 2019-2032
    175. (USD BILLIONS)
    176. GERMANY ASSET RELIABILITY MANAGEMENT MARKET SIZE ESTIMATES & FORECAST, BY
    177. INDUSTRY, 2019-2032 (USD BILLIONS)
    178. ESTIMATES & FORECAST, BY REGIONAL, 2019-2032 (USD BILLIONS)
    179. MANAGEMENT MARKET SIZE ESTIMATES & FORECAST, BY SOLUTION TYPE, 2019-2032 (USD
    180. BILLIONS)
    181. UK ASSET RELIABILITY MANAGEMENT MARKET SIZE ESTIMATES & FORECAST, BY DEPLOYMENT
    182. TYPE, 2019-2032 (USD BILLIONS)
    183. FORECAST, BY END USER, 2019-2032 (USD BILLIONS)
    184. SIZE ESTIMATES & FORECAST, BY INDUSTRY, 2019-2032 (USD BILLIONS)
    185. MANAGEMENT MARKET SIZE ESTIMATES & FORECAST, BY REGIONAL, 2019-2032 (USD BILLIONS)
    186. FRANCE ASSET RELIABILITY MANAGEMENT MARKET SIZE ESTIMATES & FORECAST, BY SOLUTION
    187. TYPE, 2019-2032 (USD BILLIONS)
    188. & FORECAST, BY DEPLOYMENT TYPE, 2019-2032 (USD BILLIONS)
    189. MANAGEMENT MARKET SIZE ESTIMATES & FORECAST, BY END USER, 2019-2032 (USD BILLIONS)
    190. FRANCE ASSET RELIABILITY MANAGEMENT MARKET SIZE ESTIMATES & FORECAST, BY INDUSTRY,
    191. 2032 (USD BILLIONS)
    192. & FORECAST, BY REGIONAL, 2019-2032 (USD BILLIONS)
    193. SIZE ESTIMATES & FORECAST, BY SOLUTION TYPE, 2019-2032 (USD BILLIONS)
    194. RELIABILITY MANAGEMENT MARKET SIZE ESTIMATES & FORECAST, BY DEPLOYMENT TYPE,
    195. 2032 (USD BILLIONS)
    196. & FORECAST, BY END USER, 2019-2032 (USD BILLIONS)
    197. SIZE ESTIMATES & FORECAST, BY INDUSTRY, 2019-2032 (USD BILLIONS)
    198. RELIABILITY MANAGEMENT MARKET SIZE ESTIMATES & FORECAST, BY REGIONAL, 2019-2032
    199. (USD BILLIONS)
    200. ITALY ASSET RELIABILITY MANAGEMENT MARKET SIZE ESTIMATES & FORECAST, BY
    201. SOLUTION TYPE, 2019-2032 (USD BILLIONS)
    202. ESTIMATES & FORECAST, BY DEPLOYMENT TYPE, 2019-2032 (USD BILLIONS)
    203. RELIABILITY MANAGEMENT MARKET SIZE ESTIMATES & FORECAST, BY END USER, 2019-2032
    204. (USD BILLIONS)
    205. ITALY ASSET RELIABILITY MANAGEMENT MARKET SIZE ESTIMATES & FORECAST, BY
    206. INDUSTRY, 2019-2032 (USD BILLIONS)
    207. ESTIMATES & FORECAST, BY REGIONAL, 2019-2032 (USD BILLIONS)
    208. MANAGEMENT MARKET SIZE ESTIMATES & FORECAST, BY SOLUTION TYPE, 2019-2032 (USD
    209. BILLIONS)
    210. SPAIN ASSET RELIABILITY MANAGEMENT MARKET SIZE ESTIMATES & FORECAST, BY
    211. DEPLOYMENT TYPE, 2019-2032 (USD BILLIONS)
    212. SIZE ESTIMATES & FORECAST, BY END USER, 2019-2032 (USD BILLIONS)
    213. RELIABILITY MANAGEMENT MARKET SIZE ESTIMATES & FORECAST, BY INDUSTRY, 2019-2032
    214. (USD BILLIONS)
    215. SPAIN ASSET RELIABILITY MANAGEMENT MARKET SIZE ESTIMATES & FORECAST, BY
    216. REGIONAL, 2019-2032 (USD BILLIONS)
    217. SIZE ESTIMATES & FORECAST, BY SOLUTION TYPE, 2019-2032 (USD BILLIONS)
    218. ASSET RELIABILITY MANAGEMENT MARKET SIZE ESTIMATES & FORECAST, BY DEPLOYMENT
    219. TYPE, 2019-2032 (USD BILLIONS)
    220. & FORECAST, BY END USER, 2019-2032 (USD BILLIONS)
    221. MARKET SIZE ESTIMATES & FORECAST, BY INDUSTRY, 2019-2032 (USD BILLIONS)
    222. ASSET RELIABILITY MANAGEMENT MARKET SIZE ESTIMATES & FORECAST, BY REGIONAL,
    223. 2032 (USD BILLIONS)
    224. FORECAST, BY SOLUTION TYPE, 2019-2032 (USD BILLIONS)
    225. SIZE ESTIMATES & FORECAST, BY DEPLOYMENT TYPE, 2019-2032 (USD BILLIONS)
    226. RELIABILITY MANAGEMENT MARKET SIZE ESTIMATES & FORECAST, BY END USER, 2019-2032
    227. (USD BILLIONS)
    228. APAC ASSET RELIABILITY MANAGEMENT MARKET SIZE ESTIMATES & FORECAST, BY INDUSTRY,
    229. 2032 (USD BILLIONS)
    230. FORECAST, BY REGIONAL, 2019-2032 (USD BILLIONS)
    231. SIZE ESTIMATES & FORECAST, BY SOLUTION TYPE, 2019-2032 (USD BILLIONS)
    232. RELIABILITY MANAGEMENT MARKET SIZE ESTIMATES & FORECAST, BY DEPLOYMENT TYPE,
    233. 2032 (USD BILLIONS)
    234. & FORECAST, BY END USER, 2019-2032 (USD BILLIONS)
    235. SIZE ESTIMATES & FORECAST, BY INDUSTRY, 2019-2032 (USD BILLIONS)
    236. RELIABILITY MANAGEMENT MARKET SIZE ESTIMATES & FORECAST, BY REGIONAL, 2019-2032
    237. (USD BILLIONS)
    238. INDIA ASSET RELIABILITY MANAGEMENT MARKET SIZE ESTIMATES & FORECAST, BY
    239. SOLUTION TYPE, 2019-2032 (USD BILLIONS)
    240. ESTIMATES & FORECAST, BY DEPLOYMENT TYPE, 2019-2032 (USD BILLIONS)
    241. RELIABILITY MANAGEMENT MARKET SIZE ESTIMATES & FORECAST, BY END USER, 2019-2032
    242. (USD BILLIONS)
    243. INDIA ASSET RELIABILITY MANAGEMENT MARKET SIZE ESTIMATES & FORECAST, BY
    244. INDUSTRY, 2019-2032 (USD BILLIONS)
    245. ESTIMATES & FORECAST, BY REGIONAL, 2019-2032 (USD BILLIONS)
    246. MANAGEMENT MARKET SIZE ESTIMATES & FORECAST, BY SOLUTION TYPE, 2019-2032 (USD
    247. BILLIONS)
    248. JAPAN ASSET RELIABILITY MANAGEMENT MARKET SIZE ESTIMATES & FORECAST, BY
    249. DEPLOYMENT TYPE, 2019-2032 (USD BILLIONS)
    250. SIZE ESTIMATES & FORECAST, BY END USER, 2019-2032 (USD BILLIONS)
    251. RELIABILITY MANAGEMENT MARKET SIZE ESTIMATES & FORECAST, BY INDUSTRY, 2019-2032
    252. (USD BILLIONS)
    253. JAPAN ASSET RELIABILITY MANAGEMENT MARKET SIZE ESTIMATES & FORECAST, BY
    254. REGIONAL, 2019-2032 (USD BILLIONS)
    255. SIZE ESTIMATES & FORECAST, BY SOLUTION TYPE, 2019-2032 (USD BILLIONS)
    256. ASSET RELIABILITY MANAGEMENT MARKET SIZE ESTIMATES & FORECAST, BY DEPLOYMENT
    257. TYPE, 2019-2032 (USD BILLIONS)
    258. & FORECAST, BY END USER, 2019-2032 (USD BILLIONS)
    259. MARKET SIZE ESTIMATES & FORECAST, BY INDUSTRY, 2019-2032 (USD BILLIONS)
    260. ASSET RELIABILITY MANAGEMENT MARKET SIZE ESTIMATES & FORECAST, BY REGIONAL,
    261. 2032 (USD BILLIONS)
    262. & FORECAST, BY SOLUTION TYPE, 2019-2032 (USD BILLIONS)
    263. SIZE ESTIMATES & FORECAST, BY DEPLOYMENT TYPE, 2019-2032 (USD BILLIONS)
    264. RELIABILITY MANAGEMENT MARKET SIZE ESTIMATES & FORECAST, BY END USER, 2019-2032
    265. (USD BILLIONS)
    266. MALAYSIA ASSET RELIABILITY MANAGEMENT MARKET SIZE ESTIMATES & FORECAST,
    267. BY INDUSTRY, 2019-2032 (USD BILLIONS)
    268. ESTIMATES & FORECAST, BY REGIONAL, 2019-2032 (USD BILLIONS)
    269. MANAGEMENT MARKET SIZE ESTIMATES & FORECAST, BY SOLUTION TYPE, 2019-2032 (USD
    270. BILLIONS)
    271. THAILAND ASSET RELIABILITY MANAGEMENT MARKET SIZE ESTIMATES & FORECAST,
    272. BY DEPLOYMENT TYPE, 2019-2032 (USD BILLIONS)
    273. SIZE ESTIMATES & FORECAST, BY END USER, 2019-2032 (USD BILLIONS)
    274. RELIABILITY MANAGEMENT MARKET SIZE ESTIMATES & FORECAST, BY INDUSTRY, 2019-2032
    275. (USD BILLIONS)
    276. THAILAND ASSET RELIABILITY MANAGEMENT MARKET SIZE ESTIMATES & FORECAST,
    277. BY REGIONAL, 2019-2032 (USD BILLIONS)
    278. SIZE ESTIMATES & FORECAST, BY SOLUTION TYPE, 2019-2032 (USD BILLIONS)
    279. RELIABILITY MANAGEMENT MARKET SIZE ESTIMATES & FORECAST, BY DEPLOYMENT TYPE,
    280. 2032 (USD BILLIONS)
    281. & FORECAST, BY END USER, 2019-2032 (USD BILLIONS)
    282. MARKET SIZE ESTIMATES & FORECAST, BY INDUSTRY, 2019-2032 (USD BILLIONS)
    283. RELIABILITY MANAGEMENT MARKET SIZE ESTIMATES & FORECAST, BY REGIONAL, 2019-2032
    284. (USD BILLIONS)
    285. REST OF APAC ASSET RELIABILITY MANAGEMENT MARKET SIZE ESTIMATES & FORECAST,
    286. BY SOLUTION TYPE, 2019-2032 (USD BILLIONS)
    287. MARKET SIZE ESTIMATES & FORECAST, BY DEPLOYMENT TYPE, 2019-2032 (USD BILLIONS)
    288. REST OF APAC ASSET RELIABILITY MANAGEMENT MARKET SIZE ESTIMATES & FORECAST,
    289. BY END USER, 2019-2032 (USD BILLIONS)
    290. SIZE ESTIMATES & FORECAST, BY INDUSTRY, 2019-2032 (USD BILLIONS)
    291. ASSET RELIABILITY MANAGEMENT MARKET SIZE ESTIMATES & FORECAST, BY REGIONAL,
    292. 2032 (USD BILLIONS)
    293. & FORECAST, BY SOLUTION TYPE, 2019-2032 (USD BILLIONS)
    294. MARKET SIZE ESTIMATES & FORECAST, BY DEPLOYMENT TYPE, 2019-2032 (USD BILLIONS)
    295. SOUTH AMERICA ASSET RELIABILITY MANAGEMENT MARKET SIZE ESTIMATES & FORECAST,
    296. BY END USER, 2019-2032 (USD BILLIONS)
    297. SIZE ESTIMATES & FORECAST, BY INDUSTRY, 2019-2032 (USD BILLIONS)
    298. ASSET RELIABILITY MANAGEMENT MARKET SIZE ESTIMATES & FORECAST, BY REGIONAL,
    299. 2032 (USD BILLIONS)
    300. & FORECAST, BY SOLUTION TYPE, 2019-2032 (USD BILLIONS)
    301. SIZE ESTIMATES & FORECAST, BY DEPLOYMENT TYPE, 2019-2032 (USD BILLIONS)
    302. RELIABILITY MANAGEMENT MARKET SIZE ESTIMATES & FORECAST, BY END USER, 2019-2032
    303. (USD BILLIONS)
    304. BRAZIL ASSET RELIABILITY MANAGEMENT MARKET SIZE ESTIMATES & FORECAST, BY
    305. INDUSTRY, 2019-2032 (USD BILLIONS)
    306. ESTIMATES & FORECAST, BY REGIONAL, 2019-2032 (USD BILLIONS)
    307. MANAGEMENT MARKET SIZE ESTIMATES & FORECAST, BY SOLUTION TYPE, 2019-2032 (USD
    308. BILLIONS)
    309. MEXICO ASSET RELIABILITY MANAGEMENT MARKET SIZE ESTIMATES & FORECAST, BY
    310. DEPLOYMENT TYPE, 2019-2032 (USD BILLIONS)
    311. SIZE ESTIMATES & FORECAST, BY END USER, 2019-2032 (USD BILLIONS)
    312. RELIABILITY MANAGEMENT MARKET SIZE ESTIMATES & FORECAST, BY INDUSTRY, 2019-2032
    313. (USD BILLIONS)
    314. MEXICO ASSET RELIABILITY MANAGEMENT MARKET SIZE ESTIMATES & FORECAST, BY
    315. REGIONAL, 2019-2032 (USD BILLIONS)
    316. SIZE ESTIMATES & FORECAST, BY SOLUTION TYPE, 2019-2032 (USD BILLIONS)
    317. ASSET RELIABILITY MANAGEMENT MARKET SIZE ESTIMATES & FORECAST, BY DEPLOYMENT
    318. TYPE, 2019-2032 (USD BILLIONS)
    319. & FORECAST, BY END USER, 2019-2032 (USD BILLIONS)
    320. MARKET SIZE ESTIMATES & FORECAST, BY INDUSTRY, 2019-2032 (USD BILLIONS)
    321. ASSET RELIABILITY MANAGEMENT MARKET SIZE ESTIMATES & FORECAST, BY REGIONAL,
    322. 2032 (USD BILLIONS)
    323. SIZE ESTIMATES & FORECAST, BY SOLUTION TYPE, 2019-2032 (USD BILLIONS)
    324. AMERICA ASSET RELIABILITY MANAGEMENT MARKET SIZE ESTIMATES & FORECAST, BY DEPLOYMENT
    325. TYPE, 2019-2032 (USD BILLIONS)
    326. SIZE ESTIMATES & FORECAST, BY END USER, 2019-2032 (USD BILLIONS)
    327. AMERICA ASSET RELIABILITY MANAGEMENT MARKET SIZE ESTIMATES & FORECAST, BY INDUSTRY,
    328. 2032 (USD BILLIONS)
    329. SIZE ESTIMATES & FORECAST, BY REGIONAL, 2019-2032 (USD BILLIONS)
    330. RELIABILITY MANAGEMENT MARKET SIZE ESTIMATES & FORECAST, BY SOLUTION TYPE, 2019-2032
    331. (USD BILLIONS)
    332. MEA ASSET RELIABILITY MANAGEMENT MARKET SIZE ESTIMATES & FORECAST, BY DEPLOYMENT
    333. TYPE, 2019-2032 (USD BILLIONS)
    334. FORECAST, BY END USER, 2019-2032 (USD BILLIONS)
    335. SIZE ESTIMATES & FORECAST, BY INDUSTRY, 2019-2032 (USD BILLIONS)
    336. RELIABILITY MANAGEMENT MARKET SIZE ESTIMATES & FORECAST, BY REGIONAL, 2019-2032
    337. (USD BILLIONS)
    338. GCC COUNTRIES ASSET RELIABILITY MANAGEMENT MARKET SIZE ESTIMATES & FORECAST,
    339. BY SOLUTION TYPE, 2019-2032 (USD BILLIONS)
    340. MARKET SIZE ESTIMATES & FORECAST, BY DEPLOYMENT TYPE, 2019-2032 (USD BILLIONS)
    341. GCC COUNTRIES ASSET RELIABILITY MANAGEMENT MARKET SIZE ESTIMATES & FORECAST,
    342. BY END USER, 2019-2032 (USD BILLIONS)
    343. SIZE ESTIMATES & FORECAST, BY INDUSTRY, 2019-2032 (USD BILLIONS)
    344. ASSET RELIABILITY MANAGEMENT MARKET SIZE ESTIMATES & FORECAST, BY REGIONAL,
    345. 2032 (USD BILLIONS)
    346. & FORECAST, BY SOLUTION TYPE, 2019-2032 (USD BILLIONS)
    347. MARKET SIZE ESTIMATES & FORECAST, BY DEPLOYMENT TYPE, 2019-2032 (USD BILLIONS)
    348. SOUTH AFRICA ASSET RELIABILITY MANAGEMENT MARKET SIZE ESTIMATES & FORECAST,
    349. BY END USER, 2019-2032 (USD BILLIONS)
    350. SIZE ESTIMATES & FORECAST, BY INDUSTRY, 2019-2032 (USD BILLIONS)
    351. ASSET RELIABILITY MANAGEMENT MARKET SIZE ESTIMATES & FORECAST, BY REGIONAL,
    352. 2032 (USD BILLIONS)
    353. & FORECAST, BY SOLUTION TYPE, 2019-2032 (USD BILLIONS)
    354. MARKET SIZE ESTIMATES & FORECAST, BY DEPLOYMENT TYPE, 2019-2032 (USD BILLIONS)
    355. REST OF MEA ASSET RELIABILITY MANAGEMENT MARKET SIZE ESTIMATES & FORECAST, BY
    356. END USER, 2019-2032 (USD BILLIONS)
    357. SIZE ESTIMATES & FORECAST, BY INDUSTRY, 2019-2032 (USD BILLIONS)
    358. ASSET RELIABILITY MANAGEMENT MARKET SIZE ESTIMATES & FORECAST, BY REGIONAL,
    359. 2032 (USD BILLIONS)
    360. LIST
    361. OF FIGURES
    362. MARKET SYNOPSIS
    363. NORTH AMERICA ASSET RELIABILITY MANAGEMENT MARKET ANALYSIS
    364. MANAGEMENT MARKET ANALYSIS BY SOLUTION TYPE
    365. ANALYSIS BY DEPLOYMENT TYPE
    366. US ASSET RELIABILITY MANAGEMENT MARKET ANALYSIS BY INDUSTRY
    367. ANALYSIS BY REGIONAL
    368. CANADA ASSET RELIABILITY MANAGEMENT MARKET ANALYSIS BY SOLUTION TYPE
    369. RELIABILITY MANAGEMENT MARKET ANALYSIS BY DEPLOYMENT TYPE
    370. ANALYSIS BY END USER
    371. CANADA ASSET RELIABILITY MANAGEMENT MARKET ANALYSIS BY INDUSTRY
    372. MANAGEMENT MARKET ANALYSIS BY REGIONAL
    373. GERMANY ASSET RELIABILITY MANAGEMENT MARKET ANALYSIS BY SOLUTION TYPE
    374. RELIABILITY MANAGEMENT MARKET ANALYSIS BY DEPLOYMENT TYPE
    375. ANALYSIS BY END USER
    376. GERMANY ASSET RELIABILITY MANAGEMENT MARKET ANALYSIS BY INDUSTRY
    377. RELIABILITY MANAGEMENT MARKET ANALYSIS BY REGIONAL
    378. ANALYSIS BY SOLUTION TYPE
    379. TYPE
    380. UK ASSET RELIABILITY MANAGEMENT MARKET ANALYSIS BY END USER
    381. MANAGEMENT MARKET ANALYSIS BY INDUSTRY
    382. BY REGIONAL
    383. FRANCE ASSET RELIABILITY MANAGEMENT MARKET ANALYSIS BY SOLUTION TYPE
    384. RELIABILITY MANAGEMENT MARKET ANALYSIS BY DEPLOYMENT TYPE
    385. ANALYSIS BY END USER
    386. FRANCE ASSET RELIABILITY MANAGEMENT MARKET ANALYSIS BY INDUSTRY
    387. MANAGEMENT MARKET ANALYSIS BY REGIONAL
    388. BY SOLUTION TYPE
    389. RUSSIA ASSET RELIABILITY MANAGEMENT MARKET ANALYSIS BY DEPLOYMENT TYPE
    390. RELIABILITY MANAGEMENT MARKET ANALYSIS BY END USER
    391. ANALYSIS BY INDUSTRY
    392. RUSSIA ASSET RELIABILITY MANAGEMENT MARKET ANALYSIS BY REGIONAL
    393. MANAGEMENT MARKET ANALYSIS BY SOLUTION TYPE
    394. ANALYSIS BY DEPLOYMENT TYPE
    395. USER
    396. ITALY ASSET RELIABILITY MANAGEMENT MARKET ANALYSIS BY INDUSTRY
    397. MANAGEMENT MARKET ANALYSIS BY REGIONAL
    398. BY SOLUTION TYPE
    399. SPAIN ASSET RELIABILITY MANAGEMENT MARKET ANALYSIS BY DEPLOYMENT TYPE
    400. RELIABILITY MANAGEMENT MARKET ANALYSIS BY END USER
    401. ANALYSIS BY INDUSTRY
    402. SPAIN ASSET RELIABILITY MANAGEMENT MARKET ANALYSIS BY REGIONAL
    403. RELIABILITY MANAGEMENT MARKET ANALYSIS BY SOLUTION TYPE
    404. MARKET ANALYSIS BY DEPLOYMENT TYPE
    405. ANALYSIS BY END USER
    406. REST OF EUROPE ASSET RELIABILITY MANAGEMENT MARKET ANALYSIS BY INDUSTRY
    407. ASSET RELIABILITY MANAGEMENT MARKET ANALYSIS BY REGIONAL
    408. ANALYSIS
    409. CHINA ASSET RELIABILITY MANAGEMENT MARKET ANALYSIS BY SOLUTION TYPE
    410. RELIABILITY MANAGEMENT MARKET ANALYSIS BY DEPLOYMENT TYPE
    411. ANALYSIS BY END USER
    412. CHINA ASSET RELIABILITY MANAGEMENT MARKET ANALYSIS BY INDUSTRY
    413. MANAGEMENT MARKET ANALYSIS BY REGIONAL
    414. BY SOLUTION TYPE
    415. INDIA ASSET RELIABILITY MANAGEMENT MARKET ANALYSIS BY DEPLOYMENT TYPE
    416. RELIABILITY MANAGEMENT MARKET ANALYSIS BY END USER
    417. ANALYSIS BY INDUSTRY
    418. INDIA ASSET RELIABILITY MANAGEMENT MARKET ANALYSIS BY REGIONAL
    419. MANAGEMENT MARKET ANALYSIS BY SOLUTION TYPE
    420. ANALYSIS BY DEPLOYMENT TYPE
    421. USER
    422. JAPAN ASSET RELIABILITY MANAGEMENT MARKET ANALYSIS BY INDUSTRY
    423. MANAGEMENT MARKET ANALYSIS BY REGIONAL
    424. ANALYSIS BY SOLUTION TYPE
    425. BY DEPLOYMENT TYPE
    426. SOUTH KOREA ASSET RELIABILITY MANAGEMENT MARKET ANALYSIS BY END USER
    427. ASSET RELIABILITY MANAGEMENT MARKET ANALYSIS BY INDUSTRY
    428. MARKET ANALYSIS BY REGIONAL
    429. SOLUTION TYPE
    430. MALAYSIA ASSET RELIABILITY MANAGEMENT MARKET ANALYSIS BY DEPLOYMENT TYPE
    431. RELIABILITY MANAGEMENT MARKET ANALYSIS BY END USER
    432. MARKET ANALYSIS BY INDUSTRY
    433. REGIONAL
    434. THAILAND ASSET RELIABILITY MANAGEMENT MARKET ANALYSIS BY SOLUTION TYPE
    435. RELIABILITY MANAGEMENT MARKET ANALYSIS BY DEPLOYMENT TYPE
    436. MARKET ANALYSIS BY END USER
    437. INDUSTRY
    438. THAILAND ASSET RELIABILITY MANAGEMENT MARKET ANALYSIS BY REGIONAL
    439. ASSET RELIABILITY MANAGEMENT MARKET ANALYSIS BY SOLUTION TYPE
    440. MANAGEMENT MARKET ANALYSIS BY DEPLOYMENT TYPE
    441. MARKET ANALYSIS BY END USER
    442. INDUSTRY
    443. INDONESIA ASSET RELIABILITY MANAGEMENT MARKET ANALYSIS BY REGIONAL
    444. ASSET RELIABILITY MANAGEMENT MARKET ANALYSIS BY SOLUTION TYPE
    445. RELIABILITY MANAGEMENT MARKET ANALYSIS BY DEPLOYMENT TYPE
    446. MARKET ANALYSIS BY END USER
    447. BY INDUSTRY
    448. REST OF APAC ASSET RELIABILITY MANAGEMENT MARKET ANALYSIS BY REGIONAL
    449. ASSET RELIABILITY MANAGEMENT MARKET ANALYSIS
    450. ANALYSIS BY SOLUTION TYPE
    451. TYPE
    452. BRAZIL ASSET RELIABILITY MANAGEMENT MARKET ANALYSIS BY END USER
    453. MANAGEMENT MARKET ANALYSIS BY INDUSTRY
    454. BY REGIONAL
    455. MEXICO ASSET RELIABILITY MANAGEMENT MARKET ANALYSIS BY SOLUTION TYPE
    456. RELIABILITY MANAGEMENT MARKET ANALYSIS BY DEPLOYMENT TYPE
    457. ANALYSIS BY END USER
    458. MEXICO ASSET RELIABILITY MANAGEMENT MARKET ANALYSIS BY INDUSTRY
    459. MANAGEMENT MARKET ANALYSIS BY REGIONAL
    460. ANALYSIS BY SOLUTION TYPE
    461. BY DEPLOYMENT TYPE
    462. ARGENTINA ASSET RELIABILITY MANAGEMENT MARKET ANALYSIS BY END USER
    463. ASSET RELIABILITY MANAGEMENT MARKET ANALYSIS BY INDUSTRY
    464. MARKET ANALYSIS BY REGIONAL
    465. ANALYSIS BY SOLUTION TYPE
    466. ANALYSIS BY DEPLOYMENT TYPE
    467. ANALYSIS BY END USER
    468. REST OF SOUTH AMERICA ASSET RELIABILITY MANAGEMENT MARKET ANALYSIS BY INDUSTRY
    469. REST OF SOUTH AMERICA ASSET RELIABILITY MANAGEMENT MARKET ANALYSIS BY REGIONAL
    470. RELIABILITY MANAGEMENT MARKET ANALYSIS
    471. ANALYSIS BY SOLUTION TYPE
    472. BY DEPLOYMENT TYPE
    473. GCC COUNTRIES ASSET RELIABILITY MANAGEMENT MARKET ANALYSIS BY END USER
    474. ASSET RELIABILITY MANAGEMENT MARKET ANALYSIS BY INDUSTRY
    475. MARKET ANALYSIS BY REGIONAL
    476. BY SOLUTION TYPE
    477. SOUTH AFRICA ASSET RELIABILITY MANAGEMENT MARKET ANALYSIS BY DEPLOYMENT TYPE
    478. SOUTH AFRICA ASSET RELIABILITY MANAGEMENT MARKET ANALYSIS BY END USER
    479. ASSET RELIABILITY MANAGEMENT MARKET ANALYSIS BY INDUSTRY
    480. MARKET ANALYSIS BY REGIONAL
    481. BY SOLUTION TYPE
    482. REST OF MEA ASSET RELIABILITY MANAGEMENT MARKET ANALYSIS BY DEPLOYMENT TYPE
    483. REST OF MEA ASSET RELIABILITY MANAGEMENT MARKET ANALYSIS BY END USER
    484. ASSET RELIABILITY MANAGEMENT MARKET ANALYSIS BY INDUSTRY
    485. MARKET ANALYSIS BY REGIONAL
    486. RESEARCH PROCESS OF MRFR
    487. ANALYSIS: ASSET RELIABILITY MANAGEMENT MARKET
    488. MANAGEMENT MARKET
    489. SUPPLY / VALUE CHAIN: ASSET RELIABILITY MANAGEMENT MARKET
    490. MANAGEMENT MARKET, BY SOLUTION TYPE, 2024 (% SHARE)
    491. BY SOLUTION TYPE, 2019 TO 2032 (USD Billions)
    492. BY DEPLOYMENT TYPE, 2024 (% SHARE)
    493. TYPE, 2019 TO 2032 (USD Billions)
    494. USER, 2024 (% SHARE)
    495. ASSET RELIABILITY MANAGEMENT MARKET, BY END USER, 2019 TO 2032 (USD Billions)
    496. ASSET RELIABILITY MANAGEMENT MARKET, BY INDUSTRY, 2024 (% SHARE)
    497. MANAGEMENT MARKET, BY INDUSTRY, 2019 TO 2032 (USD Billions)
    498. BY REGIONAL, 2024 (% SHARE)
    499. TO 2032 (USD Billions)
    TABLE OF CONTENTS1. EXECUTIVE SUMMARY 1.1. Market Overview 1.2. Key Findings 1.3. Market Segmentation 1.4. Competitive Landscape 1.5. Challenges and Opportunities 1.6. Future Outlook 2. MARKET INTRODUCTION 2.1. Definition 2.2. Scope of the study 2.2.1. Research Objective 2.2.2. Assumption 2.2.3. Limitations 3. RESEARCH METHODOLOGY 3.1. Overview 3.2. Data Mining 3.3. Secondary Research 3.4. Primary Research 3.4.1. Primary Interviews and Information Gathering Process 3.4.2. Breakdown of Primary Respondents 3.5. Forecasting Model 3.6. Market Size Estimation 3.6.1. Bottom-Up Approach 3.6.2. Top-Down Approach 3.7. Data Triangulation 3.8. Validation 4. MARKET DYNAMICS 4.1. Overview 4.2. Drivers 4.3. Restraints 4.4. Opportunities 5. MARKET FACTOR ANALYSIS 5.1. Value chain Analysis 5.2. Porter's Five Forces Analysis 5.2.1. Bargaining Power of Suppliers 5.2.2. Bargaining Power of Buyers 5.2.3. Threat of New Entrants 5.2.4. Threat of Substitutes 5.2.5. Intensity of Rivalry 5.3. COVID-19 Impact Analysis 5.3.1. Market Impact Analysis 5.3.2. Regional Impact 5.3.3. Opportunity and Threat Analysis 6. ASSET RELIABILITY MANAGEMENT MARKET, BY SOLUTION TYPE (USD BILLION) 6.1. Software 6.2. Services 6.3. Consulting 7. ASSET RELIABILITY MANAGEMENT MARKET, BY DEPLOYMENT TYPE (USD BILLION) 7.1. On-Premise 7.2. Cloud-Based 8. ASSET RELIABILITY MANAGEMENT MARKET, BY END USER (USD BILLION) 8.1. Manufacturing 8.2. Energy Utilities 8.3. Transportation 8.4. Telecommunications 9. ASSET RELIABILITY MANAGEMENT MARKET, BY INDUSTRY (USD BILLION) 9.1. Oil Gas 9.2. Aerospace 9.3. Mining 9.4. Manufacturing 10. ASSET RELIABILITY MANAGEMENT MARKET, BY REGIONAL (USD BILLION) 10.1. North America 10.1.1. US 10.1.2. Canada 10.2. Europe 10.2.1. Germany 10.2.2. UK 10.2.3. France 10.2.4. Russia 10.2.5. Italy 10.2.6. Spain 10.2.7. Rest of Europe 10.3. APAC 10.3.1. China 10.3.2. India 10.3.3. Japan 10.3.4. South Korea 10.3.5. Malaysia 10.3.6. Thailand 10.3.7. Indonesia 10.3.8. Rest of APAC 10.4. South America 10.4.1. Brazil 10.4.2. Mexico 10.4.3. Argentina 10.4.4. Rest of South America 10.5. MEA 10.5.1. GCC Countries 10.5.2. South Africa 10.5.3. Rest of MEA 11. COMPETITIVE LANDSCAPE 11.1. Overview 11.2. Competitive Analysis 11.3. Market share Analysis 11.4. Major Growth Strategy in the Asset Reliability Management Market 11.5. Competitive Benchmarking 11.6. Leading Players in Terms of Number of Developments in the Asset Reliability Management Market 11.7. Key developments and growth strategies 11.7.1. New Product Launch/Service Deployment 11.7.2. Merger Acquisitions 11.7.3. Joint Ventures 11.8. Major Players Financial Matrix 11.8.1. Sales and Operating Income 11.8.2. Major Players RD Expenditure. 2023 12. COMPANY PROFILES 12.1. SAS Institute 12.1.1. Financial Overview 12.1.2. Products Offered 12.1.3. Key Developments 12.1.4. SWOT Analysis 12.1.5. Key Strategies 12.2. Osisoft 12.2.1. Financial Overview 12.2.2. Products Offered 12.2.3. Key Developments 12.2.4. SWOT Analysis 12.2.5. Key Strategies 12.3. Duke Energy 12.3.1. Financial Overview 12.3.2. Products Offered 12.3.3. Key Developments 12.3.4. SWOT Analysis 12.3.5. Key Strategies 12.4. SAP 12.4.1. Financial Overview 12.4.2. Products Offered 12.4.3. Key Developments 12.4.4. SWOT Analysis 12.4.5. Key Strategies 12.5. Honeywell 12.5.1. Financial Overview 12.5.2. Products Offered 12.5.3. Key Developments 12.5.4. SWOT Analysis 12.5.5. Key Strategies 12.6. Cummins 12.6.1. Financial Overview 12.6.2. Products Offered 12.6.3. Key Developments 12.6.4. SWOT Analysis 12.6.5. Key Strategies 12.7. IBM 12.7.1. Financial Overview 12.7.2. Products Offered 12.7.3. Key Developments 12.7.4. SWOT Analysis 12.7.5. Key Strategies 12.8. General Electric 12.8.1. Financial Overview 12.8.2. Products Offered 12.8.3. Key Developments 12.8.4. SWOT Analysis 12.8.5. Key Strategies 12.9. Emerson Electric 12.9.1. Financial Overview 12.9.2. Products Offered 12.9.3. Key Developments 12.9.4. SWOT Analysis 12.9.5. Key Strategies 12.10. ABB 12.10.1. Financial Overview 12.10.2. Products Offered 12.10.3. Key Developments 12.10.4. SWOT Analysis 12.10.5. Key Strategies 12.11. Schneider Electric 12.11.1. Financial Overview 12.11.2. Products Offered 12.11.3. Key Developments 12.11.4. SWOT Analysis 12.11.5. Key Strategies 12.12. Siemens 12.12.1. Financial Overview 12.12.2. Products Offered 12.12.3. Key Developments 12.12.4. SWOT Analysis 12.12.5. Key Strategies 12.13. Rockwell Automation 12.13.1. Financial Overview 12.13.2. Products Offered 12.13.3. Key Developments 12.13.4. SWOT Analysis 12.13.5. Key Strategies 12.14. Bentley Systems 12.14.1. Financial Overview 12.14.2. Products Offered 12.14.3. Key Developments 12.14.4. SWOT Analysis 12.14.5. Key Strategies 13. APPENDIX 13.1. References 13.2. Related Reports LIST OF TABLESTABLE 1. LIST OF ASSUMPTIONS TABLE 2. NORTH AMERICA ASSET RELIABILITY MANAGEMENT MARKET SIZE ESTIMATES & FORECAST, BY SOLUTION TYPE, 2019-2032 (USD BILLIONS) TABLE 3. NORTH AMERICA ASSET RELIABILITY MANAGEMENT MARKET SIZE ESTIMATES & FORECAST, BY DEPLOYMENT TYPE, 2019-2032 (USD BILLIONS) TABLE 4. NORTH AMERICA ASSET RELIABILITY MANAGEMENT MARKET SIZE ESTIMATES & FORECAST, BY END USER, 2019-2032 (USD BILLIONS) TABLE 5. NORTH AMERICA ASSET RELIABILITY MANAGEMENT MARKET SIZE ESTIMATES & FORECAST, BY INDUSTRY, 2019-2032 (USD BILLIONS) TABLE 6. NORTH AMERICA ASSET RELIABILITY MANAGEMENT MARKET SIZE ESTIMATES & FORECAST, BY REGIONAL, 2019-2032 (USD BILLIONS) TABLE 7. US ASSET RELIABILITY MANAGEMENT MARKET SIZE ESTIMATES & FORECAST, BY SOLUTION TYPE, 2019-2032 (USD BILLIONS) TABLE 8. US ASSET RELIABILITY MANAGEMENT MARKET SIZE ESTIMATES & FORECAST, BY DEPLOYMENT TYPE, 2019-2032 (USD BILLIONS) TABLE 9. US ASSET RELIABILITY MANAGEMENT MARKET SIZE ESTIMATES & FORECAST, BY END USER, 2019-2032 (USD BILLIONS) TABLE 10. US ASSET RELIABILITY MANAGEMENT MARKET SIZE ESTIMATES & FORECAST, BY INDUSTRY, 2019-2032 (USD BILLIONS) TABLE 11. US ASSET RELIABILITY MANAGEMENT MARKET SIZE ESTIMATES & FORECAST, BY REGIONAL, 2019-2032 (USD BILLIONS) TABLE 12. CANADA ASSET RELIABILITY MANAGEMENT MARKET SIZE ESTIMATES & FORECAST, BY SOLUTION TYPE, 2019-2032 (USD BILLIONS) TABLE 13. CANADA ASSET RELIABILITY MANAGEMENT MARKET SIZE ESTIMATES & FORECAST, BY DEPLOYMENT TYPE, 2019-2032 (USD BILLIONS) TABLE 14. CANADA ASSET RELIABILITY MANAGEMENT MARKET SIZE ESTIMATES & FORECAST, BY END USER, 2019-2032 (USD BILLIONS) TABLE 15. CANADA ASSET RELIABILITY MANAGEMENT MARKET SIZE ESTIMATES & FORECAST, BY INDUSTRY, 2019-2032 (USD BILLIONS) TABLE 16. CANADA ASSET RELIABILITY MANAGEMENT MARKET SIZE ESTIMATES & FORECAST, BY REGIONAL, 2019-2032 (USD BILLIONS) TABLE 17. EUROPE ASSET RELIABILITY MANAGEMENT MARKET SIZE ESTIMATES & FORECAST, BY SOLUTION TYPE, 2019-2032 (USD BILLIONS) TABLE 18. EUROPE ASSET RELIABILITY MANAGEMENT MARKET SIZE ESTIMATES & FORECAST, BY DEPLOYMENT TYPE, 2019-2032 (USD BILLIONS) TABLE 19. EUROPE ASSET RELIABILITY MANAGEMENT MARKET SIZE ESTIMATES & FORECAST, BY END USER, 2019-2032 (USD BILLIONS) TABLE 20. EUROPE ASSET RELIABILITY MANAGEMENT MARKET SIZE ESTIMATES & FORECAST, BY INDUSTRY, 2019-2032 (USD BILLIONS) TABLE 21. EUROPE ASSET RELIABILITY MANAGEMENT MARKET SIZE ESTIMATES & FORECAST, BY REGIONAL, 2019-2032 (USD BILLIONS) TABLE 22. GERMANY ASSET RELIABILITY MANAGEMENT MARKET SIZE ESTIMATES & FORECAST, BY SOLUTION TYPE, 2019-2032 (USD BILLIONS) TABLE 23. GERMANY ASSET RELIABILITY MANAGEMENT MARKET SIZE ESTIMATES & FORECAST, BY DEPLOYMENT TYPE, 2019-2032 (USD BILLIONS) TABLE 24. GERMANY ASSET RELIABILITY MANAGEMENT MARKET SIZE ESTIMATES & FORECAST, BY END USER, 2019-2032 (USD BILLIONS) TABLE 25. GERMANY ASSET RELIABILITY MANAGEMENT MARKET SIZE ESTIMATES & FORECAST, BY INDUSTRY, 2019-2032 (USD BILLIONS) TABLE 26. GERMANY ASSET RELIABILITY MANAGEMENT MARKET SIZE ESTIMATES & FORECAST, BY REGIONAL, 2019-2032 (USD BILLIONS) TABLE 27. UK ASSET RELIABILITY MANAGEMENT MARKET SIZE ESTIMATES & FORECAST, BY SOLUTION TYPE, 2019-2032 (USD BILLIONS) TABLE 28. UK ASSET RELIABILITY MANAGEMENT MARKET SIZE ESTIMATES & FORECAST, BY DEPLOYMENT TYPE, 2019-2032 (USD BILLIONS) TABLE 29. UK ASSET RELIABILITY MANAGEMENT MARKET SIZE ESTIMATES & FORECAST, BY END USER, 2019-2032 (USD BILLIONS) TABLE 30. UK ASSET RELIABILITY MANAGEMENT MARKET SIZE ESTIMATES & FORECAST, BY INDUSTRY, 2019-2032 (USD BILLIONS) TABLE 31. UK ASSET RELIABILITY MANAGEMENT MARKET SIZE ESTIMATES & FORECAST, BY REGIONAL, 2019-2032 (USD BILLIONS) TABLE 32. FRANCE ASSET RELIABILITY MANAGEMENT MARKET SIZE ESTIMATES & FORECAST, BY SOLUTION TYPE, 2019-2032 (USD BILLIONS) TABLE 33. FRANCE ASSET RELIABILITY MANAGEMENT MARKET SIZE ESTIMATES & FORECAST, BY DEPLOYMENT TYPE, 2019-2032 (USD BILLIONS) TABLE 34. FRANCE ASSET RELIABILITY MANAGEMENT MARKET SIZE ESTIMATES & FORECAST, BY END USER, 2019-2032 (USD BILLIONS) TABLE 35. FRANCE ASSET RELIABILITY MANAGEMENT MARKET SIZE ESTIMATES & FORECAST, BY INDUSTRY, 2019-2032 (USD BILLIONS) TABLE 36. FRANCE ASSET RELIABILITY MANAGEMENT MARKET SIZE ESTIMATES & FORECAST, BY REGIONAL, 2019-2032 (USD BILLIONS) TABLE 37. RUSSIA ASSET RELIABILITY MANAGEMENT MARKET SIZE ESTIMATES & FORECAST, BY SOLUTION TYPE, 2019-2032 (USD BILLIONS) TABLE 38. RUSSIA ASSET RELIABILITY MANAGEMENT MARKET SIZE ESTIMATES & FORECAST, BY DEPLOYMENT TYPE, 2019-2032 (USD BILLIONS) TABLE 39. RUSSIA ASSET RELIABILITY MANAGEMENT MARKET SIZE ESTIMATES & FORECAST, BY END USER, 2019-2032 (USD BILLIONS) TABLE 40. RUSSIA ASSET RELIABILITY MANAGEMENT MARKET SIZE ESTIMATES & FORECAST, BY INDUSTRY, 2019-2032 (USD BILLIONS) TABLE 41. RUSSIA ASSET RELIABILITY MANAGEMENT MARKET SIZE ESTIMATES & FORECAST, BY REGIONAL, 2019-2032 (USD BILLIONS) TABLE 42. ITALY ASSET RELIABILITY MANAGEMENT MARKET SIZE ESTIMATES & FORECAST, BY SOLUTION TYPE, 2019-2032 (USD BILLIONS) TABLE 43. ITALY ASSET RELIABILITY MANAGEMENT MARKET SIZE ESTIMATES & FORECAST, BY DEPLOYMENT TYPE, 2019-2032 (USD BILLIONS) TABLE 44. ITALY ASSET RELIABILITY MANAGEMENT MARKET SIZE ESTIMATES & FORECAST, BY END USER, 2019-2032 (USD BILLIONS) TABLE 45. ITALY ASSET RELIABILITY MANAGEMENT MARKET SIZE ESTIMATES & FORECAST, BY INDUSTRY, 2019-2032 (USD BILLIONS) TABLE 46. ITALY ASSET RELIABILITY MANAGEMENT MARKET SIZE ESTIMATES & FORECAST, BY REGIONAL, 2019-2032 (USD BILLIONS) TABLE 47. SPAIN ASSET RELIABILITY MANAGEMENT MARKET SIZE ESTIMATES & FORECAST, BY SOLUTION TYPE, 2019-2032 (USD BILLIONS) TABLE 48. SPAIN ASSET RELIABILITY MANAGEMENT MARKET SIZE ESTIMATES & FORECAST, BY DEPLOYMENT TYPE, 2019-2032 (USD BILLIONS) TABLE 49. SPAIN ASSET RELIABILITY MANAGEMENT MARKET SIZE ESTIMATES & FORECAST, BY END USER, 2019-2032 (USD BILLIONS) TABLE 50. SPAIN ASSET RELIABILITY MANAGEMENT MARKET SIZE ESTIMATES & FORECAST, BY INDUSTRY, 2019-2032 (USD BILLIONS) TABLE 51. SPAIN ASSET RELIABILITY MANAGEMENT MARKET SIZE ESTIMATES & FORECAST, BY REGIONAL, 2019-2032 (USD BILLIONS) TABLE 52. REST OF EUROPE ASSET RELIABILITY MANAGEMENT MARKET SIZE ESTIMATES & FORECAST, BY SOLUTION TYPE, 2019-2032 (USD BILLIONS) TABLE 53. REST OF EUROPE ASSET RELIABILITY MANAGEMENT MARKET SIZE ESTIMATES & FORECAST, BY DEPLOYMENT TYPE, 2019-2032 (USD BILLIONS) TABLE 54. REST OF EUROPE ASSET RELIABILITY MANAGEMENT MARKET SIZE ESTIMATES & FORECAST, BY END USER, 2019-2032 (USD BILLIONS) TABLE 55. REST OF EUROPE ASSET RELIABILITY MANAGEMENT MARKET SIZE ESTIMATES & FORECAST, BY INDUSTRY, 2019-2032 (USD BILLIONS) TABLE 56. REST OF EUROPE ASSET RELIABILITY MANAGEMENT MARKET SIZE ESTIMATES & FORECAST, BY REGIONAL, 2019-2032 (USD BILLIONS) TABLE 57. APAC ASSET RELIABILITY MANAGEMENT MARKET SIZE ESTIMATES & FORECAST, BY SOLUTION TYPE, 2019-2032 (USD BILLIONS) TABLE 58. APAC ASSET RELIABILITY MANAGEMENT MARKET SIZE ESTIMATES & FORECAST, BY DEPLOYMENT TYPE, 2019-2032 (USD BILLIONS) TABLE 59. APAC ASSET RELIABILITY MANAGEMENT MARKET SIZE ESTIMATES & FORECAST, BY END USER, 2019-2032 (USD BILLIONS) TABLE 60. APAC ASSET RELIABILITY MANAGEMENT MARKET SIZE ESTIMATES & FORECAST, BY INDUSTRY, 2019-2032 (USD BILLIONS) TABLE 61. APAC ASSET RELIABILITY MANAGEMENT MARKET SIZE ESTIMATES & FORECAST, BY REGIONAL, 2019-2032 (USD BILLIONS) TABLE 62. CHINA ASSET RELIABILITY MANAGEMENT MARKET SIZE ESTIMATES & FORECAST, BY SOLUTION TYPE, 2019-2032 (USD BILLIONS) TABLE 63. CHINA ASSET RELIABILITY MANAGEMENT MARKET SIZE ESTIMATES & FORECAST, BY DEPLOYMENT TYPE, 2019-2032 (USD BILLIONS) TABLE 64. CHINA ASSET RELIABILITY MANAGEMENT MARKET SIZE ESTIMATES & FORECAST, BY END USER, 2019-2032 (USD BILLIONS) TABLE 65. CHINA ASSET RELIABILITY MANAGEMENT MARKET SIZE ESTIMATES & FORECAST, BY INDUSTRY, 2019-2032 (USD BILLIONS) TABLE 66. CHINA ASSET RELIABILITY MANAGEMENT MARKET SIZE ESTIMATES & FORECAST, BY REGIONAL, 2019-2032 (USD BILLIONS) TABLE 67. INDIA ASSET RELIABILITY MANAGEMENT MARKET SIZE ESTIMATES & FORECAST, BY SOLUTION TYPE, 2019-2032 (USD BILLIONS) TABLE 68. INDIA ASSET RELIABILITY MANAGEMENT MARKET SIZE ESTIMATES & FORECAST, BY DEPLOYMENT TYPE, 2019-2032 (USD BILLIONS) TABLE 69. INDIA ASSET RELIABILITY MANAGEMENT MARKET SIZE ESTIMATES & FORECAST, BY END USER, 2019-2032 (USD BILLIONS) TABLE 70. INDIA ASSET RELIABILITY MANAGEMENT MARKET SIZE ESTIMATES & FORECAST, BY INDUSTRY, 2019-2032 (USD BILLIONS) TABLE 71. INDIA ASSET RELIABILITY MANAGEMENT MARKET SIZE ESTIMATES & FORECAST, BY REGIONAL, 2019-2032 (USD BILLIONS) TABLE 72. JAPAN ASSET RELIABILITY MANAGEMENT MARKET SIZE ESTIMATES & FORECAST, BY SOLUTION TYPE, 2019-2032 (USD BILLIONS) TABLE 73. JAPAN ASSET RELIABILITY MANAGEMENT MARKET SIZE ESTIMATES & FORECAST, BY DEPLOYMENT TYPE, 2019-2032 (USD BILLIONS) TABLE 74. JAPAN ASSET RELIABILITY MANAGEMENT MARKET SIZE ESTIMATES & FORECAST, BY END USER, 2019-2032 (USD BILLIONS) TABLE 75. JAPAN ASSET RELIABILITY MANAGEMENT MARKET SIZE ESTIMATES & FORECAST, BY INDUSTRY, 2019-2032 (USD BILLIONS) TABLE 76. JAPAN ASSET RELIABILITY MANAGEMENT MARKET SIZE ESTIMATES & FORECAST, BY REGIONAL, 2019-2032 (USD BILLIONS) TABLE 77. SOUTH KOREA ASSET RELIABILITY MANAGEMENT MARKET SIZE ESTIMATES & FORECAST, BY SOLUTION TYPE, 2019-2032 (USD BILLIONS) TABLE 78. SOUTH KOREA ASSET RELIABILITY MANAGEMENT MARKET SIZE ESTIMATES & FORECAST, BY DEPLOYMENT TYPE, 2019-2032 (USD BILLIONS) TABLE 79. SOUTH KOREA ASSET RELIABILITY MANAGEMENT MARKET SIZE ESTIMATES & FORECAST, BY END USER, 2019-2032 (USD BILLIONS) TABLE 80. SOUTH KOREA ASSET RELIABILITY MANAGEMENT MARKET SIZE ESTIMATES & FORECAST, BY INDUSTRY, 2019-2032 (USD BILLIONS) TABLE 81. SOUTH KOREA ASSET RELIABILITY MANAGEMENT MARKET SIZE ESTIMATES & FORECAST, BY REGIONAL, 2019-2032 (USD BILLIONS) TABLE 82. MALAYSIA ASSET RELIABILITY MANAGEMENT MARKET SIZE ESTIMATES & FORECAST, BY SOLUTION TYPE, 2019-2032 (USD BILLIONS) TABLE 83. MALAYSIA ASSET RELIABILITY MANAGEMENT MARKET SIZE ESTIMATES & FORECAST, BY DEPLOYMENT TYPE, 2019-2032 (USD BILLIONS) TABLE 84. MALAYSIA ASSET RELIABILITY MANAGEMENT MARKET SIZE ESTIMATES & FORECAST, BY END USER, 2019-2032 (USD BILLIONS) TABLE 85. MALAYSIA ASSET RELIABILITY MANAGEMENT MARKET SIZE ESTIMATES & FORECAST, BY INDUSTRY, 2019-2032 (USD BILLIONS) TABLE 86. MALAYSIA ASSET RELIABILITY MANAGEMENT MARKET SIZE ESTIMATES & FORECAST, BY REGIONAL, 2019-2032 (USD BILLIONS) TABLE 87. THAILAND ASSET RELIABILITY MANAGEMENT MARKET SIZE ESTIMATES & FORECAST, BY SOLUTION TYPE, 2019-2032 (USD BILLIONS) TABLE 88. THAILAND ASSET RELIABILITY MANAGEMENT MARKET SIZE ESTIMATES & FORECAST, BY DEPLOYMENT TYPE, 2019-2032 (USD BILLIONS) TABLE 89. THAILAND ASSET RELIABILITY MANAGEMENT MARKET SIZE ESTIMATES & FORECAST, BY END USER, 2019-2032 (USD BILLIONS) TABLE 90. THAILAND ASSET RELIABILITY MANAGEMENT MARKET SIZE ESTIMATES & FORECAST, BY INDUSTRY, 2019-2032 (USD BILLIONS) TABLE 91. THAILAND ASSET RELIABILITY MANAGEMENT MARKET SIZE ESTIMATES & FORECAST, BY REGIONAL, 2019-2032 (USD BILLIONS) TABLE 92. INDONESIA ASSET RELIABILITY MANAGEMENT MARKET SIZE ESTIMATES & FORECAST, BY SOLUTION TYPE, 2019-2032 (USD BILLIONS) TABLE 93. INDONESIA ASSET RELIABILITY MANAGEMENT MARKET SIZE ESTIMATES & FORECAST, BY DEPLOYMENT TYPE, 2019-2032 (USD BILLIONS) TABLE 94. INDONESIA ASSET RELIABILITY MANAGEMENT MARKET SIZE ESTIMATES & FORECAST, BY END USER, 2019-2032 (USD BILLIONS) TABLE 95. INDONESIA ASSET RELIABILITY MANAGEMENT MARKET SIZE ESTIMATES & FORECAST, BY INDUSTRY, 2019-2032 (USD BILLIONS) TABLE 96. INDONESIA ASSET RELIABILITY MANAGEMENT MARKET SIZE ESTIMATES & FORECAST, BY REGIONAL, 2019-2032 (USD BILLIONS) TABLE 97. REST OF APAC ASSET RELIABILITY MANAGEMENT MARKET SIZE ESTIMATES & FORECAST, BY SOLUTION TYPE, 2019-2032 (USD BILLIONS) TABLE 98. REST OF APAC ASSET RELIABILITY MANAGEMENT MARKET SIZE ESTIMATES & FORECAST, BY DEPLOYMENT TYPE, 2019-2032 (USD BILLIONS) TABLE 99. REST OF APAC ASSET RELIABILITY MANAGEMENT MARKET SIZE ESTIMATES & FORECAST, BY END USER, 2019-2032 (USD BILLIONS) TABLE 100. REST OF APAC ASSET RELIABILITY MANAGEMENT MARKET SIZE ESTIMATES & FORECAST, BY INDUSTRY, 2019-2032 (USD BILLIONS) TABLE 101. REST OF APAC ASSET RELIABILITY MANAGEMENT MARKET SIZE ESTIMATES & FORECAST, BY REGIONAL, 2019-2032 (USD BILLIONS) TABLE 102. SOUTH AMERICA ASSET RELIABILITY MANAGEMENT MARKET SIZE ESTIMATES & FORECAST, BY SOLUTION TYPE, 2019-2032 (USD BILLIONS) TABLE 103. SOUTH AMERICA ASSET RELIABILITY MANAGEMENT MARKET SIZE ESTIMATES & FORECAST, BY DEPLOYMENT TYPE, 2019-2032 (USD BILLIONS) TABLE 104. SOUTH AMERICA ASSET RELIABILITY MANAGEMENT MARKET SIZE ESTIMATES & FORECAST, BY END USER, 2019-2032 (USD BILLIONS) TABLE 105. SOUTH AMERICA ASSET RELIABILITY MANAGEMENT MARKET SIZE ESTIMATES & FORECAST, BY INDUSTRY, 2019-2032 (USD BILLIONS) TABLE 106. SOUTH AMERICA ASSET RELIABILITY MANAGEMENT MARKET SIZE ESTIMATES & FORECAST, BY REGIONAL, 2019-2032 (USD BILLIONS) TABLE 107. BRAZIL ASSET RELIABILITY MANAGEMENT MARKET SIZE ESTIMATES & FORECAST, BY SOLUTION TYPE, 2019-2032 (USD BILLIONS) TABLE 108. BRAZIL ASSET RELIABILITY MANAGEMENT MARKET SIZE ESTIMATES & FORECAST, BY DEPLOYMENT TYPE, 2019-2032 (USD BILLIONS) TABLE 109. BRAZIL ASSET RELIABILITY MANAGEMENT MARKET SIZE ESTIMATES & FORECAST, BY END USER, 2019-2032 (USD BILLIONS) TABLE 110. BRAZIL ASSET RELIABILITY MANAGEMENT MARKET SIZE ESTIMATES & FORECAST, BY INDUSTRY, 2019-2032 (USD BILLIONS) TABLE 111. BRAZIL ASSET RELIABILITY MANAGEMENT MARKET SIZE ESTIMATES & FORECAST, BY REGIONAL, 2019-2032 (USD BILLIONS) TABLE 112. MEXICO ASSET RELIABILITY MANAGEMENT MARKET SIZE ESTIMATES & FORECAST, BY SOLUTION TYPE, 2019-2032 (USD BILLIONS) TABLE 113. MEXICO ASSET RELIABILITY MANAGEMENT MARKET SIZE ESTIMATES & FORECAST, BY DEPLOYMENT TYPE, 2019-2032 (USD BILLIONS) TABLE 114. MEXICO ASSET RELIABILITY MANAGEMENT MARKET SIZE ESTIMATES & FORECAST, BY END USER, 2019-2032 (USD BILLIONS) TABLE 115. MEXICO ASSET RELIABILITY MANAGEMENT MARKET SIZE ESTIMATES & FORECAST, BY INDUSTRY, 2019-2032 (USD BILLIONS) TABLE 116. MEXICO ASSET RELIABILITY MANAGEMENT MARKET SIZE ESTIMATES & FORECAST, BY REGIONAL, 2019-2032 (USD BILLIONS) TABLE 117. ARGENTINA ASSET RELIABILITY MANAGEMENT MARKET SIZE ESTIMATES & FORECAST, BY SOLUTION TYPE, 2019-2032 (USD BILLIONS) TABLE 118. ARGENTINA ASSET RELIABILITY MANAGEMENT MARKET SIZE ESTIMATES & FORECAST, BY DEPLOYMENT TYPE, 2019-2032 (USD BILLIONS) TABLE 119. ARGENTINA ASSET RELIABILITY MANAGEMENT MARKET SIZE ESTIMATES & FORECAST, BY END USER, 2019-2032 (USD BILLIONS) TABLE 120. ARGENTINA ASSET RELIABILITY MANAGEMENT MARKET SIZE ESTIMATES & FORECAST, BY INDUSTRY, 2019-2032 (USD BILLIONS) TABLE 121. ARGENTINA ASSET RELIABILITY MANAGEMENT MARKET SIZE ESTIMATES & FORECAST, BY REGIONAL, 2019-2032 (USD BILLIONS) TABLE 122. REST OF SOUTH AMERICA ASSET RELIABILITY MANAGEMENT MARKET SIZE ESTIMATES & FORECAST, BY SOLUTION TYPE, 2019-2032 (USD BILLIONS) TABLE 123. REST OF SOUTH AMERICA ASSET RELIABILITY MANAGEMENT MARKET SIZE ESTIMATES & FORECAST, BY DEPLOYMENT TYPE, 2019-2032 (USD BILLIONS) TABLE 124. REST OF SOUTH AMERICA ASSET RELIABILITY MANAGEMENT MARKET SIZE ESTIMATES & FORECAST, BY END USER, 2019-2032 (USD BILLIONS) TABLE 125. REST OF SOUTH AMERICA ASSET RELIABILITY MANAGEMENT MARKET SIZE ESTIMATES & FORECAST, BY INDUSTRY, 2019-2032 (USD BILLIONS) TABLE 126. REST OF SOUTH AMERICA ASSET RELIABILITY MANAGEMENT MARKET SIZE ESTIMATES & FORECAST, BY REGIONAL, 2019-2032 (USD BILLIONS) TABLE 127. MEA ASSET RELIABILITY MANAGEMENT MARKET SIZE ESTIMATES & FORECAST, BY SOLUTION TYPE, 2019-2032 (USD BILLIONS) TABLE 128. MEA ASSET RELIABILITY MANAGEMENT MARKET SIZE ESTIMATES & FORECAST, BY DEPLOYMENT TYPE, 2019-2032 (USD BILLIONS) TABLE 129. MEA ASSET RELIABILITY MANAGEMENT MARKET SIZE ESTIMATES & FORECAST, BY END USER, 2019-2032 (USD BILLIONS) TABLE 130. MEA ASSET RELIABILITY MANAGEMENT MARKET SIZE ESTIMATES & FORECAST, BY INDUSTRY, 2019-2032 (USD BILLIONS) TABLE 131. MEA ASSET RELIABILITY MANAGEMENT MARKET SIZE ESTIMATES & FORECAST, BY REGIONAL, 2019-2032 (USD BILLIONS) TABLE 132. GCC COUNTRIES ASSET RELIABILITY MANAGEMENT MARKET SIZE ESTIMATES & FORECAST, BY SOLUTION TYPE, 2019-2032 (USD BILLIONS) TABLE 133. GCC COUNTRIES ASSET RELIABILITY MANAGEMENT MARKET SIZE ESTIMATES & FORECAST, BY DEPLOYMENT TYPE, 2019-2032 (USD BILLIONS) TABLE 134. GCC COUNTRIES ASSET RELIABILITY MANAGEMENT MARKET SIZE ESTIMATES & FORECAST, BY END USER, 2019-2032 (USD BILLIONS) TABLE 135. GCC COUNTRIES ASSET RELIABILITY MANAGEMENT MARKET SIZE ESTIMATES & FORECAST, BY INDUSTRY, 2019-2032 (USD BILLIONS) TABLE 136. GCC COUNTRIES ASSET RELIABILITY MANAGEMENT MARKET SIZE ESTIMATES & FORECAST, BY REGIONAL, 2019-2032 (USD BILLIONS) TABLE 137. SOUTH AFRICA ASSET RELIABILITY MANAGEMENT MARKET SIZE ESTIMATES & FORECAST, BY SOLUTION TYPE, 2019-2032 (USD BILLIONS) TABLE 138. SOUTH AFRICA ASSET RELIABILITY MANAGEMENT MARKET SIZE ESTIMATES & FORECAST, BY DEPLOYMENT TYPE, 2019-2032 (USD BILLIONS) TABLE 139. SOUTH AFRICA ASSET RELIABILITY MANAGEMENT MARKET SIZE ESTIMATES & FORECAST, BY END USER, 2019-2032 (USD BILLIONS) TABLE 140. SOUTH AFRICA ASSET RELIABILITY MANAGEMENT MARKET SIZE ESTIMATES & FORECAST, BY INDUSTRY, 2019-2032 (USD BILLIONS) TABLE 141. SOUTH AFRICA ASSET RELIABILITY MANAGEMENT MARKET SIZE ESTIMATES & FORECAST, BY REGIONAL, 2019-2032 (USD BILLIONS) TABLE 142. REST OF MEA ASSET RELIABILITY MANAGEMENT MARKET SIZE ESTIMATES & FORECAST, BY SOLUTION TYPE, 2019-2032 (USD BILLIONS) TABLE 143. REST OF MEA ASSET RELIABILITY MANAGEMENT MARKET SIZE ESTIMATES & FORECAST, BY DEPLOYMENT TYPE, 2019-2032 (USD BILLIONS) TABLE 144. REST OF MEA ASSET RELIABILITY MANAGEMENT MARKET SIZE ESTIMATES & FORECAST, BY END USER, 2019-2032 (USD BILLIONS) TABLE 145. REST OF MEA ASSET RELIABILITY MANAGEMENT MARKET SIZE ESTIMATES & FORECAST, BY INDUSTRY, 2019-2032 (USD BILLIONS) TABLE 146. REST OF MEA ASSET RELIABILITY MANAGEMENT MARKET SIZE ESTIMATES & FORECAST, BY REGIONAL, 2019-2032 (USD BILLIONS) TABLE 147. PRODUCT LAUNCH/PRODUCT DEVELOPMENT/APPROVAL TABLE 148. ACQUISITION/PARTNERSHIP LIST OF FIGURESFIGURE 1. MARKET SYNOPSIS FIGURE 2. NORTH AMERICA ASSET RELIABILITY MANAGEMENT MARKET ANALYSIS FIGURE 3. US ASSET RELIABILITY MANAGEMENT MARKET ANALYSIS BY SOLUTION TYPE FIGURE 4. US ASSET RELIABILITY MANAGEMENT MARKET ANALYSIS BY DEPLOYMENT TYPE FIGURE 5. US ASSET RELIABILITY MANAGEMENT MARKET ANALYSIS BY END USER FIGURE 6. US ASSET RELIABILITY MANAGEMENT MARKET ANALYSIS BY INDUSTRY FIGURE 7. US ASSET RELIABILITY MANAGEMENT MARKET ANALYSIS BY REGIONAL FIGURE 8. CANADA ASSET RELIABILITY MANAGEMENT MARKET ANALYSIS BY SOLUTION TYPE FIGURE 9. CANADA ASSET RELIABILITY MANAGEMENT MARKET ANALYSIS BY DEPLOYMENT TYPE FIGURE 10. CANADA ASSET RELIABILITY MANAGEMENT MARKET ANALYSIS BY END USER FIGURE 11. CANADA ASSET RELIABILITY MANAGEMENT MARKET ANALYSIS BY INDUSTRY FIGURE 12. CANADA ASSET RELIABILITY MANAGEMENT MARKET ANALYSIS BY REGIONAL FIGURE 13. EUROPE ASSET RELIABILITY MANAGEMENT MARKET ANALYSIS FIGURE 14. GERMANY ASSET RELIABILITY MANAGEMENT MARKET ANALYSIS BY SOLUTION TYPE FIGURE 15. GERMANY ASSET RELIABILITY MANAGEMENT MARKET ANALYSIS BY DEPLOYMENT TYPE FIGURE 16. GERMANY ASSET RELIABILITY MANAGEMENT MARKET ANALYSIS BY END USER FIGURE 17. GERMANY ASSET RELIABILITY MANAGEMENT MARKET ANALYSIS BY INDUSTRY FIGURE 18. GERMANY ASSET RELIABILITY MANAGEMENT MARKET ANALYSIS BY REGIONAL FIGURE 19. UK ASSET RELIABILITY MANAGEMENT MARKET ANALYSIS BY SOLUTION TYPE FIGURE 20. UK ASSET RELIABILITY MANAGEMENT MARKET ANALYSIS BY DEPLOYMENT TYPE FIGURE 21. UK ASSET RELIABILITY MANAGEMENT MARKET ANALYSIS BY END USER FIGURE 22. UK ASSET RELIABILITY MANAGEMENT MARKET ANALYSIS BY INDUSTRY FIGURE 23. UK ASSET RELIABILITY MANAGEMENT MARKET ANALYSIS BY REGIONAL FIGURE 24. FRANCE ASSET RELIABILITY MANAGEMENT MARKET ANALYSIS BY SOLUTION TYPE FIGURE 25. FRANCE ASSET RELIABILITY MANAGEMENT MARKET ANALYSIS BY DEPLOYMENT TYPE FIGURE 26. FRANCE ASSET RELIABILITY MANAGEMENT MARKET ANALYSIS BY END USER FIGURE 27. FRANCE ASSET RELIABILITY MANAGEMENT MARKET ANALYSIS BY INDUSTRY FIGURE 28. FRANCE ASSET RELIABILITY MANAGEMENT MARKET ANALYSIS BY REGIONAL FIGURE 29. RUSSIA ASSET RELIABILITY MANAGEMENT MARKET ANALYSIS BY SOLUTION TYPE FIGURE 30. RUSSIA ASSET RELIABILITY MANAGEMENT MARKET ANALYSIS BY DEPLOYMENT TYPE FIGURE 31. RUSSIA ASSET RELIABILITY MANAGEMENT MARKET ANALYSIS BY END USER FIGURE 32. RUSSIA ASSET RELIABILITY MANAGEMENT MARKET ANALYSIS BY INDUSTRY FIGURE 33. RUSSIA ASSET RELIABILITY MANAGEMENT MARKET ANALYSIS BY REGIONAL FIGURE 34. ITALY ASSET RELIABILITY MANAGEMENT MARKET ANALYSIS BY SOLUTION TYPE FIGURE 35. ITALY ASSET RELIABILITY MANAGEMENT MARKET ANALYSIS BY DEPLOYMENT TYPE FIGURE 36. ITALY ASSET RELIABILITY MANAGEMENT MARKET ANALYSIS BY END USER FIGURE 37. ITALY ASSET RELIABILITY MANAGEMENT MARKET ANALYSIS BY INDUSTRY FIGURE 38. ITALY ASSET RELIABILITY MANAGEMENT MARKET ANALYSIS BY REGIONAL FIGURE 39. SPAIN ASSET RELIABILITY MANAGEMENT MARKET ANALYSIS BY SOLUTION TYPE FIGURE 40. SPAIN ASSET RELIABILITY MANAGEMENT MARKET ANALYSIS BY DEPLOYMENT TYPE FIGURE 41. SPAIN ASSET RELIABILITY MANAGEMENT MARKET ANALYSIS BY END USER FIGURE 42. SPAIN ASSET RELIABILITY MANAGEMENT MARKET ANALYSIS BY INDUSTRY FIGURE 43. SPAIN ASSET RELIABILITY MANAGEMENT MARKET ANALYSIS BY REGIONAL FIGURE 44. REST OF EUROPE ASSET RELIABILITY MANAGEMENT MARKET ANALYSIS BY SOLUTION TYPE FIGURE 45. REST OF EUROPE ASSET RELIABILITY MANAGEMENT MARKET ANALYSIS BY DEPLOYMENT TYPE FIGURE 46. REST OF EUROPE ASSET RELIABILITY MANAGEMENT MARKET ANALYSIS BY END USER FIGURE 47. REST OF EUROPE ASSET RELIABILITY MANAGEMENT MARKET ANALYSIS BY INDUSTRY FIGURE 48. REST OF EUROPE ASSET RELIABILITY MANAGEMENT MARKET ANALYSIS BY REGIONAL FIGURE 49. APAC ASSET RELIABILITY MANAGEMENT MARKET ANALYSIS FIGURE 50. CHINA ASSET RELIABILITY MANAGEMENT MARKET ANALYSIS BY SOLUTION TYPE FIGURE 51. CHINA ASSET RELIABILITY MANAGEMENT MARKET ANALYSIS BY DEPLOYMENT TYPE FIGURE 52. CHINA ASSET RELIABILITY MANAGEMENT MARKET ANALYSIS BY END USER FIGURE 53. CHINA ASSET RELIABILITY MANAGEMENT MARKET ANALYSIS BY INDUSTRY FIGURE 54. CHINA ASSET RELIABILITY MANAGEMENT MARKET ANALYSIS BY REGIONAL FIGURE 55. INDIA ASSET RELIABILITY MANAGEMENT MARKET ANALYSIS BY SOLUTION TYPE FIGURE 56. INDIA ASSET RELIABILITY MANAGEMENT MARKET ANALYSIS BY DEPLOYMENT TYPE FIGURE 57. INDIA ASSET RELIABILITY MANAGEMENT MARKET ANALYSIS BY END USER FIGURE 58. INDIA ASSET RELIABILITY MANAGEMENT MARKET ANALYSIS BY INDUSTRY FIGURE 59. INDIA ASSET RELIABILITY MANAGEMENT MARKET ANALYSIS BY REGIONAL FIGURE 60. JAPAN ASSET RELIABILITY MANAGEMENT MARKET ANALYSIS BY SOLUTION TYPE FIGURE 61. JAPAN ASSET RELIABILITY MANAGEMENT MARKET ANALYSIS BY DEPLOYMENT TYPE FIGURE 62. JAPAN ASSET RELIABILITY MANAGEMENT MARKET ANALYSIS BY END USER FIGURE 63. JAPAN ASSET RELIABILITY MANAGEMENT MARKET ANALYSIS BY INDUSTRY FIGURE 64. JAPAN ASSET RELIABILITY MANAGEMENT MARKET ANALYSIS BY REGIONAL FIGURE 65. SOUTH KOREA ASSET RELIABILITY MANAGEMENT MARKET ANALYSIS BY SOLUTION TYPE FIGURE 66. SOUTH KOREA ASSET RELIABILITY MANAGEMENT MARKET ANALYSIS BY DEPLOYMENT TYPE FIGURE 67. SOUTH KOREA ASSET RELIABILITY MANAGEMENT MARKET ANALYSIS BY END USER FIGURE 68. SOUTH KOREA ASSET RELIABILITY MANAGEMENT MARKET ANALYSIS BY INDUSTRY FIGURE 69. SOUTH KOREA ASSET RELIABILITY MANAGEMENT MARKET ANALYSIS BY REGIONAL FIGURE 70. MALAYSIA ASSET RELIABILITY MANAGEMENT MARKET ANALYSIS BY SOLUTION TYPE FIGURE 71. MALAYSIA ASSET RELIABILITY MANAGEMENT MARKET ANALYSIS BY DEPLOYMENT TYPE FIGURE 72. MALAYSIA ASSET RELIABILITY MANAGEMENT MARKET ANALYSIS BY END USER FIGURE 73. MALAYSIA ASSET RELIABILITY MANAGEMENT MARKET ANALYSIS BY INDUSTRY FIGURE 74. MALAYSIA ASSET RELIABILITY MANAGEMENT MARKET ANALYSIS BY REGIONAL FIGURE 75. THAILAND ASSET RELIABILITY MANAGEMENT MARKET ANALYSIS BY SOLUTION TYPE FIGURE 76. THAILAND ASSET RELIABILITY MANAGEMENT MARKET ANALYSIS BY DEPLOYMENT TYPE FIGURE 77. THAILAND ASSET RELIABILITY MANAGEMENT MARKET ANALYSIS BY END USER FIGURE 78. THAILAND ASSET RELIABILITY MANAGEMENT MARKET ANALYSIS BY INDUSTRY FIGURE 79. THAILAND ASSET RELIABILITY MANAGEMENT MARKET ANALYSIS BY REGIONAL FIGURE 80. INDONESIA ASSET RELIABILITY MANAGEMENT MARKET ANALYSIS BY SOLUTION TYPE FIGURE 81. INDONESIA ASSET RELIABILITY MANAGEMENT MARKET ANALYSIS BY DEPLOYMENT TYPE FIGURE 82. INDONESIA ASSET RELIABILITY MANAGEMENT MARKET ANALYSIS BY END USER FIGURE 83. INDONESIA ASSET RELIABILITY MANAGEMENT MARKET ANALYSIS BY INDUSTRY FIGURE 84. INDONESIA ASSET RELIABILITY MANAGEMENT MARKET ANALYSIS BY REGIONAL FIGURE 85. REST OF APAC ASSET RELIABILITY MANAGEMENT MARKET ANALYSIS BY SOLUTION TYPE FIGURE 86. REST OF APAC ASSET RELIABILITY MANAGEMENT MARKET ANALYSIS BY DEPLOYMENT TYPE FIGURE 87. REST OF APAC ASSET RELIABILITY MANAGEMENT MARKET ANALYSIS BY END USER FIGURE 88. REST OF APAC ASSET RELIABILITY MANAGEMENT MARKET ANALYSIS BY INDUSTRY FIGURE 89. REST OF APAC ASSET RELIABILITY MANAGEMENT MARKET ANALYSIS BY REGIONAL FIGURE 90. SOUTH AMERICA ASSET RELIABILITY MANAGEMENT MARKET ANALYSIS FIGURE 91. BRAZIL ASSET RELIABILITY MANAGEMENT MARKET ANALYSIS BY SOLUTION TYPE FIGURE 92. BRAZIL ASSET RELIABILITY MANAGEMENT MARKET ANALYSIS BY DEPLOYMENT TYPE FIGURE 93. BRAZIL ASSET RELIABILITY MANAGEMENT MARKET ANALYSIS BY END USER FIGURE 94. BRAZIL ASSET RELIABILITY MANAGEMENT MARKET ANALYSIS BY INDUSTRY FIGURE 95. BRAZIL ASSET RELIABILITY MANAGEMENT MARKET ANALYSIS BY REGIONAL FIGURE 96. MEXICO ASSET RELIABILITY MANAGEMENT MARKET ANALYSIS BY SOLUTION TYPE FIGURE 97. MEXICO ASSET RELIABILITY MANAGEMENT MARKET ANALYSIS BY DEPLOYMENT TYPE FIGURE 98. MEXICO ASSET RELIABILITY MANAGEMENT MARKET ANALYSIS BY END USER FIGURE 99. MEXICO ASSET RELIABILITY MANAGEMENT MARKET ANALYSIS BY INDUSTRY FIGURE 100. MEXICO ASSET RELIABILITY MANAGEMENT MARKET ANALYSIS BY REGIONAL FIGURE 101. ARGENTINA ASSET RELIABILITY MANAGEMENT MARKET ANALYSIS BY SOLUTION TYPE FIGURE 102. ARGENTINA ASSET RELIABILITY MANAGEMENT MARKET ANALYSIS BY DEPLOYMENT TYPE FIGURE 103. ARGENTINA ASSET RELIABILITY MANAGEMENT MARKET ANALYSIS BY END USER FIGURE 104. ARGENTINA ASSET RELIABILITY MANAGEMENT MARKET ANALYSIS BY INDUSTRY FIGURE 105. ARGENTINA ASSET RELIABILITY MANAGEMENT MARKET ANALYSIS BY REGIONAL FIGURE 106. REST OF SOUTH AMERICA ASSET RELIABILITY MANAGEMENT MARKET ANALYSIS BY SOLUTION TYPE FIGURE 107. REST OF SOUTH AMERICA ASSET RELIABILITY MANAGEMENT MARKET ANALYSIS BY DEPLOYMENT TYPE FIGURE 108. REST OF SOUTH AMERICA ASSET RELIABILITY MANAGEMENT MARKET ANALYSIS BY END USER FIGURE 109. REST OF SOUTH AMERICA ASSET RELIABILITY MANAGEMENT MARKET ANALYSIS BY INDUSTRY FIGURE 110. REST OF SOUTH AMERICA ASSET RELIABILITY MANAGEMENT MARKET ANALYSIS BY REGIONAL FIGURE 111. MEA ASSET RELIABILITY MANAGEMENT MARKET ANALYSIS FIGURE 112. GCC COUNTRIES ASSET RELIABILITY MANAGEMENT MARKET ANALYSIS BY SOLUTION TYPE FIGURE 113. GCC COUNTRIES ASSET RELIABILITY MANAGEMENT MARKET ANALYSIS BY DEPLOYMENT TYPE FIGURE 114. GCC COUNTRIES ASSET RELIABILITY MANAGEMENT MARKET ANALYSIS BY END USER FIGURE 115. GCC COUNTRIES ASSET RELIABILITY MANAGEMENT MARKET ANALYSIS BY INDUSTRY FIGURE 116. GCC COUNTRIES ASSET RELIABILITY MANAGEMENT MARKET ANALYSIS BY REGIONAL FIGURE 117. SOUTH AFRICA ASSET RELIABILITY MANAGEMENT MARKET ANALYSIS BY SOLUTION TYPE FIGURE 118. SOUTH AFRICA ASSET RELIABILITY MANAGEMENT MARKET ANALYSIS BY DEPLOYMENT TYPE FIGURE 119. SOUTH AFRICA ASSET RELIABILITY MANAGEMENT MARKET ANALYSIS BY END USER FIGURE 120. SOUTH AFRICA ASSET RELIABILITY MANAGEMENT MARKET ANALYSIS BY INDUSTRY FIGURE 121. SOUTH AFRICA ASSET RELIABILITY MANAGEMENT MARKET ANALYSIS BY REGIONAL FIGURE 122. REST OF MEA ASSET RELIABILITY MANAGEMENT MARKET ANALYSIS BY SOLUTION TYPE FIGURE 123. REST OF MEA ASSET RELIABILITY MANAGEMENT MARKET ANALYSIS BY DEPLOYMENT TYPE FIGURE 124. REST OF MEA ASSET RELIABILITY MANAGEMENT MARKET ANALYSIS BY END USER FIGURE 125. REST OF MEA ASSET RELIABILITY MANAGEMENT MARKET ANALYSIS BY INDUSTRY FIGURE 126. REST OF MEA ASSET RELIABILITY MANAGEMENT MARKET ANALYSIS BY REGIONAL FIGURE 127. KEY BUYING CRITERIA OF ASSET RELIABILITY MANAGEMENT MARKET FIGURE 128. RESEARCH PROCESS OF MRFR FIGURE 129. DRO ANALYSIS OF ASSET RELIABILITY MANAGEMENT MARKET FIGURE 130. DRIVERS IMPACT ANALYSIS: ASSET RELIABILITY MANAGEMENT MARKET FIGURE 131. RESTRAINTS IMPACT ANALYSIS: ASSET RELIABILITY MANAGEMENT MARKET FIGURE 132. SUPPLY / VALUE CHAIN: ASSET RELIABILITY MANAGEMENT MARKET FIGURE 133. ASSET RELIABILITY MANAGEMENT MARKET, BY SOLUTION TYPE, 2024 (% SHARE) FIGURE 134. ASSET RELIABILITY MANAGEMENT MARKET, BY SOLUTION TYPE, 2019 TO 2032 (USD Billions) FIGURE 135. ASSET RELIABILITY MANAGEMENT MARKET, BY DEPLOYMENT TYPE, 2024 (% SHARE) FIGURE 136. ASSET RELIABILITY MANAGEMENT MARKET, BY DEPLOYMENT TYPE, 2019 TO 2032 (USD Billions) FIGURE 137. ASSET RELIABILITY MANAGEMENT MARKET, BY END USER, 2024 (% SHARE) FIGURE 138. ASSET RELIABILITY MANAGEMENT MARKET, BY END USER, 2019 TO 2032 (USD Billions) FIGURE 139. ASSET RELIABILITY MANAGEMENT MARKET, BY INDUSTRY, 2024 (% SHARE) FIGURE 140. ASSET RELIABILITY MANAGEMENT MARKET, BY INDUSTRY, 2019 TO 2032 (USD Billions) FIGURE 141. ASSET RELIABILITY MANAGEMENT MARKET, BY REGIONAL, 2024 (% SHARE) FIGURE 142. ASSET RELIABILITY MANAGEMENT MARKET, BY REGIONAL, 2019 TO 2032 (USD Billions) FIGURE 143. BENCHMARKING OF MAJOR COMPETITORS
    Report Infographic
    Free Sample Request

    Kindly complete the form below to receive a free sample of this Report

    Customer Strories

    “I am very pleased with how market segments have been defined in a relevant way for my purposes (such as "Portable Freezers & refrigerators" and "last-mile"). In general the report is well structured. Thanks very much for your efforts.”

    Victoria Milne Founder
    Case Study

    Chemicals and Materials