• Cat-intel
  • MedIntelliX
  • Resources
  • About Us
  • Request Free Sample ×

    Kindly complete the form below to receive a free sample of this Report

    Leading companies partner with us for data-driven Insights

    clients tt-cursor

    Aluminum Extruded Products Market

    ID: MRFR/CnM/2227-CR
    201 Pages
    Priya Nagrale
    February 2021

    Aluminum Extruded Products Market Research Report Information By Product Type (Mill-Finished, Anodized and Powder-Coated), By Alloy Type (6000 Series Aluminum Alloys, 7000 Series Aluminum Alloys), By End-Use (Construction, Automotive) - Forecast till 2030

    Share:
    Download PDF ×

    We do not share your information with anyone. However, we may send you emails based on your report interest from time to time. You may contact us at any time to opt-out.

    Aluminum-Extruded Products Market Research Report - Forecast to 2030 Infographic
    Purchase Options
    $ 4,950.0
    $ 5,950.0
    $ 7,250.0
    Table of Contents

    Aluminum Extruded Products Market Summary

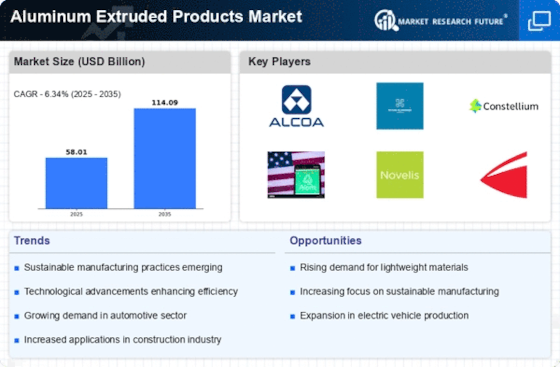
    As per Market Research Future Analysis, the Global Aluminum Extruded Products Market was valued at USD 54.55 Billion in 2023 and is projected to reach USD 94.84 Billion by 2032, growing at a CAGR of 6.34% from 2024 to 2032. The market is significantly influenced by the construction and automotive sectors, with rising demand for aluminum in these industries. The COVID-19 pandemic has disrupted production and demand, but innovations and partnerships, such as Hindalco's collaboration with Metra SpA, are expected to drive recovery and growth. Environmental concerns are prompting manufacturers to adopt sustainable practices, further shaping market dynamics.

    Key Market Trends & Highlights

    The aluminum extruded products market is witnessing significant growth driven by various factors.

    • Market size in 2023: USD 54.55 Billion; projected to reach USD 94.84 Billion by 2032.
    • CAGR of 6.34% expected during the forecast period from 2024 to 2032.
    • APAC region expected to hold 63% market share by 2028, with a 7% CAGR.
    • Rising demand in construction and automotive sectors is a key growth driver.

    Market Size & Forecast

    2023 Market Size USD 54.55 Billion
    2024 Market Size USD 58.01 Billion
    2032 Market Size USD 94.84 Billion

    Major Players

    Hindalco Industries Limited, Balexco, Century Extrusions Limited, QALEX, Bonnell Aluminium, Banco Aluminium Ltd, Constellium, ETEM GROUP, TALCO, Gulf Extrusions Co. LLC, China Hongquiao Group Limited, Zahit Aluminium, Sainty Industry Co., Ltd, Alcoa Inc.

    Aluminum Extruded Products Market Trends

    The global aluminum extruded products market appears poised for growth, driven by increasing demand across various sectors, including construction and automotive, which suggests a robust trajectory for the industry.

    U.S. Geological Survey

    Aluminum Extruded Products Market Drivers

    Market Trends and Projections

    Rising Demand from Automotive Sector

    The Global Aluminum Extruded Products Market Industry experiences a notable surge in demand from the automotive sector, driven by the industry's shift towards lightweight materials to enhance fuel efficiency. Aluminum extrusions are increasingly utilized in vehicle frames, body panels, and structural components. This trend aligns with the global automotive industry's commitment to sustainability and emissions reduction. In 2024, the market is projected to reach 58.0 USD Billion, reflecting the automotive sector's pivotal role in driving growth. As manufacturers seek to comply with stringent regulations, the adoption of aluminum extruded products is likely to accelerate, contributing significantly to the industry's expansion.

    Growing Demand in Construction Sector

    The construction sector's growing demand for aluminum extruded products is a key driver of the Global Aluminum Extruded Products Market Industry. Aluminum's lightweight nature, coupled with its resistance to corrosion, makes it an ideal choice for various applications, including window frames, roofing, and facades. As urbanization accelerates globally, the need for efficient and sustainable building materials intensifies. The market is expected to benefit from this trend, with projections indicating a compound annual growth rate of 6.34% from 2025 to 2035. This growth reflects the construction industry's ongoing commitment to incorporating aluminum extrusions in modern architectural designs.

    Infrastructure Development Initiatives

    Infrastructure development initiatives worldwide are propelling the Global Aluminum Extruded Products Market Industry forward. Governments are investing heavily in modernizing transportation networks, bridges, and buildings, which increasingly incorporate aluminum extrusions due to their strength, durability, and lightweight properties. For instance, major infrastructure projects in emerging economies are expected to boost demand for aluminum extruded products. This trend is anticipated to sustain growth, with the market projected to reach 114.0 USD Billion by 2035. The emphasis on sustainable construction practices further enhances the appeal of aluminum, as it is recyclable and contributes to energy-efficient designs.

    Technological Advancements in Manufacturing

    Technological advancements in manufacturing processes are significantly influencing the Global Aluminum Extruded Products Market Industry. Innovations such as 3D printing and advanced extrusion techniques are enhancing production efficiency and product customization. These developments enable manufacturers to produce complex shapes and designs that meet diverse customer requirements. As industries increasingly demand tailored solutions, the ability to innovate in aluminum extrusion becomes a competitive advantage. This trend is likely to drive market growth, as companies invest in state-of-the-art technologies to improve their offerings and respond to evolving market needs.

    Environmental Regulations and Sustainability

    Increasing environmental regulations and a global shift towards sustainability are driving the Global Aluminum Extruded Products Market Industry. Governments and organizations are implementing stringent policies aimed at reducing carbon footprints and promoting the use of recyclable materials. Aluminum, being highly recyclable, aligns well with these sustainability goals. Industries are increasingly adopting aluminum extruded products as part of their efforts to comply with environmental standards. This trend not only supports market growth but also encourages innovation in recycling technologies and sustainable manufacturing practices, positioning aluminum as a preferred material in various sectors.

    Market Segment Insights

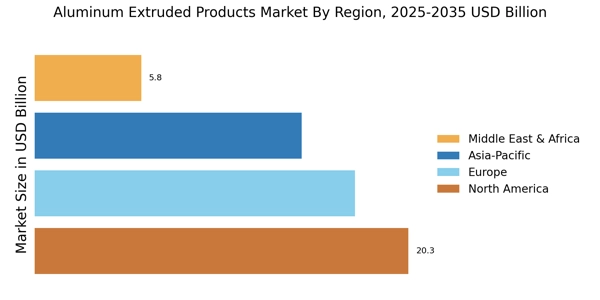
    Regional Insights

    Key Companies in the Aluminum Extruded Products Market market include

    Industry Developments

    In September 2023, Hindalco Industries Ltd disclosed that it had signed a technology deal with Metra SpA, which is an Italian company recognized globally for its ability to manufacture structured and high-quality value-added aluminum extrusions.

    By August 2023, Hydro was planning to upgrade its Lucé aluminum extrusion facility at a cost of NOK 67 million (about EUR 6 million) while setting aside additional funds for employee training, plant modernization, equipment replacement, and other infrastructure upgrade projects.

    Aluminium Bahrain (Alba) recently broadened its family of AA6060 alloys by introducing one more alloy called 6060.HE, in August 2023, will specifically target Alba’s extruder customers’ needs.

    In December 2021, Aluminum Products Company took part in the International Copper Alliance membership program.

    Arconic Corporation purchased a Group annuity contract priced at USD 1 billion, thereby reducing gross pension obligations for the company by April 2021.

    Q2 2025: In April 2025, Alcoa established a joint venture with IGNIS EQT, supporting the San Ciprian plant in Spain. Alcoa committed to providing up to USD 108 million in operations funding. Alcoa announced a joint venture with IGNIS EQT to support the San Ciprian aluminum plant in Spain, with Alcoa committing up to $108 million in operational funding to ensure continued supply of high-quality billets and enhance plant operations.

    Q1 2024: The global adoption of ISO 6361-2:2014 in January 2024 harmonizes mechanical property standards for extruded aluminum profiles. In January 2024, the international standard ISO 6361-2:2014 was globally adopted, harmonizing mechanical property standards for extruded aluminum profiles and facilitating cross-border compliance for suppliers.

    Intended Audience

      • Aluminum-extruded products traders and manufacturers
      • OEMs
      • Manufacturing and production organizations
      • Automotive manufacturers and suppliers
      • Construction companies and organizations

    Future Outlook

    Aluminum Extruded Products Market Future Outlook

    The Aluminum Extruded Products Market is projected to grow at a 6.34% CAGR from 2024 to 2035, driven by rising demand in automotive, construction, and renewable energy sectors.

    New opportunities lie in:

    • Invest in advanced manufacturing technologies to enhance production efficiency and reduce costs.
    • Develop lightweight aluminum solutions for electric vehicles to capture emerging automotive trends.
    • Expand into emerging markets with tailored products to meet local infrastructure needs.

    By 2035, the Aluminum Extruded Products Market is expected to achieve robust growth, positioning itself as a leader in sustainable materials.

    Market Segmentation

    Report Overview

    • Recent Developments
    • Competitive Landscape
    • Regional Analysis
    • Segment Overview
    • Study Objectives
    • Technology Analysis
    • Market Dynamics
    • COVID 19 Analysis
    • Market Overview

    Study Objectives

    • The aluminum-extruded products market report helps in drawing a global market competition based on the functioning of the markets and the expansion of the market size of different players across the globe during the forecast period ending in 2028.
    • The market report highlights the functioning of the market followed by the basis on which the global market is segmented and functioning to meet the rising needs of the target audience in various locations.
    • The aluminum-extruded products market report helps in understanding the global functioning of the market followed by the dynamics like growth opportunities and drivers that will help in the functioning of the market in the forecast period. The report also understands the challenges that might restrain the market from growing.

    COVID 19 Analysis

    • Alcoa Inc. (U.S.)
    • Sainty Industry Co., Ltd
    • Zahit Aluminium
    • China Hongquiao Group Limited (China)
    • Gulf Extrusions Co. LLC (UAE)
    • TALCO (India)
    • ETEM GROUP
    • Constellium (The Netherlands)
    • Banco Aluminium Ltd
    • Bonnell Aluminium (US)
    • QALEX (Qatar)
    • Century Extrusions Limited (India)
    • Balexco BAHRAIN ALUMINIUM EXTRUSION COMPANY
    • Hindalco Industries Limited (India)

    Intended Audience

    • Construction companies and organizations
    • Automotive manufacturers and suppliers
    • Manufacturing and production organizations
    • OEMs
    • Aluminum-extruded products traders and manufacturers

    Global Aluminum Extruded Products Market Overview

    • Alcoa Inc. (U.S.)
    • Sainty Industry Co., Ltd
    • Zahit Aluminium
    • China Hongquiao Group Limited (China)
    • Gulf Extrusions Co. LLC (UAE)
    • TALCO (India)
    • ETEM GROUP
    • Constellium (The Netherlands)
    • Banco Aluminium Ltd
    • Bonnell Aluminium (US)
    • QALEX (Qatar)
    • Century Extrusions Limited (India)
    • Balexco BAHRAIN ALUMINIUM EXTRUSION COMPANY
    • Hindalco Industries Limited (India)

    Aluminum Extruded Products Market Competitive Landscape

    • Alcoa Inc. (U.S.)
    • Sainty Industry Co., Ltd
    • Zahit Aluminium
    • China Hongquiao Group Limited (China)
    • Gulf Extrusions Co. LLC (UAE)
    • TALCO (India)
    • ETEM GROUP
    • Constellium (The Netherlands)
    • Banco Aluminium Ltd
    • Bonnell Aluminium (US)
    • QALEX (Qatar)
    • Century Extrusions Limited (India)
    • Balexco BAHRAIN ALUMINIUM EXTRUSION COMPANY
    • Hindalco Industries Limited (India)

    Report Scope

    Attribute/Metric Details
      Market Size 2023 USD 54.55 Billion
      Market Size 2024 USD 58.01 Billion
      Market Size 2032 USD 94.84 Billion
      CAGR  6.34%  (2024-2032)
      Base Year   2023
      Forecast Period   2024 to 2032
      Historical Data   2019 & 2020
      Forecast Units   Value (USD Billion)
      Report Coverage   Revenue Forecast, Competitive Landscape, Growth Factors, and Trends
      Segments Covered   By Product Type, Alloy Type, End-Use Industry and Region
      Geographies Covered   North America, Europe, Asia-Pacific, and Rest of the World (RoW)
      Key Vendors   Hydro Extruded Solutions (Norway),China Zhongwang Holdings Limited (China), Arconic (US), Hindalco Industries Limited (India), Constellium (The Netherlands),Century Extrusions Limited (India),QALEX (Qatar),Bonnell Aluminium (US),Gulf Extrusions Co. LLC (UAE),TALCO (India),Balexco BAHRAIN ALUMINIUM EXTRUSION COMPANY,Zahit Aluminium, ETEM GROUP, Sainty Industry Co., Ltd, Banco Aluminium Ltd
      Key Market Opportunities   Growing Popularity of Electric Vehicle to Boost Growth Opportunities
      Key Market Drivers   Growing Demand for Aluminum in Constriction Sector to Support Market Expansion

    Market Highlights

    Author
    Priya Nagrale
    Senior Research Analyst

    With an experience of over five years in market research industry (Chemicals & Materials domain), I gather and analyze market data from diverse sources to produce results, which are then presented back to a client. Also, provide recommendations based on the findings. As a Senior Research Analyst, I perform quality checks (QC) for market estimations, QC for reports, and handle queries and work extensively on client customizations. Also, handle the responsibilities of client proposals, report planning, report finalization, and execution

    Leave a Comment

    FAQs

    At what CAGR is the aluminium-extruded products market projected to grow during the forecast period?

    Aluminium-extruded products market projected to grow at a 6.34% CAGR between 2024-2032.

    What will be the value of the aluminium-extruded products market during the forecast period?

    Aluminium-extruded products market is predicted to touch USD 94.84 billion by 2032.

    Which region is expected to lead the aluminium-extruded products market?

    The Asia Pacific is expected to lead the aluminium-extruded products market.

    Which end use segment will have the largest share in the aluminium-extruded products market?

    The construction segment will have the largest share in the aluminium-extruded products market.

    Which product type will lead the aluminium-extruded products market?

    The mill-finished segment will lead the aluminium-extruded products market.

    1. EXECUTIVE SUMMARY
      1. MARKET ATTRACTIVENESS ANALYSIS 18
    2. GLOBAL SUPERALLOYS MARKET, BY PRODUCT 19
      1. GLOBAL SUPERALLOYS MARKET, BY
    3. APPLICATION 20
      1. GLOBAL SUPERALLOYS MARKET, BY REGION 21
    4. MARKET INTRODUCTION
      1. DEFINITION 22
      2. SCOPE OF THE STUDY 22
      3. MARKET
    5. STRUCTURE 23
    6. RESEARCH METHODOLOGY
      1. RESEARCH PROCESS 24
      2. PRIMARY
    7. RESEARCH 25
      1. SECONDARY RESEARCH 25
      2. MARKET SIZE ESTIMATION 26
      3. FORECAST MODEL 28
      4. LIST OF ASSUMPTIONS 29
    8. MARKET INSIGHTS
    9. MARKET DYNAMICS
      1. INTRODUCTION 33
      2. DRIVERS 34
    10. INCREASING DEMAND FOR SUPERALLOYS IN THE AEROSPACE & DEFENSE INDUSTRY 34
      1. DEVELOPMENT OF ADVANCED SUPERALLOYS FOR USE IN THE ENERGY AND POWER INDUSTRY
        1. DRIVERS IMPACT ANALYSIS 36
      2. RESTRAINTS 36
        1. AVAILABILITY
    11. OF SUBSTITUTES 36
      1. RESTRAINTS IMPACT ANALYSIS 37
      2. OPPORTUNITIES
        1. GROWING DEMAND FOR SUPERALLOYS IN DEVELOPING COUNTRIES OF ASIA-PACIFIC
      3. CHALLENGE 39
        1. VOLATILE PRICES OF NICKEL 39
    12. MARKET FACTOR ANALYSIS
      1. SUPPLY CHAIN ANALYSIS 41
        1. RAW MATERIALS SUPPLIERS 42
        2. SUPERALLOY MANUFACTURERS 42
        3. DISTRIBUTION CHANNEL 42
    13. END USE 43
      1. PORTER’S FIVE FORCES MODEL 43
        1. THREAT OF NEW
    14. ENTRANTS 44
      1. INTENSITY OF COMPETITIVE RIVALRY 44
        1. THREAT OF
    15. SUBSTITUTES 44
      1. BARGAINING POWER OF SUPPLIERS 44
        1. BARGAINING
    16. POWER OF BUYERS 45
    17. GLOBAL SUPERALLOYS MARKET, BY PRODUCT
      1. INTRODUCTION
      2. NICKEL-BASED 48
      3. COBALT-BASED 49
      4. IRON-BASED 50
    18. GLOBAL SUPERALLOYS MARKET, BY APPLICATION
      1. INTRODUCTION 52
      2. AEROSPACE
    19. & DEFENSE 54
      1. ENERGY 55
      2. INDUSTRIAL GAS TURBINE 56
    20. AUTOMOTIVE 57
      1. OIL & GAS 58
      2. OTHERS 59
    21. GLOBAL SUPERALLOYS
    22. MARKET, BY REGION
      1. INTRODUCTION 61
      2. NORTH AMERICA 65
    23. US 68
      1. CANADA 70
      2. EUROPE 72
        1. GERMANY 75
        2. RUSSIA
        3. UK 79
        4. FRANCE 81
        5. SPAIN 83
        6. ITALY 85
        7. POLAND 87
        8. REST OF EUROPE 89
      3. ASIA PACIFIC 91
    24. CHINA 94
      1. JAPAN 96
        1. INDIA 98
        2. SOUTH KOREA 100
    25. INDONESIA 102
      1. AUSTRALIA & NEW ZEALAND 104
        1. REST OF ASIA
    26. PACIFIC 106
      1. LATIN AMERICA 108
        1. BRAZIL 111
        2. MEXICO 113
        3. ARGENTINA 115
        4. REST OF LATIN AMERICA 117
      2. THE MIDDLE EAST
    27. AND AFRICA 119
      1. TURKEY 122
        1. EGYPT 124
        2. SAUDI ARABIA
        3. UAE 128
        4. ISRAEL 130
        5. REST OF MIDDLE EAST AND
    28. AFRICA 132
    29. COMPETITIVE LANDSCAPE
      1. COMPETITIVE LANDSCAPE 134
        1. INTRODUCTION 134
        2. KEY DEVELOPMENT ANALYSIS 134
        3. MARKET
    30. STRATEGY ANALYSIS 135
    31. COMPANY PROFILES
      1. HAYNES INTERNATIONAL 136
        1. COMPANY OVERVIEW 136
        2. FINANCIAL OVERVIEW 137
        3. PRODUCTS
    32. OFFERED 137
      1. KEY DEVELOPMENTS 138
        1. SWOT ANALYSIS 139
    33. KEY STRATEGIES 139
      1. ALLEGHENY TECHNOLOGIES INC 140
        1. COMPANY
    34. OVERVIEW 140
      1. FINANCIAL OVERVIEW 141
        1. PRODUCTS OFFERED 142
        2. KEY DEVELOPMENTS 143
        3. SWOT ANALYSIS 144
        4. KEY STRATEGIES
      2. SPECIAL METALS CORPORATION 145
        1. COMPANY OVERVIEW 145
        2. FINANCIAL OVERVIEW 145
        3. PRODUCTS OFFERED 145
        4. KEY
    35. DEVELOPMENTS 146
      1. SWOT ANALYSIS 147
        1. KEY STRATEGIES 147
      2. APERAM 148
        1. COMPANY OVERVIEW 148
        2. FINANCIAL OVERVIEW
        3. PRODUCTS OFFERED 149
        4. KEY DEVELOPMENTS 151
    36. SWOT ANALYSIS 152
      1. KEY STRATEGIES 152
      2. AMG ADVANCED METALLURGICAL
    37. GROUP 153
      1. COMPANY OVERVIEW 153
        1. FINANCIAL OVERVIEW 154
        2. PRODUCTS OFFERED 154
        3. KEY DEVELOPMENTS 155
        4. SWOT
    38. ANALYSIS 156
      1. KEY STRATEGIES 156
      2. DONCASTERS GROUP LTD 157
        1. COMPANY OVERVIEW 157
        2. FINANCIAL OVERVIEW 158
        3. PRODUCTS
    39. OFFERED 158
      1. KEY DEVELOPMENTS 159
        1. SWOT ANALYSIS 159
    40. KEY STRATEGIES 159
      1. SUPREME ENGINEERING LTD 160
        1. COMPANY OVERVIEW
        2. FINANCIAL OVERVIEW 160
        3. PRODUCTS OFFERED 161
    41. KEY DEVELOPMENTS 161
      1. SWOT ANALYSIS 162
        1. KEY STRATEGIES 162
      2. THYSSENKRUPP AEROSPACE GERMANY GMBH 163
        1. COMPANY OVERVIEW 163
        2. FINANCIAL OVERVIEW 164
        3. PRODUCTS OFFERED 165
        4. KEY
    42. DEVELOPMENTS 166
      1. SWOT ANALYSIS 167
        1. KEY STRATEGIES 167
      2. CARPENTER TECHNOLOGY CORPORATION 168
        1. COMPANY OVERVIEW 168
        2. FINANCIAL OVERVIEW 169
        3. PRODUCTS OFFERED 169
        4. KEY
    43. DEVELOPMENTS 170
      1. SWOT ANALYSIS 171
        1. KEY STRATEGIES 171
      2. VDM METALS 172
        1. COMPANY OVERVIEW 172
        2. FINANCIAL
    44. OVERVIEW 172
      1. PRODUCTS OFFERED 172
        1. KEY DEVELOPMENTS 172
        2. SWOT ANALYSIS 173
        3. KEY STRATEGIES 173
    45. APPENDIX
      1. REFERENCES 174
      2. RELATED REPORTS 174
    46. LIST OF TABLES
    47. LIST OF ASSUMPTIONS 29
    48. (USD MILLION) 46
    49. (USD MILLION) 48
    50. 2027 (TONS) 48
    51. REGION, 2020-2027 (USD MILLION) 49
    52. BY REGION, 2020-2027 (TONS) 49
    53. BY REGION, 2020-2027 (USD MILLION) 50
    54. IRON-BASED, BY REGION, 2020-2027 (TONS) 51
    55. BY APPLICATION, 2020-2027 (USD MILLION) 53
    56. BY APPLICATION, 2020-2027 (TONS) 54
    57. AEROSPACE & DEFENSE, BY REGION, 2020-2027 (USD MILLION) 54
    58. SUPERALLOYS MARKET FOR AEROSPACE & DEFENSE, BY REGION, 2020-2027 (TONS) 55
    59. 2027 (USD MILLION) 56
    60. GAS TURBINE, BY REGION, 2020-2027 (TONS) 57
    61. FOR AUTOMOTIVE, BY REGION, 2020-2027 (USD MILLION) 57
    62. MARKET FOR AUTOMOTIVE, BY REGION, 2020-2027 (TONS) 58
    63. MARKET FOR OIL & GAS, BY REGION, 2020-2027 (USD MILLION) 58
    64. SUPERALLOYS MARKET FOR OIL & GAS, BY REGION, 2020-2027 (TONS) 59
    65. GLOBAL SUPERALLOYS MARKET FOR OTHERS, BY REGION, 2020-2027 (USD MILLION) 59
    66. GLOBAL SUPERALLOYS MARKET, BY REGION, 2020-2027 (TONS) 63
    67. SUPERALLOYS MARKET, BY PRODUCT, 2020-2027 (USD MILLION) 64
    68. SUPERALLOYS MARKET, BY PRODUCT, 2020-2027 (TONS) 64
    69. MARKET, BY APPLICATION, 2020-2027 (USD MILLION) 64
    70. MARKET, BY APPLICATION, 2020-2027 (TONS) 65
    71. MARKET, BY COUNTRY, 2020-2027 (USD MILLION) 65
    72. MARKET, BY COUNTRY, 2020-2027 (TONS) 66
    73. MARKET, BY PRODUCT, 2020-2027 (USD MILLION) 66
    74. MARKET, BY PRODUCT, 2020-2027 (TONS) 66
    75. MARKET, BY APPLICATION, 2020-2027 (USD MILLION) 67
    76. MARKET, BY APPLICATION, 2020-2027 (TONS) 67
    77. BY PRODUCT, 2020-2027 (USD MILLION) 68
    78. PRODUCT, 2020-2027 (TONS) 68
    79. 2027 (USD MILLION) 69
    80. 2027 (TONS) 69
    81. (USD MILLION) 70
    82. (TONS) 70
    83. MILLION) 71
    84. EUROPE SUPERALLOYS MARKET, BY PRODUCT, 2020-2027 (USD MILLION) 73
    85. EUROPE SUPERALLOYS MARKET, BY PRODUCT, 2020-2027 (TONS) 73
    86. SUPERALLOYS MARKET, BY APPLICATION, 2020-2027 (USD MILLION) 74
    87. SUPERALLOYS MARKET, BY APPLICATION, 2020-2027 (TONS) 74
    88. MARKET, BY PRODUCT, 2020-2027 (USD MILLION) 75
    89. MARKET, BY PRODUCT, 2020-2027 (TONS) 75
    90. BY APPLICATION, 2020-2027 (USD MILLION) 76
    91. BY APPLICATION, 2020-2027 (TONS) 76
    92. PRODUCT, 2020-2027 (USD MILLION) 77
    93. PRODUCT, 2020-2027 (TONS) 77
    94. 2027 (USD MILLION) 78
    95. 2027 (TONS) 78
    96. MILLION) 79
    97. FRANCE SUPERALLOYS MARKET, BY PRODUCT, 2020-2027 (USD MILLION) 81
    98. FRANCE SUPERALLOYS MARKET, BY PRODUCT, 2020-2027 (TONS) 81
    99. SUPERALLOYS MARKET, BY APPLICATION, 2020-2027 (USD MILLION) 82
    100. SUPERALLOYS MARKET, BY APPLICATION, 2020-2027 (TONS) 82
    101. MARKET, BY PRODUCT, 2020-2027 (USD MILLION) 83
    102. BY PRODUCT, 2020-2027 (TONS) 83
    103. 2027 (USD MILLION) 84
    104. 2027 (TONS) 84
    105. (USD MILLION) 85
    106. POLAND SUPERALLOYS MARKET, BY APPLICATION, 2020-2027 (USD MILLION) 88
    107. POLAND SUPERALLOYS MARKET, BY APPLICATION, 2020-2027 (TONS) 88
    108. REST OF EUROPE SUPERALLOYS MARKET, BY PRODUCT, 2020-2027 (USD MILLION) 89
    109. REST OF EUROPE SUPERALLOYS MARKET, BY PRODUCT, 2020-2027 (TONS) 89
    110. REST OF EUROPE SUPERALLOYS MARKET, BY APPLICATION, 2020-2027 (USD MILLION) 90
    111. CHINA SUPERALLOYS MARKET, BY APPLICATION, 2020-2027 (USD MILLION) 95
    112. CHINA SUPERALLOYS MARKET, BY APPLICATION, 2020-2027 (TONS) 95
    113. SUPERALLOYS MARKET, BY PRODUCT, 2020-2027 (USD MILLION) 96
    114. MARKET, BY PRODUCT, 2020-2027 (TONS) 96
    115. BY APPLICATION, 2020-2027 (USD MILLION) 97
    116. BY APPLICATION, 2020-2027 (TONS) 97
    117. 2027 (USD MILLION) 98
    118. (TONS) 98
    119. MILLION) 99
    120. MILLION) 100
    121. (TONS) 100
    122. 2027 (USD MILLION) 101
    123. BY APPLICATION, 2020-2027 (TONS) 101
    124. BY PRODUCT, 2020-2027 (USD MILLION) 102
    125. BY PRODUCT, 2020-2027 (TONS) 102
    126. APPLICATION, 2020-2027 (USD MILLION) 103
    127. BY APPLICATION, 2020-2027 (TONS) 103
    128. SUPERALLOYS MARKET, BY PRODUCT, 2020-2027 (USD MILLION) 104
    129. & NEW ZEALAND SUPERALLOYS MARKET, BY PRODUCT, 2020-2027 (TONS) 104
    130. AUSTRALIA & NEW ZEALAND SUPERALLOYS MARKET, BY APPLICATION, 2020-2027 (USD
    131. MILLION) 105
    132. 2027 (TONS) 105
    133. PRODUCT, 2020-2027 (USD MILLION) 106
    134. MARKET, BY PRODUCT, 2020-2027 (TONS) 106
    135. MARKET, BY APPLICATION, 2020-2027 (USD MILLION) 107
    136. PACIFIC SUPERALLOYS MARKET, BY APPLICATION, 2020-2027 (TONS) 107
    137. LATIN AMERICA SUPERALLOYS MARKET, BY COUNTRY, 2020-2027 (USD MILLION) 108
    138. LATIN AMERICA SUPERALLOYS MARKET, BY COUNTRY, 2020-2027 (TONS) 108
    139. LATIN AMERICA SUPERALLOYS MARKET, BY PRODUCT, 2020-2027 (USD MILLION) 109
    140. MEXICO SUPERALLOYS MARKET, BY PRODUCT, 2020-2027 (USD MILLION) 113
    141. MEXICO SUPERALLOYS MARKET, BY PRODUCT, 2020-2027 (TONS) 113
    142. SUPERALLOYS MARKET, BY APPLICATION, 2020-2027 (USD MILLION) 114
    143. SUPERALLOYS MARKET, BY APPLICATION, 2020-2027 (TONS) 114
    144. SUPERALLOYS MARKET, BY PRODUCT, 2020-2027 (USD MILLION) 115
    145. SUPERALLOYS MARKET, BY PRODUCT, 2020-2027 (TONS) 115
    146. MARKET, BY APPLICATION, 2020-2027 (USD MILLION) 116
    147. MARKET, BY APPLICATION, 2020-2027 (TONS) 116
    148. SUPERALLOYS MARKET, BY PRODUCT, 2020-2027 (USD MILLION) 117
    149. OF LATIN AMERICA SUPERALLOYS MARKET, BY PRODUCT, 2020-2027 (TONS) 117
    150. REST OF LATIN AMERICA SUPERALLOYS MARKET, BY APPLICATION, 2020-2027 (USD MILLION)
    151. (TONS) 118
    152. 2027 (USD MILLION) 119
    153. MARKET, BY COUNTRY, 2020-2027 (TONS) 119
    154. SUPERALLOYS MARKET, BY PRODUCT, 2020-2027 (USD MILLION) 120
    155. EAST AND AFRICA SUPERALLOYS MARKET, BY PRODUCT, 2020-2027 (TONS) 120
    156. THE MIDDLE EAST AND AFRICA SUPERALLOYS MARKET, BY APPLICATION, 2020-2027 (USD
    157. MILLION) 121
    158. 2027 (TONS) 121
    159. (USD MILLION) 122
    160. (TONS) 122
    161. MILLION) 123
    162. (TONS) 123
    163. SAUDI ARABIA SUPERALLOYS MARKET, BY PRODUCT, 2020-2027 (USD MILLION) 126
    164. UAE SUPERALLOYS MARKET, BY APPLICATION, 2020-2027 (USD MILLION) 129
    165. UAE SUPERALLOYS MARKET, BY APPLICATION, 2020-2027 (TONS) 129
    166. ISRAEL SUPERALLOYS MARKET, BY PRODUCT, 2020-2027 (USD MILLION) 130
    167. ISRAEL SUPERALLOYS MARKET, BY PRODUCT, 2020-2027 (TONS) 130
    168. SUPERALLOYS MARKET, BY APPLICATION, 2020-2027 (USD MILLION) 131
    169. SUPERALLOYS MARKET, BY APPLICATION, 2020-2027 (TONS) 131
    170. MIDDLE EAST AND AFRICA SUPERALLOYS MARKET, BY PRODUCT, 2020-2027 (USD MILLION) 132
    171. (TONS) 132
    172. APPLICATION, 2020-2027 (USD MILLION) 133
    173. AFRICA SUPERALLOYS MARKET, BY APPLICATION, 2020-2027 (TONS) 133
    174. INTERNATIONAL: PRODUCTS OFFERED 137
    175. ALLEGHENY TECHNOLOGIES INC. (ATI): KEY DEVELOPMENTS 143
    176. METALS CORPORATION: PRODUCTS OFFERED 145
    177. KEY DEVELOPMENTS 146
    178. APERAM: KEY DEVELOPMENTS 151
    179. OFFERED 154
    180. LTD: PRODUCTS OFFERED 161
    181. OFFERED 165
    182. CARPENTER TECHNOLOGY CORPORATION: KEY DEVELOPMENTS 170
    183. PRODUCTS OFFERED 172
    184. LIST
    185. OF FIGURES
    186. ANALYSIS: GLOBAL SUPERALLOYS MARKET 18
    187. BY PRODUCT 19
    188. SUPERALLOYS MARKET: STRUCTURE 23
    189. TOP-DOWN & BOTTOM-UP APPROACHES 27
    190. BY COUNTRY (2020 VS 2027) 30
    191. VS 2027) 30
    192. MIDDLE EAST & AFRICA MARKET SHARE BY COUNTRY (2020 VS 2027) 32
    193. MARKET DYNAMICS OVERVIEW 33
    194. IMPORTS, AND BALANCE OF TRADE (IN USD BILLION) 34
    195. ANALYSIS: SUPERALLOYS MARKET 36
    196. MARKET 37
    197. (2014 VS 2034) 39
    198. SUPPLY CHAIN: GLOBAL SUPERALLOYS MARKET 41
    199. ANALYSIS OF THE GLOBAL SUPERALLOYS MARKET 43
    200. BY PRODUCT, 2020-2027 (USD MILLION) 46
    201. BY PRODUCT, 2020-2027 (TONS) 47
    202. 2027 (USD MILLION) 52
    203. 2027 (TONS) 53
    204. HAYNES INTERNATIONAL: FINANCIAL OVERVIEW SNAPSHOT 137
    205. SWOT ANALYSIS 139
    206. SNAPSHOT 141
    207. FINANCIAL OVERVIEW SNAPSHOT 149
    208. AMG ADVANCED METALLURGICAL GROUP: FINANCIAL OVERVIEW SNAPSHOT 154
    209. AMG ADVANCED METALLURGICAL GROUP: SWOT ANALYSIS 156
    210. GROUP LTD: FINANCIAL OVERVIEW SNAPSHOT 158
    211. SWOT ANALYSIS 159
    212. AEROSPACE GERMANY GMBH: FINANCIAL OVERVIEW SNAPSHOT 164
    213. AEROSPACE GERMANY GMBH: SWOT ANALYSIS 167
    214. FINANCIAL OVERVIEW SNAPSHOT 169
    215. SWOT ANALYSIS 171

    Aluminum-Extruded Products Market Segmentation

    Market Segmentation Overview

    • Detailed segmentation data will be available in the full report
    • Comprehensive analysis by multiple parameters
    • Regional and country-level breakdowns
    • Market size forecasts by segment
    Aluminum-Extruded Products Market Research Report - Forecast to 2030 Infographic
    Free Sample Request

    Kindly complete the form below to receive a free sample of this Report

    Customer Strories

    “I am very pleased with how market segments have been defined in a relevant way for my purposes (such as "Portable Freezers & refrigerators" and "last-mile"). In general the report is well structured. Thanks very much for your efforts.”

    Victoria Milne Founder
    Case Study

    Chemicals and Materials