• Cat-intel
  • MedIntelliX
  • Resources
  • About Us
  • Request Free Sample ×

    Kindly complete the form below to receive a free sample of this Report

    Leading companies partner with us for data-driven Insights

    clients tt-cursor

    Adhesives Sealants Handheld Devices Market

    ID: MRFR/CnM/2578-CR
    175 Pages
    Chitranshi Jaiswal
    January 2018

    Adhesives and Sealants for Handheld Devices Market Research Report Information By Adhesive Type (Hot Melt Adhesives, Waterborne Adhesives, Pressure-Sensitive Adhesives, and Solvent-borne Adhesives), By Sealant Type (Acrylic Latex Sealants, Silicone Sealants, Epoxy Sealants, Polyurethane Sealant and Butyl Sealant), By Application (Laptops, Mobiles and Tablets, Medical devices, and Hard Disc Devices), and Region (North America, Europe, Asia-Pacific, and Rest of the World)—Forecast till 2023

    Share:
    Download PDF ×

    We do not share your information with anyone. However, we may send you emails based on your report interest from time to time. You may contact us at any time to opt-out.

    Adhesives & Sealants Market for Handheld Devices Research Report- Forecast till 2023 Infographic
    Purchase Options
    $ 4,950.0
    $ 5,950.0
    $ 7,250.0
    Table of Contents

    Adhesives Sealants Handheld Devices Market Summary

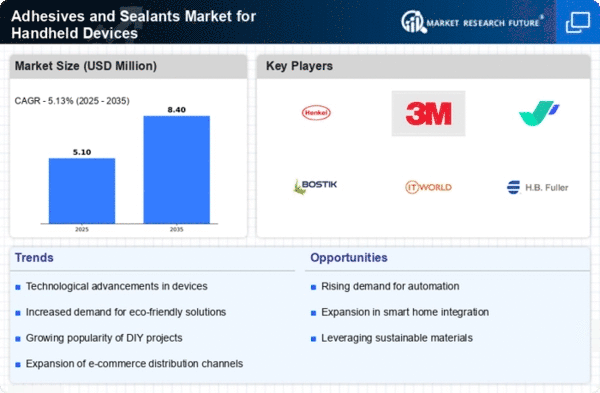
    The Global Adhesives and Sealants for Handheld Devices Market is projected to grow significantly from 5.49 USD Billion in 2024 to 11.3 USD Billion by 2035.

    Key Market Trends & Highlights

    Adhesives and Sealants for Handheld Devices Key Trends and Highlights

    • The market is expected to witness a compound annual growth rate (CAGR) of 6.74% from 2025 to 2035.
    • By 2035, the market valuation is anticipated to reach 11.3 USD Billion, indicating robust growth potential.
    • In 2024, the market is valued at 5.49 USD Billion, reflecting a strong foundation for future expansion.
    • Growing adoption of advanced bonding technologies due to increasing demand for lightweight and durable materials is a major market driver.

    Market Size & Forecast

    2024 Market Size 5.49 (USD Million)
    2035 Market Size 11.3 (USD Million)
    CAGR (2025-2035) 6.74%

    Major Players

    3M, Henkel AG, Co. KGaA, Tangent Industries, Evonik Industries AG, Novachem Corporation, H.B. Fuller, Dow Corning Corporation

    Adhesives Sealants Handheld Devices Market Trends

    The increasing demand for lightweight and durable materials in handheld devices is driving innovation in adhesive and sealant technologies, which are essential for enhancing device performance and longevity.

    U.S. Department of Commerce

    Adhesives Sealants Handheld Devices Market Drivers

    Market Growth Projections

    The Global Adhesives and Sealants for Handheld Devices Market Industry is poised for substantial growth, with projections indicating a market size of 5.49 USD Billion in 2024 and an anticipated increase to 11.3 USD Billion by 2035. This growth trajectory suggests a compound annual growth rate of 6.74% from 2025 to 2035, reflecting the increasing reliance on advanced adhesive technologies in the production of handheld devices. The market dynamics are influenced by various factors, including technological advancements, rising consumer demand, and regulatory compliance, all contributing to a robust and evolving landscape for adhesives and sealants in the handheld device sector.

    Increasing Smartphone Penetration

    The increasing penetration of smartphones globally significantly influences the Global Adhesives and Sealants for Handheld Devices Market Industry. With millions of new smartphone users emerging each year, the demand for reliable adhesive solutions to ensure device integrity and longevity is paramount. This trend is particularly pronounced in emerging markets, where smartphone adoption rates are skyrocketing. As manufacturers strive to produce more durable and aesthetically pleasing devices, the reliance on advanced adhesives becomes more pronounced. By 2035, the market is anticipated to expand to 11.3 USD Billion, reflecting the critical role adhesives play in the production of smartphones and other handheld devices.

    Growing Consumer Electronics Market

    The Global Adhesives and Sealants for Handheld Devices Market Industry is significantly impacted by the growing consumer electronics market. As consumer electronics continue to evolve, the demand for high-quality adhesives that can withstand rigorous usage and environmental conditions becomes increasingly important. This growth is evident in various sectors, including wearables, tablets, and gaming devices, where adhesive solutions are essential for assembly and performance. The continuous innovation in consumer electronics is expected to drive the market forward, with projections indicating a robust growth trajectory as manufacturers seek to enhance product quality and user satisfaction through superior adhesive technologies.

    Regulatory Standards and Compliance

    Regulatory standards and compliance requirements are becoming increasingly stringent within the Global Adhesives and Sealants for Handheld Devices Market Industry. Manufacturers are compelled to adhere to environmental regulations and safety standards, which necessitate the use of compliant adhesive solutions. This trend is particularly relevant in regions with strict environmental policies, where the demand for eco-friendly and non-toxic adhesives is on the rise. As a result, companies are investing in the development of sustainable adhesive technologies that meet regulatory requirements while maintaining performance. This shift not only enhances product safety but also positions manufacturers favorably in a competitive market.

    Rising Demand for Lightweight Materials

    The Global Adhesives and Sealants for Handheld Devices Market Industry experiences a notable surge in demand for lightweight materials, driven by the increasing consumer preference for portable and compact devices. Manufacturers are increasingly adopting advanced adhesive technologies to ensure optimal bonding while minimizing weight. This trend is particularly evident in the smartphone and tablet sectors, where the integration of lightweight materials enhances user experience and device performance. As a result, the market is projected to reach 5.49 USD Billion in 2024, with a significant portion attributed to innovations in adhesive formulations that cater to the lightweight requirements of modern handheld devices.

    Technological Advancements in Adhesive Formulations

    Technological advancements in adhesive formulations play a crucial role in shaping the Global Adhesives and Sealants for Handheld Devices Market Industry. Innovations such as the development of nanotechnology-based adhesives and bio-based sealants are gaining traction, offering superior performance characteristics. These advancements not only improve the durability and longevity of handheld devices but also align with the growing sustainability trends in manufacturing. The market is expected to witness a compound annual growth rate of 6.74% from 2025 to 2035, as manufacturers increasingly invest in research and development to create high-performance adhesives that meet the evolving needs of consumers.

    Market Segment Insights

    Sealants Type Insights

    The  adhesives and sealants for handheld devices market segmentation, based on sealants type, is acrylic latex sealants, silicone sealants, epoxy sealants, polyurethane sealants, butyl sealants. In 2021, the silicone sealants segment dominates the market with the largest market share. The consumer electronics sector largely drives silicone sealants to need improved sealants due to superior features such as strong temperature resistance, low volatility, and mechanical strength, among others.

    Application Insights

    The  adhesives and sealants for handheld devices market segmentation, based on the applications, is mobiles and tablets, laptops, hard disk drives, and

    medical devices

    . Mobile and tablets accounted for the greatest market share in the adhesives and sealants market for handheld devices. With smartphone adoption no longer confined only to the urban population, demand for adhesives and sealants from the mobile phones and tablets market is expanding significantly during the forecast period, with the highest CAGR. Furthermore, rising demand for gaming and detachable laptops will likely fuel development in the laptops category for adhesives and sealants for the handheld devices market.

    Adhesive Type Insights

    The  adhesives and sealants for handheld devices market research segmentation, based on adhesive type, is hot melt adhesives, water-borne adhesives, pressure-sensitive adhesives, and solvent-borne adhesives. The water-borne adhesives segment has a prominent share in 2021 due to its unique qualities, such as high tensile strength and malleability.

    Global Adhesives And Sealants For Handheld Devices Market Share, By Region, 2021 (%)Adhesives And Sealants For Handheld Devices Market Share, By Region, 2021 Adhesives and Sealants for Handheld Devices Market Overview, by Region

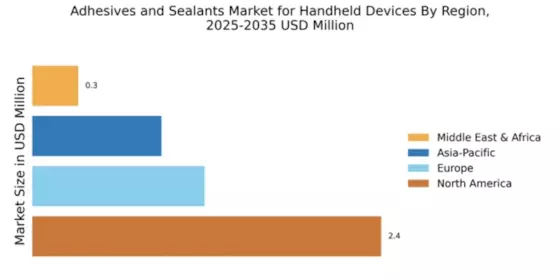
    By region, the  adhesives and sealants for handheld devices market report have been divided into North America, Europe, Asia-Pacific, and the Rest of the World. Asia-Pacific accounted for the most extensive market share and is projected to exhibit the highest CAGR during the review period.

    Asia-Pacific

    The Asia-Pacific region is the largest adhesives and sealants for handheld devices market, accounting for nearly 50% of the  adhesives and sealants for handheld devices market share and has the highest CAGR during the forecast period. A robust print of adhesive and sealant manufacturers and the region's emerging electronics market are a few of the factors fostering the region's adhesive and sealants market for handheld devices. Furthermore, growing urbanization and cumulative white goods spending in emerging nations are expected to drive demand for adhesives and sealants for portable devices.

    Southeast Asian nations offer market development in the Asia-Pacific due to their rise as an electronic device assembly hub and a large manufacturing base for various electronic devices such as laptops, mobile phones, and storage devices.

    Europe

    The European region has the second largest market share for adhesives and sealants for handheld devices, mostly due to the prominent producers in the region with significant product contributions. With around 18,000 domestic electronics firms, the United Kingdom is Europe's largest market for high-end consumer electronics items. In recent years, there has been an increase in demand for technologically sophisticated touch-screen gadgets and wearables. Adhesives, particularly epoxy-based adhesives, play an important role in the production of electrical goods. Major key players in the market are also present in the region.

    All of these factors are expected to increase demand for adhesives and sealants in the region, consequently fueling the expansion of its adhesives and sealants for the handheld devices market.

    Adhesives and Sealants for Handheld Devices Market Competitive Landscape

    The market includes tier-1, tier-2, and local players. The tier-1 and tier-2 players have  reach with diverse product portfolios. Due to product differentiation, companies such as Endoca BV, Cannoid, LLC, Medical Marijuana, Inc., FOLIUM BIOSCIENCES, and Elixinol dominate the adhesives and sealants for handheld devices market, financial stability, strategic developments, and diversified regional presence. The players are concentrating on supporting research and development. Furthermore, they embrace strategic growth initiatives, such as development, product introduction, joint ventures, and partnerships, to strengthen their market position and capture an extensive customer base.

    For instance, in March 2022, Elcam Drug Delivery Devices (E3D) declared it is developing on-body delivery devices for subcutaneous bolus inoculations of drugs outside a clinical setting. The On-body Bolus Injector (OBI) platform from E3D is designed to give subcutaneous dosages of pharmaceuticals during a pre-determined injection interval in a profitable and less invasive manner. The intervention may be affixed to the body with an adhesive pad built-in.

    Prominent  adhesives and sealants for handheld devices market report include 3M, Henkel AG, Co. KGaA, Tangent Industries, Evonik Industries AG, Novachem Corporation, H.B. Fuller, Dow Corning Corporation, and others.

    Scope of the  Adhesives and Sealants for Handheld Devices Market Report Adhesive Type outlook
      • Hot Melt Adhesives
      • Waterborne Adhesives
      • Pressure-sensitive Adhesives
      • Solvent-borne Adhesives
    Sealant Type Outlook
      • Acrylic Latex Sealants
      • Silicone Sealants
      • Epoxy Sealants
      • Polyurethane Sealant
      • Butyl Sealant
    Application Outlook
      • Laptops
      • Mobiles and Tablets
      • Medical Devices
      • Hard Disc Drives
    Region Outlook
      • North America
        • US
        • Canada
        • Mexico
      • Europe
        • UK
        • Germany
        • France
        • Italy
        • Spain
        • Rest of Europe
      • Asia-Pacific
        • China
        • India
        • Japan
        • Australia and New Zealand
        • Rest of Asia-Pacific
      • Rest of the World
        • South America
        • Middle East
        • Africa
    Objectives of the Study

    The objectives of the study are summarized in 5 stages. They are as mentioned below:

    Adhesives and Sealants for Handheld Devices Market Forecast & Size:

    To identify and estimate the market size for the  adhesives and sealants for handheld devices market is segmented by adhesive type, sealant type, and application by value (in U.S. dollars). Also, to understand the consumption/ demand created by consumers of adhesives and sealants for handheld devices between 2020 and 2030

    Market Landscape and Trends:

    To identify and infer the drivers, restraints, opportunities, and challenges for the  adhesives and sealants for handheld devices market

    Market Influencing Factors:

    To find out the factors which are affecting the sales of adhesives and sealants for handheld devices among consumers

    Impact of COVID-19:

    To identify and understand the various factors involved in the  adhesives and sealants for handheld devices market affected by the pandemic

    Company Profiling:

    To provide a detailed insight into the major companies operating in the market. The profiling will include the financial health of the company past 2-3 years with segmental and regional revenue breakup, product offering, recent developments, SWOT analysis, and key strategies.

    Intended Audience
      • Electronic Device Manufacturers
      • Adhesives Producers
      • Sealants Manufacturers
      • Raw Material Suppliers
      • Retailers, Wholesalers, and Distributors
      • Governments, Associations, and Industrial Bodies
      • Investors and Trade Experts

    Regional Insights

    Key Companies in the Adhesives Sealants Handheld Devices Market market include

    Industry Developments

    Future Outlook

    Adhesives Sealants Handheld Devices Market Future Outlook

    The Adhesives and Sealants for Handheld Devices Market is projected to grow at a 6.74% CAGR from 2024 to 2035, driven by technological advancements and increasing demand for lightweight materials.

    New opportunities lie in:

    • Develop eco-friendly adhesive formulations to meet sustainability trends.
    • Invest in R&D for advanced bonding technologies in flexible displays.
    • Expand distribution channels in emerging markets to capture new customer segments.

    By 2035, the market is expected to achieve substantial growth, reflecting evolving consumer preferences and technological innovations.

    Market Segmentation

    Region Outlook

    North America
    • US
    • Canada
    • Mexico

    Application Outlook

    • Laptops
    • Mobiles and Tablets
    • Medical Devices
    • Hard Disc Drives

    Sealant Type Outlook

    • Acrylic Latex Sealants
    • Silicone Sealants
    • Epoxy Sealants
    • Polyurethane Sealant
    • Butyl Sealant

    Report Scope

    Attribute/Metric Details
      Market Size  2022: USD 4,882.6 million2030: USD 7946.8 million
      CAGR   7.21%
      Base Year   2015
      Forecast Period   2022-2030
      Historical Data   2014
      Forecast Units   Value (USD Million)
      Report Coverage   Revenue Forecast, Competitive Landscape, Growth Factors, and Trends
      Segments Covered   By Adhesives, Sealants, Application and Region
      Geographies Covered   North America, Europe, Asia-Pacific, and Rest of the World (RoW)
      Key Vendors   3M, Henkel AG, and Co. KGaA, Tangent Industries, Evonik Industries AG, Novachem Corporation, H.B. Fuller, and Dow Corning Corporation.
      Key Market Opportunities   The commonly used adhesive is the hot melt adhesive with better rework ability and dependability properties.
      Key Market Drivers   Rise in the demand for gaming laptops, and the growth of the electronic markets.

    Market Highlights

    Author
    Chitranshi Jaiswal
    Research Analyst Level I

    In her 3 years of experience in the market research field, she has handled critical cross-domain projects. She has an in-depth knowledge of market estimation & analysis, problem-solving, primary as well as secondary research, and team management.She holds an engineering degree and is an MBA professional from a well-known university, capable of evaluating the market and competitive conditions. An exceptional strategist with excellent communication skills and a passion for delivering cutting-edge & practical insights for the market. Proficient in multi-tasking, and can successfully deal with competing demands, while maintaining complete confidentiality. Generated business through active client and project development, networking, and high-quality responses. Her knowledge and skills have helped in making solid business decisions, securing funding from investors, and avoiding business failures.

    Leave a Comment

    FAQs

    At what CAGR is the Adhesives & Sealants for the Handheld Devices Market predicted to grow during the forecast period?

    Adhesives & Sealants for the Handheld Devices Market is predicted to grow at 7.21 % through forecast period of 2016-2023.

    What is the forecast period of Adhesives & Sealants for the Handheld Devices Market research report?

    The forecast period for Adhesives & Sealants for the Handheld Devices Market research report is 2016-2023.

    Which region will lead the Adhesives & Sealants for the Handheld Devices Market?

    Adhesives & Sealants for the Handheld Devices Market is dominated by APAC region.

    Who are the key players in the Adhesives & Sealants for the Handheld Devices Market?

    The main players in the Market are 3M, Henkel AG, and Co. KGaA, Tangent Industries, Evonik Industries AG, Novachem Corporation, H.B. Fuller, and Dow Corning Corporation.

    1. Report Prologue 2 Report Prologue 3 Scope of The Report 3.1 Market Definition
    2. 3.2 Scope of The Study 17 3.2.1 Research Objectives 17 3.2.2 Assumptions 17 3.2.3
    3. Limitations 18 3.3 Markets Structure 18 4 Research Methodology 4.1 Research Process
    4. 4.2 Primary Research 20 4.3 Secondary Research 20 4.4 Market Size Estimation
    5. 5 Market Dynamics 5.1 Introduction 23 5.2 Drivers 24 5.2.1 Penetration of Smartphones
    6. and Tablets to Surge Adhesive & Sealants Demand 24 5.2.2 Rising Popularity of
    7. Gaming Laptops & Detachable Laptops 25 5.2.3 Augmenting Demand for Adhesive
    8. & Sealants in PCB Applications 26 5.2.4 Growth in consumer electronics to augment
    9. adhesives and sealants demand 27 5.3 Restraints 28 5.3.1 Dramatic Surge in Adhesive
    10. & Sealant Raw Material Prices to Impede Market Growth 28 5.3.2 Rapidly Changing
    11. Technologies in the Consumer Electronics Market 28 5.4 Trends & Opportunities
    12. 5.4.1 Emerging Electronic Device Assembly Hub in Southeast Asian Nations 29 5.4.2
    13. Significant FDI in the ASEAN Region From Developed Nations 29 5.4.3 Product Innovation
    14. For Next Generation Electronic Devices 29 5.5 Macroeconomic Indicators 30 5.5.1
    15. Rise in disposable income coupled with increased spending on consumer electronics
    16. 6 Market Factor Analysis 6.1 Supply Chain Analysis 31 6.1.1 Raw Material Suppliers
    17. 6.1.2 Adhesives & Sealants Manufacturers 31 6.1.3 Distribution Channel 32
      1. End-User Industry 32 6.2 Porter’s 5 Analysis 32 6.2.1 Threat of New
    18. Entrants 32 6.2.2 Threat of Rivalry 32 6.2.3 Threat of Substitute 32 6.2.4 Bargaining
    19. power of supplier 32 6.2.5 Bargaining Power of Buyers 33 7 Global Adhesives for
    20. Handheld Devices Market, By Adhesives Type 7.1 Introduction 34 7.2 Hot Melt Adhesive
    21. 7.3 Pressure Sensitive Adhesives 37 7.4 Waterborne Adhesives 38 7.5 Solvent Based
    22. Adhesives 40 7.6 Others 41 8 Global Adhesives for Handheld Devices Market, By Adhesives
    23. Application 8.1 Introduction 42 8.1.1 Laptops 45 8.1.2 Mobile Phones & Tablets
    24. 8.1.3 Hard Disc Drives 47 8.1.4 Medical Devices 48 8.1.5 Others 49 9 Global Adhesives
    25. for Handheld Devices Market, By Region 9.1 Introduction 50 9.2 North America 54
      1. U.S 57 9.2.2 Canada 59 9.3 Europe 61 9.3.1 Germany 64 9.3.2 France 66 9.3.3
    26. UK 68 9.3.4 Italy 70 9.3.5 Spain 72 9.3.6 Rest of Europe 74 9.4 Asia Pacific 76
      1. China 79 9.4.2 Japan 81 9.4.3 India 83 9.4.4 Rest of Asia-Pacific 85 9.4.5
    27. Latin America 87 9.4.6 Middle East & Africa 89 10 Global Sealants for Handheld
    28. Devices Market, By Sealants Type 10.1 Introduction 92 10.2 Silicone Sealants 95
      1. Polyurethane Sealants 96 10.4 Acrylic Latex Sealants 97 10.5 Epoxy Sealants
    29. 10.6 Butyl Sealants 99 10.7 Others 100 11 Global Sealants for Handheld Devices
    30. Market, By Sealants Application 11.1 Introduction 101 11.1.1 Mobile phone 104 11.1.2
    31. Laptop 105 11.1.3 Hard Disc Drives 106 11.1.4 Medical Devices 107 11.1.5 Others
    32. 12 Global Sealants for Handheld Devices Market, By Region 12.1 Introduction
    33. 12.2 North America 113 12.2.1 U.S 116 12.2.2 Canada 118 12.3 Europe 120 12.3.1
    34. Germany 123 12.3.2 France 125 12.3.3 UK 127 12.3.4 Italy 129 12.3.5 Spain 131 12.3.6
    35. Rest of Europe 133 12.4 Asia Pacific 135 12.4.1 China 137 12.4.2 Japan 139 12.4.3
    36. India 141 12.4.4 Rest of Asia-Pacific 143 12.5 Latin America 146 12.6 Middle East
    37. & Africa 148 13 Competitive Landscape 13.1 Introduction 151 13.2 Market Share
    38. Analysis 151 13.3 Pricing Analysis 151 13.4 Key Developments & Strategies 152
    39. Company Profiles 14.1 Henkel AG & Co. KGaA 156 14.1.1 Company Overview 156
      1. Product/Business Segment Overview 156 14.1.3 Financial Updates 157 14.1.4
    40. Key Developments 157 14.2 3M 158 14.2.1 Company Overview 158 14.2.2 Product/Business
    41. Segment Overview 158 14.2.3 Financial Updates 159 14.2.4 Key Developments 159 14.3
    42. Evonik Industries AG 160 14.3.1 Company Overview 160 14.3.2 Product/Business Segment
    43. Overview 160 14.3.3 Financial Updates 161 14.3.4 Key Developments 161 14.4 Dow Corning
    44. Corporation 162 14.4.1 Company Overview 162 14.4.2 Product/Business Segment Overview
    45. 14.4.3 Financial Updates 163 14.4.4 Key Developments 163 14.5 H.B Fuller 164
      1. Company Profile 164 14.5.2 Financial Overview 166 14.5.3 Key Developments
    46. 14.6 Novachem Corporations 169 14.6.1 Company Profile 169 14.6.2 Product/Business
    47. Segment Overview 169 14.6.3 Financial Overview 171 14.6.4 Key developments 171 14.7
    48. Tangent Industries 172 14.7.1 Company profile 172 14.7.2 Product/Business Segment
    49. Overview 172 14.7.3 Financial Overview 173 14.7.4 Key developments 173 15 Conclusion
    50. List of Tables TABLE 1 IMPACT ANALYSIS: DRIVERS 24 TABLE 2 IMPACT ANALYSIS: RESTRAINTS
    51. TABLE 3 IMPACT ANALYSIS: TRENDS & OPPORTUNITIES 29 TABLE 4 GLOBAL ADHESIVES
    52. FOR HANDHELD DEVICES MARKET, BY ADHESIVE TYPE 2020-2027 (USD MILLION) 34 TABLE 5
    53. GLOBAL ADHESIVES FOR HANDHELD DEVICES MARKET, BY ADHESIVE TYPE 2020-2027 (‘000
    54. TONS) 35 TABLE 6 GLOBAL ADHESIVES FOR HANDHELD DEVICES MARKET FOR ADHESIVE TYPE,
    55. BY REGION, 2020-2027, (USD MILLION) 36 TABLE 7 GLOBAL ADHESIVES FOR HANDHELD DEVICES
    56. MARKET FOR ADHESIVE TYPE, BY REGION, 2020-2027, (‘000 TONS) 36 TABLE 8 GLOBAL
    57. HOT MELT ADHESIVE FOR HANDHELD DEVICES MARKET, BY REGION 2020-2027 (USD MILLION)
    58. TABLE 9 GLOBAL HOT MELT ADHESIVE FOR HANDHELD DEVICES MARKET, BY REGION 2020-2027
    59. (‘000 TONS) 37 TABLE 10 GLOBAL PRESSURE SENSITIVE ADHESIVES FOR HANDHELD DEVICES
    60. MARKET, BY REGION 2020-2027 (USD MILLION) 37 TABLE 11 GLOBAL PRESSURE SENSITIVE
    61. ADHESIVES FOR HANDHELD DEVICES MARKET, BY REGION 2020-2027 (‘000 TONS) 38
    62. (USD MILLION) 38 TABLE 13 GLOBAL WATERBORNE ADHESIVES FOR HANDHELD DEVICES MARKET,
    63. BY REGION ADHESIVES 2020-2027 (‘000 TONS) 39 TABLE 14 GLOBAL SOLVENT BASED
    64. ADHESIVES FOR HANDHELD DEVICES MARKET FOR, BY REGION 2020-2027 (USD MILLION) 40
    65. 2027 (‘000 TONS) 40 TABLE 16 GLOBAL OTHERS FOR HANDHELD DEVICES MARKET,
    66. BY REGION 2020-2027 (USD MILLION) 41 TABLE 17 GLOBAL GLOBAL OTHERS FOR HANDHELD
    67. DEVICES MARKET, BY REGION 2020-2027 (‘000 TONS) 41 TABLE 18 GLOBAL ADHESIVES
    68. FOR HANDHELD DEVICES MARKET, BY APPLICTAION, 2020-2027, (USD MILLION) 42 TABLE 19
    69. GLOBAL ADHESIVES FOR HANDHELD DEVICES MARKET, BY APPLICATION, 2020-2027, (‘000
    70. TONS) 43 TABLE 20 GLOBAL ADHESIVES FOR HANDHELD DEVICES MARKET FOR APPLICATION,
    71. BY REGION, 2020-2027, (USD MILLION) 44 TABLE 21 GLOBAL ADHESIVES FOR HANDHELD DEVICES
    72. MARKET FOR APPLICATION, BY REGION, 2020-2027, (‘000 TONS) 44 TABLE 22 GLOBAL
    73. ADHESIVES FOR HANDHELD DEVICES MARKET FOR LAPTOPS, BY REGION, 2020-2027, (USD MILLION)
    74. TABLE 23 GLOBAL ADHESIVES FOR HANDHELD DEVICES MARKET FOR LAPTOPS, BY REGION,
    75. 2027, (‘000 TONS) 45 TABLE 24 GLOBAL ADHESIVES FOR HANDHELD DEVICES MARKET
    76. FOR MOBILE PHONES & TABLETS, BY REGION, 2020-2027, (USD MILLION) 46 TABLE 25
    77. GLOBAL ADHESIVES FOR HANDHELD DEVICES MARKET FOR MOBILE PHONES & TABLETS, BY
    78. REGION, 2020-2027, (‘000 TONS) 46 TABLE 26 GLOBAL ADHESIVES FOR HANDHELD DEVICES
    79. MARKET FOR HARD DISC DRIVES, BY REGION, 2020-2027, (USD MILLION) 47 TABLE 27 GLOBAL
    80. ADHESIVES FOR HANDHELD DEVICES MARKET FOR HARD DISC DRIVES, BY REGION, 2020-2027,
    81. (‘000 TONS) 47 TABLE 28 GLOBAL ADHESIVES FOR HANDHELD DEVICES MARKET FOR MEDICAL
    82. DEVICES, BY REGION, 2020-2027, (USD MILLION) 48 TABLE 29 GLOBAL ADHESIVES FOR HANDHELD
    83. DEVICES MARKET FOR MEDICAL DEVICES, BY REGION, 2020-2027, (‘000 TONS) 48 TABLE
    84. GLOBAL ADHESIVES FOR HANDHELD DEVICES MARKET FOR OTHERS, BY REGION, 2020-2027,
    85. (USD MILLION) 49 TABLE 31 GLOBAL ADHESIVES FOR HANDHELD DEVICES MARKET FOR OTHERS,
    86. BY REGION, 2020-2027, (‘000 TONS) 49 TABLE 32 GLOBAL ADHESIVES FOR HANDHELD
    87. DEVICES MARKET, BY REGION, 2020-2027, (USD MILLION) 50 TABLE 33 GLOBAL ADHESIVES
    88. FOR HANDHELD DEVICES MARKET, BY REGION, 2020-2027, (‘000 TONS) 51 TABLE 34
    89. GLOBAL ADHESIVES FOR HANDHELD DEVICES MARKET FOR TYPE, BY REGION, 2020-2027, (USD
    90. MILLION) 52 TABLE 35 GLOBAL ADHESIVES FOR HANDHELD DEVICES MARKET FOR TYPE, BY REGION,
    91. 2027, (‘000 TONS) 52 TABLE 36 GLOBAL ADHESIVES FOR HANDHELD DEVICES MARKET
    92. FOR APPLICATION, BY REGION, 2020-2027, (USD MILLION) 53 TABLE 37 GLOBAL ADHESIVES
    93. FOR HANDHELD DEVICES MARKET FOR APPLICATION, BY REGION, 2020-2027, (‘000 TONS)
    94. TABLE 38 NORTH AMERICA ADHESIVES FOR HANDHELD DEVICES MARKET, BY COUNTRY, 2020-2027,
    95. (USD MILLION) 54 TABLE 39 NORTH AMERICA ADHESIVES FOR HANDHELD DEVICES MARKET, BY
    96. COUNTRY, 2020-2027, (‘000 TONS) 54 TABLE 40 NORTH AMERICA ADHESIVES FOR HANDHELD
    97. DEVICES MARKET, BY TYPE, 2020-2027, (USD MILLION) 55 TABLE 41 NORTH AMERICA ADHESIVES
    98. FOR HANDHELD DEVICES MARKET, BY TYPE, 2020-2027, (‘000 TONS) 55 TABLE 42 NORTH
    99. AMERICA ADHESIVES FOR HANDHELD DEVICES MARKET, BY TYPE, 2020-2027, (USD MILLION)
    100. TABLE 43 NORTH AMERICA ADHESIVES FOR HANDHELD DEVICES MARKET, BY TYPE, 2020-2027,
    101. (‘000 TONS) 56 TABLE 44 U.S ADHESIVES FOR HANDHELD DEVICES MARKET, BY TYPE,
    102. 2027, (USD MILLION) 57 TABLE 45 U.S ADHESIVES FOR HANDHELD DEVICES MARKET,
    103. BY TYPE, 2020-2027, (‘000 TONS) 57 TABLE 46 U.S ADHESIVES FOR HANDHELD DEVICES
    104. MARKET, BY APPLICATION, 2020-2027, (USD MILLION) 58 TABLE 47 U.S ADHESIVES FOR HANDHELD
    105. DEVICES MARKET, BY APPLICTAION, 2020-2027, (‘000 TONS) 58 TABLE 48 CANADA
    106. ADHESIVES FOR HANDHELD DEVICES MARKET, BY TYPE, 2020-2027, (USD MILLION) 59 TABLE
    107. CANADA ADHESIVES FOR HANDHELD DEVICES MARKET, BY TYPE, 2020-2027, (‘000
    108. TONS) 59 TABLE 50 CANADA ADHESIVES FOR HANDHELD DEVICES MARKET, BY APPLICATION,
    109. 2027, (USD MILLION) 60 TABLE 51 CANADA ADHESIVES FOR HANDHELD DEVICES MARKET,
    110. BY APPLICATION, 2020-2027, (‘000 TONS) 60 TABLE 52 EUROPE ADHESIVES FOR HANDHELD
    111. DEVICES MARKET, BY COUNTRY, 2020-2027, (USD MILLION) 61 TABLE 53 EUROPE ADHESIVES
    112. FOR HANDHELD DEVICES MARKET, BY COUNTRY, 2020-2027, (‘000 TONS) 61 TABLE 54
    113. EUROPE ADHESIVES FOR HANDHELD DEVICES MARKET, BY TYPE, 2020-2027, (USD MILLION)
    114. TABLE 55 EUROPE ADHESIVES FOR HANDHELD DEVICES MARKET, BY TYPE, 2020-2027, (‘000
    115. TONS) 62 TABLE 56 EUROPE ADHESIVES FOR HANDHELD DEVICES MARKET, BY TYPE, 2020-2027,
    116. (USD MILLION) 63 TABLE 57 EUROPE ADHESIVES FOR HANDHELD DEVICES MARKET, BY TYPE,
    117. 2027, (‘000 TONS) 63 TABLE 58 GERMANY ADHESIVES FOR HANDHELD DEVICES
    118. MARKET, BY TYPE, 2020-2027, (USD MILLION) 64 TABLE 59 GERMANY ADHESIVES FOR HANDHELD
    119. DEVICES MARKET, BY TYPE, 2020-2027, (‘000 TONS) 64 TABLE 60 GERMANY ADHESIVES
    120. FOR HANDHELD DEVICES MARKET, BY APPLICATION, 2020-2027, (USD MILLION) 65 TABLE 61
    121. GERMANY ADHESIVES FOR HANDHELD DEVICES MARKET, BY APPLICATION, 2020-2027, (‘000
    122. TONS) 65 TABLE 62 FRANCE ADHESIVES FOR HANDHELD DEVICES MARKET, BY TYPE, 2020-2027,
    123. (USD MILLION) 66 TABLE 63 FRANCE ADHESIVES FOR HANDHELD DEVICES MARKET, BY TYPE,
    124. 2027, (‘000 TONS) 66 TABLE 64 FRANCE ADHESIVES FOR HANDHELD DEVICES MARKET,
    125. BY APPLICATION, 2020-2027, (USD MILLION) 67 TABLE 65 FRANCE ADHESIVES FOR HANDHELD
    126. DEVICES MARKET, BY APPLICATION, 2020-2027, (‘000 TONS) 67 TABLE 66 UK ADHESIVES
    127. FOR HANDHELD DEVICES MARKET, BY TYPE, 2020-2027, (USD MILLION) 68 TABLE 67 UK ADHESIVES
    128. FOR HANDHELD DEVICES MARKET, BY TYPE, 2020-2027, (‘000 TONS) 68 TABLE 68 UK
    129. ADHESIVES FOR HANDHELD DEVICES MARKET, BY APPLICATION, 2020-2027, (USD MILLION)
    130. TABLE 69 UK ADHESIVES FOR HANDHELD DEVICES MARKET, BY APPLICATION, 2020-2027,
    131. (‘000 TONS) 69 TABLE 70 ITALY ADHESIVES FOR HANDHELD DEVICES MARKET, BY TYPE,
    132. 2027, (USD MILLION) 70 TABLE 71 ITALY ADHESIVES FOR HANDHELD DEVICES MARKET,
    133. BY TYPE, 2020-2027, (‘000 TONS) 70 TABLE 72 ITALY ADHESIVES FOR HANDHELD DEVICES
    134. MARKET, BY APPLICATION, 2020-2027, (USD MILLION) 71 TABLE 73 ITALY ADHESIVES FOR
    135. HANDHELD DEVICES MARKET, BY APPLICATION, 2020-2027, (‘000 TONS) 71 TABLE 74
    136. SPAIN ADHESIVES FOR HANDHELD DEVICES MARKET, BY TYPE, 2020-2027, (USD MILLION) 72
    137. TONS) 72 TABLE 76 SPAIN ADHESIVES FOR HANDHELD DEVICES MARKET, BY APPLICATION, 2020-2027,
    138. (USD MILLION) 73 TABLE 77 SPAIN ADHESIVES FOR HANDHELD DEVICES MARKET, BY APPLICATION,
    139. 2027, (‘000 TONS) 73 TABLE 78 REST OF EUROPE ADHESIVES FOR HANDHELD DEVICES
    140. MARKET, BY TYPE, 2020-2027, (USD MILLION) 74 TABLE 79 REST OF EUROPE ADHESIVES FOR
    141. HANDHELD DEVICES MARKET, BY TYPE, 2020-2027, (‘000 TONS) 74 TABLE 80 REST
    142. OF EUROPE ADHESIVES FOR HANDHELD DEVICES MARKET, BY APPLICATION, 2020-2027, (USD
    143. MILLION) 74 TABLE 81 REST OF EUROPE ADHESIVES FOR HANDHELD DEVICES MARKET, BY APPLICATION,
    144. 2027, (‘000 TONS) 75 TABLE 82 ASIA PACIFIC ADHESIVES FOR HANDHELD DEVICES
    145. MARKET, BY COUNTRY, 2020-2027, (USD MILLION) 76 TABLE 83 ASIA PACIFIC ADHESIVES
    146. FOR HANDHELD DEVICES MARKET, BY COUNTRY, 2020-2027, (‘000 TONS) 76 TABLE 84
    147. ASIA PACIFIC ADHESIVES FOR HANDHELD DEVICES MARKET, BY TYPE, 2020-2027, (USD MILLION)
    148. TABLE 85 ASIA PACIFIC ADHESIVES FOR HANDHELD DEVICES MARKET, BY TYPE, 2020-2027,
    149. (‘000 TONS) 77 TABLE 86 ASIA PACIFIC ADHESIVES FOR HANDHELD DEVICES MARKET,
    150. BY TYPE, 2020-2027, (USD MILLION) 78 TABLE 87 ASIA PACIFIC ADHESIVES FOR HANDHELD
    151. DEVICES MARKET, BY TYPE, 2020-2027, (‘000 TONS) 78 TABLE 88 CHINA ADHESIVES
    152. FOR HANDHELD DEVICES MARKET, BY TYPE, 2020-2027, (USD MILLION) 79 TABLE 89 CHINA
    153. ADHESIVES FOR HANDHELD DEVICES MARKET, BY TYPE, 2020-2027, (‘000 TONS) 79
    154. (USD MILLION) 80 TABLE 91 CHINA ADHESIVES FOR HANDHELD DEVICES MARKET, BY APPLICATION,
    155. 2027, (‘000 TONS) 80 TABLE 92 JAPAN ADHESIVES FOR HANDHELD DEVICES MARKET,
    156. BY TYPE, 2020-2027, (USD MILLION) 81 TABLE 93 JAPAN ADHESIVES FOR HANDHELD DEVICES
    157. MARKET, BY TYPE, 2020-2027, (‘000 TONS) 81 TABLE 94 JAPAN ADHESIVES FOR HANDHELD
    158. DEVICES MARKET, BY APPLICATION, 2020-2027, (USD MILLION) 82 TABLE 95 JAPAN ADHESIVES
    159. FOR HANDHELD DEVICES MARKET, BY APPLICATION, 2020-2027, (‘000 TONS) 82 TABLE
    160. INDIA ADHESIVES FOR HANDHELD DEVICES MARKET, BY TYPE, 2020-2027, (USD MILLION)
    161. TABLE 97 INDIA ADHESIVES FOR HANDHELD DEVICES MARKET, BY TYPE, 2020-2027, (‘000
    162. TONS) 83 TABLE 98 INDIA ADHESIVES FOR HANDHELD DEVICES MARKET, BY APPLICATION, 2020-2027,
    163. (USD MILLION) 84 TABLE 99 INDIA ADHESIVES FOR HANDHELD DEVICES MARKET, BY APPLICATION,
    164. 2027, (‘000 TONS) 84 TABLE 100 REST OF ASIA-PACIFIC ADHESIVES FOR HANDHELD
    165. DEVICES MARKET, BY TYPE, 2020-2027, (USD MILLION) 85 TABLE 101 REST OF ASIA-PACIFIC
    166. ADHESIVES FOR HANDHELD DEVICES MARKET, BY TYPE, 2020-2027, (‘000 TONS) 85
    167. 2027, (USD MILLION) 85 TABLE 103 REST OF ASIA-PACIFIC ADHESIVES FOR HANDHELD
    168. DEVICES MARKET, BY APPLICATION, 2020-2027, (‘000 TONS) 86 TABLE 104 LATIN
    169. AMERICA ADHESIVES FOR HANDHELD DEVICES MARKET, BY COUNTRY, 2020-2027, (USD MILLION)
    170. TABLE 105 LATIN AMERICA ADHESIVES FOR HANDHELD DEVICES MARKET, BY COUNTRY, 2020-2027,
    171. (‘000 TONS) 87 TABLE 106 LATIN AMERICA ADHESIVES FOR HANDHELD DEVICES MARKET,
    172. BY TYPE, 2020-2027, (USD MILLION) 87 TABLE 107 LATIN AMERICA ADHESIVES FOR HANDHELD
    173. DEVICES MARKET, BY TYPE, 2020-2027, (‘000 TONS) 88 TABLE 108 LATIN AMERICA
    174. ADHESIVES FOR HANDHELD DEVICES MARKET, BY TYPE, 2020-2027, (USD MILLION) 88 TABLE
    175. LATIN AMERICA ADHESIVES FOR HANDHELD DEVICES MARKET, BY TYPE, 2020-2027, (‘000
    176. TONS) 89 TABLE 110 MIDDLE EAST & AFRICA ADHESIVES FOR HANDHELD DEVICES MARKET,
    177. BY COUNTRY, 2020-2027, (USD MILLION) 89 TABLE 111 MIDDLE EAST & AFRICA ADHESIVES
    178. FOR HANDHELD DEVICES MARKET, BY COUNTRY, 2020-2027, (‘000 TONS) 89 TABLE 112
    179. MIDDLE EAST & AFRICA ADHESIVES FOR HANDHELD DEVICES MARKET, BY TYPE, 2020-2027,
    180. (USD MILLION) 90 TABLE 113 MIDDLE EAST & AFRICA ADHESIVES FOR HANDHELD DEVICES
    181. MARKET, BY TYPE, 2020-2027, (‘000 TONS) 90 TABLE 114 MIDDLE EAST & AFRICA
    182. ADHESIVES FOR HANDHELD DEVICES MARKET, BY TYPE, 2020-2027, (USD MILLION) 91 TABLE
    183. MIDDLE EAST & AFRICA ADHESIVES FOR HANDHELD DEVICES MARKET, BY TYPE, 2020-2027,
    184. (‘000 TONS) 91 TABLE 116 GLOBAL SEALANTS FOR HANDHELD DEVICES MARKET, BY SEALANTS
    185. TYPE 2020-2027 (USD MILLION) 92 TABLE 117 GLOBAL SEALANTS FOR HANDHELD DEVICES MARKET,
    186. BY SEALANTS TYPE 2020-2027 (‘000 TONS) 93 TABLE 118 GLOBAL SEALANTS FOR HANDHELD
    187. DEVICES MARKET FOR SEALANTS TYPE, BY REGION, 2020-2027, (USD MILLION) 94 TABLE 119
    188. GLOBAL SEALANTS FOR HANDHELD DEVICES MARKET FOR SEALANTS TYPE, BY REGION, 2020-2027,
    189. (‘000 TONS) 94 TABLE 120 GLOBAL SEALANTS FOR HANDHELD DEVICES MARKET FOR SILICONE
    190. SEALANTS, BY REGION, 2020-2027, (USD MILLION) 95 TABLE 121 GLOBAL SEALANTS FOR HANDHELD
    191. DEVICES MARKET FOR SILICONE SEALANTS, BY REGION, 2020-2027, (‘000 TONS) 95
    192. BY REGION, 2020-2027, (USD MILLION) 96 TABLE 123 GLOBAL SEALANTS FOR HANDHELD DEVICES
    193. MARKET FOR POLYURETHANE SEALANTS, BY REGION, 2020-2027, (‘000 TONS) 96 TABLE
    194. GLOBAL SEALANTS FOR HANDHELD DEVICES MARKET FOR ACRYLIC LATEX SEALANTS, BY REGION,
    195. 2027, (USD MILLION) 97 TABLE 125 GLOBAL SEALANTS FOR HANDHELD DEVICES MARKET
    196. FOR ACRYLIC LATEX SEALANTS, BY REGION, 2020-2027, (‘000 TONS) 97 TABLE 126
    197. GLOBAL SEALANTS FOR HANDHELD DEVICES MARKET FOR EPOXY SEALANTS, BY REGION, 2020-2027,
    198. (USD MILLION) 98 TABLE 127 GLOBAL SEALANTS FOR HANDHELD DEVICES MARKET FOR EPOXY
    199. SEALANTS , BY REGION, 2020-2027, (‘000 TONS) 98 TABLE 128 GLOBAL SEALANTS
    200. FOR HANDHELD DEVICES MARKET FOR BUTYL SEALANTS, BY REGION, 2020-2027, (USD MILLION)
    201. TABLE 129 GLOBAL SEALANTS FOR HANDHELD DEVICES MARKET FOR BUTYL SEALANTS , BY
    202. REGION, 2020-2027, (‘000 TONS) 99 TABLE 130 GLOBAL SEALANTS FOR HANDHELD DEVICES
    203. MARKET FOR OTHERS, BY REGION, 2020-2027, (USD MILLION) 100 TABLE 131 GLOBAL SEALANTS
    204. FOR HANDHELD DEVICES MARKET FOR OTHERS, BY REGION, 2020-2027, (‘000 TONS)
    205. TABLE 132 GLOBAL SEALANTS FOR HANDHELD DEVICES MARKET, BY SEALANTS APPLICATION
    206. 2027 (USD MILLION) 101 TABLE 133 GLOBAL SEALANTS FOR HANDHELD DEVICES MARKET,
    207. BY SEALANTS APPLICATION 2020-2027 (‘000 TONS) 102 TABLE 134 GLOBAL SEALANTS
    208. FOR HANDHELD DEVICES MARKET FOR SEALANTS APPLICATION, BY REGION, 2020-2027, (USD
    209. MILLION) 103 TABLE 135 GLOBAL SEALANTS FOR HANDHELD DEVICES MARKET FOR SEALANTS
    210. APPLICATION, BY REGION, 2020-2027, (‘000 TONS) 103 TABLE 136 GLOBAL SEALANTS
    211. FOR HANDHELD DEVICES MARKET FOR MOBILE PHONE, BY REGION, 2020-2027, (USD MILLION)
    212. TABLE 137 GLOBAL SEALANTS FOR HANDHELD DEVICES MARKET FOR MOBILE PHONE, BY REGION,
    213. 2027, (‘000 TONS) 104 TABLE 138 GLOBAL SEALANTS FOR HANDHELD DEVICES
    214. MARKET FOR LAPTOP, BY REGION, 2020-2027, (USD MILLION) 105 TABLE 139 GLOBAL SEALANTS
    215. FOR HANDHELD DEVICES MARKET FOR LAPTOP, BY REGION, 2020-2027, (‘000 TONS)
    216. TABLE 140 GLOBAL SEALANTS FOR HANDHELD DEVICES MARKET FOR HARD DISC DRIVES,
    217. BY REGION, 2020-2027, (USD MILLION) 106 TABLE 141 GLOBAL SEALANTS FOR HANDHELD DEVICES
    218. MARKET FOR HARD DISC DRIVES, BY REGION, 2020-2027, (‘000 TONS) 106 TABLE 142
    219. GLOBAL SEALANTS FOR HANDHELD DEVICES MARKET FOR MEDICAL DEVICES, BY REGION, 2020-2027,
    220. (USD MILLION) 107 TABLE 143 GLOBAL SEALANTS FOR HANDHELD DEVICES MARKET FOR MEDICAL
    221. DEVICES, BY REGION, 2020-2027, (‘000 TONS) 107 TABLE 144 GLOBAL SEALANTS FOR
    222. HANDHELD DEVICES MARKET FOR OTHERS, BY REGION, 2020-2027, (USD MILLION) 108 TABLE
    223. GLOBAL SEALANTS FOR HANDHELD DEVICES MARKET FOR OTHERS, BY REGION, 2020-2027,
    224. (‘000 TONS) 108 TABLE 146 GLOBAL SEALANTS FOR HANDHELD DEVICES MARKET, BY
    225. REGION, 2020-2027, (USD MILLION) 109 TABLE 147 GLOBAL SEALANTS FOR HANDHELD DEVICES
    226. MARKET, BY REGION, 2020-2027, (USD MILLION) 109 TABLE 148 GLOBAL SEALANTS FOR HANDHELD
    227. DEVICES MARKET, BY REGION, 2020-2027, (‘000 TONS) 110 TABLE 149 GLOBAL SEALANTS
    228. FOR HANDHELD DEVICES MARKET, BY REGION, 2020-2027, (‘000 TONS) 110 TABLE 150
    229. GLOBAL SEALANTS FOR HANDHELD DEVICES MARKET FOR TYPE, BY REGION, 2020-2027, (USD
    230. MILLION) 111 TABLE 151 GLOBAL SEALANTS FOR HANDHELD DEVICES MARKET FOR TYPE, BY
    231. REGION, 2020-2027, (‘000 TONS) 111 TABLE 152 GLOBAL SEALANTS FOR HANDHELD
    232. DEVICES MARKET FOR APPLICATION, BY REGION, 2020-2027, (USD MILLION) 111 TABLE 153
    233. GLOBAL SEALANTS FOR HANDHELD DEVICES MARKET FOR APPLICATION, BY REGION, 2020-2027,
    234. (‘000 TONS) 112 TABLE 154 NORTH AMERICA SEALANTS FOR HANDHELD DEVICES MARKET,
    235. BY COUNTRY, 2020-2027, (USD MILLION) 113 TABLE 155 NORTH AMERICA SEALANTS FOR HANDHELD
    236. DEVICES MARKET, BY COUNTRY, 2020-2027, (‘000 TONS) 113 TABLE 156 NORTH AMERICA
    237. SEALANTS FOR HANDHELD DEVICES MARKET, BY TYPE, 2020-2027, (USD MILLION) 114 TABLE
    238. NORTH AMERICA SEALANTS FOR HANDHELD DEVICES MARKET, BY TYPE , 2020-2027, (‘000
    239. TONS) 114 TABLE 158 NORTH AMERICA SEALANTS FOR HANDHELD DEVICES MARKET, BY TYPE,
    240. 2027, (USD MILLION) 114 TABLE 159 NORTH AMERICA SEALANTS FOR HANDHELD DEVICES
    241. MARKET, BY TYPE, 2020-2027, (‘000 TONS) 115 TABLE 160 U.S SEALANTS FOR HANDHELD
    242. DEVICES MARKET, BY TYPE, 2020-2027, (USD MILLION) 116 TABLE 161 U.S SEALANTS FOR
    243. HANDHELD DEVICES MARKET, BY TYPE, 2020-2027, (‘000 TONS) 116 TABLE 162 U.S
    244. SEALANTS FOR HANDHELD DEVICES MARKET, BY APPLICATION, 2020-2027, (USD MILLION) 117
    245. TONS) 117 TABLE 164 CANADA SEALANTS FOR HANDHELD DEVICES MARKET, BY TYPE, 2020-2027,
    246. (USD MILLION) 118 TABLE 165 CANADA SEALANTS FOR HANDHELD DEVICES MARKET, BY TYPE,
    247. 2027, (‘000 TONS) 118 TABLE 166 CANADA SEALANTS FOR HANDHELD DEVICES
    248. MARKET, BY APPLICATION, 2020-2027, (USD MILLION) 119 TABLE 167 CANADA SEALANTS FOR
    249. HANDHELD DEVICES MARKET, BY APPLICATION, 2020-2027, (‘000 TONS) 119 TABLE
    250. EUROPE SEALANTS FOR HANDHELD DEVICES MARKET, BY COUNTRY, 2020-2027, (USD MILLION)
    251. TABLE 169 EUROPE SEALANTS FOR HANDHELD DEVICES MARKET, BY COUNTRY, 2020-2027,
    252. (‘000 TONS) 120 TABLE 170 EUROPE SEALANTS FOR HANDHELD DEVICES MARKET, BY
    253. TYPE, 2020-2027, (USD MILLION) 120 TABLE 171 EUROPE SEALANTS FOR HANDHELD DEVICES
    254. MARKET, BY TYPE, 2020-2027, (‘000 TONS) 121 TABLE 172 EUROPE SEALANTS FOR
    255. HANDHELD DEVICES MARKET, BY TYPE, 2020-2027, (USD MILLION) 122 TABLE 173 EUROPE
    256. SEALANTS FOR HANDHELD DEVICES MARKET, BY TYPE, 2020-2027, (‘000 TONS) 122
    257. MILLION) 123 TABLE 175 GERMANY SEALANTS FOR HANDHELD DEVICES MARKET, BY TYPE, 2020-2027,
    258. (‘000 TONS) 123 TABLE 176 GERMANY SEALANTS FOR HANDHELD DEVICES MARKET, BY
    259. APPLICATION, 2020-2027, (USD MILLION) 124 TABLE 177 GERMANY SEALANTS FOR HANDHELD
    260. DEVICES MARKET, BY APPLICATION, 2020-2027, (‘000 TONS) 124 TABLE 178 FRANCE
    261. SEALANTS FOR HANDHELD DEVICES MARKET, BY TYPE, 2020-2027, (USD MILLION) 125 TABLE
    262. FRANCE SEALANTS FOR HANDHELD DEVICES MARKET, BY TYPE, 2020-2027, (‘000
    263. TONS) 125 TABLE 180 FRANCE SEALANTS FOR HANDHELD DEVICES MARKET, BY APPLICATION,
    264. 2027, (USD MILLION) 126 TABLE 181 FRANCE SEALANTS FOR HANDHELD DEVICES MARKET,
    265. BY APPLICATION, 2020-2027, (‘000 TONS) 126 TABLE 182 UK SEALANTS FOR HANDHELD
    266. DEVICES MARKET, BY TYPE, 2020-2027, (USD MILLION) 127 TABLE 183 UK SEALANTS FOR
    267. HANDHELD DEVICES MARKET, BY TYPE, 2020-2027, (‘000 TONS) 127 TABLE 184 UK
    268. SEALANTS FOR HANDHELD DEVICES MARKET, BY APPLICATION, 2020-2027, (USD MILLION) 128
    269. TONS) 128 TABLE 186 ITALY SEALANTS FOR HANDHELD DEVICES MARKET, BY TYPE, 2020-2027,
    270. (USD MILLION) 129 TABLE 187 ITALY SEALANTS FOR HANDHELD DEVICES MARKET, BY TYPE,
    271. 2027, (‘000 TONS) 129 TABLE 188 ITALY SEALANTS FOR HANDHELD DEVICES MARKET,
    272. BY APPLICATION, 2020-2027, (USD MILLION) 130 TABLE 189 ITALY SEALANTS FOR HANDHELD
    273. DEVICES MARKET, BY APPLICATION, 2020-2027, (‘000 TONS) 130 TABLE 190 SPAIN
    274. SEALANTS FOR HANDHELD DEVICES MARKET, BY TYPE, 2020-2027, (USD MILLION) 131 TABLE
    275. SPAIN SEALANTS FOR HANDHELD DEVICES MARKET, BY TYPE, 2020-2027, (‘000
    276. TONS) 131 TABLE 192 SPAIN SEALANTS FOR HANDHELD DEVICES MARKET, BY APPLICATION,
    277. 2027, (USD MILLION) 132 TABLE 193 SPAIN SEALANTS FOR HANDHELD DEVICES MARKET,
    278. BY APPLICATION, 2020-2027, (‘000 TONS) 132 TABLE 194 REST OF EUROPE SEALANTS
    279. FOR HANDHELD DEVICES MARKET, BY TYPE, 2020-2027, (USD MILLION) 133 TABLE 195 REST
    280. OF EUROPE SEALANTS FOR HANDHELD DEVICES MARKET, BY TYPE, 2020-2027, (‘000
    281. TONS) 134 TABLE 196 REST OF EUROPE SEALANTS FOR HANDHELD DEVICES MARKET, BY APPLICATION,
    282. 2027, (USD MILLION) 134 TABLE 197 REST OF EUROPE SEALANTS FOR HANDHELD DEVICES
    283. MARKET, BY APPLICATION, 2020-2027, (‘000 TONS) 134 TABLE 198 ASIA PACIFIC
    284. SEALANTS FOR HANDHELD DEVICES MARKET, BY COUNTRY, 2020-2027, (USD MILLION) 135 TABLE
    285. ASIA PACIFIC SEALANTS FOR HANDHELD DEVICES MARKET, BY COUNTRY, 2020-2027, (‘000
    286. TONS) 135 TABLE 200 ASIA PACIFIC SEALANTS FOR HANDHELD DEVICES MARKET, BY TYPE,
    287. 2027, (USD MILLION) 136 TABLE 201 ASIA PACIFIC SEALANTS FOR HANDHELD DEVICES
    288. MARKET, BY TYPE, 2020-2027, (‘000 TONS) 136 TABLE 202 ASIA PACIFIC SEALANTS
    289. FOR HANDHELD DEVICES MARKET, BY TYPE, 2020-2027, (USD MILLION) 137 TABLE 203 ASIA
    290. PACIFIC SEALANTS FOR HANDHELD DEVICES MARKET, BY TYPE, 2020-2027, (‘000 TONS)
    291. TABLE 204 CHINA SEALANTS FOR HANDHELD DEVICES MARKET, BY TYPE, 2020-2027, (USD
    292. MILLION) 137 TABLE 205 CHINA SEALANTS FOR HANDHELD DEVICES MARKET, BY TYPE, 2020-2027,
    293. (‘000 TONS) 138 TABLE 206 CHINA SEALANTS FOR HANDHELD DEVICES MARKET, BY APPLICATION,
    294. 2027, (USD MILLION) 138 TABLE 207 CHINA SEALANTS FOR HANDHELD DEVICES MARKET,
    295. BY APPLICATION, 2020-2027, (‘000 TONS) 139 TABLE 208 JAPAN SEALANTS FOR HANDHELD
    296. DEVICES MARKET, BY TYPE, 2020-2027, (USD MILLION) 139 TABLE 209 JAPAN SEALANTS FOR
    297. HANDHELD DEVICES MARKET, BY TYPE, 2020-2027, (‘000 TONS) 140 TABLE 210 JAPAN
    298. SEALANTS FOR HANDHELD DEVICES MARKET, BY APPLICATION, 2020-2027, (USD MILLION) 140
    299. (‘000 TONS) 141 TABLE 212 INDIA SEALANTS FOR HANDHELD DEVICES MARKET, BY TYPE,
    300. 2027, (USD MILLION) 141 TABLE 213 INDIA SEALANTS FOR HANDHELD DEVICES MARKET,
    301. BY TYPE, 2020-2027, (‘000 TONS) 142 TABLE 214 INDIA SEALANTS FOR HANDHELD
    302. DEVICES MARKET, BY APPLICATION, 2020-2027, (USD MILLION) 142 TABLE 215 INDIA SEALANTS
    303. FOR HANDHELD DEVICES MARKET, BY APPLICATION, 2020-2027, (‘000 TONS) 143 TABLE
    304. REST OF ASIA-PACIFIC SEALANTS FOR HANDHELD DEVICES MARKET, BY TYPE, 2020-2027,
    305. (USD MILLION) 143 TABLE 217 REST OF ASIA-PACIFIC SEALANTS FOR HANDHELD DEVICES MARKET,
    306. BY TYPE, 2020-2027, (‘000 TONS) 143 TABLE 218 REST OF ASIA-PACIFIC SEALANTS
    307. FOR HANDHELD DEVICES MARKET, BY APPLICATION, 2020-2027, (USD MILLION) 144 TABLE
    308. REST OF ASIA-PACIFIC SEALANTS FOR HANDHELD DEVICES MARKET, BY APPLICATION, 2020-2027,
    309. (‘000 TONS) 144 TABLE 220 LATIN AMERICA SEALANTS FOR HANDHELD DEVICES MARKET,
    310. BY COUNTRY, 2020-2027, (USD MILLION) 146 TABLE 221 LATIN AMERICA SEALANTS FOR HANDHELD
    311. DEVICES MARKET, BY COUNTRY, 2020-2027, (‘000 TONS) 146 TABLE 222 LATIN AMERICA
    312. SEALANTS FOR HANDHELD DEVICES MARKET, BY TYPE, 2020-2027, (USD MILLION) 146 TABLE
    313. LATIN AMERICA SEALANTS FOR HANDHELD DEVICES MARKET, BY TYPE, 2020-2027, (‘000
    314. TONS) 147 TABLE 224 LATIN AMERICA SEALANTS FOR HANDHELD DEVICES MARKET, BY TYPE,
    315. 2027, (USD MILLION) 147 TABLE 225 LATIN AMERICA SEALANTS FOR HANDHELD DEVICES
    316. MARKET, BY TYPE, 2020-2027, (‘000 TONS) 148 TABLE 226 MIDDLE EAST & AFRICA
    317. SEALANTS FOR HANDHELD DEVICES MARKET, BY COUNTRY, 2020-2027, (USD MILLION) 148 TABLE
    318. MIDDLE EAST & AFRICA SEALANTS FOR HANDHELD DEVICES MARKET, BY COUNTRY, 2020-2027,
    319. (‘000 TONS) 148 TABLE 228 MIDDLE EAST & AFRICA SEALANTS FOR HANDHELD DEVICES
    320. MARKET, BY TYPE, 2020-2027, (USD MILLION) 149 TABLE 229 MIDDLE EAST & AFRICA
    321. SEALANTS FOR HANDHELD DEVICES MARKET, BY TYPE, 2020-2027, (‘000 TONS) 149
    322. 2027, (USD MILLION) 149 TABLE 231 MIDDLE EAST & AFRICA SEALANTS FOR HANDHELD
    323. DEVICES MARKET, BY TYPE, 2020-2027, (‘000 TONS) 150 TABLE 232 GLOBAL ADHESIVES
    324. MARKET FOR HANDHELD DEVICES PRICING & FORECAST (USD/TON) (2020 –2023)
    325. TABLE 233 GLOBAL SEALANTS MARKET FOR HANDHELD DEVICES PRICING & FORECAST
    326. (USD/TON) (2020 –2023) 152 TABLE 234 HENKEL AG & CO. KGAA: SEGMENT OVERVIEW
    327. TABLE 235 HENKEL AG & CO. KGAA:KEY DEVELOPMENTS 157 TABLE 236 3M: SEGMENT
    328. OVERVIEW 158 TABLE 237 3M: KEY DEVELOPMENTS 159 TABLE 238 EVONIK INDUSTRIES AG:
    329. SEGMENT OVERVIEW 160 TABLE 239 EVONIK INDUSTRIES AG:KEY DEVELOPMENTS 161 TABLE 240
    330. DOW CORNING CORPORATION: SEGMENT OVERVIEW 162 TABLE 241 FIGURE 4 DOW CORNING CORPORATION:
    331. KEY DEVELOPMENTS 163 TABLE 242 PRODUCT/BUSINESS SEGMENT OVERVIEW 164 17 List of
    332. SEALANTS FOR HANDHELD DEVICES MARKET 23 FIGURE 4 WORLDWIDE MOBILE PHONES & SMARTPHONES
    333. SHIPMENT, (2020-2027) 25 FIGURE 5 GLOBAL DETACHBLE LAPTOPS SHIPMENT, (2020-2027)
    334. FIGURE 6 GLOBAL PCB MARKET REVENUE, (2020-2027) 27 FIGURE 7 GLOBAL CONSUMER ELECTRONICS
    335. REVENUE, (2020-2027) 27 FIGURE 8 SUPPLY CHAIN ANALYSIS 31 FIGURE 9 GLOBAL ADHESIVES
    336. FOR HANDHELD DEVICES MARKET, BY ADHESIVE TYPE 2020-2027 (USD MILLION) 34 FIGURE
    337. GLOBAL ADHESIVES FOR HANDHELD DEVICES MARKET, BY ADHESIVE TYPE 2020-2027 (‘000
    338. TONS) 35 FIGURE 11 GLOBAL ADHESIVES FOR HANDHELD DEVICES MARKET, BY APPLICTAION,
    339. 2027, (USD MILLION) 42 FIGURE 12 GLOBAL ADHESIVES FOR HANDHELD DEVICES MARKET,
    340. BY APPLICATION, 2020-2027, (‘000 TONS) 43 FIGURE 13 GLOBAL ADHESIVES FOR HANDHELD
    341. DEVICES MARKET, BY REGION, 2020-2027, (USD MILLION) 50 FIGURE 14 GLOBAL ADHESIVES
    342. FOR HANDHELD DEVICES MARKET, BY REGION, 2020-2027, (‘000 TONS) 51 FIGURE 15
    343. GLOBAL SEALANTS FOR HANDHELD DEVICES MARKET, BY SEALANTS TYPE 2020-2027 (USD MILLION)
    344. FIGURE 16 GLOBAL SEALANTS FOR HANDHELD DEVICES MARKET, BY SEALANTS TYPE 2020-2027
    345. (‘000 TONS) 93 FIGURE 17 GLOBAL SEALANTS FOR HANDHELD DEVICES MARKET, BY SEALANTS
    346. APPLICATION 2020-2027 (USD MILLION) 101 FIGURE 18 GLOBAL SEALANTS FOR HANDHELD DEVICES
    347. MARKET, BY SEALANTS APPLICATION 2020-2027 (‘000 TONS) 102 FIGURE 19 MARKET
    348. SHARE ANALYSIS, BY KEY PLAYERS (2020 ) 151 FIGURE 20 HENKEL AG & CO. KGAA: FINANCIAL
    349. UPDATES 157 FIGURE 21 3M: FINANCIAL UPDATES 159 FIGURE 22 EVONIK INDUSTRIES AG:
    350. FINANCIAL UPDATES 161 FIGURE 23 DOW CORNING CORPORATION (CONSUMER SOLUTION) : FINANCIAL
    351. UPDATES 163 FIGURE 24 H.B FULLER: BUSINESS SEGMENT REVENUE 166 FIGURE 25 H.B FULLER:
    352. BUSINESS SEGMENT REVENUE 2020  166 FIGURE 26 H.B FULLER: OPERATING INCOME 167
    353.  1 Report Prologue
    354. Report Prologue
    355. Scope of The Report
      1. Market Definition 17
    356. Scope of The Study 17
      1. Research Objectives 17
    357. Assumptions 17
      1. Limitations 18
    358. Markets Structure 18
    359. Research Methodology
      1. Research Process
      2. Primary Research 20
    360. Secondary Research 20
      1. Market Size Estimation 20
    361. Market Dynamics
      1. Introduction 23
      2. Drivers
        1. Penetration of Smartphones and Tablets to Surge
    362. Adhesive & Sealants Demand 24
      1. Rising Popularity
    363. of Gaming Laptops & Detachable Laptops 25
      1. Augmenting
    364. Demand for Adhesive & Sealants in PCB Applications 26
    365. Growth in consumer electronics to augment adhesives and sealants demand 27
    366. Restraints 28
      1. Dramatic Surge in Adhesive &
    367. Sealant Raw Material Prices to Impede Market Growth 28
    368. Rapidly Changing Technologies in the Consumer Electronics Market 28
    369. Trends & Opportunities 29
      1. Emerging Electronic
    370. Device Assembly Hub in Southeast Asian Nations 29
    371. Significant FDI in the ASEAN Region From Developed Nations 29
    372. Product Innovation For Next Generation Electronic Devices 29
    373. Macroeconomic Indicators 30
      1. Rise in disposable
    374. income coupled with increased spending on consumer electronics 30
    375. Market Factor Analysis
      1. Supply Chain Analysis 31
    376. Raw Material Suppliers 31
      1. Adhesives & Sealants
    377. Manufacturers 31
      1. Distribution Channel 32
    378. End-User Industry 32
      1. Porter’s 5 Analysis 32
    379. Threat of New Entrants 32
      1. Threat of Rivalry 32
    380. Threat of Substitute 32
      1. Bargaining power of supplier
        1. Bargaining Power of Buyers 33
    381. Global Adhesives for Handheld Devices Market, By Adhesives Type
      1. Introduction
      2. Hot Melt Adhesive 36
    382. Pressure Sensitive Adhesives 37
      1. Waterborne Adhesives
      2. Solvent Based Adhesives 40
    383. Others 41
    384. Global Adhesives for Handheld Devices Market, By Adhesives
    385. Application
      1. Introduction 42
        1. Laptops
        2. Mobile Phones & Tablets 46
    386. Hard Disc Drives 47
      1. Medical Devices 48
    387. Others 49
    388. Global Adhesives for Handheld Devices Market,
    389. By Region
      1. Introduction 50
      2. North America
        1. U.S 57
        2. Canada
      3. Europe 61
        1. Germany
        2. France 66
        3. UK
        4. Italy 70
        5. Spain
        6. Rest of Europe 74
    390. Asia Pacific 76
      1. China 79
    391. Japan 81
      1. India 83
    392. Rest of Asia-Pacific 85
      1. Latin America 87
    393. Middle East & Africa 89
    394. Global Sealants for Handheld Devices Market,
    395. By Sealants Type
      1. Introduction 92
    396. Silicone Sealants 95
      1. Polyurethane Sealants 96
    397. Acrylic Latex Sealants 97
      1. Epoxy Sealants 98
    398. Butyl Sealants 99
      1. Others 100
    399. Global
    400. Sealants for Handheld Devices Market, By Sealants Application
      1. Introduction
        1. Mobile phone 104
    401. Laptop 105
      1. Hard Disc Drives 106
    402. Medical Devices 107
      1. Others 108
    403. Global
    404. Sealants for Handheld Devices Market, By Region
      1. Introduction 109
    405. North America 113
      1. U.S 116
    406. Canada 118
      1. Europe 120
    407. Germany 123
      1. France 125
    408. UK 127
      1. Italy 129
    409. Spain 131
      1. Rest of Europe 133
    410. Asia Pacific 135
      1. China 137
    411. Japan 139
      1. India 141
    412. Rest of Asia-Pacific 143
      1. Latin America 146
    413. Middle East & Africa 148
    414. Competitive Landscape
      1. Introduction
      2. Market Share Analysis 151
    415. Pricing Analysis 151
      1. Key Developments & Strategies
    416. Company Profiles
      1. Henkel AG & Co. KGaA 156
    417. Company Overview 156
      1. Product/Business Segment
    418. Overview 156
      1. Financial Updates 157
    419. Key Developments 157
      1. 3M 158
    420. Company Overview 158
      1. Product/Business Segment
    421. Overview 158
      1. Financial Updates 159
    422. Key Developments 159
      1. Evonik Industries AG 160
    423. Company Overview 160
      1. Product/Business Segment
    424. Overview 160
      1. Financial Updates 161
    425. Key Developments 161
      1. Dow Corning Corporation 162
    426. Company Overview 162
      1. Product/Business Segment
    427. Overview 162
      1. Financial Updates 163
    428. Key Developments 163
      1. H.B Fuller 164
    429. Company Profile 164
      1. Financial Overview 166
    430. Key Developments 167
      1. Novachem Corporations 169
    431. Company Profile 169
      1. Product/Business Segment Overview
        1. Financial Overview 171
    432. Key developments 171
      1. Tangent Industries 172
    433. Company profile 172
      1. Product/Business Segment Overview
        1. Financial Overview 173
    434. Key developments 173
    435. Conclusion
    436. List
    437. of Tables
    438. ANALYSIS: RESTRAINTS 28
    439. 2027 (USD MILLION) 34
    440. MARKET, BY ADHESIVE TYPE 2020-2027 (‘000 TONS) 35
    441. ADHESIVES FOR HANDHELD DEVICES MARKET FOR ADHESIVE TYPE, BY REGION, 2020-2027, (USD
    442. MILLION) 36
    443. TYPE, BY REGION, 2020-2027, (‘000 TONS) 36
    444. ADHESIVE FOR HANDHELD DEVICES MARKET, BY REGION 2020-2027 (USD MILLION) 36
    445. GLOBAL HOT MELT ADHESIVE FOR HANDHELD DEVICES MARKET, BY REGION 2020-2027 (‘000
    446. TONS) 37
    447. MARKET, BY REGION 2020-2027 (USD MILLION) 37
    448. SENSITIVE ADHESIVES FOR HANDHELD DEVICES MARKET, BY REGION 2020-2027 (‘000
    449. TONS) 38
    450. BY REGION 2020-2027 (USD MILLION) 38
    451. FOR HANDHELD DEVICES MARKET, BY REGION ADHESIVES 2020-2027 (‘000 TONS) 39
    452. GLOBAL SOLVENT BASED ADHESIVES FOR HANDHELD DEVICES MARKET FOR, BY REGION 2020-2027
    453. (USD MILLION) 40
    454. DEVICES MARKET FOR, BY REGION 2020-2027 (‘000 TONS) 40
    455. GLOBAL OTHERS FOR HANDHELD DEVICES MARKET, BY REGION 2020-2027 (USD MILLION) 41
    456. GLOBAL GLOBAL OTHERS FOR HANDHELD DEVICES MARKET, BY REGION 2020-2027 (‘000
    457. TONS) 41
    458. 2027, (USD MILLION) 42
    459. MARKET, BY APPLICATION, 2020-2027, (‘000 TONS) 43
    460. ADHESIVES FOR HANDHELD DEVICES MARKET FOR APPLICATION, BY REGION, 2020-2027, (USD
    461. MILLION) 44
    462. APPLICATION, BY REGION, 2020-2027, (‘000 TONS) 44
    463. ADHESIVES FOR HANDHELD DEVICES MARKET FOR LAPTOPS, BY REGION, 2020-2027, (USD MILLION)
    464. BY REGION, 2020-2027, (‘000 TONS) 45
    465. HANDHELD DEVICES MARKET FOR MOBILE PHONES & TABLETS, BY REGION, 2020-2027, (USD
    466. MILLION) 46
    467. MOBILE PHONES & TABLETS, BY REGION, 2020-2027, (‘000 TONS) 46
    468. GLOBAL ADHESIVES FOR HANDHELD DEVICES MARKET FOR HARD DISC DRIVES, BY REGION,
    469. 2027, (USD MILLION) 47
    470. MARKET FOR HARD DISC DRIVES, BY REGION, 2020-2027, (‘000 TONS) 47
    471. GLOBAL ADHESIVES FOR HANDHELD DEVICES MARKET FOR MEDICAL DEVICES, BY REGION,
    472. 2027, (USD MILLION) 48
    473. MARKET FOR MEDICAL DEVICES, BY REGION, 2020-2027, (‘000 TONS) 48
    474. GLOBAL ADHESIVES FOR HANDHELD DEVICES MARKET FOR OTHERS, BY REGION, 2020-2027,
    475. (USD MILLION) 49
    476. FOR OTHERS, BY REGION, 2020-2027, (‘000 TONS) 49
    477. ADHESIVES FOR HANDHELD DEVICES MARKET, BY REGION, 2020-2027, (USD MILLION) 50
    478. GLOBAL ADHESIVES FOR HANDHELD DEVICES MARKET, BY REGION, 2020-2027, (‘000
    479. TONS) 51
    480. BY REGION, 2020-2027, (USD MILLION) 52
    481. DEVICES MARKET FOR TYPE, BY REGION, 2020-2027, (‘000 TONS) 52
    482. GLOBAL ADHESIVES FOR HANDHELD DEVICES MARKET FOR APPLICATION, BY REGION, 2020-2027,
    483. (USD MILLION) 53
    484. FOR APPLICATION, BY REGION, 2020-2027, (‘000 TONS) 53
    485. AMERICA ADHESIVES FOR HANDHELD DEVICES MARKET, BY COUNTRY, 2020-2027, (USD MILLION)
    486. 2027, (‘000 TONS) 54
    487. DEVICES MARKET, BY TYPE, 2020-2027, (USD MILLION) 55
    488. ADHESIVES FOR HANDHELD DEVICES MARKET, BY TYPE, 2020-2027, (‘000 TONS) 55
    489. NORTH AMERICA ADHESIVES FOR HANDHELD DEVICES MARKET, BY TYPE, 2020-2027, (USD
    490. MILLION) 56
    491. BY TYPE, 2020-2027, (‘000 TONS) 56
    492. DEVICES MARKET, BY TYPE, 2020-2027, (USD MILLION) 57
    493. FOR HANDHELD DEVICES MARKET, BY TYPE, 2020-2027, (‘000 TONS) 57
    494. U.S ADHESIVES FOR HANDHELD DEVICES MARKET, BY APPLICATION, 2020-2027, (USD MILLION)
    495. 2027, (‘000 TONS) 58
    496. DEVICES MARKET, BY TYPE, 2020-2027, (USD MILLION) 59
    497. FOR HANDHELD DEVICES MARKET, BY TYPE, 2020-2027, (‘000 TONS) 59
    498. CANADA ADHESIVES FOR HANDHELD DEVICES MARKET, BY APPLICATION, 2020-2027, (USD
    499. MILLION) 60
    500. APPLICATION, 2020-2027, (‘000 TONS) 60
    501. FOR HANDHELD DEVICES MARKET, BY COUNTRY, 2020-2027, (USD MILLION) 61
    502. EUROPE ADHESIVES FOR HANDHELD DEVICES MARKET, BY COUNTRY, 2020-2027, (‘000
    503. TONS) 61
    504. 2027, (USD MILLION) 61
    505. MARKET, BY TYPE, 2020-2027, (‘000 TONS) 62
    506. FOR HANDHELD DEVICES MARKET, BY TYPE, 2020-2027, (USD MILLION) 63
    507. EUROPE ADHESIVES FOR HANDHELD DEVICES MARKET, BY TYPE, 2020-2027, (‘000
    508. TONS) 63
    509. 2027, (USD MILLION) 64
    510. MARKET, BY TYPE, 2020-2027, (‘000 TONS) 64
    511. FOR HANDHELD DEVICES MARKET, BY APPLICATION, 2020-2027, (USD MILLION) 65
    512. GERMANY ADHESIVES FOR HANDHELD DEVICES MARKET, BY APPLICATION, 2020-2027, (‘000
    513. TONS) 65
    514. 2027, (USD MILLION) 66
    515. MARKET, BY TYPE, 2020-2027, (‘000 TONS) 66
    516. FOR HANDHELD DEVICES MARKET, BY APPLICATION, 2020-2027, (USD MILLION) 67
    517. FRANCE ADHESIVES FOR HANDHELD DEVICES MARKET, BY APPLICATION, 2020-2027, (‘000
    518. TONS) 67
    519. (USD MILLION) 68
    520. TYPE, 2020-2027, (‘000 TONS) 68
    521. DEVICES MARKET, BY APPLICATION, 2020-2027, (USD MILLION) 69
    522. ADHESIVES FOR HANDHELD DEVICES MARKET, BY APPLICATION, 2020-2027, (‘000 TONS)
    523. (USD MILLION) 70
    524. BY TYPE, 2020-2027, (‘000 TONS) 70
    525. HANDHELD DEVICES MARKET, BY APPLICATION, 2020-2027, (USD MILLION) 71
    526. ITALY ADHESIVES FOR HANDHELD DEVICES MARKET, BY APPLICATION, 2020-2027, (‘000
    527. TONS) 71
    528. 2027, (USD MILLION) 72
    529. MARKET, BY TYPE, 2020-2027, (‘000 TONS) 72
    530. FOR HANDHELD DEVICES MARKET, BY APPLICATION, 2020-2027, (USD MILLION) 73
    531. SPAIN ADHESIVES FOR HANDHELD DEVICES MARKET, BY APPLICATION, 2020-2027, (‘000
    532. TONS) 73
    533. BY TYPE, 2020-2027, (USD MILLION) 74
    534. FOR HANDHELD DEVICES MARKET, BY TYPE, 2020-2027, (‘000 TONS) 74
    535. REST OF EUROPE ADHESIVES FOR HANDHELD DEVICES MARKET, BY APPLICATION, 2020-2027,
    536. (USD MILLION) 74
    537. MARKET, BY APPLICATION, 2020-2027, (‘000 TONS) 75
    538. PACIFIC ADHESIVES FOR HANDHELD DEVICES MARKET, BY COUNTRY, 2020-2027, (USD MILLION)
    539. 2027, (‘000 TONS) 76
    540. DEVICES MARKET, BY TYPE, 2020-2027, (USD MILLION) 77
    541. ADHESIVES FOR HANDHELD DEVICES MARKET, BY TYPE, 2020-2027, (‘000 TONS) 77
    542. ASIA PACIFIC ADHESIVES FOR HANDHELD DEVICES MARKET, BY TYPE, 2020-2027, (USD
    543. MILLION) 78
    544. BY TYPE, 2020-2027, (‘000 TONS) 78
    545. HANDHELD DEVICES MARKET, BY TYPE, 2020-2027, (USD MILLION) 79
    546. CHINA ADHESIVES FOR HANDHELD DEVICES MARKET, BY TYPE, 2020-2027, (‘000 TONS)
    547. 2027, (USD MILLION) 80
    548. MARKET, BY APPLICATION, 2020-2027, (‘000 TONS) 80
    549. ADHESIVES FOR HANDHELD DEVICES MARKET, BY TYPE, 2020-2027, (USD MILLION) 81
    550. JAPAN ADHESIVES FOR HANDHELD DEVICES MARKET, BY TYPE, 2020-2027, (‘000
    551. TONS) 81
    552. 2027, (USD MILLION) 82
    553. MARKET, BY APPLICATION, 2020-2027, (‘000 TONS) 82
    554. ADHESIVES FOR HANDHELD DEVICES MARKET, BY TYPE, 2020-2027, (USD MILLION) 83
    555. INDIA ADHESIVES FOR HANDHELD DEVICES MARKET, BY TYPE, 2020-2027, (‘000
    556. TONS) 83
    557. 2027, (USD MILLION) 84
    558. MARKET, BY APPLICATION, 2020-2027, (‘000 TONS) 84
    559. OF ASIA-PACIFIC ADHESIVES FOR HANDHELD DEVICES MARKET, BY TYPE, 2020-2027, (USD
    560. MILLION) 85
    561. MARKET, BY TYPE, 2020-2027, (‘000 TONS) 85
    562. ADHESIVES FOR HANDHELD DEVICES MARKET, BY APPLICATION, 2020-2027, (USD MILLION)
    563. BY APPLICATION, 2020-2027, (‘000 TONS) 86
    564. ADHESIVES FOR HANDHELD DEVICES MARKET, BY COUNTRY, 2020-2027, (USD MILLION) 87
    565. LATIN AMERICA ADHESIVES FOR HANDHELD DEVICES MARKET, BY COUNTRY, 2020-2027,
    566. (‘000 TONS) 87
    567. MARKET, BY TYPE, 2020-2027, (USD MILLION) 87
    568. FOR HANDHELD DEVICES MARKET, BY TYPE, 2020-2027, (‘000 TONS) 88
    569. LATIN AMERICA ADHESIVES FOR HANDHELD DEVICES MARKET, BY TYPE, 2020-2027, (USD
    570. MILLION) 88
    571. BY TYPE, 2020-2027, (‘000 TONS) 89
    572. ADHESIVES FOR HANDHELD DEVICES MARKET, BY COUNTRY, 2020-2027, (USD MILLION) 89
    573. MIDDLE EAST & AFRICA ADHESIVES FOR HANDHELD DEVICES MARKET, BY COUNTRY,
    574. 2027, (‘000 TONS) 89
    575. FOR HANDHELD DEVICES MARKET, BY TYPE, 2020-2027, (USD MILLION) 90
    576. MIDDLE EAST & AFRICA ADHESIVES FOR HANDHELD DEVICES MARKET, BY TYPE, 2020-2027,
    577. (‘000 TONS) 90
    578. HANDHELD DEVICES MARKET, BY TYPE, 2020-2027, (USD MILLION) 91
    579. MIDDLE EAST & AFRICA ADHESIVES FOR HANDHELD DEVICES MARKET, BY TYPE, 2020-2027,
    580. (‘000 TONS) 91
    581. BY SEALANTS TYPE 2020-2027 (USD MILLION) 92
    582. FOR HANDHELD DEVICES MARKET, BY SEALANTS TYPE 2020-2027 (‘000 TONS) 93
    583. GLOBAL SEALANTS FOR HANDHELD DEVICES MARKET FOR SEALANTS TYPE, BY REGION, 2020-2027,
    584. (USD MILLION) 94
    585. FOR SEALANTS TYPE, BY REGION, 2020-2027, (‘000 TONS) 94
    586. GLOBAL SEALANTS FOR HANDHELD DEVICES MARKET FOR SILICONE SEALANTS, BY REGION, 2020-2027,
    587. (USD MILLION) 95
    588. FOR SILICONE SEALANTS, BY REGION, 2020-2027, (‘000 TONS) 95
    589. GLOBAL SEALANTS FOR HANDHELD DEVICES MARKET FOR POLYURETHANE SEALANTS, BY REGION,
    590. 2027, (USD MILLION) 96
    591. MARKET FOR POLYURETHANE SEALANTS, BY REGION, 2020-2027, (‘000 TONS) 96
    592. GLOBAL SEALANTS FOR HANDHELD DEVICES MARKET FOR ACRYLIC LATEX SEALANTS, BY REGION,
    593. 2027, (USD MILLION) 97
    594. MARKET FOR ACRYLIC LATEX SEALANTS, BY REGION, 2020-2027, (‘000 TONS) 97
    595. GLOBAL SEALANTS FOR HANDHELD DEVICES MARKET FOR EPOXY SEALANTS, BY REGION, 2020-2027,
    596. (USD MILLION) 98
    597. FOR EPOXY SEALANTS , BY REGION, 2020-2027, (‘000 TONS) 98
    598. GLOBAL SEALANTS FOR HANDHELD DEVICES MARKET FOR BUTYL SEALANTS, BY REGION, 2020-2027,
    599. (USD MILLION) 99
    600. FOR BUTYL SEALANTS , BY REGION, 2020-2027, (‘000 TONS) 99
    601. GLOBAL SEALANTS FOR HANDHELD DEVICES MARKET FOR OTHERS, BY REGION, 2020-2027,
    602. (USD MILLION) 100
    603. FOR OTHERS, BY REGION, 2020-2027, (‘000 TONS) 100
    604. SEALANTS FOR HANDHELD DEVICES MARKET, BY SEALANTS APPLICATION 2020-2027 (USD MILLION)
    605. APPLICATION 2020-2027 (‘000 TONS) 102
    606. FOR HANDHELD DEVICES MARKET FOR SEALANTS APPLICATION, BY REGION, 2020-2027, (USD
    607. MILLION) 103
    608. SEALANTS APPLICATION, BY REGION, 2020-2027, (‘000 TONS) 103
    609. GLOBAL SEALANTS FOR HANDHELD DEVICES MARKET FOR MOBILE PHONE, BY REGION, 2020-2027,
    610. (USD MILLION) 104
    611. FOR MOBILE PHONE, BY REGION, 2020-2027, (‘000 TONS) 104
    612. GLOBAL SEALANTS FOR HANDHELD DEVICES MARKET FOR LAPTOP, BY REGION, 2020-2027, (USD
    613. MILLION) 105
    614. LAPTOP, BY REGION, 2020-2027, (‘000 TONS) 105
    615. FOR HANDHELD DEVICES MARKET FOR HARD DISC DRIVES, BY REGION, 2020-2027, (USD MILLION)
    616. DRIVES, BY REGION, 2020-2027, (‘000 TONS) 106
    617. FOR HANDHELD DEVICES MARKET FOR MEDICAL DEVICES, BY REGION, 2020-2027, (USD MILLION)
    618. DEVICES, BY REGION, 2020-2027, (‘000 TONS) 107
    619. SEALANTS FOR HANDHELD DEVICES MARKET FOR OTHERS, BY REGION, 2020-2027, (USD MILLION)
    620. BY REGION, 2020-2027, (‘000 TONS) 108
    621. FOR HANDHELD DEVICES MARKET, BY REGION, 2020-2027, (USD MILLION) 109
    622. GLOBAL SEALANTS FOR HANDHELD DEVICES MARKET, BY REGION, 2020-2027, (USD MILLION)
    623. 2027, (‘000 TONS) 110
    624. DEVICES MARKET, BY REGION, 2020-2027, (‘000 TONS) 110
    625. GLOBAL SEALANTS FOR HANDHELD DEVICES MARKET FOR TYPE, BY REGION, 2020-2027, (USD
    626. MILLION) 111
    627. TYPE, BY REGION, 2020-2027, (‘000 TONS) 111
    628. FOR HANDHELD DEVICES MARKET FOR APPLICATION, BY REGION, 2020-2027, (USD MILLION)
    629. BY REGION, 2020-2027, (‘000 TONS) 112
    630. FOR HANDHELD DEVICES MARKET, BY COUNTRY, 2020-2027, (USD MILLION) 113
    631. NORTH AMERICA SEALANTS FOR HANDHELD DEVICES MARKET, BY COUNTRY, 2020-2027, (‘000
    632. TONS) 113
    633. BY TYPE, 2020-2027, (USD MILLION) 114
    634. FOR HANDHELD DEVICES MARKET, BY TYPE , 2020-2027, (‘000 TONS) 114
    635. NORTH AMERICA SEALANTS FOR HANDHELD DEVICES MARKET, BY TYPE, 2020-2027, (USD
    636. MILLION) 114
    637. BY TYPE, 2020-2027, (‘000 TONS) 115
    638. DEVICES MARKET, BY TYPE, 2020-2027, (USD MILLION) 116
    639. FOR HANDHELD DEVICES MARKET, BY TYPE, 2020-2027, (‘000 TONS) 116
    640. U.S SEALANTS FOR HANDHELD DEVICES MARKET, BY APPLICATION, 2020-2027, (USD MILLION)
    641. 2027, (‘000 TONS) 117
    642. DEVICES MARKET, BY TYPE, 2020-2027, (USD MILLION) 118
    643. SEALANTS FOR HANDHELD DEVICES MARKET, BY TYPE, 2020-2027, (‘000 TONS) 118
    644. CANADA SEALANTS FOR HANDHELD DEVICES MARKET, BY APPLICATION, 2020-2027, (USD
    645. MILLION) 119
    646. APPLICATION, 2020-2027, (‘000 TONS) 119
    647. FOR HANDHELD DEVICES MARKET, BY COUNTRY, 2020-2027, (USD MILLION) 120
    648. EUROPE SEALANTS FOR HANDHELD DEVICES MARKET, BY COUNTRY, 2020-2027, (‘000
    649. TONS) 120
    650. 2027, (USD MILLION) 120
    651. MARKET, BY TYPE, 2020-2027, (‘000 TONS) 121
    652. FOR HANDHELD DEVICES MARKET, BY TYPE, 2020-2027, (USD MILLION) 122
    653. EUROPE SEALANTS FOR HANDHELD DEVICES MARKET, BY TYPE, 2020-2027, (‘000
    654. TONS) 122
    655. 2027, (USD MILLION) 123
    656. MARKET, BY TYPE, 2020-2027, (‘000 TONS) 123
    657. FOR HANDHELD DEVICES MARKET, BY APPLICATION, 2020-2027, (USD MILLION) 124
    658. GERMANY SEALANTS FOR HANDHELD DEVICES MARKET, BY APPLICATION, 2020-2027, (‘000
    659. TONS) 124
    660. 2027, (USD MILLION) 125
    661. MARKET, BY TYPE, 2020-2027, (‘000 TONS) 125
    662. FOR HANDHELD DEVICES MARKET, BY APPLICATION, 2020-2027, (USD MILLION) 126
    663. FRANCE SEALANTS FOR HANDHELD DEVICES MARKET, BY APPLICATION, 2020-2027, (‘000
    664. TONS) 126
    665. 2027, (USD MILLION) 127
    666. MARKET, BY TYPE, 2020-2027, (‘000 TONS) 127
    667. FOR HANDHELD DEVICES MARKET, BY APPLICATION, 2020-2027, (USD MILLION) 128
    668. UK SEALANTS FOR HANDHELD DEVICES MARKET, BY APPLICATION, 2020-2027, (‘000
    669. TONS) 128
    670. 2027, (USD MILLION) 129
    671. MARKET, BY TYPE, 2020-2027, (‘000 TONS) 129
    672. FOR HANDHELD DEVICES MARKET, BY APPLICATION, 2020-2027, (USD MILLION) 130
    673. ITALY SEALANTS FOR HANDHELD DEVICES MARKET, BY APPLICATION, 2020-2027, (‘000
    674. TONS) 130
    675. 2027, (USD MILLION) 131
    676. MARKET, BY TYPE, 2020-2027, (‘000 TONS) 131
    677. FOR HANDHELD DEVICES MARKET, BY APPLICATION, 2020-2027, (USD MILLION) 132
    678. SPAIN SEALANTS FOR HANDHELD DEVICES MARKET, BY APPLICATION, 2020-2027, (‘000
    679. TONS) 132
    680. BY TYPE, 2020-2027, (USD MILLION) 133
    681. FOR HANDHELD DEVICES MARKET, BY TYPE, 2020-2027, (‘000 TONS) 134
    682. REST OF EUROPE SEALANTS FOR HANDHELD DEVICES MARKET, BY APPLICATION, 2020-2027,
    683. (USD MILLION) 134
    684. MARKET, BY APPLICATION, 2020-2027, (‘000 TONS) 134
    685. PACIFIC SEALANTS FOR HANDHELD DEVICES MARKET, BY COUNTRY, 2020-2027, (USD MILLION)
    686. 2027, (‘000 TONS) 135
    687. DEVICES MARKET, BY TYPE, 2020-2027, (USD MILLION) 136
    688. SEALANTS FOR HANDHELD DEVICES MARKET, BY TYPE, 2020-2027, (‘000 TONS) 136
    689. ASIA PACIFIC SEALANTS FOR HANDHELD DEVICES MARKET, BY TYPE, 2020-2027, (USD
    690. MILLION) 137
    691. BY TYPE, 2020-2027, (‘000 TONS) 137
    692. HANDHELD DEVICES MARKET, BY TYPE, 2020-2027, (USD MILLION) 137
    693. CHINA SEALANTS FOR HANDHELD DEVICES MARKET, BY TYPE, 2020-2027, (‘000 TONS)
    694. 2027, (USD MILLION) 138
    695. MARKET, BY APPLICATION, 2020-2027, (‘000 TONS) 139
    696. SEALANTS FOR HANDHELD DEVICES MARKET, BY TYPE, 2020-2027, (USD MILLION) 139
    697. JAPAN SEALANTS FOR HANDHELD DEVICES MARKET, BY TYPE, 2020-2027, (‘000
    698. TONS) 140
    699. 2027, (USD MILLION) 140
    700. MARKET, BY APPLICATION, 2020-2027, (‘000 TONS) 141
    701. SEALANTS FOR HANDHELD DEVICES MARKET, BY TYPE, 2020-2027, (USD MILLION) 141
    702. INDIA SEALANTS FOR HANDHELD DEVICES MARKET, BY TYPE, 2020-2027, (‘000
    703. TONS) 142
    704. 2027, (USD MILLION) 142
    705. MARKET, BY APPLICATION, 2020-2027, (‘000 TONS) 143
    706. OF ASIA-PACIFIC SEALANTS FOR HANDHELD DEVICES MARKET, BY TYPE, 2020-2027, (USD MILLION)
    707. BY TYPE, 2020-2027, (‘000 TONS) 143
    708. SEALANTS FOR HANDHELD DEVICES MARKET, BY APPLICATION, 2020-2027, (USD MILLION) 144
    709. REST OF ASIA-PACIFIC SEALANTS FOR HANDHELD DEVICES MARKET, BY APPLICATION, 2020-2027,
    710. (‘000 TONS) 144
    711. MARKET, BY COUNTRY, 2020-2027, (USD MILLION) 146
    712. SEALANTS FOR HANDHELD DEVICES MARKET, BY COUNTRY, 2020-2027, (‘000 TONS) 146
    713. LATIN AMERICA SEALANTS FOR HANDHELD DEVICES MARKET, BY TYPE, 2020-2027, (USD
    714. MILLION) 146
    715. BY TYPE, 2020-2027, (‘000 TONS) 147
    716. FOR HANDHELD DEVICES MARKET, BY TYPE, 2020-2027, (USD MILLION) 147
    717. LATIN AMERICA SEALANTS FOR HANDHELD DEVICES MARKET, BY TYPE, 2020-2027, (‘000
    718. TONS) 148
    719. MARKET, BY COUNTRY, 2020-2027, (USD MILLION) 148
    720. & AFRICA SEALANTS FOR HANDHELD DEVICES MARKET, BY COUNTRY, 2020-2027, (‘000
    721. TONS) 148
    722. MARKET, BY TYPE, 2020-2027, (USD MILLION) 149
    723. AFRICA SEALANTS FOR HANDHELD DEVICES MARKET, BY TYPE, 2020-2027, (‘000 TONS)
    724. BY TYPE, 2020-2027, (USD MILLION) 149
    725. SEALANTS FOR HANDHELD DEVICES MARKET, BY TYPE, 2020-2027, (‘000 TONS) 150
    726. GLOBAL ADHESIVES MARKET FOR HANDHELD DEVICES PRICING & FORECAST (USD/TON)
    727. PRICING & FORECAST (USD/TON) (2020 –2023) 152
    728. AG & CO. KGAA: SEGMENT OVERVIEW 156
    729. KGAA:KEY DEVELOPMENTS 157
    730. 3M: KEY DEVELOPMENTS 159
    731. DOW CORNING CORPORATION: SEGMENT OVERVIEW 162
    732. CORNING CORPORATION: KEY DEVELOPMENTS 163
    733. OVERVIEW 164
    734. List of Figures
    735. DOWN & BOTTOM UP APPROACH 21
    736. DRIVERS, RESTRAINTS, OPPOPRTUNITIES AND TRENDS OF GLOBAL ADHESIVES & SEALANTS
    737. FOR HANDHELD DEVICES MARKET 23
    738. SMARTPHONES SHIPMENT, (2020-2027) 25
    739. SHIPMENT, (2020-2027) 26
    740. SUPPLY CHAIN ANALYSIS 31
    741. MARKET, BY ADHESIVE TYPE 2020-2027 (USD MILLION) 34
    742. FOR HANDHELD DEVICES MARKET, BY ADHESIVE TYPE 2020-2027 (‘000 TONS) 35
    743. GLOBAL ADHESIVES FOR HANDHELD DEVICES MARKET, BY APPLICTAION, 2020-2027, (USD
    744. MILLION) 42
    745. APPLICATION, 2020-2027, (‘000 TONS) 43
    746. FOR HANDHELD DEVICES MARKET, BY REGION, 2020-2027, (USD MILLION) 50
    747. GLOBAL ADHESIVES FOR HANDHELD DEVICES MARKET, BY REGION, 2020-2027, (‘000
    748. TONS) 51
    749. TYPE 2020-2027 (USD MILLION) 92
    750. DEVICES MARKET, BY SEALANTS TYPE 2020-2027 (‘000 TONS) 93
    751. GLOBAL SEALANTS FOR HANDHELD DEVICES MARKET, BY SEALANTS APPLICATION 2020-2027
    752. (USD MILLION) 101
    753. BY SEALANTS APPLICATION 2020-2027 (‘000 TONS) 102
    754. SHARE ANALYSIS, BY KEY PLAYERS (2020 ) 151
    755. KGAA: FINANCIAL UPDATES 157
    756. EVONIK INDUSTRIES AG: FINANCIAL UPDATES 161
    757. (CONSUMER SOLUTION) : FINANCIAL UPDATES 163
    758. SEGMENT REVENUE 166

    Adhesives & Sealants Market Segmentation

    Market Segmentation Overview

    • Detailed segmentation data will be available in the full report
    • Comprehensive analysis by multiple parameters
    • Regional and country-level breakdowns
    • Market size forecasts by segment
    Adhesives & Sealants Market for Handheld Devices Research Report- Forecast till 2023 Infographic
    Free Sample Request

    Kindly complete the form below to receive a free sample of this Report

    Customer Strories

    “I am very pleased with how market segments have been defined in a relevant way for my purposes (such as "Portable Freezers & refrigerators" and "last-mile"). In general the report is well structured. Thanks very much for your efforts.”

    Victoria Milne Founder
    Case Study

    Chemicals and Materials