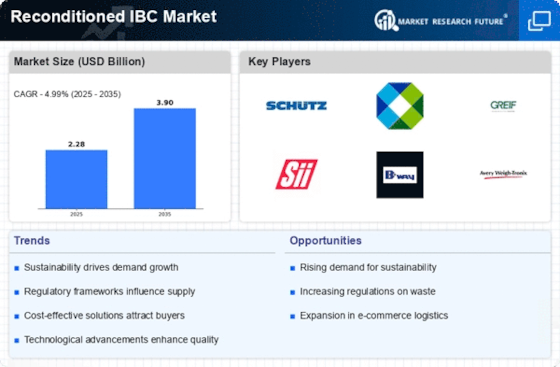
ÍNDICE
1. RESUMEN EJECUTIVO
1.1. Descripción general del mercado
1.2. Hallazgos clave
1.3. Segmentación del mercado
1.4. Panorama competitivo
1.5. Retos y Oportunidades
1.6. Perspectivas de futuro
2. INTRODUCCIÓN AL MERCADO
2.1. Definición
2.2. Alcance del estudio
2.2.1. Objetivo de la investigación
2.2.2. Asunción
2.2.3. Limitaciones
3. METODOLOGÍA DE LA INVESTIGACIÓN
3.1. Descripción general
3.2. Minería de datos
3.3. Investigación Secundaria
3.4. Investigación Primaria
3.4.1. Entrevistas primarias y proceso de recopilación de información
3.4.2. Desglose de los encuestados principales
3.5. Modelo de previsión
3.6. Estimación del tamaño del mercado
3.6.1. Enfoque ascendente
3.6.2. Enfoque de arriba hacia abajo
3.7. Triangulación de datos
3.8. Validación
4. DINÁMICA DEL MERCADO
4.1. Descripción general
4.2. Conductores
4.3. Restricciones
4.4. Oportunidades
5. ANÁLISIS DE FACTORES DE MERCADO
5.1. Análisis de la cadena de valor
5.2. Análisis de las cinco fuerzas de Porter
5.2.1. Poder de negociación de los proveedores
5.2.2. Poder de negociación de los compradores
5.2.3. Amenaza de nuevos participantes
5.2.4. Amenaza de sustitutos
5.2.5. Intensidad de la rivalidad
5.3. Análisis de impacto de COVID-19
5.3.1. Análisis de impacto en el mercado
5.3.2. Impacto Regional
5.3.3. Análisis de oportunidades y amenazas
6. MERCADO DE IBC REACONDICIONADOS, POR TIPO DE MATERIAL (MILLONES DE USD)
6.1. Plástico
6.2. Metal
6.3. Compuesto
7. MERCADO DE IBC REACONDICIONADOS, POR APLICACIÓN (MILLONES DE USD)
7.1. Productos químicos
7.2. Alimentos y Bebidas
7.3. Productos farmacéuticos
7.4. Aceites y Lubricantes
8. MERCADO DE IBC REACONDICIONADOS, POR CAPACIDAD (MILLONES DE USD)
8.1. Por debajo de 500 litros
8.2. 500 a 1000 Litros
8.3. Más de 1000 litros
9. MERCADO DE IBC REACONDICIONADOS, POR USUARIO FINAL (MILLONES DE USD)
9.1. Fabricación
9.2. Logística
9.3. Venta al por menor
10. MERCADO DE IBC REACONDICIONADOS, POR REGIONAL (MILLONES DE USD)
10.1. América del Norte
10.1.1. Estados Unidos
10.1.2. Canadá
10.2. Europa
10.2.1. Alemania
10.2.2. Reino Unido
10.2.3. Francia
10.2.4. Rusia
10.2.5. Italia
10.2.6. España
10.2.7. Resto de Europa
10.3. Región Asia-Pacífico
10.3.1. China
10.3.2. India
10.3.3. Japón
10.3.4. Corea del Sur
10.3.5. Malasia
10.3.6. Tailandia
10.3.7. Indonesia
10.3.8. Resto de APAC
10.4. América del Sur
10.4.1. Brasil
10.4.2. México
10.4.3. argentina
10.4.4. Resto de Sudamérica
10.5. MEA
10.5.1. Países del CCG
10.5.2. Sudáfrica
10.5.3. Resto de MEA
11. PAISAJE COMPETITIVO
11.1. Descripción general
11.2. Análisis Competitivo
11.3. Análisis de cuota de mercado
11.4. Importante estrategia de crecimiento en el mercado de IBC reacondicionados
11.5. Evaluación comparativa competitiva
11.6. Actores líderes en términos de número de desarrollos en el mercado de IBC reacondicionados
11.7. Desarrollos clave y estrategias de crecimiento
11.7.1. Lanzamiento de nuevos productos/implementación de servicios
11.7.2. Fusión y Adquisiciones
11.7.3. Empresas conjuntas
11.8. Matriz financiera de los principales actores
11.8.1. Ventas e ingresos operativos
11.8.2. Gasto en I+D de los principales actores. 2023
12. PERFILES DE LA EMPRESA
12.1. Thielmann
12.1.1. Resumen financiero
12.1.2. Productos ofrecidos
12.1.3. Desarrollos clave
12.1.4. Análisis FODA
12.1.5. Estrategias clave
12.2. Sistemas de contenedores Crest
12.2.1. Resumen financiero
12.2.2. Productos ofrecidos
12.2.3. Desarrollos clave
12.2.4. Análisis FODA
12.2.5. Estrategias clave
12.3. Avery WeighTronix, LLC
12.3.1. Resumen financiero
12.3.2. Productos ofrecidos
12.3.3. Desarrollos clave
12.3.4. Análisis FODA
12.3.5. Estrategias clave
12.4. Hermanos Kinsbursky, Inc.
12.4.1. Resumen financiero
12.4.2. Productos ofrecidos
12.4.3. Desarrollos clave
12.4.4. Análisis FODA
12.4.5. Estrategias clave
12.5. Bulkapak Ltd
12.5.1. Resumen financiero
12.5.2. Productos ofrecidos
12.5.3. Desarrollos clave
12.5.4. Análisis FODA
12.5.5. Estrategias clave
12.6. Kepner Plastics Fabrication, Inc.
12.6.1. Resumen financiero
12.6.2. Productos ofrecidos
12.6.3. Desarrollos clave
12.6.4. Análisis FODA
12.6.5. Estrategias clave
12.7. Brenntag AG
12.7.1. Resumen financiero
12.7.2. Productos ofrecidos
12.7.3. Desarrollos clave
12.7.4. Análisis FODA
12.7.5. Estrategias clave
12.8. La empresa IBC
12.8.1. Resumen financiero
12.8.2. Productos ofrecidos
12.8.3. Desarrollos clave
12.8.4. Análisis FODA
12.8.5. Estrategias clave
12.9. Embalaje Águila
12.9.1. Resumen financiero
12.9.2. Productos ofrecidos
12.9.3. Desarrollos clave
12.9.4. Análisis FODA
12.9.5. Estrategias clave
12.10. Intercambiador de contenedores
12.10.1. Resumen financiero
12.10.2. Productos ofrecidos
12.10.3. Desarrollos clave
12.10.4. Análisis FODA
12.10.5. Estrategias clave
12.11. Industrias Snyder
12.11.1. Resumen financiero
12.11.2. Productos ofrecidos
12.11.3. Desarrollos clave
12.11.4. Análisis FODA
12.11.5. Estrategias clave
12.12. cisterna
12.12.1. Resumen financiero
12.12.2. Productos ofrecidos
12.12.3. Desarrollos clave
12.12.4. Análisis FODA
12.12.5. Estrategias clave
12.13. Greif, Inc.
12.13.1. Resumen financiero
12.13.2. Productos ofrecidos
12.13.3. Desarrollos clave
12.13.4. Análisis FODA
12.13.5. Estrategias clave
12.14. Soluciones de embalaje Mauser
12.14.1. Resumen financiero
12.14.2. Productos ofrecidos
12.14.3. Desarrollos clave
12.14.4. Análisis FODA
12.14.5. Estrategias clave
13. APÉNDICE
13.1. Referencias
13.2. Informes relacionados
LISTA DE TABLAS
TABLA 1. LISTA DE SUPUESTOS
TABLA 2. ESTIMACIONES Y OPORTUNIDADES DEL MERCADO DE IBC REACONDICIONADOS EN AMÉRICA DEL NORTE. PRONÓSTICO, POR TIPO DE MATERIAL, 2019-2032 (MILLONES DE USD)
TABLA 3. ESTIMACIONES Y OPORTUNIDADES DEL TAMAÑO DEL MERCADO DE IBC REACONDICIONADOS EN AMÉRICA DEL NORTE. PRONÓSTICO, POR APLICACIÓN, 2019-2032 (MILES DE MILLONES DE USD)
TABLA 4. ESTIMACIONES Y OPORTUNIDADES DEL TAMAÑO DEL MERCADO DE IBC REACONDICIONADOS EN AMÉRICA DEL NORTE. PRONÓSTICO, POR CAPACIDAD, 2019-2032 (MILLONES DE USD)
TABLA 5. ESTIMACIONES Y ESTIMACIONES DEL TAMAÑO DEL MERCADO DE IBC REACONDICIONADOS EN AMÉRICA DEL NORTE. PRONÓSTICO, POR USUARIO FINAL, 2019-2032 (MILES DE MILLONES DE USD)
TABLA 6. ESTIMACIONES Y OPORTUNIDADES DEL MERCADO DE IBC REACONDICIONADOS EN AMÉRICA DEL NORTE. PRONÓSTICO, POR REGIONAL, 2019-2032 (MILES DE MILLONES DE USD)
TABLA 7. ESTIMACIONES Y POTENCIAS DEL TAMAÑO DEL MERCADO DE IBC REACONDICIONADOS DE EE. UU. PRONÓSTICO, POR TIPO DE MATERIAL, 2019-2032 (MILLONES DE USD)
TABLA 8. ESTIMACIONES Y POTENCIAS DEL TAMAÑO DEL MERCADO DE IBC REACONDICIONADOS DE EE. UU. PRONÓSTICO, POR APLICACIÓN, 2019-2032 (MILES DE MILLONES DE USD)
TABLA 9. ESTIMACIONES Y POTENCIAS DEL TAMAÑO DEL MERCADO DE IBC REACONDICIONADOS DE EE. UU. PRONÓSTICO, POR CAPACIDAD, 2019-2032 (MILLONES DE USD)
TABLA 10. ESTIMACIONES Y POTENCIAS DEL TAMAÑO DEL MERCADO DE IBC REACONDICIONADOS DE EE. UU. PRONÓSTICO, POR USUARIO FINAL, 2019-2032 (MILES DE MILLONES DE USD)
TABLA 11. ESTIMACIONES Y POTENCIAS DEL TAMAÑO DEL MERCADO DE IBC REACONDICIONADOS DE EE. UU. PRONÓSTICO, POR REGIONAL, 2019-2032 (MILES DE MILLONES DE USD)
TABLA 12. ESTIMACIONES Y ESTIMACIONES DEL TAMAÑO DEL MERCADO DE IBC REACONDICIONADOS EN CANADÁ PRONÓSTICO, POR TIPO DE MATERIAL, 2019-2032 (MILLONES DE USD)
TABLA 13. ESTIMACIONES Y POTENCIAS DEL TAMAÑO DEL MERCADO DE IBC REACONDICIONADOS EN CANADÁ PRONÓSTICO, POR APLICACIÓN, 2019-2032 (MILES DE MILLONES DE USD)
TABLA 14. ESTIMACIONES Y POTENCIAS DEL TAMAÑO DEL MERCADO DE IBC REACONDICIONADOS EN CANADÁ PRONÓSTICO, POR CAPACIDAD, 2019-2032 (MILLONES DE USD)
TABLA 15. ESTIMACIONES Y ESTIMACIONES DEL TAMAÑO DEL MERCADO DE IBC REACONDICIONADOS EN CANADÁ PRONÓSTICO, POR USUARIO FINAL, 2019-2032 (MILES DE MILLONES DE USD)
TABLA 16. ESTIMACIONES Y ESTIMACIONES DEL TAMAÑO DEL MERCADO DE IBC REACONDICIONADOS EN CANADÁ PRONÓSTICO, POR REGIONAL, 2019-2032 (MILES DE MILLONES DE USD)
TABLA 17. ESTIMACIONES Y OPORTUNIDADES DEL TAMAÑO DEL MERCADO DE IBC REACONDICIONADOS EN EUROPA PRONÓSTICO, POR TIPO DE MATERIAL, 2019-2032 (MILLONES DE USD)
TABLA 18. ESTIMACIONES Y EMPRESAS DEL TAMAÑO DEL MERCADO DE IBC REACONDICIONADOS EN EUROPA PRONÓSTICO, POR APLICACIÓN, 2019-2032 (MILES DE MILLONES DE USD)
TABLA 19. ESTIMACIONES Y POTENCIAS DEL TAMAÑO DEL MERCADO DE IBC REACONDICIONADOS EN EUROPA PRONÓSTICO, POR CAPACIDAD, 2019-2032 (MILLONES DE USD)
TABLA 20. ESTIMACIONES Y OPORTUNIDADES DEL TAMAÑO DEL MERCADO DE IBC REACONDICIONADOS EN EUROPA PRONÓSTICO, POR USUARIO FINAL, 2019-2032 (MILES DE MILLONES DE USD)
TABLA 21. ESTIMACIONES Y OPORTUNIDADES DEL TAMAÑO DEL MERCADO DE IBC REACONDICIONADOS EN EUROPA PRONÓSTICO, POR REGIONAL, 2019-2032 (MILES DE MILLONES DE USD)
TABLA 22. ESTIMACIONES Y ESTIMACIONES DEL TAMAÑO DEL MERCADO DE IBC REACONDICIONADOS EN ALEMANIA PRONÓSTICO, POR TIPO DE MATERIAL, 2019-2032 (MILLONES DE USD)
TABLA 23. ESTIMACIONES Y ESTIMACIONES DEL TAMAÑO DEL MERCADO DE IBC REACONDICIONADOS EN ALEMANIA PRONÓSTICO, POR APLICACIÓN, 2019-2032 (MILES DE MILLONES DE USD)
TABLA 24. ESTIMACIONES Y POTENCIAS DEL TAMAÑO DEL MERCADO DE IBC REACONDICIONADOS EN ALEMANIA PRONÓSTICO, POR CAPACIDAD, 2019-2032 (MILLONES DE USD)
TABLA 25. ESTIMACIONES Y ESTIMACIONES DEL TAMAÑO DEL MERCADO DE IBC REACONDICIONADOS EN ALEMANIA PRONÓSTICO, POR USUARIO FINAL, 2019-2032 (MILES DE MILLONES DE USD)
TABLA 26. ESTIMACIONES Y ESTIMACIONES DEL TAMAÑO DEL MERCADO DE IBC REACONDICIONADOS EN ALEMANIA PRONÓSTICO, POR REGIONAL, 2019-2032 (MILES DE MILLONES DE USD)
TABLA 27. ESTIMACIONES Y POTENCIAS DEL TAMAÑO DEL MERCADO DE IBC REACONDICIONADOS EN EL REINO UNIDO PRONÓSTICO, POR TIPO DE MATERIAL, 2019-2032 (MILLONES DE USD)
TABLA 28. ESTIMACIONES Y ESTIMACIONES DEL TAMAÑO DEL MERCADO DE IBC REACONDICIONADOS EN EL REINO UNIDO PRONÓSTICO, POR APLICACIÓN, 2019-2032 (MILES DE MILLONES DE USD)
TABLA 29. ESTIMACIONES Y ESTIMACIONES DEL TAMAÑO DEL MERCADO DE IBC REACONDICIONADOS EN EL REINO UNIDO PRONÓSTICO, POR CAPACIDAD, 2019-2032 (MILLONES DE USD)
TABLA 30. ESTIMACIONES Y ESTIMACIONES DEL TAMAÑO DEL MERCADO DE IBC REACONDICIONADOS EN EL REINO UNIDO PRONÓSTICO, POR USUARIO FINAL, 2019-2032 (MILES DE MILLONES DE USD)
TABLA 31. ESTIMACIONES Y ESTIMACIONES DEL TAMAÑO DEL MERCADO DE IBC REACONDICIONADOS EN EL REINO UNIDO PRONÓSTICO, POR REGIONAL, 2019-2032 (MILES DE MILLONES DE USD)
TABLA 32. ESTIMACIONES Y EMPRESAS DEL TAMAÑO DEL MERCADO DE IBC REACONDICIONADOS EN FRANCIA. PRONÓSTICO, POR TIPO DE MATERIAL, 2019-2032 (MILLONES DE USD)
TABLA 33. ESTIMACIONES Y EMPRESAS DEL TAMAÑO DEL MERCADO DE IBC REACONDICIONADOS EN FRANCIA. PRONÓSTICO, POR APLICACIÓN, 2019-2032 (MILES DE MILLONES DE USD)
TABLA 34. ESTIMACIONES Y EMPRESAS DEL TAMAÑO DEL MERCADO DE IBC REACONDICIONADOS EN FRANCIA. PRONÓSTICO, POR CAPACIDAD, 2019-2032 (MILLONES DE USD)
TABLA 35. ESTIMACIONES Y EMPRESAS DEL TAMAÑO DEL MERCADO DE IBC REACONDICIONADOS EN FRANCIA. PRONÓSTICO, POR USUARIO FINAL, 2019-2032 (MILES DE MILLONES DE USD)
TABLA 36. ESTIMACIONES Y EMPRESAS DEL TAMAÑO DEL MERCADO DE IBC REACONDICIONADOS EN FRANCIA PRONÓSTICO, POR REGIONAL, 2019-2032 (MILES DE MILLONES DE USD)
TABLA 37. ESTIMACIONES Y POTENCIAS DEL TAMAÑO DEL MERCADO DE IBC REACONDICIONADOS EN RUSIA PRONÓSTICO, POR TIPO DE MATERIAL, 2019-2032 (MILLONES DE USD)
TABLA 38. ESTIMACIONES Y POTENCIAS DEL TAMAÑO DEL MERCADO DE IBC REACONDICIONADOS EN RUSIA PRONÓSTICO, POR APLICACIÓN, 2019-2032 (MILES DE MILLONES DE USD)
TABLA 39. ESTIMACIONES Y OPORTUNIDADES DEL TAMAÑO DEL MERCADO DE IBC REACONDICIONADOS EN RUSIA PRONÓSTICO, POR CAPACIDAD, 2019-2032 (MILLONES DE USD)
TABLA 40. ESTIMACIONES Y POTENCIAS DEL TAMAÑO DEL MERCADO DE IBC REACONDICIONADOS EN RUSIA PRONÓSTICO, POR USUARIO FINAL, 2019-2032 (MILES DE MILLONES DE USD)
TABLA 41. ESTIMACIONES Y POTENCIAS DEL TAMAÑO DEL MERCADO DE IBC REACONDICIONADOS EN RUSIA PRONÓSTICO, POR REGIONAL, 2019-2032 (MILES DE MILLONES DE USD)
TABLA 42. ESTIMACIONES Y POTENCIAS DEL TAMAÑO DEL MERCADO DE IBC REACONDICIONADOS EN ITALIA PRONÓSTICO, POR TIPO DE MATERIAL, 2019-2032 (MILLONES DE USD)
TABLA 43. ESTIMACIONES Y POTENCIAS DEL TAMAÑO DEL MERCADO DE IBC REACONDICIONADOS EN ITALIA PRONÓSTICO, POR APLICACIÓN, 2019-2032 (MILES DE MILLONES DE USD)
TABLA 44. ESTIMACIONES Y POTENCIA DEL TAMAÑO DEL MERCADO DE IBC REACONDICIONADOS EN ITALIA PRONÓSTICO, POR CAPACIDAD, 2019-2032 (MILLONES DE USD)
TABLA 45. ESTIMACIONES Y POTENCIAS DEL TAMAÑO DEL MERCADO DE IBC REACONDICIONADOS EN ITALIA PRONÓSTICO, POR USUARIO FINAL, 2019-2032 (MILES DE MILLONES DE USD)
TABLA 46. ESTIMACIONES Y POTENCIAS DEL TAMAÑO DEL MERCADO DE IBC REACONDICIONADOS EN ITALIA PRONÓSTICO, POR REGIONAL, 2019-2032 (MILES DE MILLONES DE USD)
TABLA 47. ESTIMACIONES Y POTENCIAS DEL TAMAÑO DEL MERCADO DE IBC REACONDICIONADOS EN ESPAÑA PRONÓSTICO, POR TIPO DE MATERIAL, 2019-2032 (MILLONES DE USD)
TABLA 48. ESTIMACIÓN DEL TAMAÑO DEL MERCADO DE IBC REACONDICIONADOS EN ESPAÑATES y PRONÓSTICO, POR APLICACIÓN, 2019-2032 (MILES DE MILLONES DE USD)
TABLA 49. ESTIMACIONES Y POTENCIAS DEL TAMAÑO DEL MERCADO DE IBC REACONDICIONADOS EN ESPAÑA PRONÓSTICO, POR CAPACIDAD, 2019-2032 (MILLONES DE USD)
TABLA 50. ESTIMACIONES Y EMPRESAS DEL TAMAÑO DEL MERCADO DE IBC REACONDICIONADOS EN ESPAÑA PRONÓSTICO, POR USUARIO FINAL, 2019-2032 (MILES DE MILLONES DE USD)
TABLA 51. ESTIMACIONES Y POTENCIAS DEL TAMAÑO DEL MERCADO DE IBC REACONDICIONADOS EN ESPAÑA PRONÓSTICO, POR REGIONAL, 2019-2032 (MILES DE MILLONES DE USD)
TABLA 52. ESTIMACIONES Y ESTIMACIONES DEL TAMAÑO DEL MERCADO DE IBC REACONDICIONADOS EN EL RESTO DE EUROPA. PRONÓSTICO, POR TIPO DE MATERIAL, 2019-2032 (MILLONES DE USD)
TABLA 53. ESTIMACIONES Y ESTIMACIONES DEL TAMAÑO DEL MERCADO DE IBC REACONDICIONADOS EN EL RESTO DE EUROPA. PRONÓSTICO, POR APLICACIÓN, 2019-2032 (MILES DE MILLONES DE USD)
TABLA 54. ESTIMACIONES Y ESTIMACIONES DEL TAMAÑO DEL MERCADO DE IBC REACONDICIONADOS EN EL RESTO DE EUROPA. PRONÓSTICO, POR CAPACIDAD, 2019-2032 (MILLONES DE USD)
TABLA 55. ESTIMACIONES Y ESTIMACIONES DEL TAMAÑO DEL MERCADO DE IBC REACONDICIONADOS EN EL RESTO DE EUROPA. PRONÓSTICO, POR USUARIO FINAL, 2019-2032 (MILES DE MILLONES DE USD)
TABLA 56. ESTIMACIONES Y EMPRESAS DEL TAMAÑO DEL MERCADO DE IBC REACONDICIONADOS EN EL RESTO DE EUROPA. PRONÓSTICO, POR REGIONAL, 2019-2032 (MILES DE MILLONES DE USD)
TABLA 57. ESTIMACIONES Y ESTIMACIONES DEL TAMAÑO DEL MERCADO DE IBC REACONDICIONADOS DE APAC PRONÓSTICO, POR TIPO DE MATERIAL, 2019-2032 (MILLONES DE USD)
TABLA 58. ESTIMACIONES Y ESTIMACIONES DEL TAMAÑO DEL MERCADO DE IBC REACONDICIONADOS DE APAC PRONÓSTICO, POR APLICACIÓN, 2019-2032 (MILES DE MILLONES DE USD)
TABLA 59. ESTIMACIONES Y ESTIMACIONES DEL TAMAÑO DEL MERCADO DE IBC REACONDICIONADOS DE APAC PRONÓSTICO, POR CAPACIDAD, 2019-2032 (MILLONES DE USD)
TABLA 60. ESTIMACIONES Y ESTIMACIONES DEL TAMAÑO DEL MERCADO DE IBC REACONDICIONADOS DE APAC PRONÓSTICO, POR USUARIO FINAL, 2019-2032 (MILES DE MILLONES DE USD)
TABLA 61. ESTIMACIONES Y ESTIMACIONES DEL TAMAÑO DEL MERCADO DE IBC REACONDICIONADOS DE APAC PRONÓSTICO, POR REGIONAL, 2019-2032 (MILES DE MILLONES DE USD)
TABLA 62. ESTIMACIONES Y ESTIMACIONES DEL TAMAÑO DEL MERCADO DE IBC REACONDICIONADOS EN CHINA PRONÓSTICO, POR TIPO DE MATERIAL, 2019-2032 (MILLONES DE USD)
TABLA 63. ESTIMACIONES Y ESTIMACIONES DEL TAMAÑO DEL MERCADO DE IBC REACONDICIONADOS DE CHINA PRONÓSTICO, POR APLICACIÓN, 2019-2032 (MILES DE MILLONES DE USD)
TABLA 64. ESTIMACIONES Y ESTIMACIONES DEL TAMAÑO DEL MERCADO DE IBC REACONDICIONADOS EN CHINA PRONÓSTICO, POR CAPACIDAD, 2019-2032 (MILLONES DE USD)
TABLA 65. ESTIMACIONES Y ESTIMACIONES DEL TAMAÑO DEL MERCADO DE IBC REACONDICIONADOS EN CHINA PRONÓSTICO, POR USUARIO FINAL, 2019-2032 (MILES DE MILLONES DE USD)
TABLA 66. ESTIMACIONES Y ESTIMACIONES DEL TAMAÑO DEL MERCADO DE IBC REACONDICIONADOS EN CHINA PRONÓSTICO, POR REGIONAL, 2019-2032 (MILES DE MILLONES DE USD)
TABLA 67. ESTIMACIONES Y ESTIMACIONES DEL TAMAÑO DEL MERCADO DE IBC REACONDICIONADOS EN LA INDIA PRONÓSTICO, POR TIPO DE MATERIAL, 2019-2032 (MILLONES DE USD)
TABLA 68. ESTIMACIONES Y ESTIMACIONES DEL TAMAÑO DEL MERCADO DE IBC REACONDICIONADOS EN LA INDIA PRONÓSTICO, POR APLICACIÓN, 2019-2032 (MILES DE MILLONES DE USD)
TABLA 69. ESTIMACIONES Y ESTIMACIONES DEL TAMAÑO DEL MERCADO DE IBC REACONDICIONADOS EN LA INDIA PRONÓSTICO, POR CAPACIDAD, 2019-2032 (MILLONES DE USD)
TABLA 70. ESTIMACIONES Y ESTIMACIONES DEL TAMAÑO DEL MERCADO DE IBC REACONDICIONADOS EN LA INDIA PRONÓSTICO, POR USUARIO FINAL, 2019-2032 (MILES DE MILLONES DE USD)
TABLA 71. ESTIMACIONES Y ESTIMACIONES DEL TAMAÑO DEL MERCADO DE IBC REACONDICIONADOS DE LA INDIA. PRONÓSTICO, POR REGIONAL, 2019-2032 (MILES DE MILLONES DE USD)
TABLA 72. ESTIMACIONES Y POTENCIAS DEL TAMAÑO DEL MERCADO DE IBC REACONDICIONADOS EN JAPÓN PRONÓSTICO, POR TIPO DE MATERIAL, 2019-2032 (MILLONES DE USD)
TABLA 73. ESTIMACIONES Y POTENCIAS DEL TAMAÑO DEL MERCADO DE IBC REACONDICIONADOS EN JAPÓN PRONÓSTICO, POR APLICACIÓN, 2019-2032 (MILES DE MILLONES DE USD)
TABLA 74. ESTIMACIONES Y POTENCIAS DEL TAMAÑO DEL MERCADO DE IBC REACONDICIONADOS EN JAPÓN PRONÓSTICO, POR CAPACIDAD, 2019-2032 (MILLONES DE USD)
TABLA 75. ESTIMACIONES Y POTENCIAS DEL TAMAÑO DEL MERCADO DE IBC REACONDICIONADOS EN JAPÓN PRONÓSTICO, POR USUARIO FINAL, 2019-2032 (MILES DE MILLONES DE USD)
TABLA 76. ESTIMACIONES Y POTENCIAS DEL TAMAÑO DEL MERCADO DE IBC REACONDICIONADOS EN JAPÓN PRONÓSTICO, POR REGIONAL, 2019-2032 (MILES DE MILLONES DE USD)
TABLA 77. ESTIMACIONES Y ESTIMACIONES DEL TAMAÑO DEL MERCADO DE IBC REACONDICIONADOS DE COREA DEL SUR. PRONÓSTICO, POR TIPO DE MATERIAL, 2019-2032 (MILLONES DE USD)
TABLA 78. ESTIMACIONES Y ESTIMACIONES DEL TAMAÑO DEL MERCADO DE IBC REACONDICIONADOS DE COREA DEL SUR. PRONÓSTICO, POR APLICACIÓN, 2019-2032 (MILES DE MILLONES DE USD)
TABLA 79. ESTIMACIONES Y ESTIMACIONES DEL TAMAÑO DEL MERCADO DE IBC REACONDICIONADOS DE COREA DEL SUR. PRONÓSTICO, POR CAPACIDAD, 2019-2032 (MILLONES DE USD)
TABLA 80. ESTIMACIONES Y ESTIMACIONES DEL TAMAÑO DEL MERCADO DE IBC REACONDICIONADOS DE COREA DEL SUR. PRONÓSTICO, POR USUARIO FINAL, 2019-2032 (MILES DE MILLONES DE USD)
TABLA 81. ESTIMACIONES Y ESTIMACIONES DEL TAMAÑO DEL MERCADO DE IBC REACONDICIONADOS DE COREA DEL SUR. PRONÓSTICO, POR REGIONAL, 2019-2032 (MILES DE MILLONES DE USD)
TABLA 82. ESTIMACIONES Y POTENCIAS DEL TAMAÑO DEL MERCADO DE IBC REACONDICIONADOS DE MALASIA PRONÓSTICO, POR TIPO DE MATERIAL, 2019-2032 (MILLONES DE USD)
TABLA 83. ESTIMACIONES Y POTENCIAS DEL TAMAÑO DEL MERCADO DE IBC REACONDICIONADOS DE MALASIA PRONÓSTICO, POR APLICACIÓN, 2019-2032 (MILES DE MILLONES DE USD)
TABLA 84. ESTIMACIONES Y POTENCIAS DEL TAMAÑO DEL MERCADO DE IBC REACONDICIONADOS DE MALASIA PRONÓSTICO, POR CAPACIDAD, 2019-2032 (MILLONES DE USD)
TABLA 85. ESTIMACIONES Y POTENCIAS DEL TAMAÑO DEL MERCADO DE IBC REACONDICIONADOS DE MALASIA PRONÓSTICO, POR USUARIO FINAL, 2019-2032 (MILES DE MILLONES DE USD)
TABLA 86. ESTIMACIONES Y POTENCIAS DEL TAMAÑO DEL MERCADO DE IBC REACONDICIONADOS DE MALASIA PRONÓSTICO, POR REGIONAL, 2019-2032 (MILES DE MILLONES DE USD)
TABLA 87. ESTIMACIONES Y POTENCIA DEL TAMAÑO DEL MERCADO DE IBC REACONDICIONADOS EN TAILANDIA PRONÓSTICO, POR TIPO DE MATERIAL, 2019-2032 (MILLONES DE USD)
TABLA 88. ESTIMACIONES Y POTENCIA DEL TAMAÑO DEL MERCADO DE IBC REACONDICIONADOS EN TAILANDIA PRONÓSTICO, POR APLICACIÓN, 2019-2032 (MILES DE MILLONES DE USD)
TABLA 89. ESTIMACIONES Y POTENCIA DEL TAMAÑO DEL MERCADO DE IBC REACONDICIONADOS EN TAILANDIA PRONÓSTICO, POR CAPACIDAD, 2019-2032 (MILLONES DE USD)
TABLA 90. ESTIMACIONES Y OPORTUNIDADES DEL TAMAÑO DEL MERCADO DE IBC REACONDICIONADOS DE TAILANDIA PRONÓSTICO, POR USUARIO FINAL, 2019-2032 (MILES DE MILLONES DE USD)
TABLA 91. ESTIMACIONES Y OPORTUNIDADES DEL TAMAÑO DEL MERCADO DE IBC REACONDICIONADOS DE TAILANDIA PRONÓSTICO, POR REGIONAL, 2019-2032 (MILES DE MILLONES DE USD)
TABLA 92. ESTIMACIONES Y POTENCIA DEL TAMAÑO DEL MERCADO DE IBC REACONDICIONADOS EN INDONESIA PRONÓSTICO, POR TIPO DE MATERIAL, 2019-2032 (MILLONES DE USD)
TABLA 93. ESTIMACIONES Y POTENCIA DEL TAMAÑO DEL MERCADO DE IBC REACONDICIONADOS EN INDONESIA PRONÓSTICO, POR APLICACIÓN, 2019-2032 (MILES DE MILLONES DE USD)
TABLA 94. ESTIMACIONES Y POTENCIA DEL TAMAÑO DEL MERCADO DE IBC REACONDICIONADOS EN INDONESIA PRONÓSTICO, POR CAPACIDAD, 2019-2032 (MILLONES DE USD)
TABLA 95. ESTIMACIONES Y POTENCIA DEL TAMAÑO DEL MERCADO DE IBC REACONDICIONADOS EN INDONESIA PRONÓSTICO, POR USUARIO FINAL, 2019-2032 (MILES DE MILLONES DE USD)
TABLA 96. ESTIMACIONES Y POTENCIA DEL TAMAÑO DEL MERCADO DE IBC REACONDICIONADOS EN INDONESIA PRONÓSTICO, POR REGIONAL, 2019-2032 (MILES DE MILLONES DE USD)
TABLA 97. ESTIMACIONES Y ESTIMACIONES DEL TAMAÑO DEL MERCADO DE IBC REACONDICIONADOS DEL RESTO DE APAC. PRONÓSTICO, POR TIPO DE MATERIAL, 2019-2032 (MILLONES DE USD)
TABLA 98. ESTIMACIONES Y ESTIMACIONES DEL TAMAÑO DEL MERCADO DE IBC REACONDICIONADOS DEL RESTO DE APAC. PRONÓSTICO, POR APLICACIÓN, 2019-2032 (MILES DE MILLONES DE USD)
TABLA 99. ESTIMACIONES Y ESTIMACIONES DEL TAMAÑO DEL MERCADO DE IBC REACONDICIONADOS DEL RESTO DE APAC. PRONÓSTICO, POR CAPACIDAD, 2019-2032 (MILLONES DE USD)
TABLA 100. ESTIMACIONES Y ESTIMACIONES DEL TAMAÑO DEL MERCADO DE IBC REACONDICIONADOS DEL RESTO DE APAC. PRONÓSTICO, POR USUARIO FINAL, 2019-2032 (MILES DE MILLONES DE USD)
TABLA 101. ESTIMACIONES Y ESTIMACIONES DEL TAMAÑO DEL MERCADO DE IBC REACONDICIONADOS DEL RESTO DE APAC. PRONÓSTICO, POR REGIONAL, 2019-2032 (MILES DE MILLONES DE USD)
TABLA 102. ESTIMACIONES Y POTENCIAS DEL TAMAÑO DEL MERCADO DE IBC REACONDICIONADOS EN AMÉRICA DEL SUR. PRONÓSTICO, POR TIPO DE MATERIAL, 2019-2032 (MILLONES DE USD)
TABLA 103. ESTIMACIONES Y POTENCIAS DEL TAMAÑO DEL MERCADO DE IBC REACONDICIONADOS EN AMÉRICA DEL SUR. PRONÓSTICO, POR APLICACIÓN, 2019-2032 (MILES DE MILLONES DE USD)
TABLA 104. ESTIMACIONES Y POTENCIAS DEL TAMAÑO DEL MERCADO DE IBC REACONDICIONADOS EN AMÉRICA DEL SUR. PRONÓSTICO, POR CAPACIDAD, 2019-2032 (MILLONES DE USD)
TABLA 105. ESTIMACIONES Y POTENCIAS DEL TAMAÑO DEL MERCADO DE IBC REACONDICIONADOS EN AMÉRICA DEL SUR. PRONÓSTICO, POR USUARIO FINAL, 2019-2032 (MILES DE MILLONES DE USD)
TABLA 106. ESTIMACIONES Y ESTIMACIONES DEL TAMAÑO DEL MERCADO DE IBC REACONDICIONADOS EN SUDAMÉRICA PRONÓSTICO, POR REGIONAL, 2019-2032 (MILES DE MILLONES DE USD)
TABLA 107. ESTIMACIONES Y EMPRESAS DEL TAMAÑO DEL MERCADO DE IBC REACONDICIONADOS EN BRASIL PRONÓSTICO, POR TIPO DE MATERIAL, 2019-2032 (MILLONES DE USD)
TABLA 108. ESTIMACIONES Y EMPRESAS DEL TAMAÑO DEL MERCADO DE IBC REACONDICIONADOS EN BRASIL. PRONÓSTICO, POR APLICACIÓN, 2019-2032 (MILES DE MILLONES DE USD)
TABLA 109. ESTIMACIONES Y POTENCIAS DEL TAMAÑO DEL MERCADO DE IBC REACONDICIONADOS EN BRASIL PRONÓSTICO, POR CAPACIDAD, 2019-2032 (MILLONES DE USD)
TABLA 110. ESTIMACIONES Y EMPRESAS DEL TAMAÑO DEL MERCADO DE IBC REACONDICIONADOS EN BRASIL. PRONÓSTICO, POR USUARIO FINAL, 2019-2032 (MILES DE MILLONES DE USD)
TABLA 111. ESTIMACIONES Y EMPRESAS DEL TAMAÑO DEL MERCADO DE IBC REACONDICIONADOS EN BRASIL. PRONÓSTICO, POR REGIONAL, 2019-2032 (MILES DE MILLONES DE USD)
TABLA 112. ESTIMACIONES Y ESTIMACIONES DEL TAMAÑO DEL MERCADO DE IBC REACONDICIONADOS EN MÉXICO PRONÓSTICO, POR TIPO DE MATERIAL, 2019-2032 (MILLONES DE USD)
TABLA 113. ESTIMACIONES Y POTENCIA DEL TAMAÑO DEL MERCADO DE IBC REACONDICIONADOS EN MÉXICO PRONÓSTICO, POR APLICACIÓN, 2019-2032 (MILES DE MILLONES DE USD)
TABLA 114. ESTIMACIONES Y POTENCIA DEL TAMAÑO DEL MERCADO DE IBC REACONDICIONADOS EN MÉXICO PRONÓSTICO, POR CAPACIDAD, 2019-2032 (MILLONES DE USD)
TABLA 115. ESTIMACIONES Y POTENCIA DEL TAMAÑO DEL MERCADO DE IBC REACONDICIONADOS EN MÉXICO PRONÓSTICO, POR USUARIO FINAL, 2019-2032 (MILES DE MILLONES DE USD)
TABLA 116. ESTIMACIONES Y POTENCIA DEL TAMAÑO DEL MERCADO DE IBC REACONDICIONADOS EN MÉXICO PRONÓSTICO, POR REGIONAL, 2019-2032 (MILES DE MILLONES DE USD)
TABLA 117. ESTIMACIONES Y POTENCIAS DEL TAMAÑO DEL MERCADO DE IBC REACONDICIONADOS EN ARGENTINA PRONÓSTICO, POR TIPO DE MATERIAL, 2019-2032 (MILLONES DE USD)
TABLA 118. ESTIMACIONES Y POTENCIA DEL TAMAÑO DEL MERCADO DE IBC REACONDICIONADOS EN ARGENTINA PRONÓSTICO, POR APLICACIÓN, 2019-2032 (MILES DE MILLONES DE USD)
TABLA 119. ESTIMACIONES Y POTENCIAS DEL TAMAÑO DEL MERCADO DE IBC REACONDICIONADOS EN ARGENTINA PRONÓSTICO, POR CAPACIDAD, 2019-2032 (MILLONES DE USD)
TABLA 120. ESTIMACIONES Y EMPRESAS DEL TAMAÑO DEL MERCADO DE IBC REACONDICIONADOS EN ARGENTINA PRONÓSTICO, POR USUARIO FINAL, 2019-2032 (MILES DE MILLONES DE USD)
TABLA 121. ESTIMACIONES Y POTENCIAS DEL TAMAÑO DEL MERCADO DE IBC REACONDICIONADOS EN ARGENTINA PRONÓSTICO, POR REGIONAL, 2019-2032 (MILES DE MILLONES DE USD)
TABLA 122. ESTIMACIONES Y ESTIMACIONES DEL TAMAÑO DEL MERCADO DE IBC REACONDICIONADOS PARA EL RESTO DE SUDAMÉRICA. PRONÓSTICO, POR TIPO DE MATERIAL, 2019-2032 (MILLONES DE USD)
TABLA 123. ESTIMACIONES Y ESTIMACIONES DEL TAMAÑO DEL MERCADO DE IBC REACONDICIONADOS PARA EL RESTO DE SUDAMÉRICA. PRONÓSTICO, POR APLICACIÓN, 2019-2032 (MILES DE MILLONES DE USD)
TABLA 124. ESTIMACIONES Y ESTIMACIONES DEL TAMAÑO DEL MERCADO DE IBC REACONDICIONADOS PARA EL RESTO DE SUDAMÉRICA. PRONÓSTICO, POR CAPACIDAD, 2019-2032 (MILLONES DE USD)
TABLA 125. ESTIMACIONES Y ESTIMACIONES DEL TAMAÑO DEL MERCADO DE IBC REACONDICIONADOS PARA EL RESTO DE SUDAMÉRICA. PRONÓSTICO, POR USUARIO FINAL, 2019-2032 (MILES DE MILLONES DE USD)
TABLA 126. ESTIMACIONES Y ESTIMACIONES DEL TAMAÑO DEL MERCADO DE IBC REACONDICIONADOS PARA EL RESTO DE SUDAMÉRICA. PRONÓSTICO, POR REGIONAL, 2019-2032 (MILES DE MILLONES DE USD)
TABLA 127. ESTIMACIONES Y ESTIMACIONES DEL TAMAÑO DEL MERCADO DE IBC REACONDICIONADOS DE MEA PRONÓSTICO, POR TIPO DE MATERIAL, 2019-2032 (MILLONES DE USD)
TABLA 128. ESTIMACIONES Y ESTIMACIONES DEL TAMAÑO DEL MERCADO DE IBC REACONDICIONADOS DE MEA PRONÓSTICO, POR APLICACIÓN, 2019-2032 (MILES DE MILLONES DE USD)
TABLA 129. ESTIMACIONES Y ESTIMACIONES DEL TAMAÑO DEL MERCADO DE IBC REACONDICIONADOS DE MEA PRONÓSTICO, POR CAPACIDAD, 2019-2032 (MILLONES DE USD)
TABLA 130. ESTIMACIONES Y ESTIMACIONES DEL TAMAÑO DEL MERCADO DE IBC REACONDICIONADOS DE MEA PRONÓSTICO, POR USUARIO FINAL, 2019-2032 (MILES DE MILLONES DE USD)
TABLA 131. ESTIMACIONES Y ESTIMACIONES DEL TAMAÑO DEL MERCADO DE IBC REACONDICIONADOS DE MEA PRONÓSTICO, POR REGIONAL, 2019-2032 (MILES DE MILLONES DE USD)
TABLA 132. ESTIMACIONES Y ESTIMACIONES DEL TAMAÑO DEL MERCADO DE IBC REACONDICIONADOS DE LOS PAÍSES DEL CCG. PRONÓSTICO, POR TIPO DE MATERIAL, 2019-2032 (MILLONES DE USD)
TABLA 133. ESTIMACIONES Y ESTIMACIONES DEL TAMAÑO DEL MERCADO DE IBC REACONDICIONADOS DE LOS PAÍSES DEL CCG. PRONÓSTICO, POR APLICACIÓN, 2019-2032 (MILES DE MILLONES DE USD)
TABLA 134. ESTIMACIONES Y ESTIMACIONES DEL TAMAÑO DEL MERCADO DE IBC REACONDICIONADOS DE LOS PAÍSES DEL CCG. PRONÓSTICO, POR CAPACIDAD, 2019-2032 (MILLONES DE USD)
TABLA 135. ESTIMACIONES Y ESTIMACIONES DEL TAMAÑO DEL MERCADO DE IBC REACONDICIONADOS DE LOS PAÍSES DEL CCG. PRONÓSTICO, POR USUARIO FINAL, 2019-2032 (MILES DE MILLONES DE USD)
TABLA 136. ESTIMACIONES Y ESTIMACIONES DEL TAMAÑO DEL MERCADO DE IBC REACONDICIONADOS DE LOS PAÍSES DEL CCG. PRONÓSTICO, POR REGIONAL, 2019-2032 (MILES DE MILLONES DE USD)
TABLA 137. ESTIMACIONES Y ESTIMACIONES DEL TAMAÑO DEL MERCADO DE IBC REACONDICIONADOS EN SUDÁFRICA PRONÓSTICO, POR TIPO DE MATERIAL, 2019-2032 (MILLONES DE USD)
TABLA 138. ESTIMACIONES Y ESTIMACIONES DEL TAMAÑO DEL MERCADO DE IBC REACONDICIONADOS EN SUDÁFRICA PRONÓSTICO, POR APLICACIÓN, 2019-2032 (MILES DE MILLONES DE USD)
TABLA 139. ESTIMACIONES Y ESTIMACIONES DEL TAMAÑO DEL MERCADO DE IBC REACONDICIONADOS EN SUDÁFRICA PRONÓSTICO, POR CAPACIDAD, 2019-2032 (MILLONES DE USD)
TABLA 140. ESTIMACIONES Y ESTIMACIONES DEL TAMAÑO DEL MERCADO DE IBC REACONDICIONADOS EN SUDÁFRICA PRONÓSTICO, POR USUARIO FINAL, 2019-2032 (MILES DE MILLONES DE USD)
TABLA 141. ESTIMACIONES Y ESTIMACIONES DEL TAMAÑO DEL MERCADO DE IBC REACONDICIONADOS EN SUDÁFRICA PRONÓSTICO, POR REGIONAL, 2019-2032 (MILES DE MILLONES DE USD)
TABLA 142. ESTIMACIONES Y ESTIMACIONES DEL TAMAÑO DEL MERCADO DEL RESTO DE IBC REACONDICIONADOS DE MEA PRONÓSTICO, POR TIPO DE MATERIAL, 2019-2032 (MILLONES DE USD)
TABLA 143. ESTIMACIONES Y ESTIMACIONES DEL TAMAÑO DEL MERCADO DEL RESTO DE IBC REACONDICIONADOS DE MEA PRONÓSTICO, POR APLICACIÓN, 2019-2032 (MILES DE MILLONES DE USD)
TABLA 144. ESTIMACIONES Y ESTIMACIONES DEL TAMAÑO DEL MERCADO DEL RESTO DE IBC REACONDICIONADOS DE MEA PRONÓSTICO, POR CAPACIDAD, 2019-2032 (MILLONES DE USD)
TABLA 145. RESTO DEESTIMACIONES Y ESTIMACIONES DEL TAMAÑO DEL MERCADO DE IBC REACONDICIONADOS DE MEA PRONÓSTICO, POR USUARIO FINAL, 2019-2032 (MILES DE MILLONES DE USD)
TABLA 146. ESTIMACIONES Y ESTIMACIONES DEL TAMAÑO DEL MERCADO DEL RESTO DE IBC REACONDICIONADOS DE MEA PRONÓSTICO, POR REGIONAL, 2019-2032 (MILES DE MILLONES DE USD)
TABLA 147. LANZAMIENTO DE PRODUCTO/DESARROLLO DE PRODUCTO/APROBACIÓN
TABLA 148. ADQUISICIÓN/ASOCIACIÓN
LISTA DE CIFRAS
FIGURA 1. SINOPSIS DEL MERCADO
FIGURA 2. ANÁLISIS DEL MERCADO DE IBC REACONDICIONADOS EN NORTEAMÉRICA
FIGURA 3. ANÁLISIS DEL MERCADO DE IBC REACONDICIONADOS EN EE. UU. POR TIPO DE MATERIAL
FIGURA 4. ANÁLISIS DEL MERCADO DE IBC REACONDICIONADOS DE EE. UU. POR APLICACIÓN
GRÁFICO 5. ANÁLISIS DEL MERCADO DE IBC REACONDICIONADOS DE EE.UU. POR CAPACIDAD
FIGURA 6. ANÁLISIS DEL MERCADO DE IBC REACONDICIONADOS EN EE. UU. POR USUARIO FINAL
GRÁFICO 7. ANÁLISIS DEL MERCADO DE IBC REACONDICIONADOS DE EE.UU. POR REGIONAL
FIGURA 8. ANÁLISIS DEL MERCADO DE IBC REACONDICIONADOS EN CANADÁ POR TIPO DE MATERIAL
FIGURA 9. ANÁLISIS DEL MERCADO DE IBC REACONDICIONADOS EN CANADÁ POR APLICACIÓN
FIGURA 10. ANÁLISIS DEL MERCADO DE IBC REACONDICIONADOS EN CANADÁ POR CAPACIDAD
FIGURA 11. ANÁLISIS DEL MERCADO DE IBC REACONDICIONADOS EN CANADÁ POR USUARIO FINAL
FIGURA 12. ANÁLISIS DEL MERCADO DE IBC REACONDICIONADOS EN CANADÁ POR REGIONAL
FIGURA 13. ANÁLISIS DEL MERCADO DE IBC REACONDICIONADOS EN EUROPA
FIGURA 14. ANÁLISIS DEL MERCADO DE IBC REACONDICIONADOS EN ALEMANIA POR TIPO DE MATERIAL
FIGURA 15. ANÁLISIS DEL MERCADO DE IBC REACONDICIONADOS EN ALEMANIA POR APLICACIÓN
GRÁFICO 16. ANÁLISIS DEL MERCADO DE IBC REACONDICIONADOS EN ALEMANIA POR CAPACIDAD
FIGURA 17. ANÁLISIS DEL MERCADO DE IBC REACONDICIONADOS EN ALEMANIA POR USUARIO FINAL
GRÁFICO 18. ANÁLISIS DEL MERCADO DE IBC REACONDICIONADOS EN ALEMANIA POR REGIONAL
FIGURA 19. ANÁLISIS DEL MERCADO DE IBC REACONDICIONADOS DEL REINO UNIDO POR TIPO DE MATERIAL
FIGURA 20. ANÁLISIS DEL MERCADO DE IBC REACONDICIONADOS DEL REINO UNIDO POR APLICACIÓN
FIGURA 21. ANÁLISIS DEL MERCADO DE IBC REACONDICIONADOS DEL REINO UNIDO POR CAPACIDAD
FIGURA 22. ANÁLISIS DEL MERCADO DE IBC REACONDICIONADOS DEL REINO UNIDO POR USUARIO FINAL
GRÁFICO 23. ANÁLISIS DEL MERCADO DE IBC REACONDICIONADOS DEL REINO UNIDO POR REGIONAL
FIGURA 24. ANÁLISIS DEL MERCADO DE IBC REACONDICIONADOS EN FRANCIA POR TIPO DE MATERIAL
FIGURA 25. ANÁLISIS DEL MERCADO DE IBC REACONDICIONADOS EN FRANCIA POR APLICACIÓN
GRÁFICO 26. ANÁLISIS DEL MERCADO DE IBC REACONDICIONADOS EN FRANCIA POR CAPACIDAD
FIGURA 27. ANÁLISIS DEL MERCADO DE IBC REACONDICIONADOS EN FRANCIA POR USUARIO FINAL
GRÁFICO 28. ANÁLISIS DEL MERCADO DE IBC REACONDICIONADOS EN FRANCIA POR REGIONAL
FIGURA 29. ANÁLISIS DEL MERCADO DE IBC REACONDICIONADOS EN RUSIA POR TIPO DE MATERIAL
FIGURA 30. ANÁLISIS DEL MERCADO DE IBC REACONDICIONADOS EN RUSIA POR APLICACIÓN
GRÁFICO 31. ANÁLISIS DEL MERCADO DE IBC REACONDICIONADOS EN RUSIA POR CAPACIDAD
FIGURA 32. ANÁLISIS DEL MERCADO DE IBC REACONDICIONADOS EN RUSIA POR USUARIO FINAL
GRÁFICO 33. ANÁLISIS DEL MERCADO DE IBC REACONDICIONADOS DE RUSIA POR REGIONAL
FIGURA 34. ANÁLISIS DEL MERCADO DE IBC REACONDICIONADOS EN ITALIA POR TIPO DE MATERIAL
FIGURA 35. ANÁLISIS DEL MERCADO DE IBC REACONDICIONADOS EN ITALIA POR APLICACIÓN
GRÁFICO 36. ANÁLISIS DEL MERCADO DE IBC REACONDICIONADOS EN ITALIA POR CAPACIDAD
FIGURA 37. ANÁLISIS DEL MERCADO DE IBC REACONDICIONADOS EN ITALIA POR USUARIO FINAL
GRÁFICO 38. ANÁLISIS DEL MERCADO DE IBC REACONDICIONADOS EN ITALIA POR REGIONALES
FIGURA 39. ANÁLISIS DEL MERCADO DE IBC REACONDICIONADOS EN ESPAÑA POR TIPO DE MATERIAL
FIGURA 40. ANÁLISIS DEL MERCADO DE IBC REACONDICIONADOS EN ESPAÑA POR APLICACIÓN
GRÁFICO 41. ANÁLISIS DEL MERCADO DE IBC REACONDICIONADOS EN ESPAÑA POR CAPACIDAD
FIGURA 42. ANÁLISIS DEL MERCADO DE IBC REACONDICIONADOS EN ESPAÑA POR USUARIO FINAL
GRÁFICO 43. ANÁLISIS DEL MERCADO DE IBC REACONDICIONADOS EN ESPAÑA POR REGIONALES
FIGURA 44. ANÁLISIS DEL MERCADO DE IBC REACONDICIONADOS DEL RESTO DE EUROPA POR TIPO DE MATERIAL
GRÁFICO 45. ANÁLISIS DEL MERCADO DE IBC REACONDICIONADOS DEL RESTO DE EUROPA POR APLICACIÓN
GRÁFICO 46. ANÁLISIS DEL MERCADO DE IBC REACONDICIONADOS DEL RESTO DE EUROPA POR CAPACIDAD
FIGURA 47. ANÁLISIS DEL MERCADO DE IBC REACONDICIONADOS DEL RESTO DE EUROPA POR USUARIO FINAL
GRÁFICO 48. ANÁLISIS DEL MERCADO DE IBC REACONDICIONADOS DEL RESTO DE EUROPA POR REGIONALES
FIGURA 49. ANÁLISIS DEL MERCADO DE IBC REACONDICIONADOS APAC
FIGURA 50. ANÁLISIS DEL MERCADO DE IBC REACONDICIONADOS EN CHINA POR TIPO DE MATERIAL
FIGURA 51. ANÁLISIS DEL MERCADO DE IBC REACONDICIONADOS EN CHINA POR APLICACIÓN
GRÁFICO 52. ANÁLISIS DEL MERCADO DE IBC REACONDICIONADOS EN CHINA POR CAPACIDAD
FIGURA 53. ANÁLISIS DEL MERCADO DE IBC REACONDICIONADOS EN CHINA POR USUARIO FINAL
GRÁFICO 54. ANÁLISIS DEL MERCADO DE IBC REACONDICIONADOS DE CHINA POR REGIONAL
FIGURA 55. ANÁLISIS DEL MERCADO DE IBC REACONDICIONADOS EN INDIA POR TIPO DE MATERIAL
FIGURA 56. ANÁLISIS DEL MERCADO DE IBC REACONDICIONADOS DE LA INDIA POR APLICACIÓN
GRÁFICO 57. ANÁLISIS DEL MERCADO DE IBC REACONDICIONADOS DE INDIA POR CAPACIDAD
FIGURA 58. ANÁLISIS DEL MERCADO DE IBC REACONDICIONADOS EN INDIA POR USUARIO FINAL
GRÁFICO 59. ANÁLISIS DEL MERCADO DE IBC REACONDICIONADOS DE LA INDIA POR REGIONAL
FIGURA 60. ANÁLISIS DEL MERCADO DE IBC REACONDICIONADOS EN JAPÓN POR TIPO DE MATERIAL
FIGURA 61. ANÁLISIS DEL MERCADO DE IBC REACONDICIONADOS EN JAPÓN POR APLICACIÓN
GRÁFICO 62. ANÁLISIS DEL MERCADO DE IBC REACONDICIONADOS EN JAPÓN POR CAPACIDAD
FIGURA 63. ANÁLISIS DEL MERCADO DE IBC REACONDICIONADOS EN JAPÓN POR USUARIO FINAL
GRÁFICO 64. ANÁLISIS DEL MERCADO DE IBC REACONDICIONADOS EN JAPÓN POR REGIONAL
FIGURA 65. ANÁLISIS DEL MERCADO DE IBC REACONDICIONADOS DE COREA DEL SUR POR TIPO DE MATERIAL
GRÁFICO 66. ANÁLISIS DEL MERCADO DE IBC REACONDICIONADOS DE COREA DEL SUR POR APLICACIÓN
GRÁFICO 67. ANÁLISIS DEL MERCADO DE IBC REACONDICIONADOS DE COREA DEL SUR POR CAPACIDAD
GRÁFICO 68. ANÁLISIS DEL MERCADO DE IBC REACONDICIONADOS DE COREA DEL SUR POR USUARIO FINAL
GRÁFICO 69. ANÁLISIS DEL MERCADO DE IBC REACONDICIONADOS DE COREA DEL SUR POR REGIONAL
FIGURA 70. ANÁLISIS DEL MERCADO DE IBC REACONDICIONADOS EN MALASIA POR TIPO DE MATERIAL
FIGURA 71. ANÁLISIS DEL MERCADO DE IBC REACONDICIONADOS EN MALASIA POR APLICACIÓN
GRÁFICO 72. ANÁLISIS DEL MERCADO DE IBC REACONDICIONADOS EN MALASIA POR CAPACIDAD
FIGURA 73. ANÁLISIS DEL MERCADO DE IBC REACONDICIONADOS EN MALASIA POR USUARIO FINAL
GRÁFICO 74. ANÁLISIS DEL MERCADO DE IBC REACONDICIONADOS EN MALASIA POR REGIONAL
FIGURA 75. ANÁLISIS DEL MERCADO DE IBC REACONDICIONADOS EN TAILANDIA POR TIPO DE MATERIAL
FIGURA 76. ANÁLISIS DEL MERCADO DE IBC REACONDICIONADOS EN TAILANDIA POR APLICACIÓN
GRÁFICO 77. ANÁLISIS DEL MERCADO DE IBC REACONDICIONADOS DE TAILANDIA POR CAPACIDAD
FIGURA 78. ANÁLISIS DEL MERCADO DE IBC REACONDICIONADOS EN TAILANDIA POR USUARIO FINAL
GRÁFICO 79. ANÁLISIS DEL MERCADO DE IBC REACONDICIONADOS DE TAILANDIA POR REGIONAL
FIGURA 80. ANÁLISIS DEL MERCADO DE IBC REACONDICIONADOS EN INDONESIA POR TIPO DE MATERIAL
FIGURA 81. ANÁLISIS DEL MERCADO DE IBC REACONDICIONADOS EN INDONESIA POR APLICACIÓN
GRÁFICO 82. ANÁLISIS DEL MERCADO DE IBC REACONDICIONADOS EN INDONESIA POR CAPACIDAD
FIGURA 83. ANÁLISIS DEL MERCADO DE IBC REACONDICIONADOS EN INDONESIA POR USUARIO FINAL
GRÁFICO 84. ANÁLISIS DEL MERCADO DE IBC REACONDICIONADOS EN INDONESIA POR REGIONAL
FIGURA 85. RESTO DE ANÁLISIS DEL MERCADO DE IBC REACONDICIONADOS DE APAC POR TIPO DE MATERIAL
FIGURA 86. RESTO DE ANÁLISIS DEL MERCADO DE IBC REACONDICIONADOS DE APAC POR APLICACIÓN
GRÁFICO 87. RESTO DE ANÁLISIS DEL MERCADO DE IBC REACONDICIONADOS DE APAC POR CAPACIDAD
FIGURA 88. RESTO DE ANÁLISIS DEL MERCADO DE IBC REACONDICIONADOS DE APAC POR USUARIO FINAL
GRÁFICO 89. ANÁLISIS DEL MERCADO DE IBC REACONDICIONADOS DEL RESTO DE APAC POR REGIONAL
FIGURA 90. ANÁLISIS DEL MERCADO DE IBC REACONDICIONADOS EN SUDAMÉRICA
FIGURA 91. ANÁLISIS DEL MERCADO DE IBC REACONDICIONADOS EN BRASIL POR TIPO DE MATERIAL
GRÁFICO 92. ANÁLISIS DEL MERCADO DE IBC REACONDICIONADOS EN BRASIL POR APLICACIÓN
GRÁFICO 93. ANÁLISIS DEL MERCADO DE IBC REACONDICIONADOS EN BRASIL POR CAPACIDAD
GRÁFICO 94. ANÁLISIS DEL MERCADO DE IBC REACONDICIONADOS EN BRASIL POR USUARIO FINAL
GRÁFICO 95. ANÁLISIS DEL MERCADO DE IBC REACONDICIONADOS EN BRASIL POR REGIONAL
GRÁFICO 96. ANÁLISIS DEL MERCADO DE IBC REACONDICIONADOS EN MÉXICO POR TIPO DE MATERIAL
GRÁFICO 97. ANÁLISIS DEL MERCADO DE IBC REACONDICIONADOS EN MÉXICO POR APLICACIÓN
GRÁFICO 98. ANÁLISIS DEL MERCADO DE IBC REACONDICIONADOS EN MÉXICO POR CAPACIDAD
GRÁFICO 99. ANÁLISIS DEL MERCADO DE IBC REACONDICIONADOS EN MÉXICO POR USUARIO FINAL
GRÁFICO 100. ANÁLISIS DEL MERCADO DE IBC REACONDICIONADOS EN MÉXICO POR REGIONAL
FIGURA 101. ANÁLISIS DEL MERCADO DE IBC REACONDICIONADOS EN ARGENTINA POR TIPO DE MATERIAL
FIGURA 102. ANÁLISIS DEL MERCADO DE IBC REACONDICIONADOS EN ARGENTINA POR APLICACIÓN
GRÁFICO 103. ANÁLISIS DEL MERCADO DE IBC REACONDICIONADOS EN ARGENTINA POR CAPACIDAD
FIGURA 104. ANÁLISIS DEL MERCADO DE IBC REACONDICIONADOS EN ARGENTINA POR USUARIO FINAL
GRÁFICO 105. ANÁLISIS DEL MERCADO DE IBC REACONDICIONADOS EN ARGENTINA POR REGIONALES
FIGURA 106. ANÁLISIS DEL MERCADO DE IBC REACONDICIONADOS RESTO DE SUDAMÉRICA POR TIPO DE MATERIAL
GRÁFICO 107. RESTO DE SUDAMÉRICA ANÁLISIS DEL MERCADO DE IBC REACONDICIONADOS POR APLICACIÓN
GRÁFICO 108. ANÁLISIS DEL MERCADO DE IBC REACONDICIONADOS RESTO DE SUDAMÉRICA POR CAPACIDAD
FIGURA 109. RESTO DE SUDAMÉRICA ANÁLISIS DEL MERCADO DE IBC REACONDICIONADOS POR USUARIO FINAL
GRÁFICO 110. ANÁLISIS DEL MERCADO DE IBC REACONDICIONADOS RESTO DE SUDAMÉRICA POR REGIONALES
FIGURA 111. ANÁLISIS DE MERCADO DE IBC REACONDICIONADOS MEA
FIGURA 112. ANÁLISIS DEL MERCADO DE IBC REACONDICIONADOS DE LOS PAÍSES DEL CCG POR TIPO DE MATERIAL
GRÁFICO 113. ANÁLISIS DEL MERCADO DE IBC REACONDICIONADOS DE LOS PAÍSES DEL CCG POR APLICACIÓN
GRÁFICO 114. ANÁLISIS DEL MERCADO DE IBC REACONDICIONADOS DE LOS PAÍSES DEL CCG POR CAPACIDAD
FIGURA 115. ANÁLISIS DEL MERCADO DE IBC REACONDICIONADOS DE LOS PAÍSES DEL CCG POR USUARIO FINAL
GRÁFICO 116. ANÁLISIS DEL MERCADO DE IBC REACONDICIONADOS DE LOS PAÍSES DEL CCG POR REGIONAL
FIGURA 117. ANÁLISIS DEL MERCADO DE IBC REACONDICIONADOS EN SUDÁFRICA POR TIPO DE MATERIAL
FIGURA 118. ANÁLISIS DEL MERCADO DE IBC REACONDICIONADOS EN SUDÁFRICA POR APLICACIÓN
GRÁFICO 119. ANÁLISIS DEL MERCADO DE IBC REACONDICIONADOS EN SUDÁFRICA POR CAPACIDAD
FIGURA 120. ANÁLISIS DEL MERCADO DE IBC REACONDICIONADOS EN SUDÁFRICA POR USUARIO FINAL
GRÁFICO 121. ANÁLISIS DEL MERCADO DE IBC REACONDICIONADOS EN SUDÁFRICA POR REGIONAL
FIGURA 122. ANÁLISIS DE MERCADO RESTO DE IBC REACONDICIONADOS DE MEA POR TIPO DE MATERIAL
FIGURA 123. RESTO DE MEA ANÁLISIS DE MERCADO IBC REACONDICIONADOS POR APLICACIÓN
FIGURA 124. RESTO DE MEA ANÁLISIS DE MERCADO IBC REACONDICIONADOS POR CAPACIDAD
FIGURA 125. RESTO DE ANÁLISIS DE MERCADO DE IBC REACONDICIONADOS POR USUARIO FINAL
GRÁFICO 126. RESTO DE MEA ANÁLISIS DE MERCADO DE IBC REACONDICIONADOS POR REGIONALES
FIGURA 127. CRITERIOS CLAVE DE COMPRA DEL MERCADO DE IBC REACONDICIONADOS
FIGURA 128. PROCESO DE INVESTIGACIÓN DEL MRFR
FIGURA 129. ANÁLISIS DRO DEL MERCADO DE IBC REACONDICIONADOS
FIGURA 130. ANÁLISIS DE IMPACTO DE LOS IMPULSORES: MERCADO DE IBC REACONDICIONADOS
FIGURA 131. ANÁLISIS DE IMPACTO DE LAS RESTRICCIONES: MERCADO DE IBC REACONDICIONADOS
FIGURA 132. CADENA DE SUMINISTRO/VALOR: MERCADO DE IBC REACONDICIONADOS
GRÁFICO 133. MERCADO DE IBC REACONDICIONADOS, POR TIPO DE MATERIAL, 2024 (% DE PARTICIPACIÓN)
FIGURA 134. MERCADO DE IBC REACONDICIONADOS, POR TIPO DE MATERIAL, 2019 A 2032 (Miles de millones de USD)
GRÁFICO 135. MERCADO DE IBC REACONDICIONADOS, POR APLICACIÓN, 2024 (% DE PARTICIPACIÓN)
FIGURA 136. MERCADO DE IBC REACONDICIONADOS, POR APLICACIÓN, 2019 A 2032 (Miles de millones de USD)
GRÁFICO 137. MERCADO DE IBC REACONDICIONADOS, POR CAPACIDAD, 2024 (% DE PARTICIPACIÓN)
FIGURA 138. MERCADO DE IBC REACONDICIONADOS, POR CAPACIDAD, 2019 A 2032 (Miles de millones de USD)
FIGURA 139. MERCADO DE IBC REACONDICIONADOS, POR USUARIO FINAL, 2024 (% DE PARTICIPACIÓN)
FIGURA 140. MERCADO DE IBC REACONDICIONADOS, POR USUARIO FINAL, 2019 A 2032 (Miles de millones de USD)
GRÁFICO 141. MERCADO DE IBC REACONDICIONADOS, POR REGIONAL, 2024 (% DE PARTICIPACIÓN)
GRÁFICO 142. MERCADO DE IBC REACONDICIONADOS, POR REGIONAL, 2019 A 2032 (Miles de millones de USD)
FIGURA 143. COMPARACIÓN DE LOS PRINCIPALES COMPETIDORES
1. RESUMEN EJECUTIVO
1.1. Descripción general del mercado
1.2. Hallazgos clave
1.3. Segmentación del mercado
1.4. Panorama competitivo
1.5. Retos y Oportunidades
1.6. Perspectivas de futuro
2. INTRODUCCIÓN AL MERCADO
2.1. Definición
2.2. Alcance del estudio
2.2.1. Objetivo de la investigación
2.2.2. Supuesto
2.2.3. Limitaciones
3. METODOLOGÍA DE LA INVESTIGACIÓN
3.1. Descripción general
3.2. Minería de datos
3.3. Investigación Secundaria
3.4. Investigación primaria
3.4.1. Entrevistas primarias y proceso de recopilación de información
3.4.2. Desglose de los encuestados principales
3.5. Modelo de previsión
3.6. Estimación del tamaño del mercado
3.6.1. Enfoque ascendente
3.6.2. Enfoque de arriba hacia abajo
3.7. Triangulación de datos
3.8. Validación
4. DINÁMICA DEL MERCADO
4.1. Descripción general
4.2. Conductores
4.3. Restricciones
4.4. Oportunidades
5. ANÁLISIS DE FACTORES DE MERCADO
5.1. Análisis de la cadena de valor
5.2. Análisis de las cinco fuerzas de Porter
5.2.1. Poder de negociación de los proveedores
5.2.2. Poder de negociación de los compradores
5.2.3. Amenaza de nuevos participantes
5.2.4. Amenaza de sustitutos
5.2.5. Intensidad de la rivalidad
5.3. Análisis de impacto de COVID-19
5.3.1. Análisis de impacto en el mercado
5.3.2. Impacto regional
5.3.3. Análisis de oportunidades y amenazas
6. MERCADO DE IBC REACONDICIONADOS, POR TIPO DE MATERIAL (MILLONES DE USD)
6.1. Plástico
6.2. Metálicos
6.3. Compuesto
7. MERCADO DE IBC REACONDICIONADOS, POR APLICACIÓN (MILLONES DE USD)
7.1. Productos químicos
7.2. Alimentos y Bebidas
7.3. Productos farmacéuticos
7.4. Aceites y Lubricantes
8. MERCADO DE IBC REACONDICIONADOS, POR CAPACIDAD (MILLONES DE USD)
8.1. Por debajo de 500 litros
8.2. 500 a 1000 Litros
8.3. Más de 1000 Litros
9. MERCADO DE IBC REACONDICIONADOS, POR USUARIO FINAL (MILLONES DE USD)
9.1. Fabricación
9.2. Logística
9.3. Comercio minorista
10. MERCADO DE IBC REACONDICIONADOS, POR REGIONAL (MILLONES DE USD)
10.1. América del Norte
10.1.1. Estados Unidos
10.1.2. Canadá
10.2. Europa
10.2.1. Alemania
10.2.2. Reino Unido
10.2.3. Francia
10.2.4. Rusia
10.2.5. Italia
10.2.6. España
10.2.7. Resto de Europa
10.3. Asia Pacífico
10.3.1. China
10.3.2. India
10.3.3. Japón
10.3.4. Corea del Sur
10.3.5. Malasia
10.3.6. Tailandia
10.3.7. Indonesia
10.3.8. Resto de APAC
10.4. América del Sur
10.4.1. Brasil
10.4.2. México
10.4.3. argentina
10.4.4. Resto de Sudamérica
10.5. MEA
10.5.1. Países del CCG
10.5.2. Sudáfrica
Segmentación del mercado de mercado IBC reacondicionado
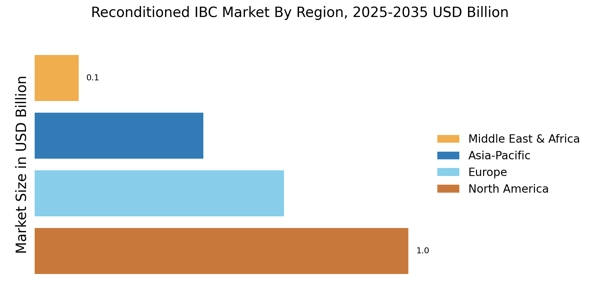
Perspectivas regionales del mercado de IBC reacondicionados (miles de millones de dólares, 2019-2032)
-
Perspectivas de América del Norte (miles de millones de dólares, 2019-2032)
-
Mercado de IBC reacondicionados en América del Norte por tipo de material
-
Mercado de IBC reacondicionados en América del Norte por tipo de aplicación
-
Productos químicos
-
Alimentos y bebidas
-
Productos farmacéuticos
-
Aceites y Lubricantes
-
Mercado de IBC reacondicionados en América del Norte por tipo de capacidad
-
Por debajo de 500 litros
-
500 a 1000 Litros
-
Más de 1000 litros
-
Mercado de IBC reacondicionados en América del Norte por tipo de usuario final
-
Fabricación
-
Logística
-
Venta al por menor
-
Mercado de IBC reacondicionados de América del Norte por tipo regional
-
Perspectivas de EE. UU. (miles de millones de dólares, 2019-2032)
-
Mercado de IBC reacondicionados de EE. UU. por tipo de material
-
Mercado de IBC reacondicionados de EE. UU. por tipo de aplicación
-
Productos químicos
-
Alimentos y bebidas
-
Productos farmacéuticos
-
Aceites y Lubricantes
-
Mercado de IBC reacondicionados de EE. UU. por tipo de capacidad
-
Por debajo de 500 litros
-
500 a 1000 Litros
-
Más de 1000 litros
-
Mercado de IBC reacondicionados en EE. UU. por tipo de usuario final
-
Fabricación
-
Logística
-
Venta al por menor
-
Perspectivas de CANADÁ (miles de millones de dólares, 2019-2032)
-
Mercado de IBC reacondicionados en CANADÁ por tipo de material
-
Mercado de IBC reacondicionados en CANADÁ por tipo de aplicación
-
Productos químicos
-
Alimentos y bebidas
-
Productos farmacéuticos
-
Aceites y Lubricantes
-
Mercado de IBC reacondicionados en CANADÁ por tipo de capacidad
-
Por debajo de 500 litros
-
500 a 1000 Litros
-
Más de 1000 litros
-
Mercado de IBC reacondicionados en CANADÁ por tipo de usuario final
-
Fabricación
-
Logística
-
Venta al por menor
-
Perspectivas de Europa (miles de millones de dólares, 2019-2032)
-
Mercado europeo de IBC reacondicionados por tipo de material
-
Mercado europeo de IBC reacondicionados por tipo de aplicación
-
Productos químicos
-
Alimentos y bebidas
-
Productos farmacéuticos
-
Aceites y Lubricantes
-
Mercado europeo de IBC reacondicionados por tipo de capacidad
-
Por debajo de 500 litros
-
500 a 1000 Litros
-
Más de 1000 litros
-
Mercado europeo de IBC reacondicionados por tipo de usuario final
-
Fabricación
-
Logística
-
Venta al por menor
-
Mercado europeo de IBC reacondicionados por tipo regional
-
Alemania
-
Reino Unido
-
Francia
-
Rusia
-
Italia
-
España
-
Resto de Europa
-
Perspectivas de ALEMANIA (miles de millones de dólares, 2019-2032)
-
Mercado de IBC reacondicionados en ALEMANIA por tipo de material
-
Mercado de IBC reacondicionados en ALEMANIA por tipo de aplicación
-
Productos químicos
-
Alimentos y bebidas
-
Productos farmacéuticos
-
Aceites y Lubricantes
-
Mercado de IBC reacondicionados en ALEMANIA por tipo de capacidad
-
Por debajo de 500 litros
-
500 a 1000 Litros
-
Más de 1000 litros
-
Mercado de IBC reacondicionados en ALEMANIA por tipo de usuario final
-
Fabricación
-
Logística
-
Venta al por menor
-
Perspectivas del Reino Unido (miles de millones de dólares, 2019-2032)
-
Mercado de IBC reacondicionados en el Reino Unido por tipo de material
-
Mercado de IBC reacondicionados en el Reino Unido por tipo de aplicación
-
Productos químicos
-
Alimentos y bebidas
-
Productos farmacéuticos
-
Aceites y Lubricantes
-
Mercado de IBC reacondicionados en el Reino Unido por tipo de capacidad
-
Por debajo de 500 litros
-
500 a 1000 Litros
-
Más de 1000 litros
-
Mercado de IBC reacondicionados en el Reino Unido por tipo de usuario final
-
Fabricación
-
Logística
-
Venta al por menor
-
Perspectivas de FRANCIA (miles de millones de dólares, 2019-2032)
-
Mercado de IBC reacondicionados en FRANCIA por tipo de material
-
Mercado de IBC reacondicionados en FRANCIA por tipo de aplicación
-
Productos químicos
-
Alimentos y bebidas
-
Productos farmacéuticos
-
Aceites y Lubricantes
-
Mercado de IBC reacondicionados en FRANCIA por tipo de capacidad
-
Por debajo de 500 litros
-
500 a 1000 Litros
-
Más de 1000 litros
-
Mercado de IBC reacondicionados en FRANCIA por tipo de usuario final
-
Fabricación
-
Logística
-
Venta al por menor
-
Perspectivas de RUSIA (miles de millones de dólares, 2019-2032)
-
Mercado de IBC reacondicionados de RUSIA por tipo de material
-
Mercado de IBC reacondicionados de RUSIA por tipo de aplicación
-
Productos químicos
-
Alimentos y bebidas
-
Productos farmacéuticos
-
Aceites y Lubricantes
-
Mercado de IBC reacondicionados de RUSIA por tipo de capacidad
-
Por debajo de 500 litros
-
500 a 1000 Litros
-
Más de 1000 litros
-
Mercado de IBC reacondicionados de RUSIA por tipo de usuario final
-
Fabricación
-
Logística
-
Venta al por menor
-
Perspectivas de ITALIA (miles de millones de dólares, 2019-2032)
-
Mercado de IBC reacondicionados en ITALIA por tipo de material
-
Mercado de IBC reacondicionados en ITALIA por tipo de aplicación
-
Productos químicos
-
Alimentos y bebidas
-
Productos farmacéuticos
-
Aceites y Lubricantes
-
Mercado de IBC reacondicionados en ITALIA por tipo de capacidad
-
Por debajo de 500 litros
-
500 a 1000 Litros
-
Más de 1000 litros
-
Mercado de IBC reacondicionados en ITALIA por tipo de usuario final
-
Fabricación
-
Logística
-
Venta al por menor
-
Perspectivas de ESPAÑA (Miles de millones de dólares, 2019-2032)
-
Mercado ESPAÑA de IBC reacondicionados por tipo de material
-
Mercado de IBC reacondicionados en ESPAÑA por tipo de aplicación
-
Productos químicos
-
Alimentos y bebidas
-
Productos farmacéuticos
-
Aceites y Lubricantes
-
Mercado de IBC reacondicionados en ESPAÑA por tipo de capacidad
-
Por debajo de 500 litros
-
500 a 1000 Litros
-
Más de 1000 litros
-
Mercado de IBC reacondicionados en ESPAÑA por tipo de usuario final
-
Fabricación
-
Logística
-
Venta al por menor
-
Perspectivas DEL RESTO DE EUROPA (Miles de millones de dólares, 2019-2032)
-
RESTO DE EUROPA Mercado de IBC reacondicionados por tipo de material
-
RESTO DE EUROPA Mercado IBC reacondicionado por tipo de aplicación
-
Productos químicos
-
Alimentos y bebidas
-
Productos farmacéuticos
-
Aceites y Lubricantes
-
RESTO DE EUROPA Mercado de IBC reacondicionados por tipo de capacidad
-
Por debajo de 500 litros
-
500 a 1000 Litros
-
Más de 1000 litros
-
RESTO DE EUROPA Mercado de IBC reacondicionados por tipo de usuario final
-
Fabricación
-
Logística
-
Venta al por menor
-
Perspectivas de Asia Pacífico (miles de millones de dólares, 2019-2032)
-
Mercado de IBC reacondicionados de APAC por tipo de material
-
Mercado de IBC reacondicionados de APAC por tipo de aplicación
-
Productos químicos
-
Alimentos y bebidas
-
Productos farmacéuticos
-
Aceites y Lubricantes
-
Mercado de IBC reacondicionados de APAC por tipo de capacidad
-
Por debajo de 500 litros
-
500 a 1000 Litros
-
Más de 1000 litros
-
Mercado de IBC reacondicionados de APAC por tipo de usuario final
-
Fabricación
-
Logística
-
Venta al por menor
-
Mercado de IBC reacondicionados de APAC por tipo regional
-
China
-
India
-
Japón
-
Corea del Sur
-
Malasia
-
Tailandia
-
Indonesia
-
Resto de APAC
-
Perspectivas de CHINA (miles de millones de dólares, 2019-2032)
-
Mercado CHINA de IBC reacondicionados por tipo de material
-
Mercado CHINA de IBC reacondicionados por tipo de aplicación
-
Productos químicos
-
Alimentos y bebidas
-
Productos farmacéuticos
-
Aceites y Lubricantes
-
Mercado CHINA de IBC reacondicionados por tipo de capacidad
-
Por debajo de 500 litros
-
500 a 1000 Litros
-
Más de 1000 litros
-
Mercado CHINA de IBC reacondicionados por tipo de usuario final
-
Fabricación
-
Logística
-
Venta al por menor
-
Perspectivas de la INDIA (miles de millones de dólares, 2019-2032)
-
Mercado de IBC reacondicionados de INDIA por tipo de material
-
Mercado de IBC reacondicionados de INDIA por tipo de aplicación
-
Productos químicos
-
Alimentos y bebidas
-
Productos farmacéuticos
-
Aceites y Lubricantes
-
Mercado de IBC reacondicionados de INDIA por tipo de capacidad
-
Por debajo de 500 litros
-
500 a 1000 Litros
-
Más de 1000 litros
-
Mercado de IBC reacondicionados de INDIA por tipo de usuario final
-
Fabricación
-
Logística
-
Venta al por menor
-
Perspectivas de JAPÓN (miles de millones de dólares, 2019-2032)
-
Mercado JAPÓN de IBC reacondicionados por tipo de material
-
Mercado JAPÓN de IBC reacondicionados por tipo de aplicación
-
Productos químicos
-
Alimentos y bebidas
-
Productos farmacéuticos
-
Aceites y Lubricantes
-
Mercado JAPÓN de IBC reacondicionados por tipo de capacidad
-
Por debajo de 500 litros
-
500 a 1000 Litros
-
Más de 1000 litros
-
Mercado JAPÓN de IBC reacondicionados por tipo de usuario final
-
Fabricación
-
Logística
-
Venta al por menor
-
Perspectivas de COREA DEL SUR (miles de millones de dólares, 2019-2032)
-
Mercado de IBC reacondicionados de COREA DEL SUR por tipo de material
-
Mercado de IBC reacondicionados de COREA DEL SUR por tipo de aplicación
-
Productos químicos
-
Alimentos y bebidas
-
Productos farmacéuticos
-
Aceites y Lubricantes
-
Mercado de IBC reacondicionados de COREA DEL SUR por tipo de capacidad
-
Por debajo de 500 litros
-
500 a 1000 Litros
-
Más de 1000 litros
-
Mercado de IBC reacondicionados de COREA DEL SUR por tipo de usuario final
-
Fabricación
-
Logística
-
Venta al por menor
-
Perspectivas de MALASIA (miles de millones de dólares, 2019-2032)
-
Mercado de IBC reacondicionados de MALASIA por tipo de material
-
Mercado de IBC reacondicionados de MALASIA por tipo de aplicación
-
Productos químicos
-
Alimentos y bebidas
-
Productos farmacéuticos
-
Aceites y Lubricantes
-
Mercado de IBC reacondicionados de MALASIA por tipo de capacidad
-
Por debajo de 500 litros
-
500 a 1000 Litros
-
Más de 1000 litros
-
Mercado de IBC reacondicionados de MALASIA por tipo de usuario final
-
Fabricación
-
Logística
-
Venta al por menor
-
Perspectivas de TAILANDIA (miles de millones de dólares, 2019-2032)
-
Mercado de IBC reacondicionados de TAILANDIA por tipo de material
-
Mercado de IBC reacondicionados de TAILANDIA por tipo de aplicación
-
Productos químicos
-
Alimentos y bebidas
-
Productos farmacéuticos
-
Aceites y Lubricantes
-
Mercado de IBC reacondicionados de TAILANDIA por tipo de capacidad
-
Por debajo de 500 litros
-
500 a 1000 Litros
-
Más de 1000 litros
-
Mercado de IBC reacondicionados de TAILANDIA por tipo de usuario final
-
Fabricación
-
Logística
-
Venta al por menor
-
Perspectivas de INDONESIA (miles de millones de dólares, 2019-2032)
-
Mercado de IBC reacondicionados en INDONESIA por tipo de material
-
Mercado de IBC reacondicionados de INDONESIA por tipo de aplicación
-
Productos químicos
-
Alimentos y bebidas
-
Productos farmacéuticos
-
Aceites y Lubricantes
-
Mercado de IBC reacondicionados de INDONESIA por tipo de capacidad
-
Por debajo de 500 litros
-
500 a 1000 Litros
-
Más de 1000 litros
-
Mercado de IBC reacondicionados en INDONESIA por tipo de usuario final
-
Fabricación
-
Logística
-
Venta al por menor
-
Perspectivas del RESTO DE APAC (miles de millones de dólares, 2019-2032)
-
RESTO DEL Mercado de IBC reacondicionados de APAC por tipo de material
-
RESTO DEL Mercado IBC reacondicionado de APAC por tipo de aplicación
-
Productos químicos
-
Alimentos y bebidas
-
Productos farmacéuticos
-
Aceites y Lubricantes
-
RESTO DEL Mercado de IBC reacondicionados de APAC por tipo de capacidad
-
Por debajo de 500 litros
-
500 a 1000 Litros
-
Más de 1000 litros
-
RESTO DEL Mercado de IBC reacondicionados de APAC por tipo de usuario final
-
Fabricación
-
Logística
-
Venta al por menor
-
Perspectivas de América del Sur (miles de millones de dólares, 2019-2032)
-
Mercado de IBC reacondicionados en América del Sur por tipo de material
-
Mercado de IBC reacondicionados en América del Sur por tipo de aplicación
-
Productos químicos
-
Alimentos y bebidas
-
Productos farmacéuticos
-
Aceites y Lubricantes
-
Mercado de IBC reacondicionados en América del Sur por tipo de capacidad
-
Por debajo de 500 litros
-
500 a 1000 Litros
-
Más de 1000 litros
-
Mercado de IBC reacondicionados en América del Sur por tipo de usuario final
-
Fabricación
-
Logística
-
Venta al por menor
-
Mercado de IBC reacondicionados en América del Sur por tipo regional
-
Brasil
-
México
-
Argentina
-
Resto de Sudamérica
-
Perspectivas de BRASIL (miles de millones de dólares, 2019-2032)
-
Mercado de IBC reacondicionados en BRASIL por tipo de material
-
Mercado de IBC reacondicionados en BRASIL por tipo de aplicación
-
Productos químicos
-
Alimentos y bebidas
-
Productos farmacéuticos
-
Aceites y Lubricantes
-
Mercado de IBC reacondicionados en BRASIL por tipo de capacidad
-
Por debajo de 500 litros
-
500 a 1000 Litros
-
Más de 1000 litros
-
Mercado de IBC reacondicionados en BRASIL por tipo de usuario final
-
Fabricación
-
Logística
-
Venta al por menor
-
Perspectivas de MÉXICO (Miles de millones de dólares, 2019-2032)
-
Mercado de IBC reacondicionados en MÉXICO por tipo de material
-
Mercado de IBC reacondicionados en MÉXICO por tipo de aplicación
-
Productos químicos
-
Alimentos y bebidas
-
Productos farmacéuticos
-
Aceites y Lubricantes
-
Mercado de IBC reacondicionados en MÉXICO por tipo de capacidad
-
Por debajo de 500 litros
-
500 a 1000 Litros
-
Más de 1000 litros
-
Mercado de IBC reacondicionados en MÉXICO por tipo de usuario final
-
Fabricación
-
Logística
-
Venta al por menor
-
Perspectivas de ARGENTINA (Miles de millones de dólares, 2019-2032)
-
Mercado de IBC reacondicionados en ARGENTINA por tipo de material
-
Mercado de IBC reacondicionados en ARGENTINA por tipo de aplicación
-
Productos químicos
-
Alimentos y bebidas
-
Productos farmacéuticos
-
Aceites y Lubricantes
-
Mercado de IBC reacondicionados en ARGENTINA por tipo de capacidad
-
Por debajo de 500 litros
-
500 a 1000 Litros
-
Más de 1000 litros
-
Mercado ARGENTINA de IBC reacondicionados por tipo de usuario final
-
Fabricación
-
Logística
-
Venta al por menor
-
Perspectivas RESTO DE AMÉRICA DEL SUR (Miles de millones de dólares, 2019-2032)
-
RESTO DE AMÉRICA DEL SUR Mercado de IBC reacondicionados por tipo de material
-
RESTO DE AMÉRICA DEL SUR Mercado IBC reacondicionado por tipo de aplicación
-
Productos químicos
-
Alimentos y bebidas
-
Productos farmacéuticos
-
Aceites y Lubricantes
-
RESTO DE AMÉRICA DEL SUR Mercado de IBC reacondicionados por tipo de capacidad
-
Por debajo de 500 litros
-
500 a 1000 Litros
-
Más de 1000 litros
-
RESTO DE AMÉRICA DEL SUR Mercado de IBC reacondicionados por tipo de usuario final
-
Fabricación
-
Logística
-
Venta al por menor
-
Perspectivas de MEA (miles de millones de dólares, 2019-2032)
-
Mercado de IBC reacondicionados de MEA por tipo de material
-
Mercado de IBC reacondicionados MEA por tipo de aplicación
-
Productos químicos
-
Alimentos y bebidas
-
Productos farmacéuticos
-
Aceites y Lubricantes
-
Mercado de IBC reacondicionados de MEA por tipo de capacidad
-
Por debajo de 500 litros
-
500 a 1000 Litros
-
Más de 1000 litros
-
Mercado de IBC reacondicionados de MEA por tipo de usuario final
-
Fabricación
-
Logística
-
Venta al por menor
-
Mercado de IBC reacondicionados de MEA por tipo regional
-
Países del CCG
-
Sudáfrica
-
Resto de MEA
-
Perspectivas de los PAÍSES del CCG (miles de millones de dólares, 2019-2032)
-
Mercado de IBC reacondicionados de los países del CCG por tipo de material
-
Mercado de IBC reacondicionado de los PAÍSES del CCG por tipo de aplicación
-
Productos químicos
-
Alimentos y bebidas
-
Productos farmacéuticos
-
Aceites y Lubricantes
-
Mercado de IBC reacondicionados de los PAÍSES del CCG por tipo de capacidad
-
Por debajo de 500 litros
-
500 a 1000 Litros
-
Más de 1000 litros
-
Mercado de IBC reacondicionados de los PAÍSES del CCG por tipo de usuario final
-
Fabricación
-
Logística
-
Venta al por menor
-
Perspectivas de SUDÁFRICA (miles de millones de dólares, 2019-2032)
-
Mercado de IBC reacondicionados en SUDÁFRICA por tipo de material
-
Mercado de IBC reacondicionados en SUDÁFRICA por tipo de aplicación
-
Productos químicos
-
Alimentos y bebidas
-
Productos farmacéuticos
-
Aceites y Lubricantes
-
Mercado de IBC reacondicionados en SUDÁFRICA por tipo de capacidad
-
Por debajo de 500 litros
-
500 a 1000 Litros
-
Más de 1000 litros
-
Mercado de IBC reacondicionados en SUDÁFRICA por tipo de usuario final
-
Fabricación
-
Logística
-
Venta al por menor
-
Perspectivas del RESTO DE MEA (miles de millones de dólares, 2019-2032)
-
RESTO DEL Mercado de IBC reacondicionados de MEA por tipo de material
-
RESTO DEL Mercado de IBC reacondicionados de MEA por tipo de aplicación
-
Productos químicos
-
Alimentos y bebidas
-
Productos farmacéuticos
-
Aceites y Lubricantes
-
RESTO DEL Mercado de IBC reacondicionados de MEA por tipo de capacidad
-
Por debajo de 500 litros
-
500 a 1000 Litros
-
Más de 1000 litros
-
RESTO DEL Mercado de IBC reacondicionados de MEA por tipo de usuario final
-
Fabricación
-
Logística
-
Venta al por menor