• Cat-intel
  • MedIntelliX
  • Resources
  • About Us
  • Request Free Sample ×

    Kindly complete the form below to receive a free sample of this Report

    Leading companies partner with us for data-driven Insights

    clients tt-cursor

    Digital TV SoC Market

    ID: MRFR/SEM/27859-HCR
    100 Pages
    Aarti Dhapte
    September 2025

    Informe de investigación de mercado de SoC para TV digital: por tipo (decodificadores, televisores inteligentes, dispositivos de transmisión y dongles), por resolución (HD, 4K, 8K), por sistema operativo (Android TV, sistema operativo Roku, sistema operativo Amazon Fire TV, LG WebOS, Samsung Tizen), por soporte de aplicaciones (servicios de streaming (Netflix, Amazon Prime Video, Disney+), aplicaciones de redes sociales (Facebook, Twitter), juegos (Apple Arcade, Google Stadia)), por conectividad (Wi-Fi, Ethernet, Bluetooth) y por región (Amé...

    Share:
    Download PDF ×

    We do not share your information with anyone. However, we may send you emails based on your report interest from time to time. You may contact us at any time to opt-out.

    Digital TV SoC Market Research Report - Forecast Till 2032 Infographic
    Purchase Options
    $ 4.950,0
    $ 5.950,0
    $ 7.250,0
    Table of Contents

    Descripción general del mercado global de SoC para TV digital

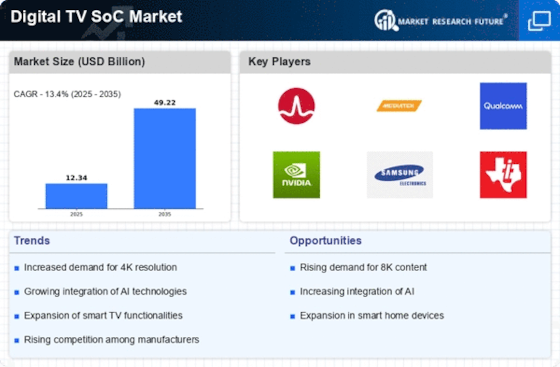
    El tamaño del mercado de SoC para TV digital se estimó en 10,87 (miles de millones de dólares) en 2023. El mercado de SoC para TV digital Se espera que la industria crezca de 12,34 (miles de millones de dólares) en 2024 a 28,8 (miles de millones de dólares) en 2032. Se espera que la CAGR (tasa de crecimiento) del mercado de SoC de TV sea de alrededor del 13,40% durante el período de pronóstico (2024-2032).

    Se destacan las principales tendencias del mercado de SoC para TV digital

    El mercado de SoC para TV digital se caracteriza por la creciente adopción de televisores inteligentes, la expansión del contenido OTT, la creciente demanda de experiencias de visualización inmersivas y los avances en las tecnologías de transmisión. Los impulsores clave del mercado incluyen la creciente popularidad de los servicios de streaming y el contenido en línea, la proliferación de dispositivos conectados y la creciente adopción de tecnologías avanzadas como la inteligencia artificial y el aprendizaje automático.

    Las oportunidades que se explorarán incluyen el desarrollo de funciones innovadoras como recomendaciones de contenido personalizadas, conectividad mejorada e integración capacidades de juego. La llegada de los juegos en la nube y la integración de plataformas de redes sociales en televisores inteligentes presentan nuevas oportunidades de crecimiento.

    Las tendencias recientes en el mercado incluyen el aumento del contenido activado por voz, la integración de la realidad aumentada y la realidad virtual. experiencias de realidad y la aparición de servicios de juegos basados ​​en la nube. Se espera que estas tendencias sigan dando forma al panorama del mercado en los próximos años.

    Descripción general del mercado global de SoC para TV digital

    Fuente: Investigación primaria, Investigación secundaria, Base de datos MRFR y Revisión del analista

    Impulsor del mercado de SoC para TV digital

    Creciente demanda de experiencias de entretenimiento inmersivas

    La creciente popularidad de los servicios de streaming, los televisores inteligentes y los sistemas de cine en casa está impulsando la demanda de televisión digital SOC. Estos dispositivos ofrecen a los consumidores una experiencia de entretenimiento más inmersiva y personalizada, con acceso a una amplia gama de contenidos bajo demanda. La creciente adopción de televisores 4K y 8K también está impulsando la demanda de SOC de TV digital, ya que estos dispositivos requieren capacidades de procesamiento más potentes para manejar resoluciones más altas. Además, se espera la creciente popularidad de la realidad virtual (VR) y realidad aumentada (AR). para impulsar aún más la demanda de SOC de TV digital, ya que estas tecnologías requieren poderosas capacidades de procesamiento para crear experiencias realistas e inmersivas.

    Avances en inteligencia artificial (IA) y aprendizaje automático (ML)

    La integración de tecnologías de IA y ML en SOC de TV digital está permitiendo funciones y aplicaciones nuevas e innovadoras. Las funciones impulsadas por IA, como el reconocimiento facial, el control por voz y las recomendaciones personalizadas, están mejorando la experiencia del usuario y haciendo que los televisores sean más interactivos y fáciles de usar. Los algoritmos ML también se utilizan para mejorar la calidad de la imagen y el sonido, así como para optimizar el consumo de energía. Se espera que la integración de IA y ML en los SOC de TV digital continúe impulsando la innovación y creando nuevas oportunidades de crecimiento en el mercado de SoC de TV digital.

    Creciente adopción de televisores inteligentes y dispositivos conectados h3&

    La creciente adopción de televisores inteligentes y dispositivos conectados está creando una necesidad creciente de SOC de TV digital. Los televisores inteligentes ofrecen a los consumidores una amplia gama de características y funcionalidades, incluido el acceso a servicios de transmisión, aplicaciones y juegos. Los dispositivos conectados, como descodificadores y dispositivos de transmisión, también se están volviendo cada vez más populares. ya que permiten a los consumidores acceder a contenidos de una variedad de fuentes. Se espera que la creciente adopción de televisores inteligentes y dispositivos conectados continúe impulsando la demanda de SOC de TV digital en el mercado de SoC de TV digital.

    Perspectivas del segmento de mercado de SoC de TV digital

    Información sobre el tipo de mercado de SoC de TV digital

    El mercado de SoC para TV digital está segmentado por tipo en decodificadores, televisores inteligentes y dispositivos de transmisión por secuencias. ; Dongles. Decodificadores Los decodificadores son dispositivos externos que se conectan a un televisor y permiten a los usuarios recibir y decodificar señales de televisión digital. Por lo general, se usan con televisores más antiguos que no tienen sintonizadores digitales incorporados. Se espera que el mercado mundial de decodificadores alcance los 15.300 millones de dólares en 2024, con un crecimiento compuesto del 4,5%. El crecimiento del mercado se atribuye a la creciente adopción de la televisión digital y la creciente demanda de contenido over-the-top (OTT). Televisores inteligentes Los televisores inteligentes son televisores que tienen conectividad a Internet incorporada y permiten a los usuarios acceder a servicios de transmisión, navegación web y otros contenidos en línea. Se espera que el mercado mundial de televisores inteligentes alcance los 202.600 millones de dólares en 2024, con un crecimiento compuesto del 10,5%. El crecimiento del mercado se atribuye a la creciente popularidad de los servicios de streaming y a la creciente demanda de pantallas de mayor tamaño. Dispositivos de transmisión Dongles Los dispositivos de transmisión y los dongles son pequeños dispositivos que se conectan al puerto HDMI de un televisor y permiten a los usuarios transmitir contenido desde Internet. Por lo general, se utilizan con televisores más nuevos que tienen sintonizadores digitales incorporados. Se espera que el mercado global de dispositivos y dongles de transmisión alcance los 12.500 millones de dólares en 2024, con un crecimiento compuesto del 15,2%. El crecimiento del mercado se atribuye a la creciente popularidad de los servicios de streaming y a la creciente demanda de dispositivos portátiles. Se espera que el mercado de SoC de TV digital alcance los 230.400 millones de dólares en 2024, con un crecimiento compuesto del 8,5%. El crecimiento del mercado se atribuye a la creciente adopción de la televisión digital, la creciente popularidad de los servicios de streaming y la creciente demanda de pantallas de mayor tamaño.

    Perspectivas sobre el tipo de mercado de SoC para TV digital

    Fuente: Investigación primaria, Investigación secundaria, Base de datos MRFR y Revisión del analista

    Perspectivas de resolución del mercado de SoC de TV digital

    Se prevé que el segmento de resolución del mercado de SoC de TV digital experimente un crecimiento significativo en los próximos años. La resolución HD domina actualmente el mercado y representa una parte importante de los ingresos. Sin embargo, la resolución 4K está ganando popularidad rápidamente, impulsada por la creciente disponibilidad de contenido 4K y la adopción de televisores 4K. El mercado de la resolución 8K aún se encuentra en sus primeras etapas, pero se espera que crezca rápidamente en el futuro a medida que los televisores 8K se vuelvan más asequibles y el contenido 8K esté más disponible.

    Información sobre sistemas operativos del mercado de SoC de TV digital

    Se espera que el segmento de sistemas operativos del mercado SoC de TV digital crezca significativamente en los próximos años. Se espera que el mercado tenga un valor de 10,23 mil millones de dólares en 2023 y alcance los 15,34 mil millones de dólares en 2027, exhibiendo una tasa compuesta anual del 8,2% durante el período previsto. El crecimiento del segmento se puede atribuir a la creciente adopción de televisores inteligentes y a la creciente popularidad de los servicios de streaming. Entre los actores clave en el segmento de sistemas operativos se encuentran Android TV, Roku OS, Amazon Fire TV OS, LG WebOS y Samsung Tizen. Android TV es el sistema operativo más popular para televisores inteligentes, con una cuota de mercado superior al 50%. Roku OS es otro sistema operativo popular, con una cuota de mercado de alrededor del 20%. Amazon Fire TV OS y LG WebOS también son sistemas operativos populares, con cuotas de mercado de alrededor del 10% y el 5%, respectivamente. Samsung Tizen es un sistema operativo más nuevo, pero rápidamente ha ganado participación de mercado y ahora es el quinto sistema operativo más popular para televisores inteligentes. El crecimiento del segmento de sistemas operativos está siendo impulsado por la creciente adopción de televisores inteligentes. Los televisores inteligentes se están volviendo cada vez más populares porque ofrecen una serie de ventajas sobre los televisores tradicionales, como la capacidad de acceder a servicios de transmisión, jugar y navegar por Internet. La creciente popularidad de los servicios de transmisión también está contribuyendo al crecimiento del segmento. ya que los servicios de transmisión requieren un televisor inteligente o un dispositivo de transmisión para poder acceder.

    Información sobre soporte de aplicaciones del mercado de SoC de TV digital

    El segmento de soporte de aplicaciones desempeña un papel crucial en el mercado de SoC de TV digital, abarcando varios subsegmentos que contribuir al crecimiento general del mercado. Los subsegmentos clave dentro del soporte de aplicaciones incluyen servicios de transmisión (Netflix, Amazon Prime Video, Disney+), aplicaciones de redes sociales (Facebook, Twitter) y juegos (Apple Arcade, Google Stadia). En 2023, el segmento de soporte de aplicaciones tenía una cuota de mercado significativa y se prevé que mantenga su dominio durante todo el período de pronóstico. La creciente popularidad de los servicios de streaming, las plataformas de redes sociales y las aplicaciones de juegos está impulsando el crecimiento de este segmento. Los datos de mercado indican que se espera que los ingresos generados por los servicios de streaming alcancen los 250 mil millones de dólares para 2024, mientras que se estima que las aplicaciones y juegos de medios sociales contribuir con $120 mil millones y $100 mil millones, respectivamente, a los ingresos del mercado de SoC de TV digital al final del período de pronóstico. Se espera que estos subsegmentos sigan experimentando un crecimiento sustancial en los próximos años, impulsado por factores como la creciente penetración de Internet, la creciente adopción de dispositivos inteligentes y avances en tecnología.

    Perspectivas de conectividad del mercado de SoC de TV digital

    El segmento de conectividad del mercado de SoC de TV digital está dominado por las tecnologías Wi-Fi, Ethernet y Bluetooth. . Wi-Fi tuvo la mayor cuota de mercado en 2023, representando más del 55% de los ingresos globales. Se espera que el mercado de Ethernet crezca a una tasa compuesta anual significativa durante el período previsto, impulsado por la creciente adopción de la conectividad a Internet de alta velocidad. También se espera que la tecnología Bluetooth experimente un crecimiento constante, debido a su amplia gama de aplicaciones en conectividad inalámbrica. Para 2024, se estima que el mercado de conectividad de SoC de TV digital alcanzará un valor de 189 200 millones de dólares, expandiéndose a una tasa compuesta anual del 4,9 % entre 2023 y 2032.

    Perspectivas regionales del mercado de SoC de TV digital

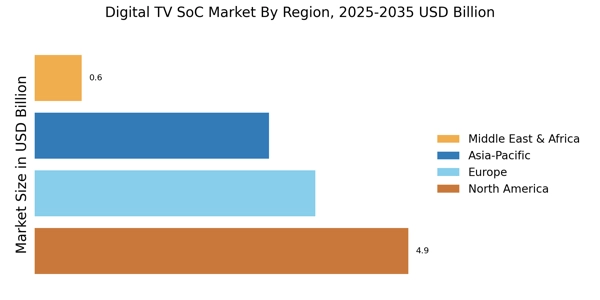
    El mercado de SoC para TV digital está segmentado en Norteamérica, Europa, APAC, Sudamérica y MEA. América del Norte tuvo la mayor cuota de mercado en 2023 y se espera que mantenga su dominio durante todo el período previsto. El crecimiento del mercado SoC de TV digital en esta región se puede atribuir a la fuerte presencia de actores importantes como Roku, Amazon y Google. Europa es el segundo mercado más grande para SoC de TV digital y se espera que crezca a un ritmo constante en los próximos años. El crecimiento del mercado en esta región se puede atribuir a la creciente adopción de servicios de transmisión como Netflix y Amazon Prime Video. Se espera que la región APAC sea testigo de la mayor tasa de crecimiento en el mercado SoC de TV digital durante el período de pronóstico. El crecimiento del mercado en esta región se puede atribuir al aumento de los ingresos disponibles y a la creciente popularidad del entretenimiento en línea. Se espera que América del Sur y MEA crezcan a un ritmo moderado en los próximos años. El crecimiento del mercado en estas regiones se puede atribuir a la creciente penetración de los teléfonos inteligentes y a la creciente popularidad del entretenimiento en línea.

    Perspectivas regionales del mercado SoC de TV digital

    Fuente: Investigación primaria, Investigación secundaria, Base de datos MRFR y Revisión del analista

    SoC de TV digital Actores clave del mercado e información competitiva:

    Los principales actores del mercado de SoC para TV digital se están centrando en el desarrollo de nuevos productos y tecnologías para satisfacer la creciente demanda de servicios de televisión digital. Los principales actores del mercado SoC de TV digital también están invirtiendo fuertemente en campañas de marketing y publicidad para promocionar sus productos y servicios. Se espera que el mercado de SoC de TV digital experimente un crecimiento significativo en los próximos años, impulsado por la creciente popularidad de los servicios de transmisión de medios y la creciente adopción de televisores inteligentes. Uno de los principales actores en el mercado de SoC de TV digital es Roku. Roku es un reproductor multimedia de transmisión que permite a los usuarios acceder a una amplia variedad de contenido de transmisión de una variedad de proveedores, incluidos Netflix, Hulu, Amazon Prime Video y Disney+. Roku tiene una fuerte participación de mercado en los Estados Unidos y también está ganando popularidad en otras regiones. Otro actor importante en el mercado de SoC de TV digital es Amazon. Amazon ofrece una variedad de dispositivos de transmisión de medios, incluidos Fire TV Stick y Fire TV Cube. Amazon también ofrece una amplia variedad de contenidos en streaming a través de su servicio Prime Video. Amazon tiene una fuerte cuota de mercado tanto en Estados Unidos como en Europa.

    Las empresas clave en el mercado de SoC para TV digital incluyen:

    • Grupo Changhong
    • Tecnología TCL
    • Konka
    • Grupo Haier
    • Westinghouse Digital
    • LG Electronics
    • Seiki Digital
    • Grupo Hisense
    • Panasonic Corporation
    • Sharp Corporation
    • Sony Corporation
    • Toshiba Corporation
    • Vizio
    • Grupo Skyworth
    • Samsung Electronics

    Desarrollos en la industria de SoC de TV digital

    Se prevé que el mercado de SoC para TV digital alcance los 273.400 millones de dólares en 2032, con una tasa compuesta anual del 4,88 %. durante el período de pronóstico. La creciente demanda de experiencias de visualización avanzadas e inmersivas, junto con la creciente popularidad de los servicios de streaming, está impulsando el crecimiento del mercado. Las noticias recientes incluyen el lanzamiento de nuevos productos y servicios por parte de actores clave. Por ejemplo, en 2023, Samsung presentó su última gama de televisores Neo QLED con calidad de imagen mejorada y sonido impulsado por IA. Además, la adopción de tecnologías avanzadas como la resolución 8K y el alto rango dinámico (HDR) está creando nuevas oportunidades de crecimiento. Las iniciativas gubernamentales para promover la infraestructura digital y la expansión de la conectividad de banda ancha en los mercados emergentes están contribuyendo aún más a la expansión del mercado. La creciente penetración de televisores inteligentes y la creciente adopción de plataformas over-the-top (OTT) también son motores clave de crecimiento.

    Perspectivas de segmentación del mercado de SoC de TV digital

    Perspectivas del tipo de mercado de SoC de TV digital

    • Descodificadores
    • Televisores inteligentes
    • Streaming Sticks Dongles  

    Perspectivas de resolución del mercado de SoC de TV digital

    • HD
    • 4K
    • 8K

    Perspectivas del sistema operativo del mercado de SoC de TV digital

    • Android TV
    • sistema operativo Roku
    • SO Amazon Fire TV
    • LG WebOS
    • Samsung Tizen

    Perspectivas de soporte de aplicaciones del mercado de SoC de TV digital

    • Servicios de streaming (Netflix, Amazon Prime Video, Disney+)
    • Aplicaciones de redes sociales (Facebook, Twitter)
    • Juegos (Apple Arcade, Google Stadia)

    Perspectivas de conectividad del mercado de SoC de TV digital

    • Wi-Fi
    • Ethernet
    • Bluetooth

    Perspectiva regional del mercado de SoC de TV digital

    • América del Norte
    • Europa
    • Sudamérica
    • Asia Pacífico
    • Medio Oriente y África
    ÍNDICE

    1. RESUMEN EJECUTIVO
    1.1. Descripción general del mercado
    1.2. Hallazgos clave
    1.3. Segmentación del mercado
    1.4. Panorama Competitivo
    1.5. Retos y Oportunidades
    1.6. Perspectivas futuras
    2. INTRODUCCIÓN AL MERCADO
    2.1. Definición
    2.2. Alcance del estudio
    2.2.1. Objetivo de la investigación
    2.2.2. Supuesto
    2.2.3. Limitaciones
    3. METODOLOGÍA DE LA INVESTIGACIÓN
    3.1. Descripción general
    3.2. Minería de datos
    3.3. Investigación Secundaria
    3.4. Investigación Primaria
    3.4.1. Entrevistas primarias y proceso de recopilación de información
    3.4.2. Desglose de los encuestados principales
    3.5. Modelo de previsión
    3.6. Estimación del tamaño del mercado
    3.6.1. Enfoque ascendente
    3.6.2. Enfoque de arriba hacia abajo
    3.7. Triangulación de datos
    3.8. Validación
    4. DINÁMICA DEL MERCADO
    4.1. Descripción general
    4.2. Conductores
    4.3. Restricciones
    4.4. Oportunidades
    5. ANÁLISIS DE FACTORES DE MERCADO
    5.1. Análisis de la cadena de valor
    5.2. Análisis de las cinco fuerzas de Porter
    5.2.1. Poder de negociación de los proveedores
    5.2.2. Poder de negociación de los compradores
    5.2.3. Amenaza de nuevos participantes
    5.2.4. Amenaza de sustitutos
    5.2.5. Intensidad de la rivalidad
    5.3. Análisis de impacto de COVID-19
    5.3.1. Análisis de Impacto en el Mercado
    5.3.2. Impacto Regional
    5.3.3. Análisis de oportunidades y amenazas
    6. MERCADO DE SOC DE TV DIGITAL, POR TIPO (MILLONES DE USD)
    6.1. Decodificadores
    6.2. Televisores inteligentes
    6.3. Dispositivos de transmisión y amplificadores Llaves
    7. MERCADO DE SOC DE TV DIGITAL, POR RESOLUCIÓN (MILLONES DE USD)
    7.1. HD
    7.2. 4K
    7.3. 8K
    8. MERCADO DE TV SOC DIGITAL, POR SISTEMA OPERATIVO (MILLONES DE USD)
    8.1. Android TV
    8.2. Sistema operativo Roku
    8.3. Sistema operativo Amazon Fire TV
    8.4. LG WebOS
    8.5. Samsung Tizen
    9. MERCADO DE SOC DE TV DIGITAL, POR APLICACIÓN SOPORTADA (MILLONES DE USD)
    9.1. Servicios de streaming (Netflix, Amazon Prime Video, Disney+)
    9.2. Aplicaciones de redes sociales (Facebook, Twitter)
    9.3. Juegos (Apple Arcade, Google Stadia)
    10. MERCADO DE TV SOC DIGITAL, POR CONECTIVIDAD (MILLONES DE USD)
    10.1. Wifi
    10.2. Ethernet
    10.3. Bluetooth
    11. MERCADO DE SOC DE TV DIGITAL, POR REGIONAL (MILLONES DE USD)
    11.1. América del Norte
    11.1.1. Estados Unidos
    11.1.2. Canadá
    11.2. Europa
    11.2.1. Alemania
    11.2.2. Reino Unido
    11.2.3. Francia
    11.2.4. Rusia
    11.2.5. Italia
    11.2.6. España
    11.2.7. Resto de Europa
    11.3. Asia Pacífico
    11.3.1. China
    11.3.2. India
    11.3.3. Japón
    11.3.4. Corea del Sur
    11.3.5. Malasia
    11.3.6. Tailandia
    11.3.7. Indonesia
    11.3.8. Resto de APAC
    11.4. América del Sur
    11.4.1. Brasil
    11.4.2. México
    11.4.3. Argentina
    11.4.4. Resto de Sudamérica
    11.5. AMUMA
    11.5.1. Países del CCG
    11.5.2. Sudáfrica
    11.5.3. Resto de MEA
    12. PANORAMA COMPETITIVO
    12.1. Descripción general
    12.2. Análisis competitivo
    12.3. Análisis de cuota de mercado
    12.4. Importante estrategia de crecimiento en el mercado Digital Tv Soc
    12.5. Benchmarking Competitivo
    12.6. Principales actores en términos de número de desarrollos en el mercado de Soc de TV digital
    12.7. Desarrollos clave y estrategias de crecimiento
    12.7.1. Lanzamiento de nuevos productos/implementación de servicios
    12.7.2. Fusión y Adquisiciones
    12.7.3. Empresas conjuntas
    12.8. Matriz financiera de los principales actores
    12.8.1. Ventas e ingresos operativos
    12.8.2. Gasto en I+D de los principales actores. 2023
    13. PERFILES DE LA EMPRESA
    13.1. Grupo Changhong
    13.1.1. Panorama financiero
    13.1.2. Productos Ofrecidos
    13.1.3. Desarrollos clave
    13.1.4. Análisis FODA
    13.1.5. Estrategias clave
    13.2. Tecnología TCL
    13.2.1. Panorama financiero
    13.2.2. Productos Ofrecidos
    13.2.3. Desarrollos clave
    13.2.4. Análisis FODA
    13.2.5. Estrategias clave
    13.3. Konka
    13.3.1. Panorama financiero
    13.3.2. Productos Ofrecidos
    13.3.3. Desarrollos clave
    13.3.4. Análisis FODA
    13.3.5. Estrategias clave
    13.4. Grupo Haier
    13.4.1. Panorama financiero
    13.4.2. Productos Ofrecidos
    13.4.3. Desarrollos clave
    13.4.4. Análisis FODA
    13.4.5. Estrategias clave
    13.5. Westinghouse Digital
    13.5.1. Panorama financiero
    13.5.2. Productos ofrecidos
    13.5.3. Desarrollos clave
    13.5.4. Análisis FODA
    13.5.5. Estrategias clave
    13.6. Electrónica LG
    13.6.1. Panorama financiero
    13.6.2. Productos ofrecidos
    13.6.3. Desarrollos clave
    13.6.4. Análisis FODA
    13.6.5. Estrategias clave
    13.7. Seiki Digital
    13.7.1. Panorama financiero
    13.7.2. Productos ofrecidos
    13.7.3. Desarrollos clave
    13.7.4. Análisis FODA
    13.7.5. Estrategias clave
    13.8. Grupo Hisense
    13.8.1. Panorama financiero
    13.8.2. Productos ofrecidos
    13.8.3. Desarrollos clave
    13.8.4. Análisis FODA
    13.8.5. Estrategias clave
    13.9. Corporación Panasonic
    13.9.1. Panorama financiero
    13.9.2. Productos ofrecidos
    13.9.3. Desarrollos clave
    13.9.4. Análisis FODA
    13.9.5. Estrategias clave
    13.10. Corporación Sharp
    13.10.1. Panorama financiero
    13.10.2. Productos Ofrecidos
    13.10.3. Desarrollos clave
    13.10.4. Análisis FODA
    13.10.5. Estrategias clave
    13.11. Corporación Sony
    13.11.1. Panorama financiero
    13.11.2. Productos Ofrecidos
    13.11.3. Desarrollos clave
    13.11.4. Análisis FODA
    13.11.5. Estrategias clave
    13.12. Corporación Toshiba
    13.12.1. Panorama financiero
    13.12.2. Productos Ofrecidos
    13.12.3. Desarrollos clave
    13.12.4. Análisis FODA
    13.12.5. Estrategias clave
    13.13. Vizio
    13.13.1. Panorama financiero
    13.13.2. Productos Ofrecidos
    13.13.3. Desarrollos clave
    13.13.4. Análisis FODA
    13.13.5. Estrategias clave
    13.14. Grupo Skyworth
    13.14.1. Panorama financiero
    13.14.2. Productos Ofrecidos
    13.14.3. Desarrollos clave
    13.14.4. Análisis FODA
    13.14.5. Estrategias clave
    13.15. Electrónica Samsung
    13.15.1. Panorama financiero
    13.15.2. Productos Ofrecidos
    13.15.3. Desarrollos clave
    13.15.4. Análisis FODA
    13.15.5. Estrategias clave
    14. APÉNDICE
    14.1. Referencias
    14.2. Informes relacionados

    LISTA DE TABLAS

    TABLA 1. LISTA DE SUPUESTOS
    TABLA 2. ESTIMACIONES Y ESTIMACIONES DEL TAMAÑO DEL MERCADO SOC DE TV DIGITAL DE AMÉRICA DEL NORTE. PRONÓSTICO, POR TIPO, 2019-2032 (MILES DE MILLONES DE USD)
    TABLA 3. ESTIMACIONES Y EMPRESAS DEL TAMAÑO DEL MERCADO SOC DE TV DIGITAL DE AMÉRICA DEL NORTE. PRONÓSTICO, POR RESOLUCIÓN, 2019-2032 (MILES DE MILLONES DE USD)
    TABLA 4. ESTIMACIONES Y PRÁCTICAS DEL TAMAÑO DEL MERCADO SOC DE TV DIGITAL DE AMÉRICA DEL NORTE. PRONÓSTICO, POR SISTEMA OPERATIVO, 2019-2032 (MILES DE MILLONES DE USD)
    TABLA 5. ESTIMACIONES Y PRÁCTICAS DEL TAMAÑO DEL MERCADO SOC DE TV DIGITAL DE AMÉRICA DEL NORTE. PRONÓSTICO, POR SOPORTE DE APLICACIONES, 2019-2032 (MILES DE MILLONES DE USD)
    TABLA 6. ESTIMACIONES Y POTENCIAS DEL TAMAÑO DEL MERCADO SOC DE TV DIGITAL DE AMÉRICA DEL NORTE. PRONÓSTICO, POR CONECTIVIDAD, 2019-2032 (MILES DE MILLONES DE USD)
    TABLA 7. ESTIMACIONES Y POTENCIAS DEL TAMAÑO DEL MERCADO SOC DE TV DIGITAL DE AMÉRICA DEL NORTE. PRONÓSTICO, POR REGIONAL, 2019-2032 (MILES DE MILLONES DE USD)
    TABLA 8. ESTIMACIONES Y PRÁCTICAS DEL TAMAÑO DEL MERCADO SOC DE TV DIGITAL DE EE. UU. PRONÓSTICO, POR TIPO, 2019-2032 (MILES DE MILLONES DE USD)
    TABLA 9. ESTIMACIONES Y EMPRESAS DEL TAMAÑO DEL MERCADO SOC DE TV DIGITAL DE EE. UU. PRONÓSTICO, POR RESOLUCIÓN, 2019-2032 (MILES DE MILLONES DE USD)
    TABLA 10. ESTIMACIONES Y PRÁCTICAS DEL TAMAÑO DEL MERCADO SOC DE TV DIGITAL DE EE. UU. PRONÓSTICO, POR SISTEMA OPERATIVO, 2019-2032 (MILES DE MILLONES DE USD)
    TABLA 11. ESTIMACIONES Y PRÁCTICAS DEL TAMAÑO DEL MERCADO SOC DE TV DIGITAL DE EE. UU. PRONÓSTICO, POR SOPORTE DE APLICACIONES, 2019-2032 (MILES DE MILLONES DE USD)
    TABLA 12. ESTIMACIONES Y PRÁCTICAS DEL TAMAÑO DEL MERCADO SOC DE TV DIGITAL DE EE. UU. PRONÓSTICO, POR CONECTIVIDAD, 2019-2032 (MILES DE MILLONES DE USD)
    TABLA 13. ESTIMACIONES Y PRÁCTICAS DEL TAMAÑO DEL MERCADO SOC DE TV DIGITAL DE EE. UU. PRONÓSTICO, POR REGIONAL, 2019-2032 (MILES DE MILLONES DE USD)
    TABLA 14. ESTIMACIONES Y PRÁCTICAS DEL TAMAÑO DEL MERCADO SOC DE TV DIGITAL DE CANADÁ PRONÓSTICO, POR TIPO, 2019-2032 (MILES DE MILLONES DE USD)
    TABLA 15. ESTIMACIONES Y PRÁCTICAS DEL TAMAÑO DEL MERCADO SOC DE TV DIGITAL DE CANADÁ PRONÓSTICO, POR RESOLUCIÓN, 2019-2032 (MILES DE MILLONES DE USD)
    TABLA 16. ESTIMACIONES Y PRÁCTICAS DEL TAMAÑO DEL MERCADO SOC DE TV DIGITAL DE CANADÁ PRONÓSTICO, POR SISTEMA OPERATIVO, 2019-2032 (MILES DE MILLONES DE USD)
    TABLA 17. ESTIMACIONES Y PRÁCTICAS DEL TAMAÑO DEL MERCADO SOC DE TV DIGITAL DE CANADÁ. PRONÓSTICO, POR SOPORTE DE APLICACIONES, 2019-2032 (MILES DE MILLONES DE USD)
    TABLA 18. ESTIMACIONES Y PRÁCTICAS DEL TAMAÑO DEL MERCADO SOC DE TV DIGITAL DE CANADÁ. PRONÓSTICO, POR CONECTIVIDAD, 2019-2032 (MILES DE MILLONES DE USD)
    TABLA 19. ESTIMACIONES Y PRÁCTICAS DEL TAMAÑO DEL MERCADO SOC DE TV DIGITAL DE CANADÁ PRONÓSTICO, POR REGIONAL, 2019-2032 (MILES DE MILLONES DE USD)
    TABLA 20. ESTIMACIONES Y EMPRESAS DEL TAMAÑO DEL MERCADO SOC DE TV DIGITAL EN EUROPA. PRONÓSTICO, POR TIPO, 2019-2032 (MILES DE MILLONES DE USD)
    TABLA 21. ESTIMACIONES DEL TAMAÑO DEL MERCADO SOC DE TV DIGITAL EN EUROPA Y EMPRESAS. PRONÓSTICO, POR RESOLUCIÓN, 2019-2032 (MILES DE MILLONES DE USD)
    TABLA 22. ESTIMACIONES Y EMPRESAS DEL TAMAÑO DEL MERCADO SOC DE TV DIGITAL EN EUROPA. PRONÓSTICO, POR SISTEMA OPERATIVO, 2019-2032 (MILES DE MILLONES DE USD)
    TABLA 23. ESTIMACIONES Y PRÁCTICAS DEL TAMAÑO DEL MERCADO SOC DE TV DIGITAL EN EUROPA. PRONÓSTICO, POR SOPORTE DE APLICACIONES, 2019-2032 (MILES DE MILLONES DE USD)
    TABLA 24. ESTIMACIONES Y PRÁCTICAS DEL TAMAÑO DEL MERCADO SOC DE TV DIGITAL EN EUROPA. PRONÓSTICO, POR CONECTIVIDAD, 2019-2032 (MILES DE MILLONES DE USD)
    TABLA 25. ESTIMACIONES Y EMPRESAS DEL TAMAÑO DEL MERCADO SOC DE TV DIGITAL EN EUROPA. PRONÓSTICO, POR REGIONAL, 2019-2032 (MILES DE MILLONES DE USD)
    TABLA 26. ESTIMACIONES Y EMPRESAS DEL TAMAÑO DEL MERCADO SOC DE TV DIGITAL DE ALEMANIA. PRONÓSTICO, POR TIPO, 2019-2032 (MILES DE MILLONES DE USD)
    TABLA 27. ESTIMACIONES Y EMPRESAS DEL TAMAÑO DEL MERCADO SOC DE TV DIGITAL DE ALEMANIA. PRONÓSTICO, POR RESOLUCIÓN, 2019-2032 (MILES DE MILLONES DE USD)
    TABLA 28. ESTIMACIONES Y EMPRESAS DEL TAMAÑO DEL MERCADO SOC DE TV DIGITAL DE ALEMANIA. PRONÓSTICO, POR SISTEMA OPERATIVO, 2019-2032 (MILES DE MILLONES DE USD)
    TABLA 29. ESTIMACIONES Y EMPRESAS DEL TAMAÑO DEL MERCADO SOC DE TV DIGITAL DE ALEMANIA. PRONÓSTICO, POR SOPORTE DE APLICACIONES, 2019-2032 (MILES DE MILLONES DE USD)
    TABLA 30. ESTIMACIONES Y EMPRESAS DEL TAMAÑO DEL MERCADO SOC DE TV DIGITAL DE ALEMANIA. PRONÓSTICO, POR CONECTIVIDAD, 2019-2032 (MILES DE MILLONES DE USD)
    TABLA 31. ESTIMACIONES Y EMPRESAS DEL TAMAÑO DEL MERCADO SOC DE TV DIGITAL DE ALEMANIA. PRONÓSTICO, POR REGIONAL, 2019-2032 (MILES DE MILLONES DE USD)
    TABLA 32. ESTIMACIONES DEL TAMAÑO DEL MERCADO DE SOC DE TV DIGITAL DEL REINO UNIDO Y EMPRESAS. PRONÓSTICO, POR TIPO, 2019-2032 (MILES DE MILLONES DE USD)
    TABLA 33. ESTIMACIONES Y EMPRESAS DEL TAMAÑO DEL MERCADO SOC DE TV DIGITAL DEL REINO UNIDO. PRONÓSTICO, POR RESOLUCIÓN, 2019-2032 (MILES DE MILLONES DE USD)
    TABLA 34. ESTIMACIONES DEL TAMAÑO DEL MERCADO SOC DE TV DIGITAL DEL REINO UNIDO Y EMPRESAS. PRONÓSTICO, POR SISTEMA OPERATIVO, 2019-2032 (MILES DE MILLONES DE USD)
    TABLA 35. ESTIMACIONES Y PRÁCTICAS DEL TAMAÑO DEL MERCADO SOC DE TV DIGITAL DEL REINO UNIDO PRONÓSTICO, POR SOPORTE DE APLICACIONES, 2019-2032 (MILES DE MILLONES DE USD)
    TABLA 36. ESTIMACIONES Y EMPRESAS DEL TAMAÑO DEL MERCADO SOC DE TV DIGITAL DEL REINO UNIDO. PRONÓSTICO, POR CONECTIVIDAD, 2019-2032 (MILES DE MILLONES DE USD)
    TABLA 37. ESTIMACIONES DEL TAMAÑO DEL MERCADO SOC DE TV DIGITAL DEL REINO UNIDO Y EMPRESAS. PRONÓSTICO, POR REGIONAL, 2019-2032 (MILES DE MILLONES DE USD)
    TABLA 38. ESTIMACIONES Y EMPRESAS DEL TAMAÑO DEL MERCADO SOC DE TV DIGITAL DE FRANCIA. PRONÓSTICO, POR TIPO, 2019-2032 (MILES DE MILLONES DE USD)
    TABLA 39. ESTIMACIONES Y EMPRESAS DEL TAMAÑO DEL MERCADO SOC DE TV DIGITAL DE FRANCIA. PRONÓSTICO, POR RESOLUCIÓN, 2019-2032 (MILES DE MILLONES DE USD)
    TABLA 40. ESTIMACIONES Y EMPRESAS DEL TAMAÑO DEL MERCADO SOC DE TV DIGITAL DE FRANCIA. PRONÓSTICO, POR SISTEMA OPERATIVO, 2019-2032 (MILES DE MILLONES DE USD)
    TABLA 41. ESTIMACIONES Y PRÁCTICAS DEL TAMAÑO DEL MERCADO SOC DE TV DIGITAL DE FRANCIA. PRONÓSTICO, POR SOPORTE DE APLICACIONES, 2019-2032 (MILES DE MILLONES DE USD)
    TABLA 42. ESTIMACIONES Y EMPRESAS DEL TAMAÑO DEL MERCADO SOC DE TV DIGITAL DE FRANCIA. PRONÓSTICO, POR CONECTIVIDAD, 2019-2032 (MILES DE MILLONES DE USD)
    TABLA 43. ESTIMACIONES Y EMPRESAS DEL TAMAÑO DEL MERCADO SOC DE TV DIGITAL DE FRANCIA. PRONÓSTICO, POR REGIONAL, 2019-2032 (MILES DE MILLONES DE USD)
    TABLA 44. ESTIMACIONES Y EMPRESAS DEL TAMAÑO DEL MERCADO SOC DE TV DIGITAL DE RUSIA. PRONÓSTICO, POR TIPO, 2019-2032 (MILES DE MILLONES DE USD)
    TABLA 45. ESTIMACIONES Y EMPRESAS DEL TAMAÑO DEL MERCADO SOC DE TV DIGITAL DE RUSIA. PRONÓSTICO, POR RESOLUCIÓN, 2019-2032 (MILES DE MILLONES DE USD)
    TABLA 46. ESTIMACIONES Y EMPRESAS DEL TAMAÑO DEL MERCADO SOC DE TV DIGITAL DE RUSIA. PRONÓSTICO, POR SISTEMA OPERATIVO, 2019-2032 (MILES DE MILLONES DE USD)
    TABLA 47. ESTIMACIONES Y PRÁCTICAS DEL TAMAÑO DEL MERCADO SOC DE TV DIGITAL DE RUSIA. PRONÓSTICO, POR SOPORTE DE APLICACIONES, 2019-2032 (MILES DE MILLONES DE USD)
    TABLA 48. ESTIMACIONES Y PRÁCTICAS DEL TAMAÑO DEL MERCADO SOC DE TV DIGITAL DE RUSIA. PRONÓSTICO, POR CONECTIVIDAD, 2019-2032 (MILES DE MILLONES DE USD)
    TABLA 49. ESTIMACIONES Y EMPRESAS DEL TAMAÑO DEL MERCADO SOC DE TV DIGITAL DE RUSIA. PRONÓSTICO, POR REGIONAL, 2019-2032 (MILES DE MILLONES DE USD)
    TABLA 50. ESTIMACIONES Y EMPRESAS DEL TAMAÑO DEL MERCADO SOC DE TV DIGITAL DE ITALIA. PRONÓSTICO, POR TIPO, 2019-2032 (MILES DE MILLONES DE USD)
    TABLA 51. ESTIMACIONES Y EMPRESAS DEL TAMAÑO DEL MERCADO SOC DE TV DIGITAL DE ITALIA. PREVISIÓN, POR RESOLUCIÓN, 2019-2032 (MILES DE MILLONES DE USD)
    TABLA 52. ITALIAESTIMACIONES Y ESTIMACIONES DEL TAMAÑO DEL MERCADO DE SOC DE TV DIGITAL PRONÓSTICO, POR SISTEMA OPERATIVO, 2019-2032 (MILES DE MILLONES DE USD)
    TABLA 53. ESTIMACIONES Y EMPRESAS DEL TAMAÑO DEL MERCADO SOC DE TV DIGITAL DE ITALIA. PRONÓSTICO, POR SOPORTE DE APLICACIONES, 2019-2032 (MILES DE MILLONES DE USD)
    TABLA 54. ESTIMACIONES Y EMPRESAS DEL TAMAÑO DEL MERCADO SOC DE TV DIGITAL DE ITALIA. PRONÓSTICO, POR CONECTIVIDAD, 2019-2032 (MILES DE MILLONES DE USD)
    TABLA 55. ESTIMACIONES Y EMPRESAS DEL TAMAÑO DEL MERCADO SOC DE TV DIGITAL DE ITALIA. PREVISIÓN, POR REGIONAL, 2019-2032 (MILES DE MILLONES DE USD)
    TABLA 56. ESTIMACIONES Y EMPRESAS DEL TAMAÑO DEL MERCADO SOC DE TV DIGITAL EN ESPAÑA PREVISIÓN, POR TIPO, 2019-2032 (MILES DE MILLONES DE USD)
    TABLA 57. ESTIMACIONES Y EMPRESAS DEL TAMAÑO DEL MERCADO SOC DE TV DIGITAL EN ESPAÑA PREVISIÓN, POR RESOLUCIÓN, 2019-2032 (MILES DE MILLONES DE USD)
    TABLA 58. ESTIMACIONES Y EMPRESAS DEL TAMAÑO DEL MERCADO SOC DE TV DIGITAL EN ESPAÑA. PREVISIÓN, POR SISTEMA OPERATIVO, 2019-2032 (MILES DE MILLONES DE USD)
    TABLA 59. ESTIMACIONES Y EMPRESAS DEL TAMAÑO DEL MERCADO SOC DE TV DIGITAL EN ESPAÑA. PRONÓSTICO, POR SOPORTE DE APLICACIONES, 2019-2032 (MILES DE MILLONES DE USD)
    TABLA 60. ESTIMACIONES Y EMPRESAS DEL TAMAÑO DEL MERCADO SOC DE TV DIGITAL EN ESPAÑA. PREVISIÓN, POR CONECTIVIDAD, 2019-2032 (MILES DE MILLONES DE USD)
    TABLA 61. ESTIMACIONES Y EMPRESAS DEL TAMAÑO DEL MERCADO SOC DE TV DIGITAL EN ESPAÑA. PRONÓSTICO, POR REGIONAL, 2019-2032 (MILES DE MILLONES DE USD)
    TABLA 62. ESTIMACIONES Y EMPRESAS DEL TAMAÑO DEL MERCADO DE SOC DE TV DIGITAL DEL RESTO DE EUROPA. PRONÓSTICO, POR TIPO, 2019-2032 (MILES DE MILLONES DE USD)
    TABLA 63. ESTIMACIONES Y EMPRESAS DEL TAMAÑO DEL MERCADO DE SOC DE TV DIGITAL DEL RESTO DE EUROPA. PRONÓSTICO, POR RESOLUCIÓN, 2019-2032 (MILES DE MILLONES DE USD)
    TABLA 64. ESTIMACIONES Y EMPRESAS DEL TAMAÑO DEL MERCADO SOC DE TV DIGITAL DEL RESTO DE EUROPA. PRONÓSTICO, POR SISTEMA OPERATIVO, 2019-2032 (MILES DE MILLONES DE USD)
    TABLA 65. ESTIMACIONES Y EMPRESAS DEL TAMAÑO DEL MERCADO SOC DE TV DIGITAL DEL RESTO DE EUROPA. PRONÓSTICO, POR SOPORTE DE APLICACIONES, 2019-2032 (MILES DE MILLONES DE USD)
    TABLA 66. ESTIMACIONES Y EMPRESAS DEL TAMAÑO DEL MERCADO SOC DE TV DIGITAL DEL RESTO DE EUROPA. PRONÓSTICO, POR CONECTIVIDAD, 2019-2032 (MILES DE MILLONES DE USD)
    TABLA 67. ESTIMACIONES Y EMPRESAS DEL TAMAÑO DEL MERCADO SOC DE TV DIGITAL DEL RESTO DE EUROPA. PRONÓSTICO, POR REGIONAL, 2019-2032 (MILES DE MILLONES DE USD)
    TABLA 68. ESTIMACIONES Y EMPRESAS DEL TAMAÑO DEL MERCADO SOC DE TV DIGITAL DE APAC. PRONÓSTICO, POR TIPO, 2019-2032 (MILES DE MILLONES DE USD)
    TABLA 69. ESTIMACIONES Y EMPRESAS DEL TAMAÑO DEL MERCADO SOC DE TV DIGITAL DE APAC. PRONÓSTICO, POR RESOLUCIÓN, 2019-2032 (MILES DE MILLONES DE USD)
    TABLA 70. ESTIMACIONES Y EMPRESAS DEL TAMAÑO DEL MERCADO SOC DE TV DIGITAL DE APAC. PRONÓSTICO, POR SISTEMA OPERATIVO, 2019-2032 (MILES DE MILLONES DE USD)
    TABLA 71. ESTIMACIONES Y PRÁCTICAS DEL TAMAÑO DEL MERCADO SOC DE TV DIGITAL DE APAC. PRONÓSTICO, POR SOPORTE DE APLICACIONES, 2019-2032 (MILES DE MILLONES DE USD)
    TABLA 72. ESTIMACIONES Y EMPRESAS DEL TAMAÑO DEL MERCADO SOC DE TV DIGITAL DE APAC. PRONÓSTICO, POR CONECTIVIDAD, 2019-2032 (MILES DE MILLONES DE USD)
    TABLA 73. ESTIMACIONES Y EMPRESAS DEL TAMAÑO DEL MERCADO SOC DE TV DIGITAL DE APAC. PRONÓSTICO, POR REGIONAL, 2019-2032 (MILES DE MILLONES DE USD)
    TABLA 74. ESTIMACIONES Y PRÁCTICAS DEL TAMAÑO DEL MERCADO SOC DE TV DIGITAL DE CHINA. PRONÓSTICO, POR TIPO, 2019-2032 (MILES DE MILLONES DE USD)
    TABLA 75. ESTIMACIONES Y EMPRESAS DEL TAMAÑO DEL MERCADO SOC DE TV DIGITAL DE CHINA. PRONÓSTICO, POR RESOLUCIÓN, 2019-2032 (MILES DE MILLONES DE USD)
    TABLA 76. ESTIMACIONES Y EMPRESAS DEL TAMAÑO DEL MERCADO SOC DE TV DIGITAL DE CHINA. PRONÓSTICO, POR SISTEMA OPERATIVO, 2019-2032 (MILES DE MILLONES DE USD)
    TABLA 77. ESTIMACIONES Y PRÁCTICAS DEL TAMAÑO DEL MERCADO SOC DE TV DIGITAL DE CHINA. PRONÓSTICO, POR SOPORTE DE APLICACIONES, 2019-2032 (MILES DE MILLONES DE USD)
    TABLA 78. ESTIMACIONES Y EMPRESAS DEL TAMAÑO DEL MERCADO SOC DE TV DIGITAL DE CHINA. PRONÓSTICO, POR CONECTIVIDAD, 2019-2032 (MILES DE MILLONES DE USD)
    TABLA 79. ESTIMACIONES Y EMPRESAS DEL TAMAÑO DEL MERCADO SOC DE TV DIGITAL DE CHINA. PRONÓSTICO, POR REGIONAL, 2019-2032 (MILES DE MILLONES DE USD)
    TABLA 80. ESTIMACIONES Y EMPRESAS DEL TAMAÑO DEL MERCADO SOC DE TV DIGITAL DE LA INDIA. PRONÓSTICO, POR TIPO, 2019-2032 (MILES DE MILLONES DE USD)
    TABLA 81. ESTIMACIONES Y EMPRESAS DEL TAMAÑO DEL MERCADO SOC DE TV DIGITAL DE LA INDIA. PRONÓSTICO, POR RESOLUCIÓN, 2019-2032 (MILES DE MILLONES DE USD)
    TABLA 82. ESTIMACIONES Y EMPRESAS DEL TAMAÑO DEL MERCADO SOC DE TV DIGITAL DE LA INDIA. PRONÓSTICO, POR SISTEMA OPERATIVO, 2019-2032 (MILES DE MILLONES DE USD)
    TABLA 83. ESTIMACIONES Y PRÁCTICAS DEL TAMAÑO DEL MERCADO SOC DE TV DIGITAL DE LA INDIA. PRONÓSTICO, POR SOPORTE DE APLICACIONES, 2019-2032 (MILES DE MILLONES DE USD)
    TABLA 84. ESTIMACIONES Y EMPRESAS DEL TAMAÑO DEL MERCADO SOC DE TV DIGITAL DE LA INDIA. PRONÓSTICO, POR CONECTIVIDAD, 2019-2032 (MILES DE MILLONES DE USD)
    TABLA 85. ESTIMACIONES Y EMPRESAS DEL TAMAÑO DEL MERCADO SOC DE TV DIGITAL DE LA INDIA. PRONÓSTICO, POR REGIONAL, 2019-2032 (MILES DE MILLONES DE USD)
    TABLA 86. ESTIMACIONES Y EMPRESAS DEL TAMAÑO DEL MERCADO SOC DE TV DIGITAL DE JAPÓN. PRONÓSTICO, POR TIPO, 2019-2032 (MILES DE MILLONES DE USD)
    TABLA 87. ESTIMACIONES Y EMPRESAS DEL TAMAÑO DEL MERCADO SOC DE TV DIGITAL DE JAPÓN. PRONÓSTICO, POR RESOLUCIÓN, 2019-2032 (MILES DE MILLONES DE USD)
    TABLA 88. ESTIMACIONES Y EMPRESAS DEL TAMAÑO DEL MERCADO SOC DE TV DIGITAL DE JAPÓN. PRONÓSTICO, POR SISTEMA OPERATIVO, 2019-2032 (MILES DE MILLONES DE USD)
    TABLA 89. ESTIMACIONES Y EMPRESAS DEL TAMAÑO DEL MERCADO SOC DE TV DIGITAL DE JAPÓN. PRONÓSTICO, POR SOPORTE DE APLICACIONES, 2019-2032 (MILES DE MILLONES DE USD)
    TABLA 90. ESTIMACIONES Y PRÁCTICAS DEL TAMAÑO DEL MERCADO SOC DE TV DIGITAL DE JAPÓN. PRONÓSTICO, POR CONECTIVIDAD, 2019-2032 (MILES DE MILLONES DE USD)
    TABLA 91. ESTIMACIONES Y EMPRESAS DEL TAMAÑO DEL MERCADO SOC DE TV DIGITAL DE JAPÓN. PRONÓSTICO, POR REGIONAL, 2019-2032 (MILES DE MILLONES DE USD)
    TABLA 92. ESTIMACIONES Y EMPRESAS DEL TAMAÑO DEL MERCADO SOC DE TV DIGITAL DE COREA DEL SUR. PRONÓSTICO, POR TIPO, 2019-2032 (MILES DE MILLONES DE USD)
    TABLA 93. ESTIMACIONES Y EMPRESAS DEL TAMAÑO DEL MERCADO SOC DE TV DIGITAL DE COREA DEL SUR. PRONÓSTICO, POR RESOLUCIÓN, 2019-2032 (MILES DE MILLONES DE USD)
    TABLA 94. ESTIMACIONES Y EMPRESAS DEL TAMAÑO DEL MERCADO SOC DE TV DIGITAL DE COREA DEL SUR. PRONÓSTICO, POR SISTEMA OPERATIVO, 2019-2032 (MILES DE MILLONES DE USD)
    TABLA 95. ESTIMACIONES Y PRÁCTICAS DEL TAMAÑO DEL MERCADO SOC DE TV DIGITAL DE COREA DEL SUR. PRONÓSTICO, POR SOPORTE DE APLICACIONES, 2019-2032 (MILES DE MILLONES DE USD)
    TABLA 96. ESTIMACIONES Y EMPRESAS DEL TAMAÑO DEL MERCADO SOC DE TV DIGITAL DE COREA DEL SUR. PRONÓSTICO, POR CONECTIVIDAD, 2019-2032 (MILES DE MILLONES DE USD)
    TABLA 97. ESTIMACIONES Y EMPRESAS DEL TAMAÑO DEL MERCADO SOC DE TV DIGITAL DE COREA DEL SUR. PRONÓSTICO, POR REGIONAL, 2019-2032 (MILES DE MILLONES DE USD)
    TABLA 98. ESTIMACIONES Y PRONÓSTICOS DEL TAMAÑO DEL MERCADO SOC DE TV DIGITAL DE MALASIA. PRONÓSTICO, POR TIPO, 2019-2032 (MILES DE MILLONES DE USD)
    TABLA 99. ESTIMACIONES Y PRONÓSTICOS DEL TAMAÑO DEL MERCADO SOC DE TV DIGITAL DE MALASIA. PRONÓSTICO, POR RESOLUCIÓN, 2019-2032 (MILES DE MILLONES DE USD)
    TABLA 100. ESTIMACIONES Y EMPRESAS DEL TAMAÑO DEL MERCADO SOC DE TV DIGITAL DE MALASIA. PRONÓSTICO, POR SISTEMA OPERATIVO, 2019-2032 (MILES DE MILLONES DE USD)
    TABLA 101. ESTIMACIONES Y PREVISIÓN DEL TAMAÑO DEL MERCADO SOC DE TV DIGITAL DE MALASIA. PRONÓSTICO, POR SOPORTE DE APLICACIONES, 2019-2032 (MILES DE MILLONES DE USD)
    TABLA 102. ESTIMACIONES Y POTENCIAS DEL TAMAÑO DEL MERCADO SOC DE TV DIGITAL DE MALASIA. PRONÓSTICO, POR CONECTIVIDAD, 2019-2032 (MILES DE MILLONES DE USD)
    TABLA 103. ESTIMACIONES Y PROYECTOS DEL TAMAÑO DEL MERCADO SOC DE TV DIGITAL DE MALASIA. PRONÓSTICO, POR REGIONAL, 2019-2032 (MILES DE MILLONES DE USD)
    TABLA 104. ESTIMACIONES Y PRÁCTICAS DEL TAMAÑO DEL MERCADO SOC DE TV DIGITAL DE TAILANDIA PRONÓSTICO, POR TIPO, 2019-2032 (MILES DE MILLONES DE USD)
    TABLA 105. ESTIMACIONES Y EMPRESAS DEL TAMAÑO DEL MERCADO SOC DE TV DIGITAL DE TAILANDIA PRONÓSTICO, POR RESOLUCIÓN, 2019-2032 (MILES DE MILLONES DE USD)
    TABLA 106. ESTIMACIONES Y EMPRESAS DEL TAMAÑO DEL MERCADO SOC DE TV DIGITAL DE TAILANDIA PRONÓSTICO, POR SISTEMA OPERATIVO, 2019-2032 (MILES DE MILLONES DE USD)
    TABLA 107. ESTIMACIONES Y EMPRESAS DEL TAMAÑO DEL MERCADO SOC DE TV DIGITAL DE TAILANDIA PRONÓSTICO, POR SOPORTE DE APLICACIONES, 2019-2032 (MILES DE MILLONES DE USD)
    TABLA 108. ESTIMACIONES Y EMPRESAS DEL TAMAÑO DEL MERCADO SOC DE TV DIGITAL DE TAILANDIA PRONÓSTICO, POR CONECTIVIDAD, 2019-2032 (MILES DE MILLONES DE USD)
    TABLA 109. ESTIMACIONES Y EMPRESAS DEL TAMAÑO DEL MERCADO SOC DE TV DIGITAL DE TAILANDIA PRONÓSTICO, POR REGIONAL, 2019-2032 (MILES DE MILLONES DE USD)
    TABLA 110. ESTIMACIONES Y EMPRESAS DEL TAMAÑO DEL MERCADO SOC DE TV DIGITAL DE INDONESIA. PRONÓSTICO, POR TIPO, 2019-2032 (MILES DE MILLONES DE USD)
    TABLA 111. ESTIMACIONES Y PRÁCTICAS DEL TAMAÑO DEL MERCADO SOC DE TV DIGITAL DE INDONESIA. PRONÓSTICO, POR RESOLUCIÓN, 2019-2032 (MILES DE MILLONES DE USD)
    TABLA 112. ESTIMACIONES Y EMPRESAS DEL TAMAÑO DEL MERCADO SOC DE TV DIGITAL DE INDONESIA. PRONÓSTICO, POR SISTEMA OPERATIVO, 2019-2032 (MILES DE MILLONES DE USD)
    TABLA 113. ESTIMACIONES Y PREVISIÓN DEL TAMAÑO DEL MERCADO SOC DE TV DIGITAL DE INDONESIA. PRONÓSTICO, POR SOPORTE DE APLICACIONES, 2019-2032 (MILES DE MILLONES DE USD)
    TABLA 114. ESTIMACIONES Y POTENCIAS DEL TAMAÑO DEL MERCADO SOC DE TV DIGITAL DE INDONESIA. PRONÓSTICO, POR CONECTIVIDAD, 2019-2032 (MILES DE MILLONES DE USD)
    TABLA 115. ESTIMACIONES Y POTENCIAS DEL TAMAÑO DEL MERCADO SOC DE TV DIGITAL DE INDONESIA. PRONÓSTICO, POR REGIONAL, 2019-2032 (MILES DE MILLONES DE USD)
    TABLA 116. ESTIMACIONES Y PROYECTOS DEL TAMAÑO DEL MERCADO SOC DE TV DIGITAL DEL RESTO DE APAC. PRONÓSTICO, POR TIPO, 2019-2032 (MILES DE MILLONES DE USD)
    TABLA 117. ESTIMACIONES Y PROYECTOS DEL TAMAÑO DEL MERCADO SOC DE TV DIGITAL DEL RESTO DE APAC. PRONÓSTICO, POR RESOLUCIÓN, 2019-2032 (MILES DE MILLONES DE USD)
    TABLA 118. ESTIMACIONES Y PROYECTOS DEL TAMAÑO DEL MERCADO SOC DE TV DIGITAL DEL RESTO DE APAC. PRONÓSTICO, POR SISTEMA OPERATIVO, 2019-2032 (MILES DE MILLONES DE USD)
    TABLA 119. ESTIMACIONES Y PROYECTOS DEL TAMAÑO DEL MERCADO SOC DE TV DIGITAL DEL RESTO DE APAC. PRONÓSTICO, POR SOPORTE DE APLICACIONES, 2019-2032 (MILES DE MILLONES DE USD)
    TABLA 120. ESTIMACIONES Y PROYECTOS DEL TAMAÑO DEL MERCADO SOC DE TV DIGITAL DEL RESTO DE APAC. PRONÓSTICO, POR CONECTIVIDAD, 2019-2032 (MILES DE MILLONES DE USD)
    TABLA 121. ESTIMACIONES Y PROYECTOS DEL TAMAÑO DEL MERCADO SOC DE TV DIGITAL DEL RESTO DE APAC. PRONÓSTICO, POR REGIONAL, 2019-2032 (MILES DE MILLONES DE USD)
    TABLA 122. ESTIMACIONES Y EMPRESAS DEL TAMAÑO DEL MERCADO SOC DE TV DIGITAL DE AMÉRICA DEL SUR. PRONÓSTICO, POR TIPO, 2019-2032 (MILES DE MILLONES DE USD)
    TABLA 123. ESTIMACIONES Y EMPRESAS DEL TAMAÑO DEL MERCADO SOC DE TV DIGITAL DE AMÉRICA DEL SUR. PRONÓSTICO, POR RESOLUCIÓN, 2019-2032 (MILES DE MILLONES DE USD)
    TABLA 124. ESTIMACIONES Y EMPRESAS DEL TAMAÑO DEL MERCADO SOC DE TV DIGITAL DE AMÉRICA DEL SUR. PRONÓSTICO, POR SISTEMA OPERATIVO, 2019-2032 (MILES DE MILLONES DE USD)
    TABLA 125. ESTIMACIONES Y PRÁCTICAS DEL TAMAÑO DEL MERCADO SOC DE TV DIGITAL DE AMÉRICA DEL SUR. PRONÓSTICO, POR SOPORTE DE APLICACIONES, 2019-2032 (MILES DE MILLONES DE USD)
    TABLA 126. ESTIMACIONES Y PRÁCTICAS DEL TAMAÑO DEL MERCADO SOC DE TV DIGITAL DE AMÉRICA DEL SUR. PRONÓSTICO, POR CONECTIVIDAD, 2019-2032 (MILES DE MILLONES DE USD)
    TABLA 127. ESTIMACIONES Y EMPRESAS DEL TAMAÑO DEL MERCADO SOC DE TV DIGITAL DE AMÉRICA DEL SUR. PRONÓSTICO, POR REGIONAL, 2019-2032 (MILES DE MILLONES DE USD)
    TABLA 128. ESTIMACIONES Y EMPRESAS DEL TAMAÑO DEL MERCADO SOC DE TV DIGITAL DE BRASIL. PRONÓSTICO, POR TIPO, 2019-2032 (MILES DE MILLONES DE USD)
    TABLA 129. ESTIMACIONES Y EMPRESAS DEL TAMAÑO DEL MERCADO SOC DE TV DIGITAL DE BRASIL. PRONÓSTICO, POR RESOLUCIÓN, 2019-2032 (MILES DE MILLONES DE USD)
    TABLA 130. ESTIMACIONES Y EMPRESAS DEL TAMAÑO DEL MERCADO SOC DE TV DIGITAL DE BRASIL. PRONÓSTICO, POR SISTEMA OPERATIVO, 2019-2032 (MILES DE MILLONES DE USD)
    TABLA 131. ESTIMACIONES Y EMPRESAS DEL TAMAÑO DEL MERCADO SOC DE TV DIGITAL DE BRASIL. PRONÓSTICO, POR SOPORTE DE APLICACIONES, 2019-2032 (MILES DE MILLONES DE USD)
    TABLA 132. ESTIMACIONES Y EMPRESAS DEL TAMAÑO DEL MERCADO SOC DE TV DIGITAL DE BRASIL. PRONÓSTICO, POR CONECTIVIDAD, 2019-2032 (MILES DE MILLONES DE USD)
    TABLA 133. ESTIMACIONES Y EMPRESAS DEL TAMAÑO DEL MERCADO SOC DE TV DIGITAL DE BRASIL. PRONÓSTICO, POR REGIONAL, 2019-2032 (MILES DE MILLONES DE USD)
    TABLA 134. ESTIMACIONES Y EMPRESAS DEL TAMAÑO DEL MERCADO SOC DE TV DIGITAL DE MÉXICO. PRONÓSTICO, POR TIPO, 2019-2032 (MILES DE MILLONES DE USD)
    TABLA 135. ESTIMACIONES Y EMPRESAS DEL TAMAÑO DEL MERCADO SOC DE TV DIGITAL DE MÉXICO. PRONÓSTICO, POR RESOLUCIÓN, 2019-2032 (MILES DE MILLONES DE USD)
    TABLA 136. ESTIMACIONES Y EMPRESAS DEL TAMAÑO DEL MERCADO SOC DE TV DIGITAL DE MÉXICO. PRONÓSTICO, POR SISTEMA OPERATIVO, 2019-2032 (MILES DE MILLONES DE USD)
    TABLA 137. ESTIMACIONES Y PRÁCTICAS DEL TAMAÑO DEL MERCADO SOC DE TV DIGITAL DE MÉXICO. PRONÓSTICO, POR SOPORTE DE APLICACIONES, 2019-2032 (MILES DE MILLONES DE USD)
    TABLA 138. ESTIMACIONES Y EMPRESAS DEL TAMAÑO DEL MERCADO SOC DE TV DIGITAL DE MÉXICO. PRONÓSTICO, POR CONECTIVIDAD, 2019-2032 (MILES DE MILLONES DE USD)
    TABLA 139. ESTIMACIONES Y EMPRESAS DEL TAMAÑO DEL MERCADO SOC DE TV DIGITAL DE MÉXICO. PRONÓSTICO, POR REGIONAL, 2019-2032 (MILES DE MILLONES DE USD)
    TABLA 140. ESTIMACIONES Y EMPRESAS DEL TAMAÑO DEL MERCADO SOC DE TV DIGITAL DE ARGENTINA. PRONÓSTICO, POR TIPO, 2019-2032 (MILES DE MILLONES DE USD)
    TABLA 141. ESTIMACIONES Y EMPRESAS DEL TAMAÑO DEL MERCADO SOC DE TV DIGITAL DE ARGENTINA. PRONÓSTICO, POR RESOLUCIÓN, 2019-2032 (MILES DE MILLONES DE USD)
    TABLA 142. ESTIMACIONES Y EMPRESAS DEL TAMAÑO DEL MERCADO SOC DE TV DIGITAL DE ARGENTINA. PRONÓSTICO, POR SISTEMA OPERATIVO, 2019-2032 (MILES DE MILLONES DE USD)
    TABLA 143. ESTIMACIONES Y EMPRESAS DEL TAMAÑO DEL MERCADO SOC DE TV DIGITAL DE ARGENTINA. PRONÓSTICO, POR SOPORTE DE APLICACIONES, 2019-2032 (MILES DE MILLONES DE USD)
    TABLA 144. ESTIMACIONES Y EMPRESAS DEL TAMAÑO DEL MERCADO SOC DE TV DIGITAL DE ARGENTINA. PRONÓSTICO, POR CONECTIVIDAD, 2019-2032 (MILES DE MILLONES DE USD)
    TABLA 145. ESTIMACIONES Y EMPRESAS DEL TAMAÑO DEL MERCADO SOC DE TV DIGITAL DE ARGENTINA. PRONÓSTICO, POR REGIONAL, 2019-2032 (MILES DE MILLONES DE USD)
    TABLA 146. ESTIMACIONES Y EMPRESAS DEL TAMAÑO DEL MERCADO DE SOC DE TV DIGITAL DEL RESTO DE SUDAMÉRICA. PRONÓSTICO, POR TIPO, 2019-2032 (MILES DE MILLONES DE USD)
    TABLA 147. ESTIMACIONES Y EMPRESAS DEL TAMAÑO DEL MERCADO DE SOC DE TV DIGITAL DEL RESTO DE SUDAMÉRICA. PRONÓSTICO, POR RESOLUCIÓN, 2019-2032 (MILES DE MILLONES DE USD)
    TABLA 148. ESTIMACIONES Y EMPRESAS DEL TAMAÑO DEL MERCADO SOC DE TV DIGITAL DEL RESTO DE SUDAMÉRICA. PRONÓSTICO, POR SISTEMA OPERATIVO, 2019-2032 (MILES DE MILLONES DE USD)
    TABLA 149. ESTIMACIONES Y EMPRESAS DEL TAMAÑO DEL MERCADO SOC DE TV DIGITAL DEL RESTO DE SUDAMÉRICA. PRONÓSTICO, POR SOPORTE DE APLICACIONES, 2019-2032 (MILES DE MILLONES DE USD)
    TABLA 150. ESTIMACIONES Y EMPRESAS DEL TAMAÑO DEL MERCADO SOC DE TV DIGITAL DEL RESTO DE SUDAMÉRICA. PRONÓSTICO, POR CONECTIVIDAD, 2019-2032 (MILES DE MILLONES DE USD)
    TABLA 151. ESTIMACIONES Y ESTIMACIONES DEL TAMAÑO DEL MERCADO SOC DE TV DIGITAL DEL RESTO DE SUDAMÉRICA. PRONÓSTICO, POR REGIONAL, 2019-2032 (MILES DE MILLONES DE USD)
    TABLA 152. MERCADO DE SOC DE TV DIGITAL DE MEA SESTIMACIONES DE IZE & PRONÓSTICO, POR TIPO, 2019-2032 (MILES DE MILLONES DE USD)
    TABLA 153. ESTIMACIONES Y PRÁCTICAS DEL TAMAÑO DEL MERCADO DE MEA DIGITAL TV SOC. PRONÓSTICO, POR RESOLUCIÓN, 2019-2032 (MILES DE MILLONES DE USD)
    TABLA 154. ESTIMACIONES Y PRÁCTICAS DEL TAMAÑO DEL MERCADO DE MEA DIGITAL TV SOC. PRONÓSTICO, POR SISTEMA OPERATIVO, 2019-2032 (MILES DE MILLONES DE USD)
    TABLA 155. ESTIMACIONES Y PRÁCTICAS DEL TAMAÑO DEL MERCADO DE MEA DIGITAL TV SOC. PRONÓSTICO, POR SOPORTE DE APLICACIONES, 2019-2032 (MILES DE MILLONES DE USD)
    TABLA 156. ESTIMACIONES Y PRÁCTICAS DEL TAMAÑO DEL MERCADO DE MEA DIGITAL TV SOC. PRONÓSTICO, POR CONECTIVIDAD, 2019-2032 (MILES DE MILLONES DE USD)
    TABLA 157. ESTIMACIONES Y PROYECTOS DEL TAMAÑO DEL MERCADO DE MEA DIGITAL TV SOC. PRONÓSTICO, POR REGIONAL, 2019-2032 (MILES DE MILLONES DE USD)
    TABLA 158. ESTIMACIONES Y POTENCIAS DEL TAMAÑO DEL MERCADO DE SOC DE TV DIGITAL DE LOS PAÍSES DEL CCG. PRONÓSTICO, POR TIPO, 2019-2032 (MILES DE MILLONES DE USD)
    TABLA 159. ESTIMACIONES Y PRÁCTICAS DEL TAMAÑO DEL MERCADO DE SOC DE TV DIGITAL DE LOS PAÍSES DEL CCG. PRONÓSTICO, POR RESOLUCIÓN, 2019-2032 (MILES DE MILLONES DE USD)
    TABLA 160. ESTIMACIONES Y EMPRESAS DEL TAMAÑO DEL MERCADO DE SOC DE TV DIGITAL DE LOS PAÍSES DEL CCG. PRONÓSTICO, POR SISTEMA OPERATIVO, 2019-2032 (MILES DE MILLONES DE USD)
    TABLA 161. ESTIMACIONES Y POTENCIAS DEL TAMAÑO DEL MERCADO DE SOC DE TV DIGITAL DE LOS PAÍSES DEL CCG. PRONÓSTICO, POR SOPORTE DE APLICACIONES, 2019-2032 (MILES DE MILLONES DE USD)
    TABLA 162. ESTIMACIONES Y POTENCIAS DEL TAMAÑO DEL MERCADO DE SOC DE TV DIGITAL DE LOS PAÍSES DEL CCG. PRONÓSTICO, POR CONECTIVIDAD, 2019-2032 (MILES DE MILLONES DE USD)
    TABLA 163. ESTIMACIONES Y EMPRESAS DEL TAMAÑO DEL MERCADO DE SOC DE TV DIGITAL DE LOS PAÍSES DEL CCG. PRONÓSTICO, POR REGIONAL, 2019-2032 (MILES DE MILLONES DE USD)
    TABLA 164. ESTIMACIONES Y EMPRESAS DEL TAMAÑO DEL MERCADO SOC DE TV DIGITAL DE SUDÁFRICA. PRONÓSTICO, POR TIPO, 2019-2032 (MILES DE MILLONES DE USD)
    TABLA 165. ESTIMACIONES Y EMPRESAS DEL TAMAÑO DEL MERCADO SOC DE TV DIGITAL DE SUDÁFRICA. PRONÓSTICO, POR RESOLUCIÓN, 2019-2032 (MILES DE MILLONES DE USD)
    TABLA 166. ESTIMACIONES Y EMPRESAS DEL TAMAÑO DEL MERCADO SOC DE TV DIGITAL DE SUDÁFRICA. PRONÓSTICO, POR SISTEMA OPERATIVO, 2019-2032 (MILES DE MILLONES DE USD)
    TABLA 167. ESTIMACIONES Y EMPRESAS DEL TAMAÑO DEL MERCADO SOC DE TV DIGITAL DE SUDÁFRICA. PRONÓSTICO, POR SOPORTE DE APLICACIONES, 2019-2032 (MILES DE MILLONES DE USD)
    TABLA 168. ESTIMACIONES Y PRÁCTICAS DEL TAMAÑO DEL MERCADO SOC DE TV DIGITAL DE SUDÁFRICA. PRONÓSTICO, POR CONECTIVIDAD, 2019-2032 (MILES DE MILLONES DE USD)
    TABLA 169. ESTIMACIONES Y EMPRESAS DEL TAMAÑO DEL MERCADO SOC DE TV DIGITAL DE SUDÁFRICA. PRONÓSTICO, POR REGIONAL, 2019-2032 (MILES DE MILLONES DE USD)
    TABLA 170. ESTIMACIONES Y PROYECTOS DEL TAMAÑO DEL MERCADO DE SOC DE TV DIGITAL DEL RESTO DE MEA. PRONÓSTICO, POR TIPO, 2019-2032 (MILES DE MILLONES DE USD)
    TABLA 171. ESTIMACIONES Y PROYECTOS DEL TAMAÑO DEL MERCADO DEL RESTO DE MEA DIGITAL TV SOC. PRONÓSTICO, POR RESOLUCIÓN, 2019-2032 (MILES DE MILLONES DE USD)
    TABLA 172. ESTIMACIONES Y PROYECTOS DEL TAMAÑO DEL MERCADO DEL RESTO DE MEA DIGITAL TV SOC. PRONÓSTICO, POR SISTEMA OPERATIVO, 2019-2032 (MILES DE MILLONES DE USD)
    TABLA 173. ESTIMACIONES Y PROYECTOS DEL TAMAÑO DEL MERCADO DEL RESTO DE MEA DIGITAL TV SOC. PRONÓSTICO, POR SOPORTE DE APLICACIONES, 2019-2032 (MILES DE MILLONES DE USD)
    TABLA 174. ESTIMACIONES Y PROYECTOS DEL TAMAÑO DEL MERCADO DEL RESTO DE MEA DIGITAL TV SOC. PRONÓSTICO, POR CONECTIVIDAD, 2019-2032 (MILES DE MILLONES DE USD)
    TABLA 175. ESTIMACIONES Y PROYECTOS DEL TAMAÑO DEL MERCADO DEL RESTO DE MEA DIGITAL TV SOC. PRONÓSTICO, POR REGIONAL, 2019-2032 (MILES DE MILLONES DE USD)
    TABLA 176. LANZAMIENTO/DESARROLLO/APROBACIÓN DE PRODUCTOS
    TABLA 177. ADQUISICIÓN/ASOCIACIÓN

    LISTA DE CIFRAS

    FIGURA 1. SINOPSIS DEL MERCADO
    FIGURA 2. ANÁLISIS DEL MERCADO DE SOC DE TV DIGITAL DE AMÉRICA DEL NORTE
    FIGURA 3. ANÁLISIS DEL MERCADO DE SOC DE TV DIGITAL DE EE. UU. POR TIPO
    FIGURA 4. ANÁLISIS DEL MERCADO DE SOC DE TV DIGITAL DE EE. UU. POR RESOLUCIÓN
    FIGURA 5. ANÁLISIS DEL MERCADO DE SOC DE TV DIGITAL DE EE. UU. POR SISTEMA OPERATIVO
    FIGURA 6. SOC DE TV DIGITAL DE EE. UU. ANÁLISIS DE MERCADO POR SOPORTE DE APLICACIONES
    FIGURA 7. ANÁLISIS DEL MERCADO SOC DE TV DIGITAL DE EE. UU. POR CONECTIVIDAD
    FIGURA 8. ANÁLISIS DEL MERCADO SOC DE TV DIGITAL DE EE. UU. POR REGIONAL
    FIGURA 9. ANÁLISIS DEL MERCADO SOC DE TV DIGITAL DE CANADÁ POR TIPO
    FIGURA 10. MERCADO DE SOC DE TV DIGITAL DE CANADÁ ANÁLISIS POR RESOLUCIÓN
    FIGURA 11. ANÁLISIS DEL MERCADO DE SOC DE TV DIGITAL DE CANADÁ POR SISTEMA OPERATIVO
    FIGURA 12. ANÁLISIS DEL MERCADO DE SOC DE TV DIGITAL DE CANADÁ POR SOPORTE DE APLICACIÓN
    FIGURA 13. ANÁLISIS DEL MERCADO DE SOC DE TV DIGITAL DE CANADÁ POR CONECTIVIDAD
    FIGURA 14. SOC DE TV DIGITAL DE CANADÁ ANÁLISIS DE MERCADO POR REGIONAL
    FIGURA 15. ANÁLISIS DEL MERCADO DE TV SOC DIGITAL DE EUROPA
    FIGURA 16. ANÁLISIS DEL MERCADO DE SOC DE TV DIGITAL DE ALEMANIA POR TIPO
    FIGURA 17. ANÁLISIS DEL MERCADO DE SOC DE TV DIGITAL DE ALEMANIA POR RESOLUCIÓN
    GRÁFICO 18. MERCADO SOC DE TV DIGITAL DE ALEMANIA ANÁLISIS POR SISTEMA OPERATIVO
    FIGURA 19. ANÁLISIS DEL MERCADO DE TV SOC DE ALEMANIA POR SOPORTE DE APLICACIÓN
    FIGURA 20. ANÁLISIS DEL MERCADO DE SOC DE TV DIGITAL DE ALEMANIA POR CONECTIVIDAD
    FIGURA 21. ANÁLISIS DEL MERCADO DE SOC DE TV DIGITAL DE ALEMANIA POR REGIONAL
    FIGURA 22. DIGITAL DEL REINO UNIDO ANÁLISIS DEL MERCADO DE TV SOC POR TIPO
    FIGURA 23. ANÁLISIS DEL MERCADO DE TV SOC DIGITAL DEL REINO UNIDO POR RESOLUCIÓN
    FIGURA 24. ANÁLISIS DEL MERCADO DE TV SOC DIGITAL DEL REINO UNIDO POR SISTEMA OPERATIVO
    FIGURA 25. ANÁLISIS DEL MERCADO DE TV SOC DIGITAL DEL REINO UNIDO POR APLICACIÓN SOPORTE
    FIGURA 26. SOC DE TV DIGITAL DEL REINO UNIDO ANÁLISIS DEL MERCADO POR CONECTIVIDAD
    FIGURA 27. ANÁLISIS DEL MERCADO DE TV SOC DIGITAL DEL REINO UNIDO POR REGIONAL
    FIGURA 28. ANÁLISIS DEL MERCADO DE TV SOC DIGITAL DE FRANCIA POR TIPO
    FIGURA 29. ANÁLISIS DEL MERCADO DE SOC DE TV DIGITAL DE FRANCIA POR RESOLUCIÓN< br />FIGURA 30. SOC DE TV DIGITAL DE FRANCIA ANÁLISIS DE MERCADO POR SISTEMA OPERATIVO
    FIGURA 31. ANÁLISIS DEL MERCADO DE TV SOC DE FRANCIA POR SOPORTE DE APLICACIÓN
    FIGURA 32. ANÁLISIS DEL MERCADO DE SOC DE TV DIGITAL DE FRANCIA POR CONECTIVIDAD
    FIGURA 33. ANÁLISIS DEL MERCADO DE SOC DE TV DIGITAL DE FRANCIA POR REGIONAL
    GRÁFICO 34. RUSIA ANÁLISIS DEL MERCADO DE TV SOC DIGITAL POR TIPO
    FIGURA 35. ANÁLISIS DEL MERCADO DE TV SOC DIGITAL DE RUSIA POR RESOLUCIÓN
    FIGURA 36. ANÁLISIS DEL MERCADO DE TV SOC DIGITAL DE RUSIA POR SISTEMA OPERATIVO
    FIGURA 37. MERCADO DE SOC DE TV DIGITAL DE RUSIA ANÁLISIS POR SOPORTE DE APLICACIONES
    FIGURA 38. ANÁLISIS DEL MERCADO DE TV SOC DE RUSIA POR CONECTIVIDAD
    FIGURA 39. ANÁLISIS DEL MERCADO DE TV SOC DE RUSIA POR REGIONAL
    FIGURA 40. ANÁLISIS DEL MERCADO DE TV SOC DE ITALIA POR TIPO
    FIGURA 41. ANÁLISIS DEL MERCADO DE TV SOCIAL DE ITALIA POR RESOLUCIÓN
    FIGURA 42. ANÁLISIS DEL MERCADO DE TV SOC DE ITALIA POR SISTEMA OPERATIVO
    FIGURA 43. ANÁLISIS DEL MERCADO DE TV SOC DE ITALIA POR SOPORTE DE APLICACIÓN
    FIGURA 44. ANÁLISIS DEL MERCADO DE TV SOC DE ITALIA POR CONECTIVIDAD
    br />FIGURA 45. SOC DE TV DIGITAL DE ITALIA ANÁLISIS DE MERCADO POR REGIONAL
    GRÁFICO 46. ANÁLISIS DEL MERCADO DE TV SOC DE ESPAÑA POR TIPO
    GRÁFICO 47. ANÁLISIS DEL MERCADO DE TV SOC DE ESPAÑA POR RESOLUCIÓN
    GRÁFICO 48. ANÁLISIS DEL MERCADO DE SOC DE TV DIGITAL DE ESPAÑA POR SISTEMA OPERATIVO
    FIGURA 49. SOC TV DIGITAL ESPAÑA ANÁLISIS DE MERCADO POR SOPORTE DE APLICACIONES
    GRÁFICO 50. ANÁLISIS DEL MERCADO DE TV SOC DE ESPAÑA POR CONECTIVIDAD
    GRÁFICO 51. ANÁLISIS DEL MERCADO DE TV SOC DE ESPAÑA POR REGIONAL
    GRÁFICO 52. ANÁLISIS DE MERCADO DE TV SOC DE RESTO DE EUROPA POR TIPO
    FIGURA 53. RESTO DE EUROPA ANÁLISIS DEL MERCADO DE TV SOC DIGITAL POR RESOLUCIÓN
    FIGURA 54. ANÁLISIS DEL MERCADO DE TV SOC DIGITAL DEL RESTO DE EUROPA POR SISTEMA OPERATIVO
    FIGURA 55. ANÁLISIS DEL MERCADO DE SOC DE TV DIGITAL DEL RESTO DE EUROPA POR SOPORTE DE APLICACIÓN
    FIGURA 56. ANÁLISIS DEL MERCADO DE SOC DE TV DIGITAL DEL RESTO DE EUROPA POR CONECTIVIDAD
    GRÁFICO 57. ANÁLISIS DEL MERCADO DE TV SOC DIGITAL DEL RESTO DE EUROPA POR REGIONAL
    GRÁFICO 58. ANÁLISIS DEL MERCADO DE SOC DE TV DIGITAL DE APAC
    FIGURA 59. ANÁLISIS DEL MERCADO DE SOC DE TV DIGITAL DE CHINA POR TIPO
    GRÁFICO 60. ANÁLISIS DEL MERCADO SOC DE TV DIGITAL DE CHINA POR RESOLUCIÓN
    FIGURA 61. ANÁLISIS DEL MERCADO DE SOC DE TV DIGITAL DE CHINA POR SISTEMA OPERATIVO
    FIGURA 62. ANÁLISIS DEL MERCADO DE SOC DE TV DIGITAL DE CHINA POR SOPORTE DE APLICACIÓN
    FIGURA 63. ANÁLISIS DEL MERCADO DE SOC DE TV DIGITAL DE CHINA POR CONECTIVIDAD
    GRÁFICO 64. MERCADO SOC DE TV DIGITAL DE CHINA ANÁLISIS POR REGIONAL
    GRÁFICO 65. ANÁLISIS DEL MERCADO DE TV SOC DIGITAL DE LA INDIA POR TIPO
    FIGURA 66. ANÁLISIS DEL MERCADO DE SOC DE TV DIGITAL DE LA INDIA POR RESOLUCIÓN
    FIGURA 67. ANÁLISIS DEL MERCADO DE SOC DE TV DIGITAL DE LA INDIA POR SISTEMA OPERATIVO
    br />FIGURA 68. MERCADO SOC DE TV DIGITAL DE LA INDIA ANÁLISIS POR SOPORTE DE APLICACIONES
    FIGURA 69. ANÁLISIS DEL MERCADO DE TV SOC DE INDIA POR CONECTIVIDAD
    FIGURA 70. ANÁLISIS DEL MERCADO DE TV SOC DE INDIA POR REGIONAL
    FIGURA 71. ANÁLISIS DEL MERCADO DE SOC DE TV DIGITAL DE JAPÓN POR TIPO
    br />FIGURA 72. SOC DE TV DIGITAL DE JAPÓN ANÁLISIS DEL MERCADO POR RESOLUCIÓN
    FIGURA 73. ANÁLISIS DEL MERCADO SOC DE TV DIGITAL DE JAPÓN POR SISTEMA OPERATIVO
    FIGURA 74. ANÁLISIS DEL MERCADO SOC DE TV DIGITAL DE JAPÓN POR SOPORTE DE APLICACIÓN
    FIGURA 75. ANÁLISIS DEL MERCADO SOC DE TV DIGITAL DE JAPÓN POR CONECTIVIDAD
    FIGURA 76. JAPÓN ANÁLISIS DEL MERCADO DE TV SOC DIGITAL DE COREA DEL SUR POR REGIONAL
    GRÁFICO 77. ANÁLISIS DEL MERCADO DE SOC DE TV DIGITAL DE COREA DEL SUR POR TIPO
    GRÁFICO 78. ANÁLISIS DEL MERCADO DE SOC DE TV DIGITAL DE COREA DEL SUR POR RESOLUCIÓN
    GRÁFICO 79. TV DIGITAL DE COREA DEL SUR ANÁLISIS DEL MERCADO SOC POR SISTEMA OPERATIVO
    FIGURA 80. ANÁLISIS DEL MERCADO DE SOC DE TV DIGITAL DE COREA DEL SUR POR SOPORTE DE APLICACIÓN
    FIGURA 81. ANÁLISIS DEL MERCADO DE SOC DE TV DIGITAL DE COREA DEL SUR POR CONECTIVIDAD
    FIGURA 82. ANÁLISIS DEL MERCADO DE SOC DE TV DIGITAL DE COREA DEL SUR POR REGIONAL
    FIGURA 83. SOC DE TV DIGITAL DE MALASIA ANÁLISIS DE MERCADO POR TIPO
    FIGURA 84. ANÁLISIS DEL MERCADO SOC DE TV DIGITAL DE MALASIA POR RESOLUCIÓN
    FIGURA 85. ANÁLISIS DEL MERCADO SOC DE TV DIGITAL DE MALASIA POR SISTEMA OPERATIVO
    FIGURA 86. ANÁLISIS DEL MERCADO SOC DE TV DIGITAL DE MALASIA POR APLICACIÓN SOPORTE
    FIGURA 87. ANÁLISIS DEL MERCADO DE SOC DE TV DIGITAL DE MALASIA POR CONECTIVIDAD
    FIGURA 88. ANÁLISIS DEL MERCADO DE SOC DE TV DIGITAL DE MALASIA POR REGIONAL
    FIGURA 89. ANÁLISIS DEL MERCADO DE SOC DE TV DIGITAL DE TAILANDIA POR TIPO
    FIGURA 90. MERCADO DE SOC DE TV DIGITAL DE TAILANDIA ANÁLISIS POR RESOLUCIÓN
    FIGURA 91. ANÁLISIS DEL MERCADO DE SOC DE TV DIGITAL DE TAILANDIA POR SISTEMA OPERATIVO
    FIGURA 92. ANÁLISIS DEL MERCADO DE SOC DE TV DIGITAL DE TAILANDIA POR SOPORTE DE APLICACIÓN
    FIGURA 93. ANÁLISIS DEL MERCADO DE SOC DE TV DIGITAL DE TAILANDIA POR CONECTIVIDAD
    FIGURA 94. MERCADO SOC DE TV DIGITAL DE TAILANDIA ANÁLISIS POR REGIONAL
    GRÁFICO 95. ANÁLISIS DEL MERCADO DE TV SOC DE INDONESIA DIGITAL POR TIPO
    GRÁFICO 96. ANÁLISIS DEL MERCADO DE TV SOC DE INDONESIA DIGITAL POR RESOLUCIÓN
    GRÁFICO 97. ANÁLISIS DEL MERCADO DE TV SOC DE INDONESIA DIGITAL POR SISTEMA OPERATIVO
    br />FIGURA 98. INDONESIA ANÁLISIS DEL MERCADO DE SOC DE TV DIGITAL POR APLICACIÓN
    FIGURA 99. ANÁLISIS DEL MERCADO DE SOC DE TV DIGITAL DE INDONESIA POR CONECTIVIDAD
    FIGURA 100. ANÁLISIS DEL MERCADO DE SOC DE TV DIGITAL DE INDONESIA POR REGIONAL
    FIGURA 101. RESTO DE TV DIGITAL DE APAC ANÁLISIS DE MERCADO SOC POR TIPO
    FIGURA 102. ANÁLISIS DEL MERCADO DEL RESTO DE SOC DE TV DIGITAL DE APAC POR RESOLUCIÓN
    FIGURA 103. ANÁLISIS DEL MERCADO DE SOC DE TV DIGITAL DE APAC POR RESOLUCIÓN
    FIGURA 104. ANÁLISIS DEL MERCADO DE SOC DE TV DIGITAL DE APAC POR APLICACIÓN APOYO
    FIGURA 105. RESTO DE APAC ANÁLISIS DEL MERCADO DE TV SOC DIGITAL POR CONECTIVIDAD
    FIGURA 106. ANÁLISIS DEL MERCADO DE TV SOC DIGITAL DE APAC POR REGIONAL
    FIGURA 107. ANÁLISIS DEL MERCADO DE TV SOC DIGITAL DE AMÉRICA DEL SUR
    FIGURA 108. MERCADO DE TV SOC DIGITAL DE BRASIL ANÁLISIS POR TIPO
    FIGURA 109. ANÁLISIS DEL MERCADO DE TV SOC DE BRASIL POR RESOLUCIÓN
    FIGURA 110. ANÁLISIS DEL MERCADO DE TV SOC DE BRASIL POR SISTEMA OPERATIVO
    FIGURA 111. ANÁLISIS DEL MERCADO DE TV SOC DE BRASIL POR SOPORTE DE APLICACIÓN
    FIGURA 112. MERCADO SOC DE TV DIGITAL DE BRASIL ANÁLISIS POR CONECTIVIDAD
    GRÁFICO 113. ANÁLISIS DEL MERCADO DE TV SOC DIGITAL DE BRASIL POR REGIONAL
    GRÁFICO 114. ANÁLISIS DEL MERCADO DE TV SOC DIGITAL DE MÉXICO POR TIPO
    FIGURA 115. ANÁLISIS DEL MERCADO DE TV SOC DIGITAL DE MÉXICO POR RESOLUCIÓN
    GRÁFICO 116. MÉXICO ANÁLISIS DEL MERCADO DE TV SOC DIGITAL POR SISTEMA OPERATIVO
    FIGURA 117. ANÁLISIS DEL MERCADO DE TV SOC DIGITAL DE MÉXICO POR SOPORTE DE APLICACIÓN
    FIGURA 118. ANÁLISIS DEL MERCADO DE TV SOC DE TV DIGITAL DE MÉXICO POR CONECTIVIDAD
    FIGURA 119. SOC DE TV DIGITAL DE MÉXICO ANÁLISIS DE MERCADO POR REGIONAL
    FIGURA 120. ANÁLISIS DEL MERCADO DE TV SOC DE ARGENTINA POR TIPO
    FIGURA 121. ANÁLISIS DEL MERCADO DE TV SOC DE ARGENTINA POR RESOLUCIÓN
    FIGURA 122. ANÁLISIS DEL MERCADO DE TV SOC DE ARGENTINA POR SISTEMA OPERATIVO
    FIGURA 123 .SOC DE TV DIGITAL DE ARGENTINA. ANÁLISIS DE MERCADO POR SOPORTE DE APLICACIONES
    GRÁFICO 124. ANÁLISIS DEL MERCADO DE TV SOC DE ARGENTINA DIGITAL POR CONECTIVIDAD
    GRÁFICO 125. ANÁLISIS DEL MERCADO DE TV SOC DE ARGENTINA DIGITAL POR REGIONAL
    GRÁFICO 126. MERCADO DE TV SOC DE DIGITAL DE SUR AMÉRICA ANÁLISIS POR TIPO
    GRÁFICO 127. ANÁLISIS DEL MERCADO DE TV SOC DIGITAL DEL RESTO DE SUDAMÉRICA POR RESOLUCIÓN
    GRÁFICO 128. ANÁLISIS DEL MERCADO DE TV SOC DIGITAL DEL RESTO DE SUDAMÉRICA POR SISTEMA OPERATIVO
    GRÁFICO 129. RESTO DEL SURH ANÁLISIS DEL MERCADO DE TV SOC DIGITAL DE AMÉRICA POR SOPORTE DE APLICACIÓN
    FIGURA 130. ANÁLISIS DEL MERCADO DE TV SOC DIGITAL DEL RESTO DE SUDAMÉRICA POR CONECTIVIDAD
    FIGURA 131. ANÁLISIS DEL MERCADO DE SOC DE TV DIGITAL DEL RESTO DE SUDAMÉRICA POR REGIONAL
    FIGURA 132. SOC DE TV DIGITAL DE MEA ANÁLISIS DE MERCADO
    FIGURA 133. ANÁLISIS DEL MERCADO DE TV SOC DIGITAL DE LOS PAÍSES DEL CCG POR TIPO
    FIGURA 134. ANÁLISIS DEL MERCADO DE SOC DE TV DIGITAL DE LOS PAÍSES DEL CCG POR RESOLUCIÓN
    FIGURA 135. ANÁLISIS DEL MERCADO DE SOC DE TV DIGITAL DE LOS PAÍSES DEL CCG POR OPERACIÓN SISTEMA
    FIGURA 136. ANÁLISIS DEL MERCADO DE SOC DE TV DIGITAL DE LOS PAÍSES DEL CCG POR SOPORTE DE APLICACIONES
    FIGURA 137. ANÁLISIS DEL MERCADO DE SOC DE TV DIGITAL DE LOS PAÍSES DEL CCG POR CONECTIVIDAD
    FIGURA 138. ANÁLISIS DEL MERCADO DE SOC DE TV DIGITAL DE LOS PAÍSES DEL CCG POR REGIONAL
    FIGURA 139 SUDÁFRICA TV DIGITAL SOC. ANÁLISIS DE MERCADO POR TIPO
    FIGURA 140. ANÁLISIS DEL MERCADO SOC DE TV DIGITAL DE SUDÁFRICA POR RESOLUCIÓN
    FIGURA 141. ANÁLISIS DEL MERCADO SOC DE TV DIGITAL DE SUDÁFRICA POR SISTEMA OPERATIVO
    FIGURA 142. MERCADO SOC DE TV DIGITAL DE SUDÁFRICA ANÁLISIS POR SOPORTE DE APLICACIONES
    GRÁFICO 143. ANÁLISIS DEL MERCADO DE TV SOC DIGITAL DE SUDÁFRICA POR CONECTIVIDAD
    GRÁFICO 144. ANÁLISIS DEL MERCADO DE TV SOC DIGITAL DE SUDÁFRICA POR REGIONAL
    FIGURA 145. ANÁLISIS DEL MERCADO DE SOC DE TV DIGITAL DEL RESTO DE MEA POR TIPO
    FIGURA 146. RESTO DE MEA ANÁLISIS DE MERCADO DE TV SOC DIGITAL POR RESOLUCIÓN
    FIGURA 147. RESTO DE MEA ANÁLISIS DE MERCADO SOC DE TV DIGITAL POR SISTEMA OPERATIVO
    FIGURA 148. ANÁLISIS DE MERCADO RESTO DE MEA TV SOC DIGITAL POR SOPORTE DE APLICACIÓN
    FIGURA 149. RESTO DE MEA DIGITAL TV SOC ANÁLISIS DE MERCADO POR CONECTIVIDAD
    FIGURA 150. RESTO DEL MERCADO DE TV SOC DE MEA ANÁLISIS POR REGIONAL
    FIGURA 151. CRITERIOS CLAVE DE COMPRA DEL MERCADO DE TV SOC DIGITAL
    FIGURA 152. PROCESO DE INVESTIGACIÓN DE MRFR
    FIGURA 153 ANÁLISIS DRO DEL MERCADO DE TV SOC DIGITAL
    FIGURA 154. ANÁLISIS DE IMPACTO DE LOS IMPULSORES: MERCADO DE TV SOC DIGITAL
    FIGURA 155. ANÁLISIS DE IMPACTO DE LAS RESTRICCIONES: MERCADO DE TV SOC DIGITAL
    FIGURA 156. CADENA DE SUMINISTRO / VALOR: MERCADO DE TV SOC DIGITAL
    FIGURA 157 MERCADO DE SOC DE TV DIGITAL, POR TIPO. 2024 (% DE PARTICIPACIÓN)
    FIGURA 158. MERCADO DE SOC DE TV DIGITAL, POR TIPO, 2019 A 2032 (Miles de millones de USD)
    FIGURA 159. MERCADO DE SOC DE TV DIGITAL, POR RESOLUCIÓN, 2024 (% DE PARTICIPACIÓN)
    GRÁFICO 160. MERCADO DE SOC DE TV DIGITAL, POR RESOLUCIÓN, 2019 A 2032 (Miles de millones de USD)
    FIGURA 161. MERCADO DE SOC DE TV DIGITAL, POR SISTEMA OPERATIVO, 2024 (% DE PARTICIPACIÓN)
    FIGURA 162. MERCADO DE SOC DE TV DIGITAL, POR SISTEMA OPERATIVO, 2019 A 2032 (Miles de millones de USD) )
    GRÁFICO 163. MERCADO DE SOC DE TV DIGITAL, POR SOPORTE DE APLICACIONES, 2024 (% DE PARTICIPACIÓN)
    GRÁFICO 164. MERCADO DE SOC DE TV DIGITAL, POR SOPORTE DE APLICACIONES, 2019 A 2032 (Miles de millones de USD)
    FIGURA 165. MERCADO DE SOC DE TV DIGITAL, POR CONECTIVIDAD, 2024 (% DE PARTICIPACIÓN) )
    FIGURA 166. SOC DE TV DIGITAL MERCADO, POR CONECTIVIDAD, 2019 A 2032 (Miles de millones de USD)
    FIGURA 167. MERCADO DE SOC DE TV DIGITAL, POR REGIONAL, 2024 (% DE PARTICIPACIÓN)
    FIGURA 168. MERCADO DE SOC DE TV DIGITAL, POR REGIONAL, 2019 A 2032 (Miles de millones de dólares)
    FIGURA 169. Evaluación comparativa de los principales competidores

    Segmentación del mercado de Soc de TV digital

    • Mercado de Soc de TV digital por tipo (miles de millones de dólares, 2019-2032)
      • Descodificadores
      • Televisores inteligentes
      • Streaming Sticks y amplificadores Dongles
    • Mercado de Soc de TV digital por resolución (miles de millones de dólares, 2019-2032)
      • HD
      • 4K
      • 8K
    • Mercado de Soc de TV digital por sistema operativo (miles de millones de dólares, 2019-2032)
      • Android TV
      • SO Roku
      • SO Amazon Fire TV
      • LG WebOS
      • Samsung Tizen
    • Mercado de Soc de TV digital por soporte de aplicaciones (miles de millones de dólares, 2019-2032)
      • Servicios de streaming (Netflix, Amazon Prime Video, Disney+)
      • Aplicaciones de redes sociales (Facebook, Twitter)
      • Juegos (Apple Arcade, Google Stadia)
    • Mercado de Soc de TV digital por conectividad (miles de millones de dólares, 2019-2032)
      • Wifi
      • Ethernet
      • Bluetooth
    • Mercado de Soc de TV digital por región (miles de millones de dólares, 2019-2032)
      • América del Norte
      • Europa
      • América del Sur
      • Asia Pacífico
      • Medio Oriente y África

    Perspectiva regional del mercado de Soc de televisión digital (miles de millones de dólares, 2019-2032)

    • Perspectivas de América del Norte (miles de millones de dólares, 2019-2032)
      • Mercado de Soc de TV digital de América del Norte por tipo
        • Descodificadores
        • Televisores inteligentes
        • Streaming Sticks y amplificadores Dongles
      • Mercado de Soc de TV digital de América del Norte por tipo de resolución
        • HD
        • 4K
        • 8K
      • Mercado de Soc de TV digital de América del Norte por tipo de sistema operativo
        • Android TV
        • SO Roku
        • SO Amazon Fire TV
        • LG WebOS
        • Samsung Tizen
      • Mercado de Digital Tv Soc de América del Norte por tipo de soporte de aplicación
        • Servicios de streaming (Netflix, Amazon Prime Video, Disney+)
        • Aplicaciones de redes sociales (Facebook, Twitter)
        • Juegos (Apple Arcade, Google Stadia)
      • Mercado de Soc de TV digital de América del Norte por tipo de conectividad
        • Wifi
        • Ethernet
        • Bluetooth
      • Mercado de Soc de TV digital de América del Norte por tipo regional
        • EE.UU.
        • Canadá
      • Perspectivas de EE. UU. (miles de millones de dólares, 2019-2032)
      • Mercado de Soc de TV digital de EE. UU. por tipo
        • Descodificadores
        • Televisores inteligentes
        • Streaming Sticks y amplificadores Dongles
      • Mercado de Soc de TV digital de EE. UU. por tipo de resolución
        • HD
        • 4K
        • 8K
      • Mercado de Soc de TV digital de EE. UU. por tipo de sistema operativo
        • Android TV
        • SO Roku
        • SO Amazon Fire TV
        • LG WebOS
        • Samsung Tizen
      • Mercado de Soc de TV digital de EE. UU. por tipo de soporte de aplicación
        • Servicios de streaming (Netflix, Amazon Prime Video, Disney+)
        • Aplicaciones de redes sociales (Facebook, Twitter)
        • Juegos (Apple Arcade, Google Stadia)
      • Mercado de Soc de TV digital de EE. UU. por tipo de conectividad
        • Wifi
        • Ethernet
        • Bluetooth
      • Perspectivas de CANADÁ (miles de millones de dólares, 2019-2032)
      • Mercado de SOC de televisión digital de CANADÁ por tipo
        • Descodificadores
        • Televisores inteligentes
        • Streaming Sticks y amplificadores Dongles
      • Mercado de SOC de televisión digital de CANADÁ por tipo de resolución
        • HD
        • 4K
        • 8K
      • Mercado de Digital Tv Soc de CANADÁ por tipo de sistema operativo
        • Android TV
        • SO Roku
        • SO Amazon Fire TV
        • LG WebOS
        • Samsung Tizen
      • Mercado de Digital Tv Soc de CANADÁ por tipo de soporte de aplicación
        • Servicios de streaming (Netflix, Amazon Prime Video, Disney+)
        • Aplicaciones de redes sociales (Facebook, Twitter)
        • Juegos (Apple Arcade, Google Stadia)
      • Mercado de SOC de televisión digital de CANADÁ por tipo de conectividad
        • Wifi
        • Ethernet
        • Bluetooth
      • Perspectivas de Europa (miles de millones de dólares, 2019-2032)
        • Mercado europeo de Soc de televisión digital por tipo
          • Descodificadores
          • Televisores inteligentes
          • Streaming Sticks y amplificadores Dongles
        • Mercado europeo de Soc de televisión digital por tipo de resolución
          • HD
          • 4K
          • 8K
        • Mercado europeo de Soc de televisión digital por tipo de sistema operativo
          • Android TV
          • SO Roku
          • SO Amazon Fire TV
          • LG WebOS
          • Samsung Tizen
        • Mercado europeo de Digital Tv Soc por tipo de soporte de aplicación
          • Servicios de streaming (Netflix, Amazon Prime Video, Disney+)
          • Aplicaciones de redes sociales (Facebook, Twitter)
          • Juegos (Apple Arcade, Google Stadia)
        • Mercado europeo de Soc de televisión digital por tipo de conectividad
          • Wifi
          • Ethernet
          • Bluetooth
        • Mercado europeo de Soc de televisión digital por tipo regional
          • Alemania
          • Reino Unido
          • Francia
          • Rusia
          • Italia
          • España
          • Resto de Europa
        • Perspectivas de ALEMANIA (miles de millones de dólares, 2019-2032)
        • Mercado ALEMANIA Digital Tv Soc por tipo
          • Descodificadores
          • Televisores inteligentes
          • Streaming Sticks y amplificadores Dongles
        • Mercado de ALEMANIA Digital Tv Soc por tipo de resolución
          • HD
          • 4K
          • 8K
        • Mercado de ALEMANIA Digital Tv Soc por tipo de sistema operativo
          • Android TV
          • SO Roku
          • SO Amazon Fire TV
          • LG WebOS
          • Samsung Tizen
        • Mercado de ALEMANIA Digital Tv Soc por tipo de soporte de aplicación
          • Servicios de streaming (Netflix, Amazon Prime Video, Disney+)
          • Aplicaciones de redes sociales (Facebook, Twitter)
          • Juegos (Apple Arcade, Google Stadia)
        • Mercado de ALEMANIA Digital Tv Soc por tipo de conectividad
          • Wifi
          • Ethernet
          • Bluetooth
        • Perspectivas del Reino Unido (miles de millones de dólares, 2019-2032)
        • Mercado de Soc de TV digital del Reino Unido por tipo
          • Descodificadores
          • Televisores inteligentes
          • Streaming Sticks y amplificadores Dongles
        • Mercado de Soc de TV digital del Reino Unido por tipo de resolución
          • HD
          • 4K
          • 8K
        • Mercado de Soc de TV digital del Reino Unido por tipo de sistema operativo
          • Android TV
          • SO Roku
          • SO Amazon Fire TV
          • LG WebOS
          • Samsung Tizen
        • Mercado de Soc de TV digital del Reino Unido por tipo de soporte de aplicación
          • Servicios de streaming (Netflix, Amazon Prime Video, Disney+)
          • Aplicaciones de redes sociales (Facebook, Twitter)
          • Juegos (Apple Arcade, Google Stadia)
        • Mercado de Soc de TV digital del Reino Unido por tipo de conectividad
          • Wifi
          • Ethernet
          • Bluetooth
        • Perspectivas de FRANCIA (miles de millones de dólares, 2019-2032)
        • Mercado de FRANCIA Digital Tv Soc por tipo
          • Descodificadores
          • Televisores inteligentes
          • Streaming Sticks y amplificadores Dongles
        • Mercado de FRANCIA Digital Tv Soc por tipo de resolución
          • HD
          • 4K
          • 8K
        • Mercado de FRANCIA Digital Tv Soc por tipo de sistema operativo
          • Android TV
          • SO Roku
          • SO Amazon Fire TV
          • LG WebOS
          • Samsung Tizen
        • Mercado de FRANCIA Digital Tv Soc por tipo de soporte de aplicación
          • Servicios de streaming (Netflix, Amazon Prime Video, Disney+)
          • Aplicaciones de redes sociales (Facebook, Twitter)
          • Juegos (Apple Arcade, Google Stadia)
        • Mercado de FRANCIA Digital Tv Soc por tipo de conectividad
          • Wifi
          • Ethernet
          • Bluetooth
        • Perspectivas de RUSIA (miles de millones de dólares, 2019-2032)
        • Mercado de Soc de TV digital de RUSIA por tipo
          • Descodificadores
          • Televisores inteligentes
          • Streaming Sticks y amplificadores Dongles
        • Mercado de Soc de televisión digital de Rusia por tipo de resolución
          • HD
          • 4K
          • 8K
        • Mercado de Soc de TV digital de RUSIA por tipo de sistema operativo
          • Android TV
          • SO Roku
          • SO Amazon Fire TV
          • LG WebOS
          • Samsung Tizen
        • Mercado de RUSIA Digital Tv Soc por tipo de soporte de aplicación
          • Servicios de streaming (Netflix, Amazon Prime Video, Disney+)
          • Aplicaciones de redes sociales (Facebook, Twitter)
          • Juegos (Apple Arcade, Google Stadia)
        • Mercado de Soc de TV digital de RUSIA por tipo de conectividad
          • Wifi
          • Ethernet
          • Bluetooth
        • Perspectivas de ITALIA (miles de millones de dólares, 2019-2032)
        • Mercado de ITALIA Digital Tv Soc por tipo
          • Descodificadores
          • Televisores inteligentes
          • Streaming Sticks y amplificadores Dongles
        • Mercado de ITALIA Digital Tv Soc por tipo de resolución
          • HD
          • 4K
          • 8K
        • Mercado de ITALIA Digital Tv Soc por tipo de sistema operativo
          • Android TV
          • SO Roku
          • SO Amazon Fire TV
          • LG WebOS
          • Samsung Tizen
        • Mercado de ITALIA Digital Tv Soc por tipo de soporte de aplicación
          • Servicios de streaming (Netflix, Amazon Prime Video, Disney+)
          • Aplicaciones de redes sociales (Facebook, Twitter)
          • Juegos (Apple Arcade, Google Stadia)
        • Mercado de Soc de TV digital de ITALIA por tipo de conectividad
          • Wifi
          • Ethernet
          • Bluetooth
        • Perspectivas de ESPAÑA (miles de millones de dólares, 2019-2032)
        • Mercado de Soc de TV digital en ESPAÑA por tipo
          • Descodificadores
          • Televisores inteligentes
          • Streaming Sticks y amplificadores Dongles
        • Mercado de Soc de TV digital en ESPAÑA por tipo de resolución
          • HD
          • 4K
          • 8K
        • Mercado de Soc de TV digital en ESPAÑA por tipo de sistema operativo
          • Android TV
          • SO Roku
          • SO Amazon Fire TV
          • LG WebOS
          • Samsung Tizen
        • Mercado de Soc de TV digital en España por tipo de soporte de aplicación
          • Servicios de streaming (Netflix, Amazon Prime Video, Disney+)
          • Aplicaciones de redes sociales (Facebook, Twitter)
          • Juegos (Apple Arcade, Google Stadia)
        • Mercado de Soc de TV digital en España por tipo de conectividad
          • Wifi
          • Ethernet
          • Bluetooth
        • Perspectivas DEL RESTO DE EUROPA (Miles de millones de dólares, 2019-2032)
        • RESTO DE EUROPA Mercado de Soc de TV digital por tipo
          • Descodificadores
          • Televisores inteligentes
          • Streaming Sticks y amplificadores Dongles
        • RESTO DE EUROPA Mercado de Soc de TV digital por tipo de resolución
          • HD
          • 4K
          • 8K
        • Mercado del RESTO DE EUROPA Digital Tv Soc por tipo de sistema operativo
          • Android TV
          • SO Roku
          • SO Amazon Fire TV
          • LG WebOS
          • Samsung Tizen
        • Mercado del RESTO DE EUROPA Digital Tv Soc por tipo de soporte de aplicación
          • Servicios de streaming (Netflix, Amazon Prime Video, Disney+)
          • Aplicaciones de redes sociales (Facebook, Twitter)
          • Juegos (Apple Arcade, Google Stadia)
        • RESTO DE EUROPA Mercado de Soc de TV digital por tipo de conectividad
          • Wifi
          • Ethernet
          • Bluetooth
        • Perspectivas de Asia Pacífico (miles de millones de dólares, 2019-2032)
          • Mercado de Soc de TV digital de APAC por tipo
            • Descodificadores
            • Televisores inteligentes
            • Streaming Sticks y amplificadores Dongles
          • Mercado APAC Digital Tv Soc por tipo de resolución
            • HD
            • 4K
            • 8K
          • Mercado APAC Digital Tv Soc por tipo de sistema operativo
            • Android TV
            • SO Roku
            • SO Amazon Fire TV
            • LG WebOS
            • Samsung Tizen
          • Mercado APAC Digital Tv Soc por tipo de soporte de aplicación
            • Servicios de streaming (Netflix, Amazon Prime Video, Disney+)
            • Aplicaciones de redes sociales (Facebook, Twitter)
            • Juegos (Apple Arcade, Google Stadia)
          • Mercado APAC Digital Tv Soc por tipo de conectividad
            • Wifi
            • Ethernet
            • Bluetooth
          • Mercado de Soc de TV digital de APAC por tipo regional
            • China
            • India
            • Japón
            • Corea del Sur
            • Malasia
            • Tailandia
            • Indonesia
            • Resto de APAC
          • Perspectivas de CHINA (miles de millones de dólares, 2019-2032)
          • Mercado CHINA Digital Tv Soc por tipo
            • Descodificadores
            • Televisores inteligentes
            • Streaming Sticks y amplificadores Dongles
          • Mercado CHINA Digital Tv Soc por tipo de resolución
            • HD
            • 4K
            • 8K
          • Mercado CHINA Digital Tv Soc por tipo de sistema operativo
            • Android TV
            • SO Roku
            • SO Amazon Fire TV
            • LG WebOS
            • Samsung Tizen
          • Mercado CHINA Digital Tv Soc por tipo de soporte de aplicación
            • Servicios de streaming (Netflix, Amazon Prime Video, Disney+)
            • Aplicaciones de redes sociales (Facebook, Twitter)
            • Juegos (Apple Arcade, Google Stadia)
          • Mercado CHINA Digital Tv Soc por tipo de conectividad
            • Wifi
            • Ethernet
            • Bluetooth
          • Perspectivas de la INDIA (miles de millones de dólares, 2019-2032)
          • Mercado de Soc de TV digital de INDIA por tipo
            • Descodificadores
            • Televisores inteligentes
            • Streaming Sticks y amplificadores Dongles
          • Mercado de Soc de TV digital de INDIA por tipo de resolución
            • HD
            • 4K
            • 8K
          • Mercado de Soc de TV digital de INDIA por tipo de sistema operativo
            • Android TV
            • SO Roku
            • SO Amazon Fire TV
            • LG WebOS
            • Samsung Tizen
          • Mercado de Soc de TV digital de INDIA por tipo de soporte de aplicación
            • Servicios de streaming (Netflix, Amazon Prime Video, Disney+)
            • Aplicaciones de redes sociales (Facebook, Twitter)
            • Juegos (Apple Arcade, Google Stadia)
          • Mercado de Soc de TV digital de INDIA por tipo de conectividad
            • Wifi
            • Ethernet
            • Bluetooth
          • Perspectivas de JAPÓN (miles de millones de dólares, 2019-2032)
          • Mercado de Soc de televisión digital de Japón por tipo
            • Descodificadores
            • Televisores inteligentes
            • Streaming Sticks y amplificadores Dongles
          • Mercado de Soc de TV digital de Japón por tipo de resolución
            • HD
            • 4K
            • 8K
          • Mercado JAPÓN Digital Tv Soc por tipo de sistema operativo
            • Android TV
            • SO Roku
            • SO Amazon Fire TV
            • LG WebOS
            • Samsung Tizen
          • Mercado JAPÓN Digital Tv Soc por tipo de soporte de aplicación
            • Servicios de streaming (Netflix, Amazon Prime Video, Disney+)
            • Aplicaciones de redes sociales (Facebook, Twitter)
            • Juegos (Apple Arcade, Google Stadia)
          • Mercado de Soc de TV digital de Japón por tipo de conectividad
            • Wifi
            • Ethernet
            • Bluetooth
          • Perspectivas de COREA DEL SUR (miles de millones de dólares, 2019-2032)
          • Mercado de Soc de televisión digital de COREA DEL SUR por tipo
            • Descodificadores
            • Televisores inteligentes
            • Streaming Sticks y amplificadores Dongles
          • Mercado de Soc de televisión digital de COREA DEL SUR por tipo de resolución
            • HD
            • 4K
            • 8K
          • Mercado de Soc de TV digital de COREA DEL SUR por tipo de sistema operativo
            • Android TV
            • SO Roku
            • SO Amazon Fire TV
            • LG WebOS
            • Samsung Tizen
          • Mercado de Soc de TV digital de COREA DEL SUR por tipo de soporte de aplicación
            • Servicios de streaming (Netflix, Amazon Prime Video, Disney+)
            • Aplicaciones de redes sociales (Facebook, Twitter)
            • Juegos (Apple Arcade, Google Stadia)
          • Mercado de Soc de TV digital de COREA DEL SUR por tipo de conectividad
            • Wifi
            • Ethernet
            • Bluetooth
          • Perspectivas de MALASIA (miles de millones de dólares, 2019-2032)
          • Mercado de SOC de televisión digital de MALASIA por tipo
            • Descodificadores
            • Televisores inteligentes
            • Streaming Sticks y amplificadores Dongles
          • Mercado de SOC de televisión digital de MALASIA por tipo de resolución
            • HD
            • 4K
            • 8K
          • Mercado de SOC de televisión digital de MALASIA por tipo de sistema operativo
            • Android TV
            • SO Roku
            • SO Amazon Fire TV
            • LG WebOS
            • Samsung Tizen
          • Mercado de SOC de televisión digital de MALASIA por tipo de soporte de aplicación
            • Servicios de streaming (Netflix, Amazon Prime Video, Disney+)
            • Aplicaciones de redes sociales (Facebook, Twitter)
            • Juegos (Apple Arcade, Google Stadia)
          • Mercado de SOC de televisión digital de MALASIA por tipo de conectividad
            • Wifi
            • Ethernet
            • Bluetooth
          • Perspectivas de TAILANDIA (miles de millones de dólares, 2019-2032)
          • Mercado de TAILANDIA Digital Tv Soc por tipo
            • Descodificadores
            • Televisores inteligentes
            • Streaming Sticks y amplificadores Dongles
          • Mercado de TAILANDIA Digital Tv Soc por tipo de resolución
            • HD
            • 4K
            • 8K
          • Mercado de TAILANDIA Digital Tv Soc por tipo de sistema operativo
            • Android TV
            • SO Roku
            • SO Amazon Fire TV
            • LG WebOS
            • Samsung Tizen
          • Mercado de TAILANDIA Digital Tv Soc por tipo de soporte de aplicación
            • Servicios de streaming (Netflix, Amazon Prime Video, Disney+)
            • Aplicaciones de redes sociales (Facebook, Twitter)
            • Juegos (Apple Arcade, Google Stadia)
          • Mercado de TAILANDIA Digital Tv Soc por tipo de conectividad
            • Wifi
            • Ethernet
            • Bluetooth
          • Perspectivas de INDONESIA (miles de millones de dólares, 2019-2032)
          • Mercado de Soc de televisión digital de INDONESIA por tipo
            • Descodificadores
            • Televisores inteligentes
            • Streaming Sticks y amplificadores Dongles
          • Mercado de Soc de televisión digital de INDONESIA por tipo de resolución
            • HD
            • 4K
            • 8K
          • Mercado de Soc de TV digital de INDONESIA por tipo de sistema operativo
            • Android TV
            • SO Roku
            • SO Amazon Fire TV
            • LG WebOS
            • Samsung Tizen
          • Mercado de Soc de TV digital de INDONESIA por tipo de soporte de aplicación
            • Servicios de streaming (Netflix, Amazon Prime Video, Disney+)
            • Aplicaciones de redes sociales (Facebook, Twitter)
            • Juegos (Apple Arcade, Google Stadia)
          • Mercado de Soc de TV digital de INDONESIA por tipo de conectividad
            • Wifi
            • Ethernet
            • Bluetooth
          • Perspectivas del RESTO DE APAC (miles de millones de dólares, 2019-2032)
          • RESTO DEL Mercado de Soc de TV digital de APAC por tipo
            • Descodificadores
            • Televisores inteligentes
            • Streaming Sticks y amplificadores Dongles
          • RESTO DEL Mercado de Soc de TV digital de APAC por tipo de resolución
            • HD
            • 4K
            • 8K
          • RESTO DEL Mercado de Soc de TV digital de APAC por tipo de sistema operativo
            • Android TV
            • SO Roku
            • SO Amazon Fire TV
            • LG WebOS
            • Samsung Tizen
          • RESTO DEL Mercado de Soc de TV digital de APAC por tipo de soporte de aplicación
            • Servicios de streaming (Netflix, Amazon Prime Video, Disney+)
            • Aplicaciones de redes sociales (Facebook, Twitter)
            • Juegos (Apple Arcade, Google Stadia)
          • RESTO DEL Mercado de Soc de TV digital de APAC por tipo de conectividad
            • Wifi
            • Ethernet
            • Bluetooth
          • Perspectivas de América del Sur (miles de millones de dólares, 2019-2032)
            • Mercado de Soc de TV digital de América del Sur por tipo
              • Descodificadores
              • Televisores inteligentes
              • Streaming Sticks y amplificadores Dongles
            • Mercado de Soc de TV digital de América del Sur por tipo de resolución
              • HD
              • 4K
              • 8K
            • Mercado de Soc de TV digital de América del Sur por tipo de sistema operativo
              • Android TV
              • SO Roku
              • SO Amazon Fire TV
              • LG WebOS
              • Samsung Tizen
            • Mercado de Soc de TV digital de América del Sur por tipo de soporte de aplicación
              • Servicios de streaming (Netflix, Amazon Prime Video, Disney+)
              • Aplicaciones de redes sociales (Facebook, Twitter)
              • Juegos (Apple Arcade, Google Stadia)
            • Mercado de Soc de TV digital de América del Sur por tipo de conectividad
              • Wifi
              • Ethernet
              • Bluetooth
            • Mercado de Soc de TV digital de América del Sur por tipo regional
              • Brasil
              • México
              • Argentina
              • Resto de Sudamérica
            • Perspectivas de BRASIL (miles de millones de dólares, 2019-2032)
            • Mercado de Soc de TV digital de BRASIL por tipo
              • Descodificadores
              • Televisores inteligentes
              • Streaming Sticks y amplificadores Dongles
            • Mercado de Soc de TV digital de BRASIL por tipo de resolución
              • HD
              • 4K
              • 8K
            • Mercado de Soc de TV digital de BRASIL por tipo de sistema operativo
              • Android TV
              • SO Roku
              • SO Amazon Fire TV
              • LG WebOS
              • Samsung Tizen
            • Mercado de Soc de TV digital de BRASIL por tipo de soporte de aplicación
              • Servicios de streaming (Netflix, Amazon Prime Video, Disney+)
              • Aplicaciones de redes sociales (Facebook, Twitter)
              • Juegos (Apple Arcade, Google Stadia)
            • Mercado de Soc de TV digital de BRASIL por tipo de conectividad
              • Wifi
              • Ethernet
              • Bluetooth
            • Perspectivas de MÉXICO (Miles de millones de dólares, 2019-2032)
            • Mercado Digital Tv Soc de MÉXICO por tipo
              • Descodificadores
              • Televisores inteligentes
              • Streaming Sticks y amplificadores Dongles
            • Mercado Digital Tv Soc de MÉXICO por tipo de resolución
              • HD
              • 4K
              • 8K
            • Mercado Digital Tv Soc de MÉXICO por tipo de sistema operativo
              • Android TV
              • SO Roku
              • SO Amazon Fire TV
              • LG WebOS
              • Samsung Tizen
            • Mercado Digital Tv Soc de MÉXICO por tipo de soporte de aplicación
              • Servicios de streaming (Netflix, Amazon Prime Video, Disney+)
              • Aplicaciones de redes sociales (Facebook, Twitter)
              • Juegos (Apple Arcade, Google Stadia)
            • Mercado de Soc de TV Digital en MÉXICO por tipo de conectividad
              • Wifi
              • Ethernet
              • Bluetooth
            • Perspectivas de ARGENTINA (miles de millones de dólares, 2019-2032)
            • Mercado ARGENTINA Digital Tv Soc por tipo
              • Descodificadores
              • Televisores inteligentes
              • Streaming Sticks y amplificadores Dongles
            • Mercado ARGENTINA Digital Tv Soc por tipo de resolución
              • HD
              • 4K
              • 8K
            • Mercado ARGENTINA Digital Tv Soc por tipo de sistema operativo
              • Android TV
              • SO Roku
              • SO Amazon Fire TV
              • LG WebOS
              • Samsung Tizen
            • Mercado ARGENTINA Digital Tv Soc por tipo de soporte de aplicación
              • Servicios de streaming (Netflix, Amazon Prime Video, Disney+)
              • Aplicaciones de redes sociales (Facebook, Twitter)
              • Juegos (Apple Arcade, Google Stadia)
            • Mercado ARGENTINA Digital Tv Soc por tipo de conectividad
              • Wifi
              • Ethernet
              • Bluetooth
            • Perspectivas DEL RESTO DE AMÉRICA DEL SUR (Miles de millones de dólares, 2019-2032)
            • RESTO DE AMÉRICA DEL SUR Mercado de Soc de TV digital por tipo
              • Descodificadores
              • Televisores inteligentes
              • Streaming Sticks y amplificadores Dongles
            • RESTO DE AMÉRICA DEL SUR Mercado de Soc de TV digital por tipo de resolución
              • HD
              • 4K
              • 8K
            • RESTO DE AMÉRICA DEL SUR Mercado de Soc de TV digital por tipo de sistema operativo
              • Android TV
              • SO Roku
              • SO Amazon Fire TV
              • LG WebOS
              • Samsung Tizen
            • RESTO DE AMÉRICA DEL SUR Mercado de Soc de TV digital por tipo de soporte de aplicación
              • Servicios de streaming (Netflix, Amazon Prime Video, Disney+)
              • Aplicaciones de redes sociales (Facebook, Twitter)
              • Juegoes (Apple Arcade, Google Stadia)
            • RESTO DE AMÉRICA DEL SUR Mercado de Soc de TV digital por tipo de conectividad
              • Wifi
              • Ethernet
              • Bluetooth
            • Perspectivas de los MEA (miles de millones de dólares, 2019-2032)
              • Mercado MEA Digital Tv Soc por tipo
                • Descodificadores
                • Televisores inteligentes
                • Streaming Sticks y amplificadores Dongles
              • Mercado MEA Digital Tv Soc por tipo de resolución
                • HD
                • 4K
                • 8K
              • Mercado MEA Digital Tv Soc por tipo de sistema operativo
                • Android TV
                • SO Roku
                • SO Amazon Fire TV
                • LG WebOS
                • Samsung Tizen
              • Mercado MEA Digital Tv Soc por tipo de soporte de aplicación
                • Servicios de streaming (Netflix, Amazon Prime Video, Disney+)
                • Aplicaciones de redes sociales (Facebook, Twitter)
                • Juegos (Apple Arcade, Google Stadia)
              • Mercado MEA Digital Tv Soc por tipo de conectividad
                • Wifi
                • Ethernet
                • Bluetooth
              • Mercado MEA Digital Tv Soc por tipo regional
                • Países del CCG
                • Sudáfrica
                • Resto de MEA
              • Perspectivas de los PAÍSES del CCG (miles de millones de dólares, 2019-2032)
              • Países del CCG Mercado de Soc de TV digital por tipo
                • Descodificadores
                • Televisores inteligentes
                • Streaming Sticks y amplificadores Dongles
              • Países del CCG Mercado de Soc de TV digital por tipo de resolución
                • HD
                • 4K
                • 8K
              • Países del CCG Mercado de Soc de TV digital por tipo de sistema operativo
                • Android TV
                • SO Roku
                • SO Amazon Fire TV
                • LG WebOS
                • Samsung Tizen
              • Países del CCG Mercado de Soc de TV digital por tipo de soporte de aplicación
                • Servicios de streaming (Netflix, Amazon Prime Video, Disney+)
                • Aplicaciones de redes sociales (Facebook, Twitter)
                • Juegos (Apple Arcade, Google Stadia)
              • Países del CCG Mercado de Soc de TV digital por tipo de conectividad
                • Wifi
                • Ethernet
                • Bluetooth
              • Perspectivas de SUDÁFRICA (miles de millones de dólares, 2019-2032)
              • Mercado de Soc de televisión digital de SUDÁFRICA por tipo
                • Descodificadores
                • Televisores inteligentes
                • Streaming Sticks y amplificadores Dongles
              • Mercado de Soc de TV digital de SUDÁFRICA por tipo de resolución
                • HD
                • 4K
                • 8K
              • Mercado de Soc de TV digital de SUDÁFRICA por tipo de sistema operativo
                • Android TV
                • SO Roku
                • SO Amazon Fire TV
                • LG WebOS
                • Samsung Tizen
              • Mercado de Soc de TV digital de SUDÁFRICA por tipo de soporte de aplicación
                • Servicios de streaming (Netflix, Amazon Prime Video, Disney+)
                • Aplicaciones de redes sociales (Facebook, Twitter)
                • Juegos (Apple Arcade, Google Stadia)
              • Mercado de Soc de TV digital de SUDÁFRICA por tipo de conectividad
                • Wifi
                • Ethernet
                • Bluetooth
              • Perspectivas del RESTO DE MEA (miles de millones de dólares, 2019-2032)
              • RESTO DEL Mercado de Soc de TV digital de MEA por tipo
                • Descodificadores
                • Televisores inteligentes
                • Streaming Sticks y amplificadores Dongles
              • RESTO DEL Mercado MEA Digital Tv Soc por tipo de resolución
                • HD
                • 4K
                • 8K
              • RESTO DEL Mercado de Soc de TV digital de MEA por tipo de sistema operativo
                • Android TV
                • SO Roku
                • SO Amazon Fire TV
                • LG WebOS
                • Samsung Tizen
              • RESTO DEL Mercado de Soc de TV digital de MEA por tipo de soporte de aplicación
                • Servicios de streaming (Netflix, Amazon Prime Video, Disney+)
                • Aplicaciones de redes sociales (Facebook, Twitter)
                • Juegos (Apple Arcade, Google Stadia)
              • RESTO DEL Mercado de Soc de TV digital de MEA por tipo de conectividad
                • Wifi
                • Ethernet
                • Bluetooth
    Report Infographic
    Free Sample Request

    Kindly complete the form below to receive a free sample of this Report

    Customer Strories

    “I am very pleased with how market segments have been defined in a relevant way for my purposes (such as "Portable Freezers & refrigerators" and "last-mile"). In general the report is well structured. Thanks very much for your efforts.”

    Victoria Milne Founder
    Case Study

    Chemicals and Materials