• Cat-intel
  • MedIntelliX
  • Resources
  • About Us
  • English
    Chinese
    French
    Japanese
    Korean
    German
    Spanish

    Powersports Apparel Market Trends

    ID: MRFR/CR/10899-CR
    250 Pages
    Varsha More
    October 2023

    Powersports Apparel Market Research Report Information by Type (Activewear, and Wearables), Vehicle (Motorcycle, Off-Road Vehicles, Snowmobiles, and Boating), Application (Professional, and Recreational), End-User (Male, and Female), Distribution Channel (Brick and Mortar, Ecommerce Marketplaces, and Company Website), And By Region (North America, Europe, Asia Pacific, and Rest of the World) - ...

    Share:
    Download PDF ×

    We do not share your information with anyone. However, we may send you emails based on your report interest from time to time. You may contact us at any time to opt-out.

    Powersports Apparel Market Research Report—Global Forecast till 2032 Infographic
    $ 4,950.0
    $ 5,950.0
    $ 7,250.0

    Market Trends

    Key Emerging Trends in the Powersports Apparel Market

    More and more people are choosing to rent recreational vehicles when they go on countryside trips, camping, or travel long distances for events like concerts and festivals. The global economy growing well has played a big part in this trend over the last five years. When the economy is doing well, people are more likely to rent these vehicles. People are also becoming more aware that they can rent recreational vehicles, and this has made the demand for rental services go up. The internet has made it easier for people to book and rent recreational vehicles. You can now go online and find a good RV that's in good condition and has the features you want, all at a reasonable cost. You can also compare prices from different rental services in the same area. Big companies that rent out recreational vehicles are putting a lot of money into making their services better. They're building more networks with dealers and trying to reach more customers. In the United States, these developments are expected to make more people want to rent recreational vehicles. This trend is likely to spread to other parts of the world too. Right now, the focus is mainly on North America, but it's expected to grow in Europe and Asia-Pacific in the future. This is because more RV rental groups, like independent dealers and private fleet owners, are becoming available in these regions. This means people will have more options to book and rent recreational vehicles, either online or by meeting in person. As a result, the impact of the availability of rental services on the global recreational vehicles market is expected to go from a medium effect to a high one in the coming years. The increase in the popularity of renting recreational vehicles is linked to people's preferences for countryside travels, camping, and attending events that are far away. These activities often involve long-distance travel, making it convenient for individuals to opt for rented recreational vehicles. Over the past five years, the growth of the recreational vehicle rental industry has been closely tied to the overall health of the global economy. When the economy is doing well, people feel more financially secure and are more likely to spend on leisure activities, including renting recreational vehicles. A significant contributing factor to the rise in demand for recreational vehicle rental services is the increased awareness among consumers. More people now know that they have the option to rent recreational vehicles for their trips, leading to a surge in demand. The convenience of online booking platforms has further accelerated this trend. People can easily find well-maintained recreational vehicles with specific features they desire, all at reasonable prices. Additionally, the ability to compare rental prices from different providers in a particular area adds to the appeal of renting recreational vehicles. In response to the growing demand, major companies in the recreational vehicle rental industry are actively investing in expanding their dealer networks and reaching more customers. These strategic developments are expected to boost demand not only in the United States but also globally. As the availability of recreational vehicle rental services increases, it is anticipated to be a driving force for the entire global recreational vehicles market in the foreseeable future. While the trend of providing recreational vehicle rental services is currently more concentrated in North America, there are expectations of its expansion into Europe and Asia-Pacific. This anticipated growth is attributed to the increasing presence of various RV rental groups, including independent dealers and private fleet owners, in these regions. Customers in these areas will have more opportunities to book and rent recreational vehicles, either through online platforms or traditional face-to-face interactions. Consequently, the impact of the availability of recreational vehicle rental services on the global recreational vehicles market is forecasted to shift from a moderate influence to a high one over the upcoming years.

    Market Summary

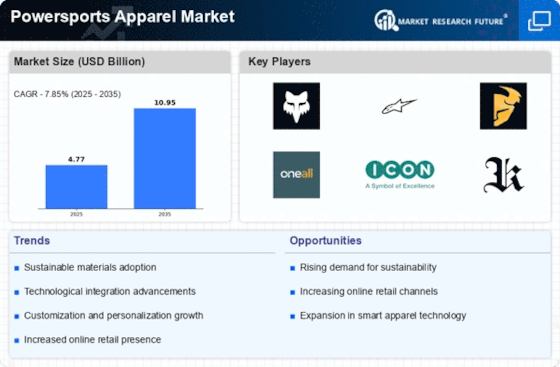
    As per Market Research Future Analysis, the Global Powersports Apparel Market was valued at USD 3.7 billion in 2021 and is projected to grow from USD 4.14 billion in 2022 to USD 8.82 billion by 2032, with a CAGR of 7.85% during the forecast period. The market is driven by increasing interest in outdoor recreational activities and advancements in fabric technology. The motorcycle segment is expected to hold the largest market share, while the male demographic leads in market participation. The recreational segment is anticipated to dominate applications, reflecting a shift towards eco-friendly materials and online retail growth.

    Key Market Trends & Highlights

    The Powersports Apparel Market is witnessing significant trends driven by consumer preferences and technological advancements.

    • Market Size in 2021: USD 3.7 Billion
    • Projected Market Size by 2032: USD 8.82 Billion
    • CAGR from 2022 to 2032: 7.85%
    • Male Segment Market Share in 2022: 70%

    Market Size & Forecast

    2021 Market Size USD 3.7 Billion
    2022 Market Size USD 4.14 Billion
    2032 Market Size USD 8.82 Billion
    CAGR 7.85%
    Largest Regional Market Share in 2022 North America (44%)

    Major Players

    Vista Outdoor Inc. (US), Alpinestars USA Inc. (US), Troy Lee Designs (TLD) (US), FLY Racing (US), O'Neal USA (US), Leatt Corporation (South Africa), Le Mans Corporation (US), Polaris Industries Inc. (US), Arai Helmet (Japan)

    Market Trends

      • Increasing Demand for Motorcycles & Adoption of Recreational Powersports

    The increasing popularity and adoption of recreational powersports vehicles are positively impacting the powersports apparel market. This trend reflects a growing market for clothing and accessories designed to meet the unique needs of individuals who engage in powersports activities. As more people embrace these outdoor adventures, the demand for appropriate apparel and safety gear is expected to continue driving the growth of this market segment.

    The demand for motorcycles increases rapidly, owing to the augmented adoption of this vehicle among younger buyers. Moreover, low maintenance costs, convenience, and affordability are some of the major factors that are anticipated to increase the demand for motorcycles during the forecast period. Thus, the motorcycle segment is anticipated to hold the largest share of the power sports market during the forecast period. However, the sales of motorcycles have increased due to a shift in consumer preferences toward fuel-efficient, lightweight, more accessible, and eco-friendly motorcycles. A personal watersport is a highly popular vehicle for recreational activities.

    Therefore, increasing demand for cost-efficient and convenient motorcycles is expected to propel the market growth of the sports market.

    The Global Powersports Apparel Market is poised for growth as consumer interest in outdoor recreational activities continues to rise, reflecting a broader trend towards adventure and lifestyle-oriented spending.

    U.S. Department of Commerce

    Powersports Apparel Market Market Drivers

    Market Growth Projections

    The Global Powersports Apparel Market Industry is projected to experience substantial growth in the coming years. With an anticipated market size of 4.72 USD Billion in 2024, the industry is set to expand significantly, reaching 11.1 USD Billion by 2035. This growth trajectory suggests a compound annual growth rate of 8.05% from 2025 to 2035. Such projections indicate a robust demand for powersports apparel, driven by various factors including increased participation in powersports activities, technological advancements, and rising consumer awareness regarding safety and quality.

    Expansion of E-commerce Platforms

    The expansion of e-commerce platforms is transforming the Global Powersports Apparel Market Industry. With the rise of online shopping, consumers now have greater access to a wide range of apparel options from various brands. This shift is particularly beneficial for niche markets, allowing smaller manufacturers to reach a global audience. The convenience of online shopping, combined with competitive pricing and customer reviews, enhances consumer confidence in purchasing powersports apparel. As e-commerce continues to grow, it is expected to play a pivotal role in driving market expansion, facilitating a more dynamic retail environment.

    Rising Awareness of Safety Standards

    The rising awareness of safety standards among riders is a crucial driver for the Global Powersports Apparel Market Industry. As safety regulations become more stringent, riders are increasingly seeking apparel that meets these standards. This trend is reflected in the growing demand for helmets, protective jackets, and other safety gear designed to minimize injury risks. Governments and industry bodies are actively promoting safety campaigns, further encouraging riders to prioritize protective apparel. This heightened focus on safety is likely to contribute to the market's growth, as consumers become more discerning in their purchasing decisions.

    Technological Advancements in Apparel Design

    Technological advancements in apparel design significantly influence the Global Powersports Apparel Market Industry. Innovations such as moisture-wicking fabrics, impact-resistant materials, and integrated safety features are becoming increasingly prevalent. These advancements not only enhance the performance of the apparel but also improve rider safety and comfort. For instance, the incorporation of smart textiles that can monitor vital signs is gaining traction. As manufacturers continue to invest in research and development, the market is expected to benefit from these innovations, potentially leading to a compound annual growth rate of 8.05% from 2025 to 2035.

    Growing Participation in Powersports Activities

    The increasing participation in powersports activities globally is a primary driver for the Global Powersports Apparel Market Industry. As more individuals engage in activities such as motocross, off-road riding, and snowmobiling, the demand for specialized apparel rises. This trend is evident as the market is projected to reach 4.72 USD Billion in 2024, indicating a robust interest in powersports. The appeal of these activities, often fueled by social media and community events, encourages enthusiasts to invest in high-quality apparel that enhances safety and performance. Consequently, this growing participation is likely to propel the market forward.

    Increasing Disposable Income and Consumer Spending

    Increasing disposable income and consumer spending are pivotal factors driving the Global Powersports Apparel Market Industry. As economic conditions improve, consumers are more willing to invest in high-quality powersports apparel. This trend is particularly evident in emerging markets, where rising incomes are leading to a surge in recreational spending. The market is projected to grow significantly, reaching 11.1 USD Billion by 2035, as consumers prioritize quality and performance in their apparel choices. This willingness to spend on premium products is likely to enhance brand loyalty and stimulate further market growth.

    Market Segment Insights

    Powersports Apparel Type Insights

    The Powersports Apparel Market bifurcated is based on the type, which includes activewear, and wearables. The wearables segment led the segmental share in terms of market value which is almost 60% of the overall powersports apparel market in 2022. Wearable powersport typically refers to the use of wearable technology and gear designed for individuals engaged in extreme or high-speed outdoor activities, such as motorcycling, snowmobiling, jet skiing, and other similar pursuits.

    Figure 2: Powersports Apparel Market, by Type, 2022 & 2032 (USD Billion)

    Source: Secondary Research, Primary Research, Market Research Future Database and Analyst Review

    Powersports Apparel Vehicles Insights

    The Powersports Apparel Market is also analyzed based on vehicles, motorcycles, off-road vehicles, snowmobiles, and boating are the further bifurcations. Among these segments, the motorcycle segment held the leading market share of approximately 45% in 2021 and is projected to grow with a CAGR of 8.04% during the trajectory period. The increasing demand for power motorcycles in the powersports industry can be driven by various factors that contribute to their appeal and popularity among enthusiasts.

    Powersports Apparel End-User Insights

    The Powersports Apparel Market is also categorized based on End-User, male, and female are the further sub-segments. The male segment emerged as the leading segment with a market share of 70% in 2022 and is likely to observe a growth rate of 7.93% during the estimated years. The male powersports apparel market is a prominent and evolving sector worldwide. This market has seen substantial growth due to increasing participation in outdoor and motorsports activities by men. Powersports enthusiasts are seeking apparel that not only provides safety but also offers style and comfort, driving the demand for innovative and functional products.

    Powersports Apparel

    The Powersports Apparel Market is also segmented based on applications that are comprised of professional, and recreational. The recreational segment accounted for a leading market share of 67% in 2022 and is projected to observe tremendous growth prospects in the upcoming years. Recreational powersports apparel caters to the needs of enthusiasts engaged in activities like off-roading, snowmobiling, and water sports. It combines safety with style and comfort, offering a wide range of specialized clothing and gear. This market has seen significant growth thanks to advancements in fabric technology and the rise of online retail.

    It has adapted to changing consumer preferences, becoming more eco-conscious and sustainable, and continues to thrive despite economic challenges. As more people embrace outdoor recreational pursuits, the recreational powersports apparel industry is poised for sustained expansion.

    Powersports Apparel

    The Powersports Apparel Market is also segmented based on distribution channels which are comprised of brick-and-mortar, e-commerce marketplaces, and company websites. The brick-and-mortar segment held a major market share of 79.37% in 2021. Brick-and-mortar shops can offer personalized services that online retailers cannot. This is because brick-and-mortar shops have employees who are knowledgeable about powersports apparel and can help customers find the right gear for their needs. Online shopping is becoming increasingly popular, and this is true for powersports apparel as well.

    This is because online retailers offer a wider selection of products, lower prices, and the convenience of shopping from home. There are several e-commerce marketplaces that sell powersports apparel, such as Amazon, eBay, and RevZilla. This makes it easy for customers to compare prices and find the best deals. Online payments are becoming increasingly accepted, and this makes it easier for customers to purchase powersports apparel online. This is because customers can use their credit cards or other online payment methods to make purchases.

    Powersports Apparel

    The Powersports Apparel Market is also studied based on regions which include North America, Europe, Asia-Pacific, and the Rest of the World. North America appeared as the prime candidate in the Powersports Apparel Market with a major share of 44% in 2022 in terms of market value and is anticipated to score a CAGR of 7.63% during the estimated period. The North America powersports apparel market is a vibrant and rapidly evolving sector within the broader recreational clothing industry.

    This market is primarily driven by the region's strong enthusiasm for outdoor activities such as off-roading, snowmobiling, and water sports, which demand specialized apparel combining safety, style, and comfort. Key factors fueling market growth include the continuous advancements in fabric technology, which enhance safety and comfort for riders. Furthermore, the proliferation of online retail channels has made a broad range of powersports apparel easily accessible to consumers in North America. Despite economic uncertainties, the industry has shown resilience, adapting to changing consumer preferences and environmental concerns, increasingly adopting eco-friendly materials and sustainable practices.

    As North Americans continue to embrace outdoor recreational pursuits, the North America powersports apparel market is expected to maintain its growth trajectory, offering a diverse array of products for enthusiasts looking to enhance their riding experiences.

    The Europe powersports apparel market is experiencing steady growth, driven by a growing interest in outdoor recreational activities, including off-roading, snowmobiling, and water sports. Consumers in Europe seek high-performance apparel that combines safety with style and comfort, and innovations in fabric technology are meeting these demands.

    Get more detailed insights about Powersports Apparel Market Research Report—Global Forecast till 2032

    Regional Insights

    Key Companies in the Powersports Apparel Market market include

    Industry Developments

    Future Outlook

    Powersports Apparel Market Future Outlook

    The Global Powersports Apparel Market is projected to grow at 8.05% CAGR from 2024 to 2035, driven by increasing participation in outdoor recreational activities and technological advancements in apparel.

    New opportunities lie in:

    • Develop eco-friendly apparel lines to attract environmentally conscious consumers.
    • Leverage e-commerce platforms for direct-to-consumer sales, enhancing market reach.
    • Invest in smart apparel technology to integrate safety features and enhance user experience.

    By 2035, the market is expected to exhibit robust growth, reflecting evolving consumer preferences and technological innovations.

    Market Segmentation

    Regional Outlook

    • US
    • Canada
    • Mexico

    Powersports Apparel Type Outlook

    • Activewear
    • Wearables

    Powersports Apparel Vehicle Outlook

    • Motorcycle
    • Off-Road Vehicles
    • Snowmobiles
    • Boating

    Powersports Apparel End-User Outlook

    • Male
    • Female

    Powersports Apparel Regional Outlook

    • US
    • Canada
    • Mexico

    Powersports Apparel Application Outlook

    • Professional
    • Recreational

    Powersports Apparel Distribution Channel Outlook

    • Brick and Mortar
    • Ecommerce Marketplaces
    • Company Website

    Report Scope

    Report Attribute/Metric Details
    Market Size 2021 USD 3.7 billion
    Market Size 2022 USD 4.1 billion
    Market Size 2032 USD 8.82 billion
    Compound Annual Growth Rate (CAGR) 7.85% (2023-2032)
    Base Year 2022
    Forecast Period 2023-2032
    Historical Data 2019, 2020, 2021
    Forecast Units Value (USD Billion) and Volume (Billion Tons)
    Report Coverage Revenue Forecast, Competitive Landscape, Growth Factors, and Trends
    Segments Covered Type, Vehicle, End-User, Application, Distribution Chanel, and Region
    Geographies Covered North America, Europe, Asia Pacific, and The Rest of the World
    Countries Covered The U.S, Canada, Germany, France, UK, Italy, Spain, China, Japan, India, South Korea, Brazil, Mexico, Argentina, GCC Countries and South Africa.
    Key Companies Profiled Vista Outdoor Inc. (US), Alpinestars USA Inc. (US), Troy Lee Designs (TLD) (US), FLY Racing (US), O'Neal USA (US), Leatt Corporation (South Africa), Le Mans Corporation (US), Polaris Industries Inc. (US), and Arai Helmet (Japan) among others.
    Key Market Opportunities ·       Focus Towards Developing Countries
    Key Market Dynamics ·       Increasing Demand for Motorcycles and Adoption Of Recreational Powersports ·       Increasing Demand for sports activities Across Regions ·       Safety Concerns Within the Powersports Industry

    Market Highlights

    Author

    Varsha More
    Research Analyst

    She holds an experience of about 6+ years in market research and business consulting, working under the spectrum of information communication technology, telecommunications and semiconductor domains. aarti conceptualizes and implements a scalable business strategy and provides strategic leadership to the clients. her expertise lies in market estimation, competitive intelligence, pipeline analysis, customer assessment, etc.

    Leave a Comment

    Latest Comments

    John Doe

    This is a great article! Really helped me understand the topic better.

    Posted on July 23, 2025, 10:15 AM
    Jane Smith

    Thanks for sharing this. I’ve bookmarked it for later reference.

    Posted on July 22, 2025, 7:45 PM

    FAQs

    How much is the Powersports Apparel market worth?

    Powersports Apparel Market is pegged at USD 4.14 billion as of 2022.

    How Big is the U.S. Powersports Apparel market?

    The US Powersports Apparel market accounted for 75% market share in 2022.

    What is the growth rate of the Powersports Apparel market?

    Powersports Apparel Market is poised to grow at 7.85% CAGR during 2022-2032.

    Which region held the largest market share in the Powersports Apparel market?

    The North America region held the largest market share in the Powersports Apparel Market.

    Who are the key players in the Powersports Apparel market?

    Vista Outdoor Inc. (US), Alpinestars USA Inc. (US), Troy Lee Designs (TLD) (US), FLY Racing (US), O'Neal USA (US), Leatt Corporation (South Africa), Le Mans Corporation (US), Polaris Industries Inc. (US), and Arai Helmet (Japan) among others.

    Which Type led the Powersports Apparel market?

    Wearables is poised to drive the Powersports Apparel market, which is poised to grow at 8.1% CAGR during 2022-2032

    1. CONTENTS
    2. EXECUTIVE SUMMARY 14
    3. MARKET INTRODUCTION 15
    4. DEFINITION 15
    5. SCOPE OF THE STUDY 15
    6. MARKET STRUCTURE 15
    7. KEY IMPLEMENTATION CRITERIA 16
    8. RESEARCH METHODOLOGY 17
    9. MARKET DYNAMICS 25
      1. INTRODUCTION 25
      2. DRIVERS 25
        1. INCREASING DEMAND OF MOTORCYCLES AND ADOPTION
    10. OF RECREATIONAL POWERSPORTS 25
      1. INCREASING DEMAND OF POWERSPORTS ACTIVITIES ACROSS REGIONS 26
      2. RESTRAINTS 26
        1. SAFETY CONCERNS
    11. WITHIN THE POWERSPORTS INDUSTRY 26
      1. OPPORTUNITIES 27
        1. FOCUS TOWARDS DEVELOPING COUNTRIES 27
      2. IMPACT OF COVID-19
    12. ON POWERSPORTS APPAREL MARKET 28
    13. MARKET FACTOR ANALYSIS 29
      1. SUPPLY/VALUE CHAIN ANALYSIS 29
      2. PORTER FIVE FORCES 30
        1. THREAT OF NEW ENTRANTS: 30
        2. BARGAINING POWER OF SUPPLIERS:
        3. BARGAINING
    14. POWER OF BUYERS: 30
    15. THREAT OF SUBSTITUTES: 31
      1. INTENSITY OF COMPETITIVE RIVALRY: 31
    16. GLOBAL POWERSPORTS APPAREL MARKET, BY DISTRIBUTION
    17. CHANNELS 32
    18. INTRODUCTION 32
    19. BRICK AND MORTAR 34
    20. E-COMMERCE MARKETPLACE 34
      1. COMPANY WEBSITE 35
    21. GLOBAL POWERSPORTS APPAREL MARKET, BY TYPE 36
      1. INTRODUCTION 36
      2. ACTIVEWEAR 37
      3. WEARABLES 39
    22. GLOBAL POWERSPORTS
    23. APPAREL MARKET, BY VEHICLE 41
      1. INTRODUCTION 41
      2. MOTORCYCLE 43
      3. OFF ROAD VEHICLES 44
      4. SNOWMOBILES 44
      5. BOATING 45
    24. GLOBAL POWERSPORTS APPAREL MARKET, BY APPLICATION
      1. INTRODUCTION
      2. PROFESSIONAL
      3. RECREATIONAL
    25. GLOBAL
    26. POWERSPORTS APPAREL MARKET, BY END-USER 50
      1. INTRODUCTION 50
      2. MALE 51
      3. FEMALE 52
    27. GLOBAL POWERSPORTS APPAREL MARKET, BY REGION 53
      1. OVERVIEW 53
      2. NORTH AMERICA 54
        1. U.S. 56
        2. CANADA 57
        3. MEXICO 58
      3. EUROPE 60
        1. U.K. 62
        2. GERMANY 63
        3. FRANCE 64
        4. ITALY 65
        5. SPAIN 67
        6. RUSSIA 68
        7. BENELUX 69
        8. NORDIC 70
        9. REST OF EUROPE
      4. ASIA-PACIFIC
        1. ASIA-PACIFIC
        2. CHINA
        3. JAPAN
        4. INDIA
        5. ANZ
        6. SOUTH
    28. KOREA 82
    29. REST OF APAC 83
    30. REST OF THE WORLD 85
    31. GCC 86
    32. SOUTH AFRICA 88
    33. NORTH AFRICA 89
    34. TURKEY 90
    35. BRAZIL 91
    36. ARGENTINA 93
    37. ROLAMEA 94
    38. COMPETITIVE LANDSCAPE 96
      1. TOP COMPANIES, BY REGION 96
      2. MARKET SHARE ANALYSIS 96
    39. COMPANY PROFILES 97
      1. VISTA OUTDOOR INC. 97
        1. COMPANY OVERVIEW 97
        2. FINANCIAL OVERVIEW 98
        3. SWOT ANALYSIS 99
        4. KEY STRATEGIES 99
      2. ALPINESTARS USA INC. 100
        1. COMPANY OVERVIEW 100
        2. FINANCIAL OVERVIEW 101
        3. SWOT ANALYSIS 102
        4. KEY STRATEGIES 103
      3. TROY LEE DESIGNS 104
        1. COMPANY OVERVIEW 104
        2. FINANCIAL OVERVIEW 104
        3. SWOT ANALYSIS 105
        4. KEY STRATEGIES 106
      4. FLY RACING 107
        1. COMPANY OVERVIEW 107
        2. FINANCIAL OVERVIEW 107
        3. FLY RACING: SWOT ANALYSIS 108
        4. KEY STRATEGIES 109
      5. O''NEAL USA 110
        1. COMPANY OVERVIEW
    40. FINANCIAL OVERVIEW 110
    41. O''NEAL USA:SWOT ANALYSIS 111
      1. KEY STRATEGIES 112
      2. LEATT CORPORATION 113
        1. COMPANY OVERVIEW 113
        2. FINANCIAL OVERVIEW 114
        3. SWOT ANALYSIS 115
        4. KEY STRATEGIES 116
      3. LEMANS CORPORATION 117
        1. COMPANY OVERVIEW 117
        2. FINANCIAL OVERVIEW 117
        3. SWOT ANALYSIS 118
        4. KEY STRATEGIES 119
      4. POLARIS 120
        1. COMPANY OVERVIEW 120
        2. FINANCIAL OVERVIEW 121
        3. SWOT ANALYSIS 122
        4. KEY STRATEGIES 123
      5. ARAI 124
        1. COMPANY OVERVIEW 124
        2. FINANCIAL OVERVIEW 125
        3. SWOT ANALYSIS 126
        4. KEY STRATEGIES 127
    42. CHANNELS, 2019–2032 (USD MILLION) 32
    43. BRICK AND MORTAR, BY REGION, 2019–2032 (USD MILLION) 34
    44. MARKET, THROUGH ECOMMERCE, BY REGION, 2019–2032 (USD MILLION) 35
    45. APPAREL MARKET, THROUGH COMPANY WEBSITE, BY REGION, 2019–2032 (USD MILLION)
    46. GLOBAL POWERSPORTS APPAREL MARKET, BY TYPE, 2019–2032 (USD MILLION) 36
    47. APPAREL MARKET, BY ACTIVEWEAR TYPES, 2019-2032 (USD MILLION) 38
    48. MARKET, BY ACTIVEWEAR, BY REGION, 2019-2032 (USD MILLION) 39
    49. 2032 (USD MILLION) 39
    50. 2032 (USD MILLION) 40
    51. (USD MILLION) 41
    52. GLOBAL POWERSPORTS APPAREL MARKET, BY MOTORCYCLE RIDERS, BY REGION, 2019–2032
    53. (USD MILLION) 43
    54. GLOBAL POWERSPORTS APPAREL MARKET, BY OFF ROAD VEHICLES DRIVERS, BY REGION, 2019–2032
    55. (USD MILLION) 44
    56. GLOBAL POWERSPORTS APPAREL MARKET, BY SNOWMOBILE DRIVERS, BY REGION, 2019–2032
    57. (USD MILLION) 44
    58. GLOBAL POWERSPORTS APPAREL MARKET, BY BOATING MEMBERS, BY REGION, 2019–2032
    59. (USD MILLION) 45
    60. GLOBAL POWERSPORTS APPAREL MARKET, BY APPLICATION, 2019–2032 (USD MILLION)
    61. GLOBAL POWERSPORTS APPAREL MARKET, FOR PROFESSIONAL, BY REGION, 2019–2032
    62. (USD MILLION) 48
    63. GLOBAL POWERSPORTS APPAREL MARKET, FOR RECREATIONAL, BY REGION, 2019–2032
    64. (USD MILLION) 49
    65. GLOBAL POWERSPORTS APPAREL MARKET, BY END-USER, 2019–2032 (USD MILLION)
    66. GLOBAL POWERSPORTS APPAREL MARKET, BY MALE, BY REGION, 2019–2032 (USD MILLION)
    67. GLOBAL POWERSPORTS APPAREL MARKET, BY FEMALE, BY REGION, 2019–2032 (USD MILLION)
    68. GLOBAL POWERSPORTS APPAREL MARKET, BY REGION, 2019–2032 (USD MILLION) 54
    69. POWERSPORTS APPAREL MARKET, BY COUNTRY, 2019-2032 (USD MILLION) 54
    70. APPAREL MARKET, BY DISTRIBUTION CHANNELS, 2019–2032 (USD MILLION) 54
    71. POWERSPORTS APPAREL MARKET, BY TYPE, 2019–2032 (USD MILLION) 55
    72. POWERSPORTS APPAREL MARKET, BY VEHICLE, 2019–2032 (USD MILLION) 55
    73. POWERSPORTS APPAREL MARKET, BY APPLICATION, 2019–2032 (MILLION TON) 55
    74. POWERSPORTS APPAREL MARKET, BY END USER, 2019–2032 (MILLION TON) 55
    75. APPAREL MARKET, BY DISTRIBUTION CHANNELS, 2019–2032 (USD MILLION) 56
    76. APPAREL MARKET, BY TYPE, 2019–2032 (USD MILLION) 56
    77. –2032 (USD MILLION) 56
    78. (MILLION TON) 56
    79. U.S.: POWERSPORTS APPAREL MARKET, BY END USER, 2019–2032 (MILLION TON)
    80. CANADA POWERSPORTS APPAREL MARKET, BY DISTRIBUTION CHANNELS, 2019–2032 (USD
    81. MILLION) 57
    82. CANADA POWERSPORTS APPAREL MARKET, BY TYPE, 2019–2032 (USD MILLION) 57
    83. APPAREL MARKET, BY VEHICLE, 2019–2032 (USD MILLION) 57
    84. –2032 (MILLION TON) 58
    85. (MILLION TON) 58
    86. MEXICO POWERSPORTS APPAREL MARKET, BY DISTRIBUTION CHANNELS, 2019–2032
    87. (USD MILLION) 58
    88. MEXICO POWERSPORTS APPAREL MARKET, BY TYPE, 2019–2032 (USD MILLION) 58
    89. APPAREL MARKET, BY VEHICLE, 2019–2032 (USD MILLION) 59
    90. –2032 (MILLION TON) 59
    91. (MILLION TON) 59
    92. EUROPE: POWERSPORTS APPAREL MARKET, BY COUNTRY, 2019-2032 (USD MILLION) 60
    93. APPAREL MARKET, BY COUNTRY, 2019-2032 (MILLION TON) 60
    94. CHANNELS, 2019–2032 (USD MILLION) 60
    95. –2032 (USD MILLION) 61
    96. (USD MILLION) 61
    97. EUROPE: POWERSPORTS APPAREL MARKET, BY APPLICATION, 2019–2032 (MILLION
    98. TON) 61
    99. EUROPE: POWERSPORTS APPAREL MARKET, BY END USER, 2019–2032 (MILLION TON)
    100. U.K. POWERSPORTS APPAREL MARKET, BY DISTRIBUTION CHANNELS, 2019–2032 (USD
    101. MILLION) 62
    102. U.K. POWERSPORTS APPAREL MARKET, BY TYPE, 2019–2032 (USD MILLION) 62
    103. APPAREL MARKET, BY VEHICLE, 2019–2032 (USD MILLION) 62
    104. –2032 (MILLION TON) 62
    105. (MILLION TON) 63
    106. GERMANY. POWERSPORTS APPAREL MARKET, BY DISTRIBUTION CHANNELS, 2019–2032
    107. (USD MILLION) 63
    108. GERMANY. POWERSPORTS APPAREL MARKET, BY TYPE, 2019–2032 (USD MILLION) 63
    109. APPAREL MARKET, BY VEHICLE, 2019–2032 (USD MILLION) 63
    110. APPLICATION, 2019–2032 (MILLION TON) 64
    111. END USER, 2019–2032 (MILLION TON) 64
    112. CHANNELS, 2019–2032 (USD MILLION) 64
    113. –2032 (USD MILLION) 64
    114. (USD MILLION) 65
    115. FRANCE.: POWERSPORTS APPAREL MARKET, BY APPLICATION, 2019–2032 (MILLION
    116. TON) 65
    117. FRANCE.: POWERSPORTS APPAREL MARKET, BY END USER, 2019–2032 (MILLION TON)
    118. ITALY. POWERSPORTS APPAREL MARKET, BY DISTRIBUTION CHANNELS, 2019–2032 (USD
    119. MILLION) 65
    120. ITALY. POWERSPORTS APPAREL MARKET, BY TYPE, 2019–2032 (USD MILLION) 66
    121. APPAREL MARKET, BY VEHICLE, 2019–2032 (USD MILLION) 66
    122. –2032 (MILLION TON) 66
    123. (MILLION TON) 66
    124. SPAIN. POWERSPORTS APPAREL MARKET, BY DISTRIBUTION CHANNELS, 2019–2032
    125. (USD MILLION) 67
    126. SPAIN. POWERSPORTS APPAREL MARKET, BY TYPE, 2019–2032 (USD MILLION) 67
    127. APPAREL MARKET, BY VEHICLE, 2019–2032 (USD MILLION) 67
    128. –2032 (MILLION TON) 67
    129. (MILLION TON) 68
    130. RUSSIA. POWERSPORTS APPAREL MARKET, BY DISTRIBUTION CHANNELS, 2019–2032
    131. (USD MILLION) 68
    132. RUSSIA. POWERSPORTS APPAREL MARKET, BY TYPE, 2019–2032 (USD MILLION) 68
    133. APPAREL MARKET, BY VEHICLE, 2019–2032 (USD MILLION) 68
    134. APPLICATION, 2019–2032 (MILLION TON) 69
    135. END USER, 2019–2032 (MILLION TON) 69
    136. DISTRIBUTION CHANNELS, 2019–2032 (USD MILLION) 69
    137. TYPE, 2019–2032 (USD MILLION) 69
    138. –2032 (USD MILLION) 70
    139. (MILLION TON) 70
    140. BENELUX.: POWERSPORTS APPAREL MARKET, BY END USER, 2019–2032 (MILLION TON)
    141. NORDIC. POWERSPORTS APPAREL MARKET, BY DISTRIBUTION CHANNELS, 2019–2032 (USD
    142. MILLION) 70
    143. NORDIC. POWERSPORTS APPAREL MARKET, BY TYPE, 2019–2032 (USD MILLION) 71
    144. APPAREL MARKET, BY VEHICLE, 2019–2032 (USD MILLION) 71
    145. APPLICATION, 2019–2032 (MILLION TON) 71
    146. END USER, 2019–2032 (MILLION TON) 71
    147. BY DISTRIBUTION CHANNELS, 2019–2032 (USD MILLION) 72
    148. BY TYPE, 2019–2032 (USD MILLION) 72
    149. BY VEHICLE, 2019–2032 (USD MILLION) 72
    150. BY APPLICATION, 2019–2032 (MILLION TON) 72
    151. BY END USER, 2019–2032 (MILLION TON) 73
    152. BY COUNTRY, 2019-2032 (USD MILLION) 74
    153. CHANNELS, 2019–2032 (USD MILLION) 74
    154. BY TYPE, 2019–2032 (USD MILLION) 74
    155. BY VEHICLE, 2019–2032 (USD MILLION) 75
    156. BY APPLICATION, 2019–2032 (MILLION TON) 75
    157. BY END USER, 2019–2032 (MILLION TON) 75
    158. CHANNELS, 2019–2032 (USD MILLION) 75
    159. –2032 (USD MILLION) 76
    160. (USD MILLION) 76
    161. CHINA.: POWERSPORTS APPAREL MARKET, BY APPLICATION, 2019–2032 (MILLION
    162. TON) 76
    163. CHINA.: POWERSPORTS APPAREL MARKET, BY END USER, 2019–2032 (MILLION TON)
    164. CHINA. POWERSPORTS APPAREL MARKET, BY DISTRIBUTION CHANNELS, 2019–2032 (USD
    165. MILLION) 77
    166. CHINA. POWERSPORTS APPAREL MARKET, BY TYPE, 2019–2032 (USD MILLION) 77
    167. APPAREL MARKET, BY VEHICLE, 2019–2032 (USD MILLION) 77
    168. APPLICATION, 2019–2032 (MILLION TON) 77
    169. END USER, 2019–2032 (MILLION TON) 78
    170. CHANNELS, 2019–2032 (USD MILLION) 78
    171. –2032 (USD MILLION) 78
    172. (USD MILLION) 78
    173. JAPAN.: POWERSPORTS APPAREL MARKET, BY APPLICATION, 2019–2032 (MILLION
    174. TON) 79
    175. JAPAN.: POWERSPORTS APPAREL MARKET, BY END USER, 2019–2032 (MILLION TON)
    176. INDIA. POWERSPORTS APPAREL MARKET, BY DISTRIBUTION CHANNELS, 2019–2032 (USD
    177. MILLION) 79
    178. INDIA. POWERSPORTS APPAREL MARKET, BY TYPE, 2019–2032 (USD MILLION) 79
    179. APPAREL MARKET, BY VEHICLE, 2019–2032 (USD MILLION) 80
    180. APPLICATION, 2019–2032 (MILLION TON) 80
    181. END USER, 2019–2032 (MILLION TON) 80
    182. CHANNELS, 2019–2032 (USD MILLION) 80
    183. –2032 (USD MILLION) 81
    184. (USD MILLION) 81

    Powersports Apparel Market Segmentation

    Market Segmentation Overview

    • Detailed segmentation data will be available in the full report
    • Comprehensive analysis by multiple parameters
    • Regional and country-level breakdowns
    • Market size forecasts by segment
    Infographic

    Free Sample Request

    Kindly complete the form below to receive a free sample of this Report

    Get Free Sample

    Customer Strories

    “I am very pleased with how market segments have been defined in a relevant way for my purposes (such as "Portable Freezers & refrigerators" and "last-mile"). In general the report is well structured. Thanks very much for your efforts.”

    Victoria Milne

    Founder
    Case Study

    Smartphone Motherboard Parts Manufacturing Research