• Cat-intel
  • MedIntelliX
  • Resources
  • About Us
  • Hero Background
    English
    Chinese
    French
    Japanese
    Korean
    German
    Spanish

    PC as a Service Market Size

    ID: MRFR/ICT/4919-CR
    115 Pages
    Shubham Munde
    July 2019

    Personal Computer as a Service (PCaaS) Market Research Report Information By Organization Size (SMEs and Large Enterprises), By Component (Hardware and Software), By Vertical (BFSI, Government, Education, Healthcare & Life Science, and IT & Telecommunication), And By Region (North America, Europe, Asia-Pacific, And Rest Of The World) – Market Forecast Till 2035

    Share:
    Download PDF ×

    We do not share your information with anyone. However, we may send you emails based on your report interest from time to time. You may contact us at any time to opt-out.

    PC as a Service Market Infographic
    $ 4,950.0
    $ 5,950.0
    $ 7,250.0

    Pc As A Service Size

    PC as a Service Market Growth Projections and Opportunities

    The PC as a Service (PCaaS) market is influenced by several key factors that shape its growth, dynamics, and competitiveness. These market factors encompass a wide range of economic, technological, and consumer-related aspects that play significant roles in driving the adoption and evolution of PCaaS offerings.

    First and foremost, the increasing demand for flexible and cost-effective IT solutions is a primary market factor fueling the growth of PCaaS. Businesses of all sizes are seeking scalable and subscription-based models to manage their PC infrastructure efficiently. PCaaS offers companies the ability to access the latest hardware and software without hefty upfront investments, aligning expenses with actual usage and business needs.

    Moreover, the rapid pace of technological innovation contributes significantly to the dynamics of the PCaaS market. As new hardware advancements, such as faster processors, enhanced security features, and improved energy efficiency, continue to emerge, PCaaS providers must stay ahead of the curve to offer cutting-edge solutions to their customers. Additionally, the integration of cloud computing technologies and remote management capabilities further enhances the appeal of PCaaS by enabling seamless device provisioning, maintenance, and support.

    Another crucial market factor is the increasing emphasis on workforce mobility and remote work arrangements. With the rise of remote and hybrid work environments, organizations are seeking PCaaS solutions that facilitate seamless connectivity, collaboration, and productivity for distributed teams. This trend has led to a growing demand for laptops, tablets, and other mobile devices as part of PCaaS offerings, along with robust security measures to protect sensitive data in transit and at rest.

    Furthermore, the competitive landscape within the PCaaS market exerts significant influence on its growth and evolution. As more players enter the market, competition intensifies, leading to price pressures, innovation spurts, and strategic partnerships. Established PC manufacturers, IT service providers, and cloud computing giants are vying for market share by differentiating their offerings through value-added services, customized solutions, and superior customer support.

    Additionally, regulatory and compliance requirements play a crucial role in shaping the PCaaS market, particularly in industries with stringent data privacy and security regulations. PCaaS providers must ensure compliance with relevant standards and regulations, such as GDPR, HIPAA, and PCI DSS, to instill trust and confidence among their customers. Failure to address compliance concerns can result in legal repercussions, financial penalties, and reputational damage.

    Moreover, macroeconomic factors, such as economic growth, inflation rates, and exchange rates, influence the overall demand for PCaaS solutions. In times of economic uncertainty or downturns, organizations may prioritize cost-cutting measures and operational efficiencies, leading to increased adoption of subscription-based IT services like PCaaS. Conversely, during periods of economic prosperity, businesses may be more inclined to invest in technology upgrades and expansion initiatives, driving demand for PCaaS offerings.

    Additionally, customer preferences and buying behaviors play a crucial role in shaping the PCaaS market landscape. Businesses are increasingly looking for seamless and hassle-free procurement experiences, along with transparent pricing structures and flexible contract terms. PCaaS providers that can cater to these evolving customer needs by offering personalized solutions, simplified billing processes, and responsive customer support are likely to gain a competitive edge in the market.

    Furthermore, environmental sustainability and corporate social responsibility (CSR) initiatives are becoming increasingly important considerations for businesses when selecting PCaaS partners. As organizations strive to reduce their carbon footprint and mitigate environmental impact, they are seeking PCaaS providers that prioritize energy efficiency, product recycling, and sustainable manufacturing practices. PCaaS offerings that align with these sustainability goals can enhance brand reputation and attract environmentally-conscious customers.

    PC as a Service Market Size Graph

    Market Summary

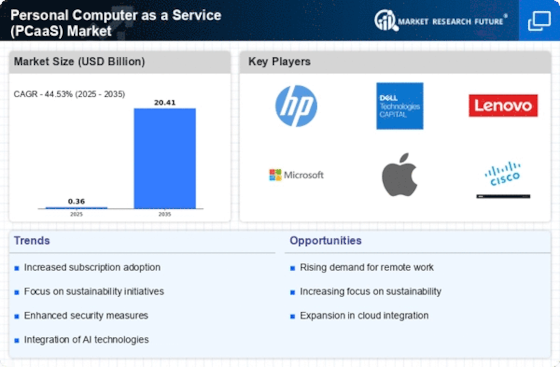
    As per Market Research Future Analysis, the Personal Computer as a Service (PCaaS) market was valued at USD 0.12 billion in 2021 and is projected to reach USD 2.28 billion by 2030, growing at a CAGR of 44.53% from 2022 to 2030. The market's growth is driven by the increasing demand for advanced technological environments and a shift from capital expenditure (CAPEX) to operational expenditure (OPEX) models among businesses. SMEs accounted for approximately 65-67% of the market revenue in 2021, highlighting their significant role in adopting PCaaS solutions. The software segment is expected to grow the fastest, driven by the need for current software upgrades and maintenance. The IT & telecommunications sector held the largest market share in 2021, reflecting the sector's pivotal role in digital transformation initiatives.

    Key Market Trends & Highlights

    Key trends driving the PCaaS market include the rise of managed service providers and the shift towards OPEX models.

    • PCaaS market projected to grow from USD 0.17 billion in 2022 to USD 2.28 billion by 2030.
    • SMEs contributed around 65-67% to the PCaaS market revenue in 2021.
    • IT & telecommunications segment had the highest market revenue share in 2021.
    • Software segment expected to grow the fastest during the forecast period.

    Market Size & Forecast

    2021 Market Size USD 0.12 Billion
    2022 Market Size USD 0.17 Billion
    2030 Market Size USD 2.28 Billion
    CAGR (2022-2030) 44.53%
    Largest Market Share in 2021 IT & Telecommunications

    Major Players

    HP Development Company, Microsoft Corporation, Dell Inc, Lenovo, CompuCom Systems Inc, Capgemini, SHI International Corp., Dimension Data, Softcat PLC, Avaya Inc

    Market Trends

    Renewed focus on the managed service providers to drive market growth

    The rapid expansion of managed service providers is driving the growth of the Personal Computer as a Service (PCaaS) market. In the last three years, the average monthly recurring rate (MRR) of half of the MSPs increased by more than 10%, according to the 2021 MSP Benchmark Survey Report. More than a quarter (28%) experienced average MRR growth of 6 to 10%. In terms of revenue growth, security (up 65%), cloud management (up 54%), infrastructure monitoring and management (up 52%), and desktop support (up 51%) were the services with the largest increases in 2020.

    Surprisingly, the managed service providers' increased revenue from desktop infrastructure and support creates new market opportunities.

    The preference of businesses for the operational expenditure model over the capital expenditure model, which allows the seller to increase revenue streams and foster strong customer engagement while removing the costly capital expenditure from the buyer's balance sheet and converting it to a manageable and predictable operational expense, is the main driver of the personal computer as a service market revenue. PC as a Service is extremely adaptable and scalable. The services can be tailored to the buyer's needs, driving industry growth.

    The evolution of the Personal Computer as a Service model appears to be reshaping the landscape of IT procurement, suggesting a shift towards more flexible and scalable solutions that align with the dynamic needs of modern enterprises.

    U.S. Department of Commerce

    PC as a Service Market Market Drivers

    Market Growth Projections

    Rising Demand for Flexible IT Solutions

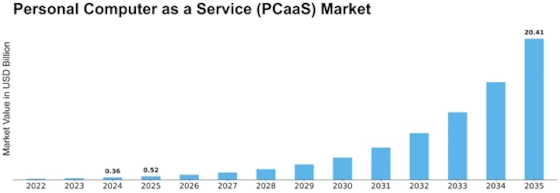
    The Global Personal Computer as a Service (PCaaS) Market Industry experiences a notable increase in demand for flexible IT solutions. Organizations are increasingly seeking to optimize their IT expenditures while maintaining operational efficiency. This trend is particularly pronounced among small and medium-sized enterprises (SMEs) that may lack the capital for substantial upfront investments in hardware. By adopting PCaaS, these businesses can access the latest technology without the burden of ownership. This shift is projected to contribute to the market's growth, with the industry expected to reach 0.41 USD Billion in 2024, indicating a strong trajectory towards future expansion.

    Increased Focus on Remote Work Solutions

    The Global Personal Computer as a Service (PCaaS) Market Industry is significantly influenced by the growing emphasis on remote work solutions. As organizations adapt to flexible work arrangements, the need for reliable and efficient computing solutions becomes paramount. PCaaS offers a viable alternative by providing employees with the necessary hardware and software to perform their tasks effectively from various locations. This trend not only enhances employee satisfaction but also contributes to overall productivity. The market's growth trajectory is expected to reflect this shift, as more companies recognize the benefits of PCaaS in supporting their remote workforce.

    Cost Efficiency and Budget Predictability

    Cost efficiency emerges as a pivotal driver within the Global Personal Computer as a Service (PCaaS) Market Industry. Organizations are increasingly drawn to the predictable monthly subscription model that PCaaS offers, allowing for better budget management and financial planning. This model mitigates the risks associated with unexpected hardware failures and maintenance costs, which can be particularly burdensome for businesses. As companies strive to streamline their operations and reduce overhead, the appeal of PCaaS becomes more pronounced. The market is anticipated to grow significantly, with projections indicating a rise to 14.4 USD Billion by 2035, reflecting the increasing adoption of this cost-effective solution.

    Technological Advancements and Innovation

    Technological advancements play a crucial role in driving the Global Personal Computer as a Service (PCaaS) Market Industry. The rapid evolution of computing technology, including improvements in processing power, storage capacity, and software capabilities, encourages organizations to adopt PCaaS solutions. By leveraging the latest innovations, businesses can enhance productivity and efficiency while minimizing the risks associated with outdated hardware. This continuous cycle of innovation is likely to sustain market growth, as companies seek to remain competitive in an increasingly digital landscape. The anticipated compound annual growth rate (CAGR) of 38.18% from 2025 to 2035 underscores the potential for substantial expansion in this sector.

    Sustainability and Environmental Considerations

    Sustainability emerges as a compelling driver within the Global Personal Computer as a Service (PCaaS) Market Industry. As organizations increasingly prioritize environmental responsibility, the adoption of PCaaS solutions aligns with their sustainability goals. By utilizing shared resources and reducing electronic waste through leasing models, companies can minimize their environmental footprint. This focus on sustainability resonates with consumers and stakeholders alike, potentially enhancing brand reputation and customer loyalty. As the market evolves, the integration of eco-friendly practices within PCaaS offerings may become a key differentiator, further propelling growth in this sector.

    Market Segment Insights

    Personal Computer as a Service (PCaaS) Organization Size Insights

    The personal computer as a service (PCaaS) market segmentation, based on the services, includes SMEs and large enterprises. The SMEs segment held the majority share in 2021, contributing around ~65-67% to the personal computer as a service (PCaaS) market revenue. SMEs are anticipated to invest in PC as a Service owing to its low capital expenditure and affordability. PCaaS is highly adaptable and allows businesses to select the appropriate hardware. PCaaS provides great convenience with multiple cloud services for SMEs seeking PCaaS. It also provides a safe and secure platform for data storage and protection.

    As a result, SMEs will adopt PCaaS at a higher rate during the forecast period.

    Figure 2: Personal Computer as a Service (PCaaS) Market by Deployment, 2021 & 2030 (USD Billion)

    Source: Secondary Research, Primary Research, Market Research Future Database and Analyst Review

    Personal Computer as a Service (PCaaS) Component Insights

    The personal computer as a service (PCaaS) market segmentation, based on the component, includes hardware and software. The software segment is expected to grow the fastest during the forecast period. Operating system/imaging, security programs, asset management, and other factory-installed software are all included in the PC as a Service offering. Companies in this space are addressing various independent software vendors (ISVs) to meet the needs of end-user customers. PC as Service subscriptions provide current software upgrades and maintenance at a low cost, allowing businesses to improve productivity and application security flaws.

    Personal Computer as a Service (PCaaS) Vertical Insights

    The personal computer as a service (PCaaS) market segmentation, based on the vertical, includes BFSI, government, education, healthcare & life science, and IT & telecommunication. In 2021, the IT & telecommunications segment had the highest market revenue share. The segment's growth is linked to increased awareness and a shift in the organization's preference toward the OPEX business model. PC as a Service provides proper hardware and software upgrades and maintenance, allowing businesses to reduce costs. It reduces burdens and helps to avoid technological obsolescence, ultimately increasing productivity. Companies operating in this sector face fierce market competition.

    The IT sector drives most digital transformation initiatives in terms of ownership and implementation. The primary disruptor of digital transformation is IT infrastructure. Mainframes gave way to servers, which gave way to networks, which gave way to cloud hosting, which gave way to hybrid environments. The increasing complexity of IT infrastructure necessitates improved PC lifecycle management solutions.

    Get more detailed insights about Personal Computer as a Service (PCaaS) Market Research Report - Global Forecast till 2030

    Regional Insights

    By Region, the study provides market insights into North America, Europe, Asia-Pacific, and the Rest of the World. The North American personal computer as a service (PCaaS) market is expected to grow at a significant CAGR during the study period, accounting for USD 0.051 billion in 2021. This region's service providers, ranging from small businesses to multinational corporations, have extensive experience managing IT infrastructure and operations. The huge demand for PCs in various industries is an aggressive driving force substantiating the region's market growth. Furthermore, the region is also home to key players such as Dell EMC, Microsoft, and others.

    These companies are constantly investing in technological advancement through strategic alliances, R&D, and mergers & acquisitions, which has contributed to them establishing a stronger market position. This sector's service providers, which range from microbusinesses to corporations, have extensive experience managing IT infrastructure and keeping businesses running smoothly.

    Moreover, the major countries covered in the market report include the United States, Germany, Canada, France, the United Kingdom, Italy, Spain, India, Japan, Australia, China, South Korea, and Brazil.

    Figure 3: Personal Computer As A Service (Pcaas) Market Share By Region 2021 (%)

    PERSONAL COMPUTER AS A SERVICE (PCAAS) MARKET SHARE BY REGION 2021Source: Secondary Research, Primary Research, Market Research Future Database and Analyst Review

    The European personal computer as a service (PCaaS) market is the world's second-largest. According to a Twilio poll published in 2020, more than one-third of UK companies and decision-makers admit COVID-19 has prompted them to increase their digital transformation budgets significantly. This contributes to higher costs to meet an organization's expanding digital needs. The same justification motivates businesses to use PCaaS rather than buying computers and other hardware to save money.

    According to CyberCrew, even though 99% of UK citizens own a mobile device, smartphones will never replace desktop and laptop computers, as a typical computer can run more robust software than smartphones. Besides, with the region increasing emphasis on small businesses, the demand for personal computers as services is expected to increase. Further, the UK personal computer as a service (PCaaS) market held the largest market share. The German personal computer as a service (PCaaS) market was the fastest-growing market in the European region.

    The Asia Pacific personal computer as a service (PCaaS) market is expected to grow at the fastest CAGR during the forecast period. The expansion of IT is one of the region's main drivers. Many customers are attracted to the PCaaS market by the affordability of personal computers as a service. As a result of investments made by numerous tech giants and other multinational corporations in developing countries, the personal computer (PC) as a service industry is expected to grow significantly in the Asia-Pacific region.

    Furthermore, the increased use of computers and other technology is expected to fuel the development of the personal computer (PC) as a service market in this region in the coming years. Moreover, China’s personal computer as a service (PCaaS) market held the largest market share. The Indian personal computer as a service (PCaaS) market was the fastest-growing market in Asia-Pacific.

    Key Players and Competitive Insights

    The presence of some key players, including HP, Fujitsu, and AWS, has led to intense competition among the players in the PCaaS market. Their capacity to continuously innovate their products has given them a competitive edge over rivals. Moreover, significant investments in research and development, business alliances, and mergers and acquisitions have facilitated them to expand their market footprint.

    Dell Inc is a technology company based in the United States. It creates, sells, repairs, and maintains computers, services, and products. Dell PC as a Service (PCaaS) streamlines PC management. It integrates hardware, software, full life cycle services, and financing into a single comprehensive solution. Dell Technologies and Microsoft expanded their partnership in April 2019 to address a broader range of customer needs and aid in accelerating digital transformations. The companies wanted to provide a fully native, supported & certified VMware cloud infrastructure on Microsoft Azure, so they worked together to make that happen.

    Furthermore, through cloud-based integration with Microsoft Intune and Azure Active Directory, joint Microsoft 365 & VMware Workspace ONE customers could manage Office 365 across devices.

    CompuCom Systems collaborates with businesses across all industries to provide advanced technological solutions that assist their digital workplaces. In August 2020, CompuCom and Office Depot collaborated to offer small and mid-sized businesses a range of IT hardware and service options to support their remote workplaces. Companies with 50 to 1,500 users can take advantage of various services, such as remote IT support, on-site hardware & software repair, and environmentally friendly IT equipment disposal.

    Key Companies in the PC as a Service Market market include

    Industry Developments

    April 2021: Lenovo's Intelligent Devices Group in North America has created a new device-as-a-service offering tailored to the needs of small and medium-sized businesses.

    June 2019: HP and Xerox Corporation announced their expansion and agreed to collaborate in the Device as a Service market. This collaboration is intended to reach out to small and medium-sized businesses.

    Future Outlook

    PC as a Service Market Future Outlook

    The Global Personal Computer as a Service (PCaaS) Market is projected to grow at a remarkable 38.18% CAGR from 2024 to 2035, driven by increasing demand for flexible IT solutions and remote work capabilities.

    New opportunities lie in:

    • Develop tailored PCaaS solutions for small and medium enterprises to enhance market penetration.
    • Leverage AI and machine learning for predictive maintenance and customer support in PCaaS offerings.
    • Expand global partnerships with telecom providers to bundle PCaaS with connectivity services.

    By 2035, the PCaaS market is expected to be a dominant force in IT services, reflecting substantial growth and innovation.

    Market Segmentation

    Personal Computer as a Service (PCaaS) Regional Outlook

    North America
    • US
    • Canada

    Personal Computer as a Service (PCaaS) Vertical Outlook

    • BFSI
    • Government
    • Education
    • Healthcare & Life Science
    • IT & Telecommunication

    Personal Computer as a Service (PCaaS) Component Outlook

    • Hardware
    • Software

    Personal Computer as a Service (PCaaS) Organization Size Outlook

    • SMEs
    • Large Enterprises

    Report Scope

    Report Attribute/Metric Details
    Market Size 2021 USD 0.12 billion
    Market Size 2022 USD 0.17 billion
    Market Size 2030 USD 2.28 billion
    Compound Annual Growth Rate (CAGR) 44.53% (2022-2030)
    Base Year 2021
    Market Forecast Period 2022-2030
    Historical Data 2018 & 2020
    Market Forecast Units Value (USD Billion)
    Report Coverage Revenue Forecast, Market Competitive Landscape, Growth Factors, and Trends
    Segments Covered Organization Size, Component, Vertical, and Region
    Geographies Covered North America, Europe, Asia Pacific, and the Rest of the World
    Countries Covered The U.S, Canada, Germany, France, the UK, Italy, Spain, China, Japan, India, Australia, South Korea, and Brazil
    Key Companies Profiled HP Development Company (US), Microsoft Corporation (US), Dell Inc. (US), Lenovo (Hong Kong), CompuCom Systems Inc. (US), Capgemini (France), SHI International Corp. (US), Dimension Data (South Africa), Softcat PLC (UK), and Avaya Inc (US)
    Key Market Opportunities Emerging PCaaS adoption in the education sector
    Key Market Dynamics Growing demands from SMEs owing to cost-benefits Increasing adoption of subscription-based models

    Market Highlights

    Author

    Shubham Munde
    Research Analyst Level II

    She holds an experience of about 6+ years in market research and business consulting, working under the spectrum of information communication technology, telecommunications and semiconductor domains. aarti conceptualizes and implements a scalable business strategy and provides strategic leadership to the clients. her expertise lies in market estimation, competitive intelligence, pipeline analysis, customer assessment, etc.

    Leave a Comment

    Latest Comments

    John Doe
    john@example.com

    This is a great article! Really helped me understand the topic better.

    Posted on July 23, 2025, 10:15 AM
    Jane Smith
    jane@domain.com

    Thanks for sharing this. I’ve bookmarked it for later reference.

    Posted on July 22, 2025, 7:45 PM

    FAQs

    How much is the personal computer as a service (PCaaS) market?

    The personal computer as a service (PCaaS) market size was valued at USD 0.12 Billion in 2021.

    What is the growth rate of the personal computer as a service (PCaaS) market?

    The market is projected to grow at a CAGR of 44.53% during the forecast period, 2022-2030.

    Which region held the largest market share in the personal computer as a service (PCaaS) market?

    North America had the largest share of the market.

    Who are the key players in the personal computer as a service (PCaaS) market?

    The key players in the market are HP Development Company (US), Microsoft Corporation (US), Dell Inc. (US), Lenovo (Hong Kong), CompuCom Systems Inc. (US), Capgemini (France), SHI International Corp. (US), Dimension Data (South Africa), Softcat PLC (UK), and Avaya Inc (US).

    Which component led the personal computer as a service (PCaaS) market?

    The software category dominated the market in 2021.

    Which vertical had the largest market share in the personal computer as a service (PCaaS) market?

    In 2021, IT & telecommunication had the largest share of the market.

    1. Executive Summary
      1. Market Attractiveness Analysis 13
        1. Global PC As A Service (PCaaS) Market, By Component 13
        2. Global PC As A Service (PCaaS) Market, By Organization Size 14
        3. Global PC As A Service (PCaaS) Market, By Industry Vertical 14
      2. Global PC As A Service (PCaaS) Market, By Region 15
    2. Market Introduction
      1. Definition 16
      2. Scope of the Study 16
      3. Market Structure 16
    3. Research Methodology
      1. Research Process 17
      2. Primary Research 18
      3. Secondary Research 19
      4. Market Size Estimation 19
      5. Forecast Model 20
      6. List Of Assumptions 21
    4. Market Insights
    5. Market Dynamics
      1. Introduction 24
      2. Drivers 25
        1. Rising Need To Reduce The Capital Expenditure (CapEx) And Operational Expenditure (OpEx) Among Enterprises 25
        2. Adoption Of Contract-Based Services And Solutions By SMEs 26
        3. Drivers Impact Analysis 26
      3. Restraints 27
        1. Adoption Of BYOD And CYOD Policies 27
        2. Lack Of Technical Expertise And Security Concerns 27
        3. Restraints Impact Analysis 27
      4. Opportunities 28
      5. Increasing Adoption Of IoT 28
    6. Market Factor Analysis
      1. Value Chain Analysis 29
        1. Vendors/Service Providers 29
        2. Channel Partners/Value Added Sellers/ Integration Partners 30
        3. End Users 30
      2. Porter’s Five Forces Model 31
        1. Threat Of New Entrants 31
        2. Bargaining Power Of Suppliers 32
        3. Threat Of Substitutes 32
        4. Bargaining Power Of Buyers 32
        5. Competitive Rivalry 32
      3. Technological Trends 32
        1. Virtual Desktop Infrastructure 32
        2. Vendors Launch DaaS For Apple 32
    7. Global PC As A Service (PCaaS) Market, By Component
      1. Overview 33
        1. Hardware 33
        2. Solution (Software) 33
        3. Services 34
    8. Global PC As A Service (PCaaS) Market, By Organization Size
      1. Overview 37
        1. Large Enterprise 37
        2. Small And Medium Enterprise (SMEs) 37
    9. Global PC As A Service (PCaaS) Market, By Industry Vertical
      1. BFSI 39
      2. Healthcare 39
      3. IT & Telecom 39
      4. Retail 39
      5. Manufacturing 40
      6. Education 40
      7. Government 40
      8. Others 40
    10. Global PC As A Service (PCaaS) Market, By Region
      1. Overview 42
      2. North America 44
        1. US 48
        2. Canada 50
        3. Mexico 52
      3. Asia-Pacific 54
        1. China 58
        2. India 60
        3. Japan 62
        4. Rest Of Asia-Pacific 64
      4. Europe 66
        1. UK 70
        2. Germany 72
        3. Rest Of Europe 74
        4. France 76
      5. Middle East And Africa 78
      6. South America 82
    11. Competitive Landscape
      1. Competitive Overview 86
      2. Vendor Share Analysis 87
    12. Company Profiles
      1. HP Development Company, LP 88
        1. Company Overview 88
        2. Financial Overview 89
        3. Products/Services/Solutions Offered 89
        4. Key Developments 90
        5. SWOT Analysis 90
        6. Key Strategies 91
      2. Microsoft Corporation 92
        1. Company Overview 92
        2. Financial Overview 93
        3. Products/Services/Solutions Offered 93
        4. Key Developments 93
        5. SWOT Analysis 94
        6. Key Strategies 94
      3. Dell Inc. 95
        1. Company Overview 95
        2. Financial Overview 96
        3. Products/Services/Solutions Offered 96
        4. Key Developments 97
        5. SWOT Analysis 97
        6. Key Strategies 98
      4. Lenovo 99
        1. Company Overview 99
        2. Financial Overview 100
        3. Products/Services/Solutions Offered 100
        4. Key Developments 100
        5. SWOT Analysis 101
        6. Key Strategies 101
      5. CompuCom Systems, Inc., (Office Depot, Inc.) 102
        1. Company Overview 102
        2. Financial Overview 102
        3. Products/Services/Solutions Offered 102
        4. Key Developments 103
        5. SWOT Analysis 103
        6. Key Strategies 103
      6. Capgemini 104
        1. Company Overview 104
        2. Financial Overview 105
        3. Products/Services/Solutions Offered 105
        4. Key Developments 105
        5. SWOT Analysis 106
        6. Key Strategies 106
      7. SHI International Corp. 107
        1. Company Overview 107
        2. Financial Overview 107
        3. Products/Services/Solutions Offered 107
        4. Key Developments 107
      8. Dimension Data 108
        1. Company Overview 108
        2. Financial Overview 108
        3. Products/Services/Solutions Offered 108
        4. Key Developments 109
        5. SWOT Analysis 109
        6. Key Strategies 109
      9. Softcat PLC 110
        1. Company Overview 110
        2. Financial Overview 110
        3. Products/Services/Solutions Offered 111
        4. Key Developments 111
        5. SWOT Analysis 111
        6. Key Strategies 111
      10. Avaya Inc. 112
        1. Company Overview 112
        2. Financial Overview 113
        3. Products/Services/Solutions Offered 113
        4. Key Developments 113
        5. SWOT Analysis 114
        6. Key Strategies 114
    13. List of Tables and Figures
      1. 13 List Of Tables
      2. TABLE 1 LIST OF ASSUMPTIONS 21
      3. TABLE 2 GLOBAL PC AS A SERVICE (PCAAS) MARKET, BY COMPONENT, 2022-2030 (USD MILLION) 35
      4. TABLE 3 GLOBAL PC AS A SERVICE (PCAAS) MARKET, BY SERVICE, 2022-2030 (USD MILLION) 36
      5. TABLE 4 GLOBAL PC AS A SERVICE (PCAAS) MARKET, BY ORGANIZATION SIZE, 2022-2030 (USD MILLION) 38
      6. TABLE 5 GLOBAL PC AS A SERVICE (PCAAS) MARKET, BY INDUSTRY VERTICAL, 2022-2030 (USD MILLION) 41
      7. TABLE 6 GLOBAL PC AS A SERVICE (PCAAS) MARKET, BY REGION, 2022-2030 (USD MILLION) 43
      8. TABLE 7 NORTH AMERICA: PC AS A SERVICE (PCAAS) MARKET, BY COUNTRY, 2020-2027 (USD MILLION) 44
      9. TABLE 8 NORTH AMERICA: PC AS A SERVICE (PCAAS) MARKET, BY COMPONENT, 2022-2030 (USD MILLION) 45
      10. TABLE 9 NORTH AMERICA: PC AS A SERVICE (PCAAS) MARKET, BY SERVICE, 2022-2030 (USD MILLION) 46
      11. TABLE 10 NORTH AMERICA: PC AS A SERVICE (PCAAS) MARKET, BY ORGANIZATION SIZE, 2022-2030 (USD MILLION) 46
      12. TABLE 11 NORTH AMERICA: PC AS A SERVICE (PCAAS) MARKET, BY INDUSTRY VERTICAL, 2022-2030 (USD MILLION) 47
      13. TABLE 12 US: PC AS A SERVICE (PCAAS) MARKET, BY COMPONENT, 2022-2030 (USD MILLION) 48
      14. TABLE 13 US: PC AS A SERVICE (PCAAS) MARKET, BY SERVICE, 2022-2030 (USD MILLION) 48
      15. TABLE 14 US: PC AS A SERVICE (PCAAS) MARKET, BY ORGANIZATION SIZE, 2022-2030 (USD MILLION) 49
      16. TABLE 15 US: PC AS A SERVICE (PCAAS) MARKET, BY INDUSTRY VERTICAL, 2022-2030 (USD MILLION) 49
      17. TABLE 16 CANADA: PC AS A SERVICE (PCAAS) MARKET, BY COMPONENT, 2022-2030 (USD MILLION) 50
      18. TABLE 17 CANADA: PC AS A SERVICE (PCAAS) MARKET, BY SERVICE, 2022-2030 (USD MILLION) 50
      19. TABLE 18 CANADA: PC AS A SERVICE (PCAAS) MARKET, BY ORGANIZATION SIZE, 2022-2030 (USD MILLION) 51
      20. TABLE 19 CANADA: PC AS A SERVICE (PCAAS) MARKET, BY INDUSTRY VERTICAL, 2022-2030 (USD MILLION) 51
      21. TABLE 20 MEXICO: PC AS A SERVICE (PCAAS) MARKET, BY COMPONENT, 2022-2030 (USD MILLION) 52
      22. TABLE 21 MEXICO: PC AS A SERVICE (PCAAS) MARKET, BY SERVICE, 2022-2030 (USD MILLION) 52
      23. TABLE 22 MEXICO: PC AS A SERVICE (PCAAS) MARKET, BY ORGANIZATION SIZE, 2022-2030 (USD MILLION) 53
      24. TABLE 23 MEXICO: PC AS A SERVICE (PCAAS) MARKET, BY INDUSTRY VERTICAL, 2022-2030 (USD MILLION) 53
      25. TABLE 24 ASIA-PACIFIC: PC AS A SERVICE (PCAAS) MARKET, BY COUNTRY, 2020-2027 (USD MILLION) 54
      26. TABLE 25 ASIA-PACIFIC: PC AS A SERVICE (PCAAS) MARKET, BY COMPONENT, 2022-2030 (USD MILLION) 55
      27. TABLE 26 ASIA-PACIFIC: PC AS A SERVICE (PCAAS) MARKET, BY SERVICE, 2022-2030 (USD MILLION) 56
      28. TABLE 27 ASIA-PACIFIC: PC AS A SERVICE (PCAAS) MARKET, BY ORGANIZATION SIZE, 2022-2030 (USD MILLION) 56
      29. TABLE 28 ASIA-PACIFIC: PC AS A SERVICE (PCAAS) MARKET, BY INDUSTRY VERTICAL, 2022-2030 (USD MILLION) 57
      30. TABLE 29 CHINA: PC AS A SERVICE (PCAAS) MARKET, BY COMPONENT, 2022-2030 (USD MILLION) 58
      31. TABLE 30 CHINA: PC AS A SERVICE (PCAAS) MARKET, BY SERVICE, 2022-2030 (USD MILLION) 58
      32. TABLE 31 CHINA: PC AS A SERVICE (PCAAS) MARKET, BY ORGANIZATION SIZE, 2022-2030 (USD MILLION) 59
      33. TABLE 32 CHINA: PC AS A SERVICE (PCAAS) MARKET, BY INDUSTRY VERTICAL, 2022-2030 (USD MILLION) 59
      34. TABLE 33 INDIA: PC AS A SERVICE (PCAAS) MARKET, BY COMPONENT, 2022-2030 (USD MILLION) 60
      35. TABLE 34 INDIA: PC AS A SERVICE (PCAAS) MARKET, BY SERVICE, 2022-2030 (USD MILLION) 60
      36. TABLE 35 INDIA: PC AS A SERVICE (PCAAS) MARKET, BY ORGANIZATION SIZE, 2022-2030 (USD MILLION) 61
      37. TABLE 36 INDIA: PC AS A SERVICE (PCAAS) MARKET, BY INDUSTRY VERTICAL, 2022-2030 (USD MILLION) 61
      38. TABLE 37 JAPAN: PC AS A SERVICE (PCAAS) MARKET, BY COMPONENT, 2022-2030 (USD MILLION) 62
      39. TABLE 38 JAPAN: PC AS A SERVICE (PCAAS) MARKET, BY SERVICE, 2022-2030 (USD MILLION) 62
      40. TABLE 39 JAPAN: PC AS A SERVICE (PCAAS) MARKET, BY ORGANIZATION SIZE, 2022-2030 (USD MILLION) 63
      41. TABLE 40 JAPAN: PC AS A SERVICE (PCAAS) MARKET, BY INDUSTRY VERTICAL, 2022-2030 (USD MILLION) 63
      42. TABLE 41 REST OF ASIA-PACIFIC: PC AS A SERVICE (PCAAS) MARKET, BY COMPONENT, 2022-2030 (USD MILLION) 64
      43. TABLE 42 REST OF ASIA-PACIFIC: PC AS A SERVICE (PCAAS) MARKET, BY SERVICE, 2022-2030 (USD MILLION) 64
      44. TABLE 43 REST OF ASIA-PACIFIC: PC AS A SERVICE (PCAAS) MARKET, BY ORGANIZATION SIZE, 2022-2030 (USD MILLION) 65
      45. TABLE 44 REST OF ASIA-PACIFIC: PC AS A SERVICE (PCAAS) MARKET, BY INDUSTRY VERTICAL, 2022-2030 (USD MILLION) 65
      46. TABLE 45 EUROPE: PC AS A SERVICE (PCAAS) MARKET, BY COUNTRY, 2020-2027 (USD MILLION) 66
      47. TABLE 46 EUROPE: PC AS A SERVICE (PCAAS) MARKET, BY COMPONENT, 2022-2030 (USD MILLION) 67
      48. TABLE 47 EUROPE: PC AS A SERVICE (PCAAS) MARKET, BY SERVICE, 2022-2030 (USD MILLION) 68
      49. TABLE 48 EUROPE: PC AS A SERVICE (PCAAS) MARKET, BY ORGANIZATION SIZE, 2022-2030 (USD MILLION) 68
      50. TABLE 49 EUROPE: PC AS A SERVICE (PCAAS) MARKET, BY INDUSTRY VERTICAL, 2022-2030 (USD MILLION) 69
      51. TABLE 50 UK: PC AS A SERVICE (PCAAS) MARKET, BY COMPONENT, 2022-2030 (USD MILLION) 70
      52. TABLE 51 UK: PC AS A SERVICE (PCAAS) MARKET, BY SERVICE, 2022-2030 (USD MILLION) 70
      53. TABLE 52 UK: PC AS A SERVICE (PCAAS) MARKET, BY ORGANIZATION SIZE, 2022-2030 (USD MILLION) 71
      54. TABLE 53 UK: PC AS A SERVICE (PCAAS) MARKET, BY INDUSTRY VERTICAL, 2022-2030 (USD MILLION) 71
      55. TABLE 54 GERMANY: PC AS A SERVICE (PCAAS) MARKET, BY COMPONENT, 2022-2030 (USD MILLION) 72
      56. TABLE 55 GERMANY: PC AS A SERVICE (PCAAS) MARKET, BY SERVICE, 2022-2030 (USD MILLION) 72
      57. TABLE 56 GERMANY: PC AS A SERVICE (PCAAS) MARKET, BY ORGANIZATION SIZE, 2022-2030 (USD MILLION) 73
      58. TABLE 57 GERMANY: PC AS A SERVICE (PCAAS) MARKET, BY INDUSTRY VERTICAL, 2022-2030 (USD MILLION) 73
      59. TABLE 58 REST OF EUROPE: PC AS A SERVICE (PCAAS) MARKET, BY COMPONENT, 2022-2030 (USD MILLION) 74
      60. TABLE 59 REST OF EUROPE: PC AS A SERVICE (PCAAS) MARKET, BY SERVICE, 2022-2030 (USD MILLION) 74
      61. TABLE 60 REST OF EUROPE: PC AS A SERVICE (PCAAS) MARKET, BY ORGANIZATION SIZE, 2022-2030 (USD MILLION) 75
      62. TABLE 61 REST OF EUROPE: PC AS A SERVICE (PCAAS) MARKET, BY INDUSTRY VERTICAL, 2022-2030 (USD MILLION) 75
      63. TABLE 62 FRANCE: PC AS A SERVICE (PCAAS) MARKET, BY COMPONENT, 2022-2030 (USD MILLION) 76
      64. TABLE 63 FRANCE: PC AS A SERVICE (PCAAS) MARKET, BY SERVICE, 2022-2030 (USD MILLION) 76
      65. TABLE 64 FRANCE: PC AS A SERVICE (PCAAS) MARKET, BY ORGANIZATION SIZE, 2022-2030 (USD MILLION) 77
      66. TABLE 65 FRANCE: PC AS A SERVICE (PCAAS) MARKET, BY INDUSTRY VERTICAL, 2022-2030 (USD MILLION) 77
      67. TABLE 66 MIDDLE EAST AND AFRICA: PC AS A SERVICE (PCAAS) MARKET, BY COMPONENT, 2022-2030 (USD MILLION) 78
      68. TABLE 67 MIDDLE EAST AND AFRICA: PC AS A SERVICE (PCAAS) MARKET, BY SERVICE, 2022-2030 (USD MILLION) 79
      69. TABLE 68 MIDDLE EAST AND AFRICA: PC AS A SERVICE (PCAAS) MARKET, BY ORGANIZATION SIZE, 2022-2030 (USD MILLION) 80
      70. TABLE 69 MIDDLE EAST AND AFRICA: PC AS A SERVICE (PCAAS) MARKET, BY INDUSTRY VERTICAL, 2022-2030 (USD MILLION) 81
      71. TABLE 70 SOUTH AMERICA: PC AS A SERVICE (PCAAS) MARKET, BY COMPONENT, 2022-2030 (USD MILLION) 82
      72. TABLE 71 SOUTH AMERICA: PC AS A SERVICE (PCAAS) MARKET, BY SERVICE, 2022-2030 (USD MILLION) 83
      73. TABLE 72 SOUTH AMERICA: PC AS A SERVICE (PCAAS) MARKET, BY ORGANIZATION SIZE, 2022-2030 (USD MILLION) 84
      74. TABLE 73 SOUTH AMERICA: PC AS A SERVICE (PCAAS) MARKET, BY INDUSTRY VERTICAL, 2022-2030 (USD MILLION) 85   14 List Of Figures
      75. FIGURE 1 MARKET SYNOPSIS 12
      76. FIGURE 2 MARKET ATTRACTIVENESS ANALYSIS: GLOBAL PC AS A SERVICE (PCAAS) MARKET 13
      77. FIGURE 3 GLOBAL PC AS A SERVICE (PCAAS) MARKET ANALYSIS BY COMPONENT, 2020-2027 (USD MILLION) 13
      78. FIGURE 4 GLOBAL PC AS A SERVICE (PCAAS) MARKET ANALYSIS BY ORGANIZATION SIZE, 2020-2027 (USD MILLION) 14
      79. FIGURE 5 GLOBAL PC AS A SERVICE (PCAAS) MARKET ANALYSIS BY INDUSTRY VERTICAL, 2020-2027 (USD MILLION) 14
      80. FIGURE 6 GLOBAL PC AS A SERVICE (PCAAS) MARKET ANALYSIS BY REGION, 2020 (%) 15
      81. FIGURE 7 GLOBAL PC AS A SERVICE (PCAAS) MARKET: MARKET STRUCTURE 16
      82. FIGURE 8 RESEARCH PROCESS OF MRFR 17
      83. FIGURE 9 TOP DOWN & BOTTOM UP APPROACH 20
      84. FIGURE 10 NORTH AMERICA MARKET SIZE & MARKET SHARE BY COUNTRY (2020 VS 2027) 22
      85. FIGURE 11 ASIA-PACIFIC MARKET SIZE & MARKET SHARE BY COUNTRY (2020 VS 2027) 22
      86. FIGURE 12 EUROPE MARKET SIZE & MARKET SHARE BY COUNTRY (2020 VS 2027) 23
      87. FIGURE 13 DROC ANALYSIS OF GLOBAL PC AS A SERVICE (PCAAS) MARKET 24
      88. FIGURE 14 TOP FACTORS LEADING TO IT BUDGET INCREASES IN 2019 25
      89. FIGURE 15 DRIVERS IMPACT ANALYSIS: PC AS A SERVICE (PCAAS) MARKET 26
      90. FIGURE 16 RESTRAINTS IMPACT ANALYSIS: PC AS A SERVICE (PCAAS) MARKET 27
      91. FIGURE 17 IOT DEVICES CONNECTED IN 2020 AND 2025 28
      92. FIGURE 18 VALUE CHAIN: GLOBAL PC AS A SERVICE (PCAAS) MARKET 29
      93. FIGURE 21 GLOBAL PC AS A SERVICE (PCAAS) MARKET, BY COMPONENT, 2022-2030 (USD MILLION) 35
      94. FIGURE 22 GLOBAL PC AS A SERVICE (PCAAS) MARKET, BY SERVICE, 2022-2030 (USD MILLION) 35
      95. FIGURE 23 INCREASE IN IT REVENUE BY ORGANIZATION SIZE IN NORTH AMERICA AND EUROPE 37
      96. FIGURE 24 GLOBAL PC AS A SERVICE (PCAAS) MARKET, BY ORGANIZATION SIZE, 2022-2030 (USD MILLION) 38
      97. FIGURE 25 GLOBAL PC AS A SERVICE (PCAAS) MARKET, BY INDUSTRY VERTICAL, 2022-2030 (USD MILLION) 41
      98. FIGURE 26 GLOBAL PC AS A SERVICE (PCAAS) MARKET, BY REGION, 2022-2030 (USD MILLION) 42
      99. FIGURE 27 NORTH AMERICA: PC AS A SERVICE (PCAAS) MARKET, BY COUNTRY, 2020 – 2027 (USD MILLION) 44
      100. FIGURE 28 NORTH AMERICA: PC AS A SERVICE (PCAAS) MARKET, BY COMPONENT, 2022-2030 (USD MILLION) 45
      101. FIGURE 29 NORTH AMERICA: PC AS A SERVICE (PCAAS) MARKET, BY SERVICE, 2022-2030 (USD MILLION) 45
      102. FIGURE 30 NORTH AMERICA: PC AS A SERVICE (PCAAS) MARKET SHARE, BY ORGANIZATION SIZE, 2022-2030 (USD MILLION) 46
      103. FIGURE 31 NORTH AMERICA: PC AS A SERVICE (PCAAS) MARKET, BY INDUSTRY VERTICAL, 2022-2030 (USD MILLION) 47
      104. FIGURE 32 ASIA-PACIFIC: PC AS A SERVICE (PCAAS) MARKET, BY COUNTRY, 2020 – 2027 (USD MILLION) 54
      105. FIGURE 33 ASIA-PACIFIC: PC AS A SERVICE (PCAAS) MARKET, BY COMPONENT, 2022-2030 (USD MILLION) 55
      106. FIGURE 34 ASIA-PACIFIC: PC AS A SERVICE (PCAAS) MARKET, BY SERVICE, 2022-2030 (USD MILLION) 55
      107. FIGURE 35 ASIA-PACIFIC: PC AS A SERVICE (PCAAS) MARKET SHARE, BY ORGANIZATION SIZE, 2022-2030 (USD MILLION) 56
      108. FIGURE 36 ASIA-PACIFIC: PC AS A SERVICE (PCAAS) MARKET, BY INDUSTRY VERTICAL, 2022-2030 (USD MILLION) 57
      109. FIGURE 37 EUROPE: PC AS A SERVICE (PCAAS) MARKET, BY COUNTRY, 2020 – 2027 (USD MILLION) 66
      110. FIGURE 38 EUROPE: PC AS A SERVICE (PCAAS) MARKET, BY COMPONENT, 2022-2030 (USD MILLION) 67
      111. FIGURE 39 EUROPE: PC AS A SERVICE (PCAAS) MARKET, BY SERVICE, 2022-2030 (USD MILLION) 67
      112. FIGURE 40 EUROPE: PC AS A SERVICE (PCAAS) MARKET SHARE, BY ORGANIZATION SIZE, 2022-2030 (USD MILLION) 68
      113. FIGURE 41 EUROPE: PC AS A SERVICE (PCAAS) MARKET, BY INDUSTRY VERTICAL, 2022-2030 (USD MILLION) 69
      114. FIGURE 42 MIDDLE EAST AND AFRICA: PC AS A SERVICE (PCAAS) MARKET, BY COMPONENT, 2022-2030 (USD MILLION) 78
      115. FIGURE 43 MIDDLE EAST AND AFRICA: PC AS A SERVICE (PCAAS) MARKET, BY SERVICE, 2022-2030 (USD MILLION) 79
      116. FIGURE 44 MIDDLE EAST AND AFRICA: PC AS A SERVICE (PCAAS) MARKET SHARE, BY ORGANIZATION SIZE, 2022-2030 (USD MILLION) 79
      117. FIGURE 45 MIDDLE EAST AND AFRICA: PC AS A SERVICE (PCAAS) MARKET, BY INDUSTRY VERTICAL, 2022-2030 (USD MILLION) 80
      118. FIGURE 46 SOUTH AMERICA: PC AS A SERVICE (PCAAS) MARKET, BY COMPONENT, 2022-2030 (USD MILLION) 82
      119. FIGURE 47 SOUTH AMERICA: PC AS A SERVICE (PCAAS) MARKET, BY SERVICE, 2022-2030 (USD MILLION) 83
      120. FIGURE 48 SOUTH AMERICA: PC AS A SERVICE (PCAAS) MARKET SHARE, BY ORGANIZATION SIZE, 2022-2030 (USD MILLION) 83
      121. FIGURE 49 SOUTH AMERICA: PC AS A SERVICE (PCAAS) MARKET, BY INDUSTRY VERTICAL, 2022-2030 (USD MILLION) 84
      122. FIGURE 50 VENDOR SHARE ANALYSIS IN 2020 87

    Personal Computer as a Service (PCaaS) Market Segmentation

    Personal Computer as a Service (PCaaS) Organization Size Outlook (USD Billion, 2018-2030)

    • SMEs
    • Large Enterprises)

    Personal Computer as a Service (PCaaS) Component Outlook (USD Billion, 2018-2030)

    • Hardware
    • Software

    Personal Computer as a Service (PCaaS) Vertical Outlook (USD Billion, 2018-2030)

    • BFSI
    • Government
    • Education
    • Healthcare & Life Science
    • IT & Telecommunication

    Personal Computer as a Service (PCaaS) Regional Outlook (USD Billion, 2018-2030)

    • North America Outlook (USD Billion, 2018-2030)

    Personal Computer as a Service (PCaaS) Organization Size Outlook (USD Billion, 2018-2030)

    • SMEs
    • Large Enterprises)

    Personal Computer as a Service (PCaaS) Component Outlook (USD Billion, 2018-2030)

    • Hardware
    • Software

    Personal Computer as a Service (PCaaS) Vertical Outlook (USD Billion, 2018-2030)

    • BFSI
    • Government
    • Education
    • Healthcare & Life Science
    • IT & Telecommunication
      • US Outlook (USD Billion, 2018-2030)

    Personal Computer as a Service (PCaaS) Organization Size Outlook (USD Billion, 2018-2030)

    • SMEs
    • Large Enterprises)

    Personal Computer as a Service (PCaaS) Component Outlook (USD Billion, 2018-2030)

    • Hardware
    • Software

    Personal Computer as a Service (PCaaS) Vertical Outlook (USD Billion, 2018-2030)

    • BFSI
    • Government
    • Education
    • Healthcare & Life Science
    • IT & Telecommunication
      • CANADA Outlook (USD Billion, 2018-2030)

    Personal Computer as a Service (PCaaS) Organization Size Outlook (USD Billion, 2018-2030)

    • SMEs
    • Large Enterprises)

    Personal Computer as a Service (PCaaS) Component Outlook (USD Billion, 2018-2030)

    • Hardware
    • Software

    Personal Computer as a Service (PCaaS) Vertical Outlook (USD Billion, 2018-2030)

    • BFSI
    • Government
    • Education
    • Healthcare & Life Science
    • IT & Telecommunication
    • Europe Outlook (USD Billion, 2018-2030)

    Personal Computer as a Service (PCaaS) Organization Size Outlook (USD Billion, 2018-2030)

    • SMEs
    • Large Enterprises)

    Personal Computer as a Service (PCaaS) Component Outlook (USD Billion, 2018-2030)

    • Hardware
    • Software

    Personal Computer as a Service (PCaaS) Vertical Outlook (USD Billion, 2018-2030)

    • BFSI
    • Government
    • Education
    • Healthcare & Life Science
    • IT & Telecommunication
      • Germany Outlook (USD Billion, 2018-2030)

    Personal Computer as a Service (PCaaS) Organization Size Outlook (USD Billion, 2018-2030)

    • SMEs
    • Large Enterprises)

    Personal Computer as a Service (PCaaS) Component Outlook (USD Billion, 2018-2030)

    • Hardware
    • Software

    Personal Computer as a Service (PCaaS) Vertical Outlook (USD Billion, 2018-2030)

    • BFSI
    • Government
    • Education
    • Healthcare & Life Science
    • IT & Telecommunication
      • France Outlook (USD Billion, 2018-2030)

    Personal Computer as a Service (PCaaS) Organization Size Outlook (USD Billion, 2018-2030)

    • SMEs
    • Large Enterprises)

    Personal Computer as a Service (PCaaS) Component Outlook (USD Billion, 2018-2030)

    • Hardware
    • Software

    Personal Computer as a Service (PCaaS) Vertical Outlook (USD Billion, 2018-2030)

    • BFSI
    • Government
    • Education
    • Healthcare & Life Science
    • IT & Telecommunication
      • UK Outlook (USD Billion, 2018-2030)

    Personal Computer as a Service (PCaaS) Organization Size Outlook (USD Billion, 2018-2030)

    • SMEs
    • Large Enterprises)

    Personal Computer as a Service (PCaaS) Component Outlook (USD Billion, 2018-2030)

    • Hardware
    • Software

    Personal Computer as a Service (PCaaS) Vertical Outlook (USD Billion, 2018-2030)

    • BFSI
    • Government
    • Education
    • Healthcare & Life Science
    • IT & Telecommunication
      • ITALY Outlook (USD Billion, 2018-2030)

    Personal Computer as a Service (PCaaS) Organization Size Outlook (USD Billion, 2018-2030)

    • SMEs
    • Large Enterprises)

    Personal Computer as a Service (PCaaS) Component Outlook (USD Billion, 2018-2030)

    • Hardware
    • Software

    Personal Computer as a Service (PCaaS) Vertical Outlook (USD Billion, 2018-2030)

    • BFSI
    • Government
    • Education
    • Healthcare & Life Science
    • IT & Telecommunication
      • SPAIN Outlook (USD Billion, 2018-2030)

    Personal Computer as a Service (PCaaS) Organization Size Outlook (USD Billion, 2018-2030)

    • SMEs
    • Large Enterprises)

    Personal Computer as a Service (PCaaS) Component Outlook (USD Billion, 2018-2030)

    • Hardware
    • Software

    Personal Computer as a Service (PCaaS) Vertical Outlook (USD Billion, 2018-2030)

    • BFSI
    • Government
    • Education
    • Healthcare & Life Science
    • IT & Telecommunication
      • Rest Of Europe Outlook (USD Billion, 2018-2030)

    Personal Computer as a Service (PCaaS) Organization Size Outlook (USD Billion, 2018-2030)

    • SMEs
    • Large Enterprises)

    Personal Computer as a Service (PCaaS) Component Outlook (USD Billion, 2018-2030)

    • Hardware
    • Software

    Personal Computer as a Service (PCaaS) Vertical Outlook (USD Billion, 2018-2030)

    • BFSI
    • Government
    • Education
    • Healthcare & Life Science
    • IT & Telecommunication
    • Asia-Pacific Outlook (USD Billion, 2018-2030)

    Personal Computer as a Service (PCaaS) Organization Size Outlook (USD Billion, 2018-2030)

    • SMEs
    • Large Enterprises)

    Personal Computer as a Service (PCaaS) Component Outlook (USD Billion, 2018-2030)

    • Hardware
    • Software

    Personal Computer as a Service (PCaaS) Vertical Outlook (USD Billion, 2018-2030)

    • BFSI
    • Government
    • Education
    • Healthcare & Life Science
    • IT & Telecommunication
      • China Outlook (USD Billion, 2018-2030)

    Personal Computer as a Service (PCaaS) Organization Size Outlook (USD Billion, 2018-2030)

    • SMEs
    • Large Enterprises)

    Personal Computer as a Service (PCaaS) Component Outlook (USD Billion, 2018-2030)

    • Hardware
    • Software

    Personal Computer as a Service (PCaaS) Vertical Outlook (USD Billion, 2018-2030)

    • BFSI
    • Government
    • Education
    • Healthcare & Life Science
    • IT & Telecommunication
      • Japan Outlook (USD Billion, 2018-2030)

    Personal Computer as a Service (PCaaS) Organization Size Outlook (USD Billion, 2018-2030)

    • SMEs
    • Large Enterprises)

    Personal Computer as a Service (PCaaS) Component Outlook (USD Billion, 2018-2030)

    • Hardware
    • Software

    Personal Computer as a Service (PCaaS) Vertical Outlook (USD Billion, 2018-2030)

    • BFSI
    • Government
    • Education
    • Healthcare & Life Science
    • IT & Telecommunication
      • India Outlook (USD Billion, 2018-2030)

    Personal Computer as a Service (PCaaS) Organization Size Outlook (USD Billion, 2018-2030)

    • SMEs
    • Large Enterprises)

    Personal Computer as a Service (PCaaS) Component Outlook (USD Billion, 2018-2030)

    • Hardware
    • Software

    Personal Computer as a Service (PCaaS) Vertical Outlook (USD Billion, 2018-2030)

    • BFSI
    • Government
    • Education
    • Healthcare & Life Science
    • IT & Telecommunication
      • Australia Outlook (USD Billion, 2018-2030)

    Personal Computer as a Service (PCaaS) Organization Size Outlook (USD Billion, 2018-2030)

    • SMEs
    • Large Enterprises)

    Personal Computer as a Service (PCaaS) Component Outlook (USD Billion, 2018-2030)

    • Hardware
    • Software

    Personal Computer as a Service (PCaaS) Vertical Outlook (USD Billion, 2018-2030)

    • BFSI
    • Government
    • Education
    • Healthcare & Life Science
    • IT & Telecommunication
      • Rest of Asia-Pacific Outlook (USD Billion, 2018-2030)

    Personal Computer as a Service (PCaaS) Organization Size Outlook (USD Billion, 2018-2030)

    • SMEs
    • Large Enterprises)

    Personal Computer as a Service (PCaaS) Component Outlook (USD Billion, 2018-2030)

    • Hardware
    • Software

    Personal Computer as a Service (PCaaS) Vertical Outlook (USD Billion, 2018-2030)

    • BFSI
    • Government
    • Education
    • Healthcare & Life Science
    • IT & Telecommunication
    • Rest of the World Outlook (USD Billion, 2018-2030)

    Personal Computer as a Service (PCaaS) Organization Size Outlook (USD Billion, 2018-2030)

    • SMEs
    • Large Enterprises)

    Personal Computer as a Service (PCaaS) Component Outlook (USD Billion, 2018-2030)

    • Hardware
    • Software

    Personal Computer as a Service (PCaaS) Vertical Outlook (USD Billion, 2018-2030)

    • BFSI
    • Government
    • Education
    • Healthcare & Life Science
    • IT & Telecommunication
      • Middle East Outlook (USD Billion, 2018-2030)

    Personal Computer as a Service (PCaaS) Organization Size Outlook (USD Billion, 2018-2030)

    • SMEs
    • Large Enterprises)

    Personal Computer as a Service (PCaaS) Component Outlook (USD Billion, 2018-2030)

    • Hardware
    • Software

    Personal Computer as a Service (PCaaS) Vertical Outlook (USD Billion, 2018-2030)

    • BFSI
    • Government
    • Education
    • Healthcare & Life Science
    • IT & Telecommunication
      • Africa Outlook (USD Billion, 2018-2030)

    Personal Computer as a Service (PCaaS) Organization Size Outlook (USD Billion, 2018-2030)

    • SMEs
    • Large Enterprises)

    Personal Computer as a Service (PCaaS) Component Outlook (USD Billion, 2018-2030)

    • Hardware
    • Software

    Personal Computer as a Service (PCaaS) Vertical Outlook (USD Billion, 2018-2030)

    • BFSI
    • Government
    • Education
    • Healthcare & Life Science
    • IT & Telecommunication
      • Latin America Outlook (USD Billion, 2018-2030)

    Personal Computer as a Service (PCaaS) Organization Size Outlook (USD Billion, 2018-2030)

    • SMEs
    • Large Enterprises)

    Personal Computer as a Service (PCaaS) Component Outlook (USD Billion, 2018-2030)

    • Hardware
    • Software

    Personal Computer as a Service (PCaaS) Vertical Outlook (USD Billion, 2018-2030)

    • BFSI
    • Government
    • Education
    • Healthcare & Life Science
    • IT & Telecommunication
    Infographic

    Free Sample Request

    Kindly complete the form below to receive a free sample of this Report

    Get Free Sample

    Customer Strories

    “I am very pleased with how market segments have been defined in a relevant way for my purposes (such as "Portable Freezers & refrigerators" and "last-mile"). In general the report is well structured. Thanks very much for your efforts.”

    Victoria Milne

    Founder
    Case Study
    Chemicals and Materials