• Cat-intel
  • MedIntelliX
  • Resources
  • About Us
  • Hero Background
    English
    Chinese
    French
    Japanese
    Korean
    German
    Spanish

    Inspection Analysis Device Market Share

    ID: MRFR/SEM/10200-CR
    188 Pages
    Shubham Munde
    August 2023

    Inspection Analysis Device Market Research Report Information By Type (Industrial CT, 3D Scanner, CMM, Machine Vision, SEM, and TEM), By Industry Vertical (Automotive & Transportation, Semiconductor & Electronics, Metal & Materials, Machinery & Equipment, Aerospace & Defense, Medical & Pharmaceutical, Energy & Power, Others), and By Region (North America, Europe, Asi...

    Share:
    Download PDF ×

    We do not share your information with anyone. However, we may send you emails based on your report interest from time to time. You may contact us at any time to opt-out.

    Inspection Analysis Device Market Infographic
    $ 4,950.0
    $ 5,950.0
    $ 7,250.0

    Market Share

    Inspection Analysis Device Market Share Analysis

    In the highly competitive landscape of the inspection analysis device market, companies employ various market share positioning strategies to establish their presence, differentiate their offerings, and gain a competitive edge. One common strategy is product differentiation, where companies aim to distinguish their inspection devices from competitors by emphasizing unique features, performance capabilities, or technological innovations. By offering specialized solutions tailored to specific industry needs or applications, companies can attract customers seeking advanced functionalities or superior performance.

    Additionally, pricing strategies play a crucial role in market share positioning. Some companies opt for a cost leadership approach, offering inspection devices at competitive prices to capture market share through affordability and value proposition. Others may adopt a premium pricing strategy, positioning their products as high-end solutions with advanced features and superior quality, targeting customers willing to pay a premium for top-of-the-line performance or reliability.

    Furthermore, market segmentation is a key strategy for companies seeking to carve out a niche and target specific customer segments within the inspection analysis device market. By identifying and focusing on niche markets with unique needs or requirements, companies can tailor their products and marketing efforts to effectively address the preferences and challenges of targeted customer segments, thereby gaining a competitive advantage and maximizing market share in specialized areas.

    Moreover, distribution and channel management strategies play a crucial role in market share positioning. Companies may leverage a mix of direct sales, partnerships, distribution agreements, and online channels to expand their reach and penetrate new markets effectively. By establishing strong distribution networks and strategic partnerships with distributors, resellers, or OEMs, companies can increase their market presence and gain access to new customers and market segments.

    Additionally, brand building and reputation management are essential components of market share positioning strategies in the inspection analysis device market. Companies invest in building strong brand identities and cultivating positive reputations through quality assurance, customer support, and after-sales service. A strong brand image can differentiate companies from competitors, instill trust and confidence in customers, and contribute to long-term customer loyalty and market share growth.

    Furthermore, innovation and product development are critical drivers of market share positioning in the inspection analysis device market. Companies continuously invest in research and development to introduce new technologies, features, and functionalities that address emerging customer needs, industry trends, and regulatory requirements. By staying at the forefront of technological advancements, companies can maintain a competitive advantage, attract new customers, and retain market share in a rapidly evolving market landscape.

    Additionally, strategic alliances, mergers, and acquisitions are key market share positioning strategies employed by companies in the inspection analysis device market. Collaborations with industry partners, technology providers, or research institutions enable companies to access complementary capabilities, resources, and expertise, accelerate innovation, and expand market reach. Mergers and acquisitions allow companies to consolidate market share, achieve economies of scale, and strengthen their competitive position through increased market presence and enhanced product offerings.

    Market Summary

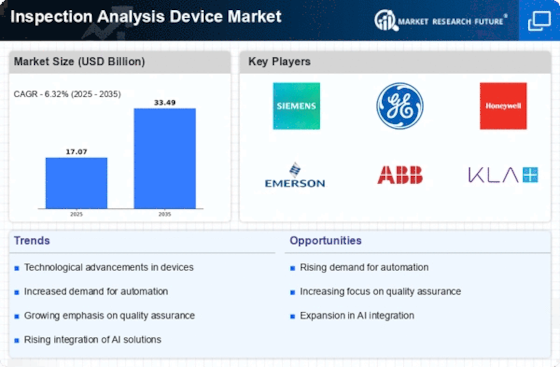
    The Global Inspection Analysis Device Market is projected to grow from 17.07 USD Billion in 2024 to 33.49 USD Billion by 2035.

    Key Market Trends & Highlights

    Inspection Analysis Device Key Trends and Highlights

    • The market is expected to experience a compound annual growth rate (CAGR) of 6.32 percent from 2025 to 2035.
    • By 2035, the market valuation is anticipated to reach 33.5 USD Billion, indicating robust growth opportunities.
    • in 2024, the market is valued at 17.07 USD Billion, reflecting a strong foundation for future expansion.
    • Growing adoption of advanced inspection technologies due to increasing regulatory compliance is a major market driver.

    Market Size & Forecast

    2024 Market Size 17.07 (USD Billion)
    2035 Market Size 33.49 (USD Billion)
    CAGR (2025-2035) 6.32%
    Largest Regional Market Share in 2024 latin_america)

    Major Players

    Carl Zeiss AG, Hitachi High-Technologies Corporation, Nikon Metrology NV, Hexagon AB, Omron Corporation, Bruker Corporation, Cognex Corporation, Keyence Corporation, Perceptron Inc., Olympus Corporation, Shimadzu Corporation, Thermo Fisher Scientific Inc., Zetec Inc., Ametek Inc., Hamamatsu Photonics K.K.

    Market Trends

    Increasing Demand for High-Quality and Safe Products.

    The increasing demand for high-quality and safe products has driven the growth of the inspection analysis device market. Inspection analysis devices play a crucial role in ensuring that products meet stringent quality and safety standards. There are several factors that explain why the demand for inspection analysis devices is increasing. Consumer expectations have risen significantly. Today's consumers are more knowledgeable, discerning, and conscious about the products they use. They expect products to be safe, reliable, and of high quality. Any compromise in product quality or safety can lead to negative reviews, loss of trust, and reduced demand.

    Inspection analysis devices provide companies with the necessary tools to thoroughly inspect and analyze products, ensuring that they meet the highest quality and safety standards, and meet increasing consumer expectations.

    Moreover, regulatory requirements and compliance have become more stringent across various industries. Regulatory bodies impose strict regulations and standards to ensure that products are safe for consumers and comply with industry-specific requirements. Companies need to invest in inspection analysis devices to ensure compliance with these regulations, avoid fines, penalties, and recalls, and maintain their reputation. In addition, industry-specific standards and certifications are gaining more prominence. Many industries have their own standards and certifications that require products to meet certain quality and safety criteria.

    For instance, in the pharmaceutical industry, Good Manufacturing Practices (GMP) and Current Good Manufacturing Practices (cGMP) are crucial for product quality and safety. Inspection analysis devices provide the necessary capabilities to conduct thorough inspections and analyses as per these industry-specific standards, driving the demand for these devices. Furthermore, product liability and litigation risks are significant concerns for companies. Product recalls, lawsuits, and compensation claims can result in substantial financial losses and reputational damage.

    Inspection analysis devices can help companies ensure that their products meet quality and safety standards, reducing the risk of defective products reaching the market and mitigating the potential for product liability and litigation risks.

    The ongoing advancements in technology and increasing regulatory standards are driving the demand for sophisticated inspection analysis devices across various industries, enhancing quality control and safety measures.

    U.S. Department of Commerce

    Inspection Analysis Device Market Market Drivers

    Market Growth Charts

    Regulatory Compliance

    Stringent regulatory frameworks across various industries drive the Global Inspection Analysis Device Market Industry. Governments worldwide are enforcing regulations to ensure product safety and quality, particularly in sectors such as food and pharmaceuticals. Compliance with these regulations necessitates the use of advanced inspection devices, which can accurately assess product integrity and safety. As industries strive to meet these regulatory requirements, the demand for inspection analysis devices is expected to rise, contributing to a projected market growth to 33.5 USD Billion by 2035. This trend underscores the critical role of inspection devices in maintaining compliance and ensuring consumer safety.

    Market Growth Projections

    The Global Inspection Analysis Device Market Industry is poised for substantial growth, with projections indicating a market value of 17.1 USD Billion in 2024 and an expected increase to 33.5 USD Billion by 2035. This growth trajectory suggests a compound annual growth rate (CAGR) of 6.32% from 2025 to 2035. Factors contributing to this expansion include technological advancements, increased regulatory compliance, and the rising demand for quality assurance across various sectors. As industries continue to prioritize inspection and analysis to enhance operational efficiency and product quality, the market is likely to witness sustained growth in the coming years.

    Technological Advancements

    The Global Inspection Analysis Device Market Industry is experiencing rapid technological advancements, which enhance the efficiency and accuracy of inspection processes. Innovations such as artificial intelligence and machine learning are being integrated into inspection devices, allowing for real-time data analysis and predictive maintenance. This evolution not only reduces downtime but also improves safety standards across various sectors, including manufacturing and healthcare. As organizations increasingly adopt these advanced technologies, the market is projected to grow significantly, with a valuation of 17.1 USD Billion in 2024, indicating a robust demand for sophisticated inspection solutions.

    Globalization of Supply Chains

    The globalization of supply chains has a profound impact on the Global Inspection Analysis Device Market Industry. As companies expand their operations internationally, the complexity of supply chains increases, necessitating robust inspection processes to ensure product quality across borders. Inspection devices play a crucial role in monitoring and verifying the quality of materials and products at various stages of the supply chain. This trend is likely to drive market growth as organizations seek reliable inspection solutions to mitigate risks associated with global sourcing. The anticipated market growth to 33.5 USD Billion by 2035 highlights the importance of effective inspection in a globalized economy.

    Rising Demand for Quality Assurance

    The increasing emphasis on quality assurance in manufacturing and production processes significantly influences the Global Inspection Analysis Device Market Industry. Companies are prioritizing quality control to enhance customer satisfaction and reduce costs associated with defects. This focus on quality assurance drives the adoption of advanced inspection devices that can detect anomalies and ensure product consistency. As industries recognize the financial benefits of investing in quality assurance technologies, the market is anticipated to grow at a CAGR of 6.32% from 2025 to 2035, reflecting a sustained commitment to maintaining high standards in production.

    Market Segment Insights

    Inspection Analysis Device Type Insights

    The Inspection Analysis Device market segmentation, based on Type, includes Industrial CT, 3D Scanner, CMM, Machine Vision, SEM, and TEM. In 2022, the Machine Vision segment holds the largest market share. Machine vision refers to the technology and methods used in industry to offer imaging-based automatic inspection and analysis for applications such as automatic inspection, process control, and robot navigation. According to the Automated Imaging Association (AIA), machine vision includes all industrial and non-industrial applications in which a combination of hardware and software provides operational assistance to devices in the execution of their activities based on picture collection and processing.

    Source: Secondary Research, Primary Research, MRFR Database and Analyst Review

    Inspection Analysis Device Industry Vertical Insights

    The Inspection Analysis Device market is divided into Automotive & Transportation, Semiconductor & Electronics, Metal & Materials, Machinery & Equipment, Aerospace & Defense, Medical & Pharmaceutical, Energy & Power, Others based on Industry Vertical.  In 2022, Semiconductor & Electronics accounted for largest market share. Factors such as increasing demand for high-quality electronic devices, growing complexity in semiconductor manufacturing, stringent quality standards, and the need for advanced inspection techniques for smaller and more intricate electronic components are driving the adoption of inspection analysis devices in the Semiconductor & Electronics industry vertical.

    Get more detailed insights about Inspection Analysis Device Market Research Report—Global Forecast till 2034

    Regional Insights

    By Region, the study segments the market into North America, Europe, Asia-Pacific, Middle East & Africa, and South America.

    North America holds the largest market share in 2022.  Several factors may contribute to the dominance of North America in the Inspection Analysis Device market. The region is home to several key players in the semiconductor and electronics industries, as well as other manufacturing sectors, which drive the demand for inspection analysis devices. The presence of advanced manufacturing facilities, research and development activities, and technological advancements in North America contribute to the adoption of inspection analysis devices for various industrial applications.

    FIGURE 3: INSPECTION ANALYSIS DEVICE MARKET SHARE BY REGION 2022 VS 2032 (USD Billion)

    INSPECTION ANALYSIS DEVICE MARKET SHARE BY REGION 2022 VS 2032

    Source: Secondary Research, Primary Research, MRFR Database and Analyst Review

    Key Players and Competitive Insights

    The Inspection Analysis Device market is highly competitive and consists of several key players that offer a wide range of inspection analysis devices for various industry verticals. These players continuously strive to innovate and develop advanced inspection technologies to meet the growing demand for high-quality, accurate, and efficient inspection solutions.

    There are several domestic, regional, and global players operating in the Inspection Analysis Device Market who continuously strive to gain a significant share of the overall market. During the study, MRFR has analyzed some of the major players in the Inspection Analysis Device Market who have contributed to the market growth. These include Carl Zeiss AG, Hitachi High-Technologies Corporation, Nikon Metrology NV, Hexagon AB, Omron Corporation, Bruker Corporation, Cognex Corporation, Keyence Corporation, Perceptron Inc., Olympus Corporation, Shimadzu Corporation, Thermo Fisher Scientific Inc., Zetec Inc., Ametek Inc., Hamamatsu Photonics K.K., and Others.

    Key Companies in the Inspection Analysis Device Market market include

    Industry Developments

    January 2021 - Cognex Corporation launched the In-Sight 3D-L4000 embedded vision system. Featuring 3D laser displacement technology, this first-of-its-kind smart camera allows engineers to solve a range of inspections quickly, accurately, and cost-effectively on automated production lines.  

    May 2021 - Basler AG acquired Silicon Software GmbH, which helped the former complementarily expand its portfolio with the product areas frame grabbers and software (VisualApplets). The acquisition was a step to support the growth strategy of Basler AG and, in particular, to implement it in the direction of the performance segment of the computer vision market.

    September 2021 - Allied Vision launched two high-performance Sony fourth-generation IMX back-illuminated CMOS sensors with Pregius S global shutter technology to its Alvium Camera Series. The Alvium 1800 CSI-2 cameras combine a compact form factor with large, high-resolution sensors to offer the highest possible resolutions in such a small housing.

    October 2021 - Allied Vision launched three fourth-generation Sony IMX sensors with Pregius S global shutter technology to its Alvium 1800 U camera series. With the new models Alvium 1800 U-511 (Sony IMX547), Alvium 1800 U-811 (Sony IMX546), and Alvium 1800 U-1242 (Sony IMX545), the Alvium camera series with USB3 interface now comprise 19 models. All cameras are available in different housing variants (closed housing, open housing, bareboard), monochrome or color cameras, and different lens mount options.

    April 2020 - Cognex Corporation launched the In-Sight D900 embedded vision system. A first-of-its-kind solution, the In-Sight D900 features Cognex’s ViDi™ deep learning software inside an In-Sight industrial-grade smart camera. The self-contained system is designed to solve a broad range of complex in-line inspection applications, including optical character recognition (OCR), assembly verification, and defect detection.

    Future Outlook

    Inspection Analysis Device Market Future Outlook

    The Inspection Analysis Device Market is projected to grow at a 6.32% CAGR from 2025 to 2035, driven by technological advancements, increasing regulatory requirements, and rising demand for quality assurance.

    New opportunities lie in:

    • Develop AI-driven inspection solutions to enhance accuracy and efficiency.
    • Expand into emerging markets with tailored inspection devices for local industries.
    • Leverage IoT integration for real-time data analytics and remote monitoring capabilities.

    By 2035, the market is expected to achieve substantial growth, reflecting evolving industry standards and technological innovations.

    Market Segmentation

    Inspection Analysis Device Type Outlook

    • Industrial CT
    • 3D Scanner
    • CMM
    • Machine Vision
    • SEM
    • TEM

    Inspection Analysis Device Regional Outlook

    • US
    • Canada
    • Mexico

    Inspection Analysis Device Industry Vertical Outlook

    • Automotive & Transportation
    • Semiconductor & Electronics
    • Metal & Materials
    • Machinery & Equipment
    • Aerospace & Defense
    • Medical & Pharmaceutical
    • Energy & Power
    • Others

    Report Scope

    Report Attribute/Metric Details
    Market Size 2024 USD 17.07 Billion
    Market Size 2025 USD 18.14 Billion
    Market Size 2035 33.49
    Compound Annual Growth Rate (CAGR) 6.32% (2025 - 2035)
    Base Year 2024
    Forecast Period 2025 - 2035
    Historical Data 2020-2023
    Forecast Units Value (USD Billion)
    Report Coverage Revenue Forecast, Competitive Landscape, Growth Factors, and Trends
    Segments Covered Type and Industry Vertical
    Geographies Covered North America, Europe, Asia Pacific, Middle East & Africa, and South America
    Countries Covered The U.S, Canada, Mexico, Germany, France, UK, China, Japan, India, Australia, South Korea, UAE, and Brazil
    Key Companies Profiled Carl Zeiss AG, Hitachi High-Technologies Corporation, Nikon Metrology NV, Hexagon AB, Omron Corporation, Bruker Corporation, Cognex Corporation, Keyence Corporation, Perceptron Inc., Olympus Corporation, Shimadzu Corporation, Thermo Fisher Scientific Inc., Zetec Inc., Ametek Inc., Hamamatsu Photonics K.K., and Others.
    Key Market Opportunities Availability of pre-owned inspection analysis devices
    Key Market Dynamics Increasing Demand for High-Quality and Safe Products. Increase in product recalls by manufacturers Increasing automation

    Market Highlights

    Author

    Shubham Munde
    Research Analyst Level II

    She holds an experience of about 6+ years in market research and business consulting, working under the spectrum of information communication technology, telecommunications and semiconductor domains. aarti conceptualizes and implements a scalable business strategy and provides strategic leadership to the clients. her expertise lies in market estimation, competitive intelligence, pipeline analysis, customer assessment, etc.

    Leave a Comment

    Latest Comments

    John Doe
    john@example.com

    This is a great article! Really helped me understand the topic better.

    Posted on July 23, 2025, 10:15 AM
    Jane Smith
    jane@domain.com

    Thanks for sharing this. I’ve bookmarked it for later reference.

    Posted on July 22, 2025, 7:45 PM

    FAQs

    How much is the Inspection Analysis Device market?

    The Inspection Analysis Device market size was valued at USD 17.07 billion in 2024

    What is the market size for 2035, for the Inspection Analysis Device Market?

    The global Inspection Analysis Device market is Predicted to reach USD 33.49 billion by 2035

    What is the growth rate of the Inspection Analysis Device market?

    The global market is projected to grow at a CAGR of 6.32% during the forecast period, 2025 to 2035.

    Which region held the largest market share in the Inspection Analysis Device market?

    North America had the largest share in the global market

    Who are the prominent players in the Inspection Analysis Device market?

    Carl Zeiss AG, Hitachi High-Technologies Corporation, Nikon Metrology NV, Hexagon AB, Omron Corporation, Bruker Corporation, Cognex Corporation, Keyence Corporation, Perceptron Inc., Olympus Corporation, Shimadzu Corporation, Thermo Fisher Scientific Inc., Zetec Inc., Ametek Inc., Hamamatsu Photonics K.K., and Others.

    1. Table of Contents
    2. MARKET 15
      1. GLOBAL INSPECTION ANALYSIS DEVICE MARKET, BY TYPE 15
        1. GLOBAL INSPECTION ANALYSIS DEVICE MARKET, BY TYPE, 2020–2034(USD BILLION) 16
        2. INDUSTRIAL CT 16
        3. 3D SCANNER 16
        4. CMM 16
        5. MACHINE VISION 17
        6. SEM 17
        7. TEM 17
      2. GLOBAL INSPECTION ANALYSIS DEVICE MARKET, BY REGION 18
        1. OVERVIEW 18
        2. GLOBAL INSPECTION ANALYSIS DEVICE MARKET, BY REGION, 2024 VS 2034(USD BILLION) 18
        3. GLOBAL INSPECTION ANALYSIS DEVICE MARKET, BY REGION, 2020–2034(USD BILLION) 19
      3. NORTH AMERICA 20
        1. NORTH AMERICA: INSPECTION ANALYSIS DEVICE MARKET, BY COUNTRY, 2020–2034(USD BILLION) 21
        2. NORTH AMERICA: INSPECTION ANALYSIS DEVICE MARKET, BY TYPE VERTICAL, 2020–2034(USD BILLION) 21
        3. NORTH AMERICA: INSPECTION ANALYSIS DEVICE MARKET, BY INDUSTRY VERTICAL, 2020–2034(USD BILLION) 22
        4. US 23
        5. US: INSPECTION ANALYSIS DEVICE MARKET, BY TYPE VERTICAL, 2020–2034(USD BILLION) 23
        6. US: INSPECTION ANALYSIS DEVICE MARKET, BY INDUSTRY VERTICAL, 2020–2034(USD BILLION) 23
        7. CANADA 23
        8. CANADA: INSPECTION ANALYSIS DEVICE MARKET, BY TYPE VERTICAL, 2020–2034(USD BILLION) 24
        9. CANADA: INSPECTION ANALYSIS DEVICE MARKET, BY INDUSTRY VERTICAL, 2020–2034(USD BILLION) 24
        10. MEXICO 25
        11. MEXICO: INSPECTION ANALYSIS DEVICE MARKET, BY TYPE VERTICAL, 2020–2034(USD BILLION) 25
        12. MEXICO: INSPECTION ANALYSIS DEVICE MARKET, BY INDUSTRY VERTICAL, 2020–2034(USD BILLION) 25
      4. EUROPE 26
        1. EUROPE: INSPECTION ANALYSIS DEVICE MARKET, BY COUNTRY, 2020–2034(USD BILLION) 27
        2. EUROPE: INSPECTION ANALYSIS DEVICE MARKET, BY TYPE VERTICAL, 2020–2034(USD BILLION) 27
        3. EUROPE: INSPECTION ANALYSIS DEVICE MARKET, BY INDUSTRY VERTICAL, 2020–2034(USD BILLION) 28
        4. GERMANY 29
        5. GERMANY: INSPECTION ANALYSIS DEVICE MARKET, BY TYPE VERTICAL, 2020–2034(USD BILLION) 29
        6. GERMANY: INSPECTION ANALYSIS DEVICE MARKET, BY INDUSTRY VERTICAL, 2020–2034(USD BILLION) 29
        7. FRANCE 30
        8. FRANCE: INSPECTION ANALYSIS DEVICE MARKET, BY TYPE VERTICAL, 2020–2034(USD BILLION) 30
        9. FRANCE: INSPECTION ANALYSIS DEVICE MARKET, BY INDUSTRY VERTICAL, 2020–2034(USD BILLION) 30
        10. UK 31
        11. UK: INSPECTION ANALYSIS DEVICE MARKET, BY TYPE VERTICAL, 2020–2034(USD BILLION) 31
        12. UK: INSPECTION ANALYSIS DEVICE MARKET, BY INDUSTRY VERTICAL, 2020–2034(USD BILLION) 31
        13. RUSSIA 32
        14. RUSSIA: INSPECTION ANALYSIS DEVICE MARKET, BY TYPE VERTICAL, 2020–2034(USD BILLION) 32
        15. RUSSIA: INSPECTION ANALYSIS DEVICE MARKET, BY INDUSTRY VERTICAL, 2020–2034(USD BILLION) 32
        16. ITALY 33
        17. ITALY: INSPECTION ANALYSIS DEVICE MARKET, BY TYPE VERTICAL, 2020–2034(USD BILLION) 33
        18. ITALY: INSPECTION ANALYSIS DEVICE MARKET, BY INDUSTRY VERTICAL, 2020–2034(USD BILLION) 33
        19. REST OF EUROPE 34
        20. REST OF EUROPE: INSPECTION ANALYSIS DEVICE MARKET, BY TYPE VERTICAL, 2020–2034(USD BILLION) 34
        21. REST OF EUROPE: INSPECTION ANALYSIS DEVICE MARKET, BY INDUSTRY VERTICAL, 2020–2034(USD BILLION) 34
      5. ASIA-PACIFIC 35
        1. ASIA-PACIFIC: INSPECTION ANALYSIS DEVICE MARKET, BY COUNTRY, 2020–2034(USD BILLION) 36
        2. ASIA-PACIFIC: INSPECTION ANALYSIS DEVICE MARKET, BY TYPE VERTICAL, 2020–2034(USD BILLION) 36
        3. ASIA-PACIFIC: INSPECTION ANALYSIS DEVICE MARKET, BY INDUSTRY VERTICAL, 2020–2034(USD BILLION) 37
        4. CHINA 38
        5. CHINA: INSPECTION ANALYSIS DEVICE MARKET, BY TYPE VERTICAL, 2020–2034(USD BILLION) 38
        6. CHINA: INSPECTION ANALYSIS DEVICE MARKET, BY INDUSTRY VERTICAL, 2020–2034(USD BILLION) 38
        7. JAPAN 39
        8. JAPAN: INSPECTION ANALYSIS DEVICE MARKET, BY TYPE VERTICAL, 2020–2034(USD BILLION) 39
        9. JAPAN: INSPECTION ANALYSIS DEVICE MARKET, BY INDUSTRY VERTICAL, 2020–2034(USD BILLION) 39
        10. SOUTH KOREA 40
        11. SOUTH KOREA: INSPECTION ANALYSIS DEVICE MARKET, BY TYPE VERTICAL, 2020–2034(USD BILLION) 40
        12. SOUTH KOREA: INSPECTION ANALYSIS DEVICE MARKET, BY INDUSTRY VERTICAL, 2020–2034(USD BILLION) 40
        13. INDIA 41
        14. INDIA: INSPECTION ANALYSIS DEVICE MARKET, BY TYPE VERTICAL, 2020–2034(USD BILLION) 41
        15. INDIA: INSPECTION ANALYSIS DEVICE MARKET, BY INDUSTRY VERTICAL, 2020–2034(USD BILLION) 41
        16. SOUTHEAST ASIA 42
        17. SOUTHEAST ASIA: INSPECTION ANALYSIS DEVICE MARKET, BY TYPE VERTICAL, 2020–2034(USD BILLION) 42
        18. SOUTHEAST ASIA: INSPECTION ANALYSIS DEVICE MARKET, BY INDUSTRY VERTICAL, 2020–2034(USD BILLION) 42
        19. REST OF ASIA-PACIFIC 43
        20. REST OF ASIA-PACIFIC: INSPECTION ANALYSIS DEVICE MARKET, BY TYPE VERTICAL, 2020–2034(USD BILLION) 43
        21. REST OF ASIA-PACIFIC: INSPECTION ANALYSIS DEVICE MARKET, BY INDUSTRY VERTICAL, 2020–2034(USD BILLION) 43
      6. SOUTH AMERICA 44
        1. SOUTH AMERICA: INSPECTION ANALYSIS DEVICE MARKET, BY COUNTRY, 2020–2034(USD BILLION) 44
        2. SOUTH AMERICA: INSPECTION ANALYSIS DEVICE MARKET, BY TYPE VERTICAL, 2020–2034(USD BILLION) 45
        3. SOUTH AMERICA: INSPECTION ANALYSIS DEVICE MARKET, BY INDUSTRY VERTICAL, 2020–2034(USD BILLION) 46
        4. BRAZIL 47
        5. BRAZIL: INSPECTION ANALYSIS DEVICE MARKET, BY TYPE VERTICAL, 2020–2034(USD BILLION) 47
        6. BRAZIL: INSPECTION ANALYSIS DEVICE MARKET, BY INDUSTRY VERTICAL, 2020–2034(USD BILLION) 47
        7. ARGENTINA 48
        8. ARGENTINA: INSPECTION ANALYSIS DEVICE MARKET, BY TYPE VERTICAL, 2020–2034(USD BILLION) 48
        9. ARGENTINA: INSPECTION ANALYSIS DEVICE MARKET, BY INDUSTRY VERTICAL, 2020–2034(USD BILLION) 48
        10. COLUMBIA 49
        11. COLUMBIA: INSPECTION ANALYSIS DEVICE MARKET, BY TYPE VERTICAL, 2020–2034(USD BILLION) 49
        12. COLUMBIA: INSPECTION ANALYSIS DEVICE MARKET, BY INDUSTRY VERTICAL, 2020–2034(USD BILLION) 49
        13. REST OF SOUTH AMERICA 50
        14. REST OF SOUTH AMERICA: INSPECTION ANALYSIS DEVICE MARKET, BY TYPE VERTICAL, 2020–2034(USD BILLION) 50
        15. REST OF SOUTH AMERICA: INSPECTION ANALYSIS DEVICE MARKET, BY INDUSTRY VERTICAL, 2020–2034(USD BILLION) 50
      7. MIDDLE EAST & AFRICA 51
        1. MIDDLE EAST & AFRICA: INSPECTION ANALYSIS DEVICE MARKET, BY COUNTRY, 2020–2034(USD BILLION) 52
        2. MIDDLE EAST & AFRICA: INSPECTION ANALYSIS DEVICE MARKET, BY TYPE VERTICAL, 2020–2034(USD BILLION) 52
        3. MIDDLE EAST & AFRICA: INSPECTION ANALYSIS DEVICE MARKET, BY INDUSTRY VERTICAL, 2020–2034(USD BILLION) 53
        4. SAUDI ARABIA 54
        5. SAUDI ARABIA: INSPECTION ANALYSIS DEVICE MARKET, BY TYPE VERTICAL, 2020–2034(USD BILLION) 54
        6. SAUDI ARABIA: INSPECTION ANALYSIS DEVICE MARKET, BY INDUSTRY VERTICAL, 2020–2034(USD BILLION) 54
        7. UAE 55
        8. UAE: INSPECTION ANALYSIS DEVICE MARKET, BY TYPE VERTICAL, 2020–2034(USD BILLION) 55
        9. UAE: INSPECTION ANALYSIS DEVICE MARKET, BY INDUSTRY VERTICAL, 2020–2034(USD BILLION) 55
        10. EGYPT 56
        11. EGYPT: INSPECTION ANALYSIS DEVICE MARKET, BY TYPE VERTICAL, 2020–2034(USD BILLION) 56
        12. EGYPT: INSPECTION ANALYSIS DEVICE MARKET, BY INDUSTRY VERTICAL, 2020–2034(USD BILLION) 56
        13. NIGERIA 57
        14. NIGERIA: INSPECTION ANALYSIS DEVICE MARKET, BY TYPE VERTICAL, 2020–2034(USD BILLION) 57
        15. NIGERIA: INSPECTION ANALYSIS DEVICE MARKET, BY INDUSTRY VERTICAL, 2020–2034(USD BILLION) 57
        16. SOUTH AFRICA 58
        17. SOUTH AFRICA: INSPECTION ANALYSIS DEVICE MARKET, BY TYPE VERTICAL, 2020–2034(USD BILLION) 58
        18. SOUTH AFRICA: INSPECTION ANALYSIS DEVICE MARKET, BY INDUSTRY VERTICAL, 2020–2034(USD BILLION) 58
        19. REST OF MIDDLE EAST & AFRICA 59
        20. REST OF MIDDLE EAST & AFRICA: INSPECTION ANALYSIS DEVICE MARKET, BY TYPE VERTICAL, 2020–2034(USD BILLION) 59
        21. REST OF MIDDLE EAST & AFRICA: INSPECTION ANALYSIS DEVICE MARKET, BY INDUSTRY VERTICAL, 2020–2034(USD BILLION) 59
      8. QUALITATIVE INFORMATION ON LARGE FLUCTUATION BY COUNTRY/REGION 60
        1. NORTH AMERICA 60
        2. EUROPE 61
        3. ASIA-PACIFIC 62
        4. SOUTH AMERICA 63
        5. MIDDLE EAST & AFRICA 64
      9. VARIABLE FACTORS OF THE MARKET 65
        1. INTRODUCTION 65
      10. DRIVERS 66
        1. INCREASE IN PRODUCT RECALLS BY MANUFACTURERS 66
        2. INCREASING AUTOMATION 66
        3. DRIVER IMPACT ANALYSIS 66
      11. RESTRAINTS 67
        1. AVAILABILITY OF PRE-OWNED INSPECTION ANALYSIS DEVICES 67
        2. RESTRAINT IMPACT ANALYSIS 67
      12. OPPORTUNITIES 67
        1. OUTSOURCING OF INSPECTION ANALYSIS 67
      13. TRENDS 68
        1. USE OF SMART GLASSES IN INSPECTION 68
      14. VALUE /SUPPLY CHAIN ANALYSIS 68
        1. HARDWARE/RAW MATERIALS 68
        2. SOFTWARE PROVIDERS 68
        3. TECHNOLOGY PROVIDERS/SYSTEM INTEGRATORS 68
        4. END-USER 69
      15. PORTER’S FIVE FORCES MODEL 69
        1. THREAT OF NEW ENTRANTS 69
        2. BARGAINING POWER OF SUPPLIERS 70
        3. THREAT OF SUBSTITUTES 70
        4. BARGAINING POWER OF BUYERS 70
        5. INTENSITY OF RIVALRY 70
    3. CUSTOMER 71
      1. INSPECTION ANALYSIS DEVICE MARKET BY INDUSTRY VERTICAL 71
        1. OVERVIEW 71
        2. AUTOMOTIVE & TRANSPORTATION 72
        3. SEMICONDUCTOR & ELECTRONICS 73
        4. METAL & MATERIALS 74
        5. MACHINERY & EQUIPMENT 75
        6. AEROSPACE & DEFENSE 75
        7. MEDICAL & PHARMACEUTICAL 76
        8. ENERGY & POWER 76
        9. OTHERS 77
      2. INSPECTION ANALYSIS DEVICE MARKET, BY CUSTOMER ANALYSIS 78
      3. KEY BUYING FACTORS 78
        1. INTRODUCTION 78
    4. COMPETITION 82
      1. KEY COMPANY PROFILLING 82
        1. COGNEX CORPORATION 82
        2. BASLER AG 86
        3. KEYENCE CORPORATION 89
        4. ALLIED VISION TECHNOLOGIES GMBH 92
        5. OMRON CORPORATION 95
        6. NIKON CORPORATION 99
        7. CARL ZEISS AG 103
        8. JEOL LTD 106
        9. THERMO FISHER SCIENTIFIC 109
        10. BAKER HUGHES COMPANY 114
      2. MARKET SHARE ANALYSIS 118
      3. KEY SUCCESS FACTORS TO MEET KBF 118
    5. List of Tables and Figures
      1. LIST OF TABLES
      2. TABLE 1 GLOBAL INSPECTION ANALYSIS DEVICE MARKET, BY TYPE, 2020–2034(USD BILLION) 16
      3. TABLE 2 GLOBAL INSPECTION ANALYSIS DEVICE MARKET, BY REGION, 2020–2034(USD BILLION) 19
      4. TABLE 3 NORTH AMERICA INSPECTION ANALYSIS DEVICE MARKET, BY COUNTRY, 2020–2034(USD BILLION) 21
      5. TABLE 4 NORTH AMERICA INSPECTION ANALYSIS DEVICE MARKET, BY TYPE, 2020–2034(USD BILLION) 21
      6. TABLE 5 NORTH AMERICA INSPECTION ANALYSIS DEVICE MARKET, BY INDUSTRY VERTICAL, 2020–2034(USD BILLION) 22
      7. TABLE 6 US INSPECTION ANALYSIS DEVICE MARKET, BY TYPE, 2020–2034(USD BILLION) 23
      8. TABLE 7 US INSPECTION ANALYSIS DEVICE MARKET, BY INDUSTRY VERTICAL, 2020–2034(USD BILLION) 23
      9. TABLE 8 CANADA INSPECTION ANALYSIS DEVICE MARKET, BY TYPE, 2020–2034(USD BILLION) 24
      10. TABLE 9 CANADA INSPECTION ANALYSIS DEVICE MARKET, BY INDUSTRY VERTICAL, 2020–2034(USD BILLION) 24
      11. TABLE 10 MEXICO INSPECTION ANALYSIS DEVICE MARKET, BY TYPE, 2020–2034(USD BILLION) 25
      12. TABLE 11 MEXICO INSPECTION ANALYSIS DEVICE MARKET, BY INDUSTRY VERTICAL, 2020–2034(USD BILLION) 25
      13. TABLE 12 EUROPE INSPECTION ANALYSIS DEVICE MARKET, BY COUNTRY, 2020–2034(USD BILLION) 27
      14. TABLE 13 EUROPE INSPECTION ANALYSIS DEVICE MARKET, BY TYPE, 2020–2034(USD BILLION) 27
      15. TABLE 14 EUROPE INSPECTION ANALYSIS DEVICE MARKET, BY INDUSTRY VERTICAL, 2020–2034(USD BILLION) 28
      16. TABLE 15 GERMANY INSPECTION ANALYSIS DEVICE MARKET, BY TYPE, 2020–2034(USD BILLION) 29
      17. TABLE 16 GERMANY INSPECTION ANALYSIS DEVICE MARKET, BY INDUSTRY VERTICAL, 2020–2034(USD BILLION) 29
      18. TABLE 17 FRANCE INSPECTION ANALYSIS DEVICE MARKET, BY TYPE, 2020–2034(USD BILLION) 30
      19. TABLE 18 FRANCE INSPECTION ANALYSIS DEVICE MARKET, BY INDUSTRY VERTICAL, 2020–2034(USD BILLION) 30
      20. TABLE 19 UK INSPECTION ANALYSIS DEVICE MARKET, BY TYPE, 2020–2034(USD BILLION) 31
      21. TABLE 20 UK INSPECTION ANALYSIS DEVICE MARKET, BY INDUSTRY VERTICAL, 2020–2034(USD BILLION) 31
      22. TABLE 21 RUSSIA INSPECTION ANALYSIS DEVICE MARKET, BY TYPE, 2020–2034(USD BILLION) 32
      23. TABLE 22 RUSSIA INSPECTION ANALYSIS DEVICE MARKET, BY INDUSTRY VERTICAL, 2020–2034(USD BILLION) 32
      24. TABLE 23 ITALY INSPECTION ANALYSIS DEVICE MARKET, BY TYPE, 2020–2034(USD BILLION) 33
      25. TABLE 24 ITALY INSPECTION ANALYSIS DEVICE MARKET, BY INDUSTRY VERTICAL, 2020–2034(USD BILLION) 33
      26. TABLE 25 REST OF EUROPE INSPECTION ANALYSIS DEVICE MARKET, BY TYPE, 2020–2034(USD BILLION) 34
      27. TABLE 26 REST OF EUROPE INSPECTION ANALYSIS DEVICE MARKET, BY INDUSTRY VERTICAL, 2020–2034(USD BILLION) 34
      28. TABLE 27 ASIA-PACIFIC INSPECTION ANALYSIS DEVICE MARKET, BY COUNTRY, 2020–2034(USD BILLION) 36
      29. TABLE 28 ASIA-PACIFIC INSPECTION ANALYSIS DEVICE MARKET, BY TYPE, 2020–2034(USD BILLION) 36
      30. TABLE 29 ASIA-PACIFIC INSPECTION ANALYSIS DEVICE MARKET, BY INDUSTRY VERTICAL, 2020–2034(USD BILLION) 37
      31. TABLE 30 CHINA INSPECTION ANALYSIS DEVICE MARKET, BY TYPE, 2020–2034(USD BILLION) 38
      32. TABLE 31 CHINA INSPECTION ANALYSIS DEVICE MARKET, BY INDUSTRY VERTICAL, 2020–2034(USD BILLION) 38
      33. TABLE 32 JAPAN INSPECTION ANALYSIS DEVICE MARKET, BY TYPE, 2020–2034(USD BILLION) 39
      34. TABLE 33 JAPAN INSPECTION ANALYSIS DEVICE MARKET, BY INDUSTRY VERTICAL, 2020–2034(USD BILLION) 39
      35. TABLE 34 SOUTH KOREA INSPECTION ANALYSIS DEVICE MARKET, BY TYPE, 2020–2034(USD BILLION) 40
      36. TABLE 35 SOUTH KOREA INSPECTION ANALYSIS DEVICE MARKET, BY INDUSTRY VERTICAL, 2020–2034(USD BILLION) 40
      37. TABLE 36 INDIA INSPECTION ANALYSIS DEVICE MARKET, BY TYPE, 2020–2034(USD BILLION) 41
      38. TABLE 37 INDIA INSPECTION ANALYSIS DEVICE MARKET, BY INDUSTRY VERTICAL, 2020–2034(USD BILLION) 41
      39. TABLE 38 SOUTHEAST ASIA INSPECTION ANALYSIS DEVICE MARKET, BY TYPE, 2020–2034(USD BILLION) 42
      40. TABLE 39 SOUTHEAST ASIA INSPECTION ANALYSIS DEVICE MARKET, BY INDUSTRY VERTICAL, 2020–2034(USD BILLION) 42
      41. TABLE 40 REST OF ASIA-PACIFIC INSPECTION ANALYSIS DEVICE MARKET, BY TYPE, 2020–2034(USD BILLION) 43
      42. TABLE 41 REST OF ASIA-PACIFIC INSPECTION ANALYSIS DEVICE MARKET, BY INDUSTRY VERTICAL, 2020–2034(USD BILLION) 43
      43. TABLE 42 SOUTH AMERICA INSPECTION ANALYSIS DEVICE MARKET, BY COUNTRY, 2020–2034(USD BILLION) 44
      44. TABLE 43 SOUTH AMERICA INSPECTION ANALYSIS DEVICE MARKET, BY TYPE, 2020–2034(USD BILLION) 45
      45. TABLE 44 SOUTH AMERICA INSPECTION ANALYSIS DEVICE MARKET, BY INDUSTRY VERTICAL, 2020–2034(USD BILLION) 46
      46. TABLE 45 BRAZIL INSPECTION ANALYSIS DEVICE MARKET, BY TYPE, 2020–2034(USD BILLION) 47
      47. TABLE 46 BRAZIL INSPECTION ANALYSIS DEVICE MARKET, BY INDUSTRY VERTICAL, 2020–2034(USD BILLION) 47
      48. TABLE 47 ARGENTINA INSPECTION ANALYSIS DEVICE MARKET, BY TYPE, 2020–2034(USD BILLION) 48
      49. TABLE 48 ARGENTINA INSPECTION ANALYSIS DEVICE MARKET, BY INDUSTRY VERTICAL, 2020–2034(USD BILLION) 48
      50. TABLE 49 COLUMBIA INSPECTION ANALYSIS DEVICE MARKET, BY TYPE, 2020–2034(USD BILLION) 49
      51. TABLE 50 COLUMBIA INSPECTION ANALYSIS DEVICE MARKET, BY INDUSTRY VERTICAL, 2020–2034(USD BILLION) 49
      52. TABLE 51 REST OF SOUTH AMERICA INSPECTION ANALYSIS DEVICE MARKET, BY TYPE, 2020–2034(USD BILLION) 50
      53. TABLE 52 REST OF SOUTH AMERICA INSPECTION ANALYSIS DEVICE MARKET, BY INDUSTRY VERTICAL, 2020–2034(USD BILLION) 50
      54. TABLE 53 MIDDLE EAST & AFRICA INSPECTION ANALYSIS DEVICE MARKET, BY COUNTRY, 2020–2034(USD BILLION) 52
      55. TABLE 54 MIDDLE EAST & AFRICA INSPECTION ANALYSIS DEVICE MARKET, BY TYPE, 2020–2034(USD BILLION) 52
      56. TABLE 55 MIDDLE EAST & AFRICA INSPECTION ANALYSIS DEVICE MARKET, BY INDUSTRY VERTICAL, 2020–2034(USD BILLION) 53
      57. TABLE 56 SAUDI ARABIA INSPECTION ANALYSIS DEVICE MARKET, BY TYPE, 2020–2034(USD BILLION) 54
      58. TABLE 57 SAUDI ARABIA INSPECTION ANALYSIS DEVICE MARKET, BY INDUSTRY VERTICAL, 2020–2034(USD BILLION) 54
      59. TABLE 58 UAE INSPECTION ANALYSIS DEVICE MARKET, BY TYPE, 2020–2034(USD BILLION) 55
      60. TABLE 59 UAE INSPECTION ANALYSIS DEVICE MARKET, BY INDUSTRY VERTICAL, 2020–2034(USD BILLION) 55
      61. TABLE 60 EGYPT INSPECTION ANALYSIS DEVICE MARKET, BY TYPE, 2020–2034(USD BILLION) 56
      62. TABLE 61 EGYPT INSPECTION ANALYSIS DEVICE MARKET, BY INDUSTRY VERTICAL, 2020–2034(USD BILLION) 56
      63. TABLE 62 NIGERIA INSPECTION ANALYSIS DEVICE MARKET, BY TYPE, 2020–2034(USD BILLION) 57
      64. TABLE 63 NIGERIA INSPECTION ANALYSIS DEVICE MARKET, BY INDUSTRY VERTICAL, 2020–2034(USD BILLION) 57
      65. TABLE 64 SOUTH AFRICA INSPECTION ANALYSIS DEVICE MARKET, BY TYPE, 2020–2034(USD BILLION) 58
      66. TABLE 65 SOUTH AFRICA INSPECTION ANALYSIS DEVICE MARKET, BY INDUSTRY VERTICAL, 2020–2034(USD BILLION) 58
      67. TABLE 66 REST OF MIDDLE EAST & AFRICA INSPECTION ANALYSIS DEVICE MARKET, BY TYPE, 2020–2034(USD BILLION) 59
      68. TABLE 67 REST OF MIDDLE EAST & AFRICA INSPECTION ANALYSIS DEVICE MARKET, BY INDUSTRY VERTICAL, 2020–2034(USD BILLION) 59
      69. TABLE 68 GLOBAL INSPECTION ANALYSIS DEVICE MARKET, BY INDUSTRY VERTICAL, 2020–2034(USD BILLION) 72
      70. TABLE 69 GLOBAL INSPECTION ANALYSIS DEVICE MARKET, BY AUTOMOTIVE & TRANSPORTATION, 2020–2034(USD BILLION) 73
      71. TABLE 70 GLOBAL INSPECTION ANALYSIS DEVICE MARKET, BY SEMICONDUCTOR & ELECTRONICS, 2020–2034(USD BILLION) 74
      72. TABLE 71 GLOBAL INSPECTION ANALYSIS DEVICE MARKET, BY METAL & MATERIALS, 2020–2034(USD BILLION) 74
      73. TABLE 72 GLOBAL INSPECTION ANALYSIS DEVICE MARKET, BY MACHINERY & EQUIPMENT, 2020–2034(USD BILLION) 75
      74. TABLE 73 GLOBAL INSPECTION ANALYSIS DEVICE MARKET, BY AEROSPACE & DEFENSE, 2020–2034(USD BILLION) 75
      75. TABLE 74 GLOBAL INSPECTION ANALYSIS DEVICE MARKET, BY MEDICAL & PHARMACEUTICAL, 2020–2034(USD BILLION) 76
      76. TABLE 75 GLOBAL INSPECTION ANALYSIS DEVICE MARKET, BY ENERGY & POWER, 2020–2034(USD BILLION) 77
      77. TABLE 76 GLOBAL INSPECTION ANALYSIS DEVICE MARKET, BY OTHERS, 2020–2034(USD BILLION) 77
      78. TABLE 1 COGNEX CORPORATION.: PRODUCTS OFFERED 83
      79. TABLE 2 COGNEX CORPORATION: KEY DEVELOPMENTS 84
      80. TABLE 3 BASLER AG: PRODUCTS OFFERED 87
      81. TABLE 4 BASLER AG.: KEY DEVELOPMENTS 87
      82. TABLE 5 KEYENCE CORPORATION: PRODUCTS OFFERED 89
      83. TABLE 6 KEYENCE CORPORATION.: KEY DEVELOPMENTS 90
      84. TABLE 7 ALLIED VISION TECHNOLOGIES GMBH: PRODUCTS OFFERED 93
      85. TABLE 8 ALLIED VISION TECHNOLOGIES GMBH: KEY DEVELOPMENTS 93
      86. TABLE 9 OMRON CORPORATION.: PRODUCTS/SERVICES OFFERED 97
      87. TABLE 10 OMRON CORPORATION.: KEY DEVELOPMENTS 97
      88. TABLE 11 NIKON CORPORATION: PRODUCTS OFFERED 101
      89. TABLE 12 NIKON CORPORATION: KEY DEVELOPMENTS 101
      90. TABLE 13 CARL ZEISS AG: PRODUCTS OFFERED 104
      91. TABLE 14 CARL ZEISS AG: KEY DEVELOPMENTS 104
      92. TABLE 15 JEOL LTD: PRODUCTS OFFERED 107
      93. TABLE 16 JEOL LTD: KEY DEVELOPMENTS 107
      94. TABLE 17 THERMO FISHER SCIENTIFIC: PRODUCTS OFFERED 111
      95. TABLE 18 THERMO FISHER SCIENTIFIC: KEY DEVELOPMENTS 112
      96. TABLE 19 BARKER HUGHES COMPANY: PRODUCTS OFFERED 116
      97. TABLE 20 BARKER HUGHES COMPANY: KEY DEVELOPMENTS 116   LIST OF FIGURES
      98. FIGURE 1 GLOBAL INSPECTION ANALYSIS DEVICE MARKET, BY TYPE, 2024 (% SHARE) 15
      99. FIGURE 2 GLOBAL INSPECTION ANALYSIS DEVICE MARKET, BY TYPE, 2024 VS 2034(USD BILLION) 15
      100. FIGURE 3 GLOBAL INSPECTION ANALYSIS DEVICE MARKET, BY REGION, 2024 (% SHARE) 18
      101. FIGURE 4 GLOBAL INSPECTION ANALYSIS DEVICE MARKET, BY REGION, 2024 VS 2034(USD BILLION) 18
      102. FIGURE 5 NORTH AMERICA INSPECTION ANALYSIS DEVICE MARKET, BY COUNTRY, 2024 (% SHARE) 20
      103. FIGURE 6 NORTH AMERICA INSPECTION ANALYSIS DEVICE MARKET, BY COUNTRY, 2024 VS 2034(USD BILLION) 20
      104. FIGURE 7 NORTH AMERICA INSPECTION ANALYSIS DEVICE MARKET, BY TYPE, 2024 VS 2034(USD BILLION) 21
      105. FIGURE 8 NORTH AMERICA INSPECTION ANALYSIS DEVICE MARKET, BY INDUSTRY VERTICAL, 2024 VS 2034(USD BILLION) 22
      106. FIGURE 9 EUROPE INSPECTION ANALYSIS DEVICE MARKET, BY COUNTRY, 2024 (% SHARE) 26
      107. FIGURE 10 EUROPE INSPECTION ANALYSIS DEVICE MARKET, BY COUNTRY, 2024 VS 2034(USD BILLION) 26
      108. FIGURE 11 EUROPE INSPECTION ANALYSIS DEVICE MARKET, BY TYPE, 2024 VS 2034(USD BILLION) 27
      109. FIGURE 12 EUROPE INSPECTION ANALYSIS DEVICE MARKET, BY INDUSTRY VERTICAL, 2024 VS 2034(USD BILLION) 28
      110. FIGURE 13 ASIA-PACIFIC INSPECTION ANALYSIS DEVICE MARKET, BY COUNTRY, 2024 (% SHARE) 35
      111. FIGURE 14 ASIA-PACIFIC INSPECTION ANALYSIS DEVICE MARKET, BY COUNTRY, 2024 VS 2034(USD BILLION) 35
      112. FIGURE 15 ASIA-PACIFIC INSPECTION ANALYSIS DEVICE MARKET, BY TYPE, 2024 VS 2034(USD BILLION) 36
      113. FIGURE 16 ASIA-PACIFIC INSPECTION ANALYSIS DEVICE MARKET, BY INDUSTRY VERTICAL, 2024 VS 2034(USD BILLION) 37
      114. FIGURE 17 SOUTH AMERICA INSPECTION ANALYSIS DEVICE MARKET, BY COUNTRY, 2024 (% SHARE) 44
      115. FIGURE 18 SOUTH AMERICA INSPECTION ANALYSIS DEVICE MARKET, BY COUNTRY, 2024 VS 2034(USD BILLION) 44
      116. FIGURE 19 SOUTH AMERICA INSPECTION ANALYSIS DEVICE MARKET, BY TYPE, 2024 VS 2034(USD BILLION) 45
      117. FIGURE 20 SOUTH AMERICA INSPECTION ANALYSIS DEVICE MARKET, BY INDUSTRY VERTICAL, 2024 VS 2034(USD BILLION) 46
      118. FIGURE 21 MIDDLE EAST & AFRICA INSPECTION ANALYSIS DEVICE MARKET, BY COUNTRY, 2024 (% SHARE) 51
      119. FIGURE 22 MIDDLE EAST & AFRICA INSPECTION ANALYSIS DEVICE MARKET, BY COUNTRY, 2024 VS 2034(USD BILLION) 51
      120. FIGURE 23 MIDDLE EAST & AFRICA INSPECTION ANALYSIS DEVICE MARKET, BY TYPE, 2024 VS 2034(USD BILLION) 52
      121. FIGURE 24 MIDDLE EAST & AFRICA INSPECTION ANALYSIS DEVICE MARKET, BY INDUSTRY VERTICAL, 2024 VS 2034(USD BILLION) 53
      122. FIGURE 25 NORTH AMERICA INDUSTRIAL MICROSCOPE MARKET FLUCTUATION 60
      123. FIGURE 26 EUROPE INDUSTRIAL MICROSCOPE MARKET FLUCTUATION 61
      124. FIGURE 27 ASIA-PACIFIC INDUSTRIAL MICROSCOPE MARKET FLUCTUATION 62
      125. FIGURE 28 SOUTH AMERICA INDUSTRIAL MICROSCOPE MARKET FLUCTUATION 63
      126. FIGURE 29 MIDDLE EAST & AFRICA INDUSTRIAL MICROSCOPE MARKET FLUCTUATION 64
      127. FIGURE 30 MARKET DYNAMICS OVERVIEW 65
      128. FIGURE 31 DRIVER IMPACT ANALYSIS 66
      129. FIGURE 32 RESTRAINT IMPACT ANALYSIS 67
      130. FIGURE 33 VALUE/SUPPLY CHAIN ANALYSIS 68
      131. FIGURE 34 PORTER’S FIVE FORCES MODEL: INSPECTION ANALYSIS DEVICES MARKET 69
      132. FIGURE 35 GLOBAL INSPECTION ANALYSIS DEVICE MARKET, BY INDUSTRY VERTICAL, 2024 (% SHARE) 71
      133. FIGURE 36 GLOBAL INSPECTION ANALYSIS DEVICE MARKET, BY INDUSTRY VERTICAL, 2024 VS 2034(USD BILLION) 71
      134. FIGURE 37 GLOBAL INSPECTION ANALYSIS DEVICE MARKET, BY CUSTMER ANALYSIS, 2024 (% SHARE) 78
      135. FIGURE 38 COGNEX CORPORATION.: FINANCIAL OVERVIEW SNAPSHOT 83
      136. FIGURE 39 COGNEX CORPORATION.: SWOT ANALYSIS 84
      137. FIGURE 40 BASLER AG.: FINANCIAL OVERVIEW SNAPSHOT 86
      138. FIGURE 41 BASLER AG.: SWOT ANALYSIS 88
      139. FIGURE 42 KEYENCE CORPORATION: FINANCIAL OVERVIEW SNAPSHOT 89
      140. FIGURE 43 KEYENCE CORPORATION: SWOT ANALYSIS 90
      141. FIGURE 44 ALLIED VISION TECHNOLOGIES GMBH (TKH TECHNOLOGIES): FINANCIAL OVERVIEW SNAPSHOT 92
      142. FIGURE 45 ALLIED VISION TECHNOLOGIES GMBH: SWOT ANALYSIS 93
      143. FIGURE 46 OMRON CORPORATION.: FINANCIAL OVERVIEW SNAPSHOT 96
      144. FIGURE 47 OMRON CORPORATION.: SWOT ANALYSIS 98
      145. FIGURE 48 NIKON CORPORATION: FINANCIAL OVERVIEW SNAPSHOT 100
      146. FIGURE 49 NIKON CORPORATION: SWOT ANALYSIS 102
      147. FIGURE 50 CARL ZEISS AG: FINANCIAL OVERVIEW SNAPSHOT 103
      148. FIGURE 51 CARL ZEISS AG: SWOT ANALYSIS 105
      149. FIGURE 52 JEOL LTD: FINANCIAL OVERVIEW 106
      150. FIGURE 53 JEOL LTD: SWOT ANALYSIS 108
      151. FIGURE 54 THERMO FISHER SCIENTIFIC: FINANCIAL OVERVIEW 110
      152. FIGURE 55 THERMO FISHER SCIENTIFIC: SWOT ANALYSIS 113
      153. FIGURE 56 BAKER HUGHES COMPANY: FINANCIAL OVERVIEW 115
      154. FIGURE 57 BAKER HUGHES COMPANY: SWOT ANALYSIS 117
      155. FIGURE 58 MAJOR MANUFACTURER MARKET SHARE ANALYSIS (%), 2024 118

    Inspection Analysis Device Market Segmentation

    • Global Inspection Analysis Device, By Type Outlook (USD Billion, 2020-2034)
      • Industrial CT
      • 3D Scanner
      • CMM
      • Machine Vision
      • SEM
      • TEM
    • Global Inspection Analysis Device, By Industry Vertical (USD Billion, 2020-2034)
      • Automotive & Transportation
      • Semiconductor & Electronics
      • Metal & Materials
      • Machinery & Equipment
      • Aerospace & Defense
      • Medical & Pharmaceutical
      • Energy & Power
      • Others

    Global Inspection Analysis Device Regional Outlook (USD Billion, 2020-2034)

    • North America Outlook (USD Billion, 2020-2034)
      • North America Inspection Analysis Device, By Type Outlook (USD Billion, 2020-2034)
        • Industrial CT
        • 3D Scanner
        • CMM
        • Machine Vision
        • SEM
        • TEM
      • North America Inspection Analysis Device, By Industry Vertical (USD Billion, 2020-2034)
        • Automotive & Transportation
        • Semiconductor & Electronics
        • Metal & Materials
        • Machinery & Equipment
        • Aerospace & Defense
        • Medical & Pharmaceutical
        • Energy & Power
        • Others
      • US Outlook (USD Billion, 2020-2034)
        • US Inspection Analysis Device, By Type Outlook (USD Billion, 2020-2034)
          • Industrial CT
          • 3D Scanner
          • CMM
          • Machine Vision
          • SEM
          • TEM
        • US Inspection Analysis Device, By Industry Vertical (USD Billion, 2020-2034)
          • Automotive & Transportation
          • Semiconductor & Electronics
          • Metal & Materials
          • Machinery & Equipment
          • Aerospace & Defense
          • Medical & Pharmaceutical
          • Energy & Power
          • Others
      • Canada Outlook (USD Billion, 2020-2034)
        • Canada Inspection Analysis Device, By Type Outlook (USD Billion, 2020-2034)
          • Industrial CT
          • 3D Scanner
          • CMM
          • Machine Vision
          • SEM
          • TEM
        • Canada Inspection Analysis Device, By Industry Vertical (USD Billion, 2020-2034)
          • Automotive & Transportation
          • Semiconductor & Electronics
          • Metal & Materials
          • Machinery & Equipment
          • Aerospace & Defense
          • Medical & Pharmaceutical
          • Energy & Power
          • Others
      • Mexico Outlook (USD Billion, 2020-2034)
        • Mexico Inspection Analysis Device, By Type Outlook (USD Billion, 2020-2034)
          • Industrial CT
          • 3D Scanner
          • CMM
          • Machine Vision
          • SEM
          • TEM
        • Mexico Inspection Analysis Device, By Industry Vertical (USD Billion, 2020-2034)
          • Automotive & Transportation
          • Semiconductor & Electronics
          • Metal & Materials
          • Machinery & Equipment
          • Aerospace & Defense
          • Medical & Pharmaceutical
          • Energy & Power
          • Others
    • Europe Outlook (USD Billion, 2020-2034)
      • Europe Inspection Analysis Device, By Type Outlook (USD Billion, 2020-2034)
        • Industrial CT
        • 3D Scanner
        • CMM
        • Machine Vision
        • SEM
        • TEM
      • Europe Inspection Analysis Device, By Industry Vertical (USD Billion, 2020-2034)
        • Automotive & Transportation
        • Semiconductor & Electronics
        • Metal & Materials
        • Machinery & Equipment
        • Aerospace & Defense
        • Medical & Pharmaceutical
        • Energy & Power
        • Others
      • Germany Outlook (USD Billion, 2020-2034)
        • Germany Inspection Analysis Device, By Type Outlook (USD Billion, 2020-2034)
          • Industrial CT
          • 3D Scanner
          • CMM
          • Machine Vision
          • SEM
          • TEM
        • Germany Inspection Analysis Device, By Industry Vertical (USD Billion, 2020-2034)
          • Automotive & Transportation
          • Semiconductor & Electronics
          • Metal & Materials
          • Machinery & Equipment
          • Aerospace & Defense
          • Medical & Pharmaceutical
          • Energy & Power
          • Others
      • France Outlook (USD Billion, 2020-2034)
        • France Inspection Analysis Device, By Type Outlook (USD Billion, 2020-2034)
          • Industrial CT
          • 3D Scanner
          • CMM
          • Machine Vision
          • SEM
          • TEM
        • France Inspection Analysis Device, By Industry Vertical (USD Billion, 2020-2034)
          • Automotive & Transportation
          • Semiconductor & Electronics
          • Metal & Materials
          • Machinery & Equipment
          • Aerospace & Defense
          • Medical & Pharmaceutical
          • Energy & Power
          • Others
      • UK Outlook (USD Billion, 2020-2034)
        • UK Inspection Analysis Device, By Type Outlook (USD Billion, 2020-2034)
          • Industrial CT
          • 3D Scanner
          • CMM
          • Machine Vision
          • SEM
          • TEM
        • UK Inspection Analysis Device, By Industry Vertical (USD Billion, 2020-2034)
          • Automotive & Transportation
          • Semiconductor & Electronics
          • Metal & Materials
          • Machinery & Equipment
          • Aerospace & Defense
          • Medical & Pharmaceutical
          • Energy & Power
          • Others
      • Rest of Europe Outlook (USD Billion, 2020-2034)
        • Rest of Europe Inspection Analysis Device, By Type Outlook (USD Billion, 2020-2034)
          • Industrial CT
          • 3D Scanner
          • CMM
          • Machine Vision
          • SEM
          • TEM
        • Rest of Europe Inspection Analysis Device, By Industry Vertical (USD Billion, 2020-2034)
          • Automotive & Transportation
          • Semiconductor & Electronics
          • Metal & Materials
          • Machinery & Equipment
          • Aerospace & Defense
          • Medical & Pharmaceutical
          • Energy & Power
          • Others
    • Asia-Pacific Outlook (USD Billion, 2020-2034)
      • Asia-Pacific Inspection Analysis Device, By Type Outlook (USD Billion, 2020-2034)
        • Industrial CT
        • 3D Scanner
        • CMM
        • Machine Vision
        • SEM
        • TEM
      • Asia-Pacific Inspection Analysis Device, By Industry Vertical (USD Billion, 2020-2034)
        • Automotive & Transportation
        • Semiconductor & Electronics
        • Metal & Materials
        • Machinery & Equipment
        • Aerospace & Defense
        • Medical & Pharmaceutical
        • Energy & Power
        • Others
      • China Outlook (USD Billion, 2020-2034)
        • China Inspection Analysis Device, By Type Outlook (USD Billion, 2020-2034)
          • Industrial CT
          • 3D Scanner
          • CMM
          • Machine Vision
          • SEM
          • TEM
        • China Inspection Analysis Device, By Industry Vertical (USD Billion, 2020-2034)
          • Automotive & Transportation
          • Semiconductor & Electronics
          • Metal & Materials
          • Machinery & Equipment
          • Aerospace & Defense
          • Medical & Pharmaceutical
          • Energy & Power
          • Others
      • India Outlook (USD Billion, 2020-2034)
        • India Inspection Analysis Device, By Type Outlook (USD Billion, 2020-2034)
          • Industrial CT
          • 3D Scanner
          • CMM
          • Machine Vision
          • SEM
          • TEM
        • India Inspection Analysis Device, By Industry Vertical (USD Billion, 2020-2034)
          • Automotive & Transportation
          • Semiconductor & Electronics
          • Metal & Materials
          • Machinery & Equipment
          • Aerospace & Defense
          • Medical & Pharmaceutical
          • Energy & Power
          • Others
      • Japan Outlook (USD Billion, 2020-2034)
        • Japan Inspection Analysis Device, By Type Outlook (USD Billion, 2020-2034)
          • Industrial CT
          • 3D Scanner
          • CMM
          • Machine Vision
          • SEM
          • TEM
        • Japan Inspection Analysis Device, By Industry Vertical (USD Billion, 2020-2034)
          • Automotive & Transportation
          • Semiconductor & Electronics
          • Metal & Materials
          • Machinery & Equipment
          • Aerospace & Defense
          • Medical & Pharmaceutical
          • Energy & Power
          • Others
      • Rest of Asia-Pacific Outlook (USD Billion, 2020-2034)
        • Rest of Asia-Pacific Inspection Analysis Device, By Type Outlook (USD Billion, 2020-2034)
          • Industrial CT
          • 3D Scanner
          • CMM
          • Machine Vision
          • SEM
          • TEM
        • Rest of Asia-Pacific Inspection Analysis Device, By Industry Vertical (USD Billion, 2020-2034)
          • Automotive & Transportation
          • Semiconductor & Electronics
          • Metal & Materials
          • Machinery & Equipment
          • Aerospace & Defense
          • Medical & Pharmaceutical
          • Energy & Power
          • Others
    • Rest of the World Outlook (USD Billion, 2020-2034)
      • Rest of the World Inspection Analysis Device, By Type Outlook (USD Billion, 2020-2034)
        • Industrial CT
        • 3D Scanner
        • CMM
        • Machine Vision
        • SEM
        • TEM
      • Rest of the World Inspection Analysis Device, By Industry Vertical (USD Billion, 2020-2034)
        • Automotive & Transportation
        • Semiconductor & Electronics
        • Metal & Materials
        • Machinery & Equipment
        • Aerospace & Defense
        • Medical & Pharmaceutical
        • Energy & Power
        • Others
      • Middle East & Africa Outlook (USD Billion, 2020-2034)
        • Middle East & Africa Inspection Analysis Device, By Type Outlook (USD Billion, 2020-2034)
          • Industrial CT
          • 3D Scanner
          • CMM
          • Machine Vision
          • SEM
          • TEM
        • Middle East & Africa Inspection Analysis Device, By Industry Vertical (USD Billion, 2020-2034)
          • Automotive & Transportation
          • Semiconductor & Electronics
          • Metal & Materials
          • Machinery & Equipment
          • Aerospace & Defense
          • Medical & Pharmaceutical
          • Energy & Power
          • Others
      • South America Outlook (USD Billion, 2020-2034)
        • South America Inspection Analysis Device, By Type Outlook (USD Billion, 2020-2034)
          • Industrial CT
          • 3D Scanner
          • CMM
          • Machine Vision
          • SEM
          • TEM
        • South America Inspection Analysis Device, By Industry Vertical (USD Billion, 2020-2034)
          • Automotive & Transportation
          • Semiconductor & Electronics
          • Metal & Materials
          • Machinery & Equipment
          • Aerospace & Defense
          • Medical & Pharmaceutical
          • Energy & Power
          • Others
    Infographic

    Free Sample Request

    Kindly complete the form below to receive a free sample of this Report

    Get Free Sample

    Customer Strories

    “I am very pleased with how market segments have been defined in a relevant way for my purposes (such as "Portable Freezers & refrigerators" and "last-mile"). In general the report is well structured. Thanks very much for your efforts.”

    Victoria Milne

    Founder
    Case Study
    Chemicals and Materials