• Cat-intel
  • MedIntelliX
  • Resources
  • About Us
  • Hero Background
    English
    Chinese
    French
    Japanese
    Korean
    German
    Spanish

    Digital Shipyard Market Size

    ID: MRFR/A&D/8154-HCR
    168 Pages
    Swapnil Palwe
    October 2025

    Digital Shipyard Market Research Report Information by Process (Research & Development, Design & Engineering, Manufacturing & Planning, Maintenance & Support and Training & Simulation), Shipyard Type (Commercial Shipyards and Military Shipyards), Capacity (Small Shipyards, Medium Shipyards and Large Shipyards), Digitalization Level (Fully Digital Shipyard, Semi Digital Shipy...

    Share:
    Download PDF ×

    We do not share your information with anyone. However, we may send you emails based on your report interest from time to time. You may contact us at any time to opt-out.

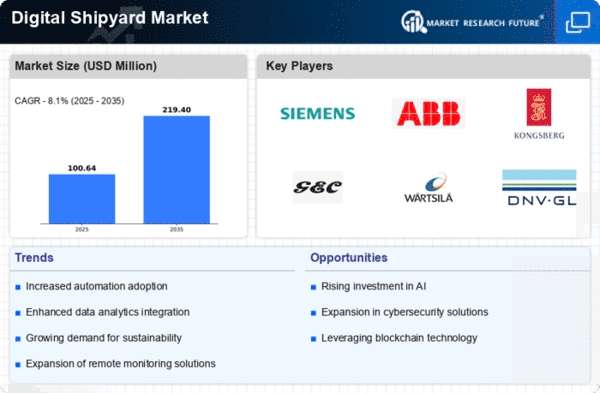
    Digital Shipyard Market Infographic
    $ 4,950.0
    $ 5,950.0
    $ 7,250.0

    Digital Shipyard Size

    Digital Shipyard Market Growth Projections and Opportunities

    Simulation and virtual training have become popular and cost-effective alternatives to traditional live training. This innovative solution has gained significant attention in recent years due to its versatility in applications, including virtual military training, emergency evacuation simulations, virtual firefighting exercises, and more. Notably, all branches of the military, such as the army, navy, and air force, have benefited from this advanced training method.

    Advancements in computer technology have played a crucial role in enhancing simulation platforms. The continuous improvement of computer processors, graphics capabilities, computing speed, hardware, and visual displays has resulted in more realistic simulations. This progress allows individuals to engage in activities like piloting a plane, operating a submarine, dropping bombs, and firing missiles in a lifelike virtual environment—tasks that would be challenging or impossible in the real world.

    The military simulation and virtual training market are primarily driven by factors such as the increasing emphasis on maritime security, leading to a growing demand for virtual solutions in naval training. Additionally, there is a focus on implementing flight simulators to train combat aircraft pilots. However, it's important to note that virtual systems may not fully replicate the psychological effects experienced during live training, posing a potential limitation to market growth. Despite this challenge, the adoption of augmented reality (AR) technology in the aerospace and defense sector, along with the rising use of unmanned aerial vehicles (UAVs) and the subsequent demand for drone simulators, presents promising growth opportunities for the market.

    The global military simulation and virtual training market are projected to experience a Compound Annual Growth Rate (CAGR) of 6.92% during the forecast period from 2018 to 2023. In 2017, North America led the market with a 35.02% share, followed by Europe and Asia-Pacific with shares of 24.45% and 22.74%, respectively. Asia-Pacific has emerged as a lucrative region for companies in the military simulation and virtual training sector, driven by significant defense spending and demand from countries such as China, India, and South Korea.

    The market segmentation is based on platform, solution, and region. The airborne segment held the largest market share (50.04%) in 2017, with a market value of USD 2,474.3 million. This segment is projected to witness a CAGR of 7.02% during the forecast period. In terms of solution, the flight simulation and training segment accounted for the largest market share (40.49%) in 2017, with a market value of USD 2,002.1 million. This segment is expected to experience a CAGR of 7.20% during the forecast period.
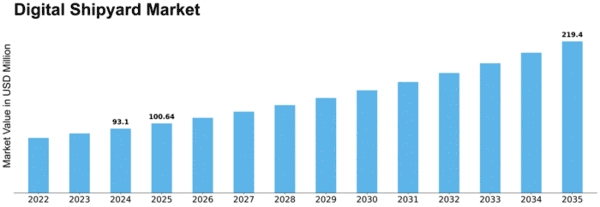
    Digital Shipyard Market Size Graph

    Market Summary

    As per Market Research Future Analysis, the Digital Shipyard Market is poised for significant growth, driven by advancements in technology and increasing international seaborne trade. The market is expected to reach USD 4,768.33 Million by 2032, with a robust CAGR of 20.2%. The digital shipyard concept enhances operational efficiency, safety, and speed in the marine industry, providing tangible benefits during design, construction, and service phases. However, challenges such as cyber threats and high software acquisition costs may hinder growth.

    Key Market Trends & Highlights

    Key trends influencing the Digital Shipyard Market include technological advancements and increased investment.

    • Market Size by 2032: USD 4,768.33 Million. CAGR during forecast period: 20.2%. Significant growth driven by advanced vessel procurement by navies globally. R&D segment dominated the market in 2019, with increasing activities expected to drive growth.

    Market Size & Forecast

    Market Size USD 4,768.33 Million by 2032
    CAGR 20.2%
    Dominant Segment in 2019 Research & Development
    Highest Growth Segment Manufacturing & Planning.

    Major Players

    <p>Siemens (Germany), Dassault Systèmes (France), AVEVA Group plc (UK), Accenture (Ireland), SAP SE (Germany), BAE Systems (UK), HexagonAB (Sweden), Altair Engineering, Inc. (US), Wärtsilä (Finland), IBM Corporation.</p>

    Market Trends

    <p>The integration of advanced digital technologies in shipbuilding processes is poised to enhance operational efficiency and reduce costs, thereby transforming traditional shipyards into highly automated digital environments.</p>

    U.S. Department of Transportation

    Digital Shipyard Market Market Drivers

    Technological Advancements

    The Global Digital Shipyard Market Industry is experiencing rapid technological advancements that enhance operational efficiency and reduce costs. Innovations such as artificial intelligence, machine learning, and the Internet of Things are being integrated into shipbuilding processes. For instance, predictive maintenance powered by AI can significantly minimize downtime, thereby optimizing production schedules. As a result, the market is projected to grow from 872.5 USD Million in 2024 to an estimated 8280.9 USD Million by 2035, reflecting a robust CAGR of 22.7% from 2025 to 2035. This growth underscores the industry's shift towards digitalization and automation.

    Market Segment Insights

    Regional Insights

    Key Companies in the Digital Shipyard Market market include

    Industry Developments

    Future Outlook

    Digital Shipyard Market Future Outlook

    <p>The Digital Shipyard Market is projected to grow at a 22.7% CAGR from 2024 to 2035, driven by advancements in automation, IoT integration, and sustainability initiatives.</p>

    New opportunities lie in:

    • <p>Invest in AI-driven predictive maintenance solutions to enhance operational efficiency. Develop blockchain-based supply chain management systems for improved transparency. Leverage augmented reality for remote collaboration and training in shipbuilding processes.</p>

    <p>By 2035, the Digital Shipyard Market is expected to be a cornerstone of maritime innovation and operational excellence.</p>

    Market Segmentation

    Report Scope

    Report Attribute/MetricDetails
      Market Size  USD 4,768.33 Million (2030)
      CAGR  20.2% (2022-2030)
      Base Year  2023
      Forecast Period  2024-2032
      Historical Data  2022
      Forecast Units  Value (USD Million)
      Report Coverage  Revenue Forecast, Competitive Landscape, Growth Factors, and Trends
      Segments Covered  Process, Shipyard Type, Capacity, Technology
      Geographies Covered  North America, Europe, Asia-Pacific, and Rest of the World (RoW)
      Key Vendors  Siemens (Germany), Dassault Systèmes (France), AVEVA Group plc (UK), Accenture (Ireland), SAP SE (Germany), BAE Systems (UK), HexagonAB (Sweden), Altair Engineering, Inc. (US), Wärtsilä (Finland), IBM Corporation
      Key Market Opportunities  Technology advancements in the marine industry
      Key Market Drivers·  The rise in adoption of the digital twin in the shipbuilding industry. ·  The rise in international seaborne trade. ·  Increasing procurement of advanced vessels by navies across the world

    Market Highlights

    Author

    Swapnil Palwe
    Team Lead - Research

    She holds an experience of about 6+ years in market research and business consulting, working under the spectrum of information communication technology, telecommunications and semiconductor domains. aarti conceptualizes and implements a scalable business strategy and provides strategic leadership to the clients. her expertise lies in market estimation, competitive intelligence, pipeline analysis, customer assessment, etc.

    Leave a Comment

    Latest Comments

    John Doe
    john@example.com

    This is a great article! Really helped me understand the topic better.

    Posted on July 23, 2025, 10:15 AM
    Jane Smith
    jane@domain.com

    Thanks for sharing this. I’ve bookmarked it for later reference.

    Posted on July 22, 2025, 7:45 PM

    FAQs

    What factors are estimated to steer the digital shipyard market in the impending period?

    The upsurge in the procurement of progressive vessels is predicted to spur the worldwide market.

    Who are the leaders of the digital shipyard market change in the forecast period?

    Accenture (Ireland), SAP SE (Germany), BAE Systems (UK), Dassault Systèmes (France), AVEVA Group plc (UK), HexagonAB (Sweden), and Altair Engineering, Inc. (US) are the key leaders in the market.

    Which geographical markets are contributing to the overall digital shipyard market expansion?

    The market of the North American region is estimated to sour the market in the years ahead.

    What is the CAGR forecasted for the digital shipyard market in the assessment period?

    An optimistic CAGR of 20.2% is predicted to motivate the global market in the approaching period.

    What income levels can be projected from the global digital shipyard market in the forecast period?

    The revenue of USD 4,768.33 million by 2030 is estimated to guide the market in the near future.

    1. --- "Table of Contents
    2. Executive Summary
      1. Market Attractiveness Analysis
        1. Global Digital Shipyard Market, by Process
        2. Global Digital Shipyard Market, by Shipyard Type
        3. Global Digital Shipyard Market, by Capacity
        4. Global Digital Shipyard Market, by Digitalization Level
        5. Global Digital Shipyard Market, by Technology
        6. Global Digital Shipyard Market, by End Use
        7. Global Digital Shipyard Market, by Region
    3. Market Introduction
      1. Market Definition
      2. Scope of the Study
      3. Market Structure
      4. Key Buying Criteria
      5. Market Factor Indicator Analysis
    4. Research Methodology
      1. Research Process
      2. Primary Research
      3. Secondary Research
      4. Market Size Estimation
      5. Product Model
      6. List of Assumptions
    5. Market Insights
    6. Market Dynamics
      1. Introduction
      2. Drivers
        1. Rise in Adoption of Digital Twin in Shipbuilding Industry
        2. Rise in International Seaborne Trade
        3. Increasing Procurement of Advanced Vessels by Navies Across the World
        4. Drivers Impact Analysis
      3. Restraints
        1. Issues Related to Cyber Threats
        2. High Cost of Acquisition
        3. Restraints Impact Analysis
      4. Opportunities
      5. Market/Technological Trends
      6. Patent Trends
      7. Regulatory Landscape/Standards
    7. Market Factor Analysis
      1. Supply Chain Analysis
        1. R&D
        2. Manufacturing
        3. Distribution & Sales
        4. Post-Sales Monitoring
      2. Porter’s Five Forces Analysis
        1. Threat of New Entrants
        2. Bargaining Power of Suppliers
        3. Bargaining Power of Buyers
        4. Threat of Substitutes
        5. Rivalry
    8. Global Digital Shipyard Market, by Process
      1. Introduction
      2. Research & Development
      3. Design & Engineering
      4. Manufacturing & Planning
      5. Maintenance & Support
      6. Training & Simulation
    9. Global Digital Shipyard Market, by Shipyard Type
      1. Introduction
      2. Commercial Shipyards
      3. Military Shipyards
    10. Global Digital Shipyard Market, by Capacity
      1. Introduction
      2. Small Shipyards
      3. Medium Shipyards
      4. Large Shipyards
    11. Global Digital Shipyard Market, by Digitalization Level
      1. Introduction
      2. Fully Digital Shipyard
      3. Semi Digital Shipyard
      4. Partially Digital Shipyard
    12. Global Digital Shipyard Market, by Technology
      1. Introduction
      2. Augmented & Virtual Reality (AR & VR)
      3. Digital Twin & Simulation
      4. Additive Manufacturing
      5. Artificial Intelligence & Big Data Analytics
      6. Robotic Process Automation
      7. Industrial Internet of Things (IIoT)
      8. Cybersecurity
      9. Blockchain
      10. Cloud Computing & Master Data Management
    13. Global Digital Shipyard Market, by End Use
      1. Introduction
      2. Implementation
      3. Upgrades & Services
    14. Global Digital Shipyard Market, by Region
      1. Introduction
      2. North America
        1. US
        2. Canada
      3. Europe
        1. UK
        2. Germany
        3. France
        4. Russia
        5. Netherlands
        6. Rest of Europe
      4. Asia-Pacific
        1. China
        2. India
        3. Japan
        4. South Korea
        5. Rest of Asia-Pacific
      5. Middle East
        1. UAE
        2. Saudi Arabia
        3. Israel
        4. Rest of the Middle East
      6. Rest of the World
        1. Latin America
        2. Africa
    15. Competitive Landscape
      1. Competitive Overview
      2. Competitor Dashboard
      3. Major Growth Strategies in the Global Digital Shipyard Market
      4. Competitive Benchmarking
      5. Market Share Analysis
      6. Leading Player in Terms of Number of Developments in the Global Digital Shipyard Market
      7. Key Developments & Growth Strategies
        1. Product Launches/Service Deployments
        2. Mergers & Acquisitions
        3. Joint Ventures
    16. Company Profiles
      1. Key Market Players
    17. (Company overview, products & services offered, financial overview, key developments, SWOT analysis, and key strategies to be covered for public companies)
      1. Siemens
      2. Dassault Systèmes
      3. AVEVA Group plc
      4. Accenture
      5. SAP SE
      6. BAE Systems
      7. Hexagon AB
      8. Altair Engineering, Inc.
      9. Wärtsilä
      10. IBM Corporation
    18. Other Prominent Players
      1. Inmarsat Plc
      2. IFS AB
      3. Pemamek Ltd.
      4. Aras Corporation
      5. Kreyon Systems Pvt. Ltd
      6. KUKA AG
      7. iBASEt
      8. PROSTEP Inc.
      9. KRANENDONK Smart robotics
      10. Damen Shipyards Group
      11. Navantia
    19. Appendix
      1. References
      2. Related Reports
      3. List of Abbreviations
    20. List of Tables and Figures
      1. List of Tables
      2. TABLE 1 List of Assumptions
      3. TABLE 2 Major Patents Granted for Digital Shipyard (2014–2020)
      4. TABLE 3 Global Digital Shipyard Market, by Process, 2020–2030 (USD Million)
      5. TABLE 4 Global Digital Shipyard Market, by Capacity, 2020–2030(USD Million)
      6. TABLE 5 Global Digital Shipyard Market, by Digitalization Level, 2020–2030 (USD Million)
      7. TABLE 6 Global Digital Shipyard Market, By Shipyard Type, 2020–2030 (USD Million)
      8. TABLE 7 Global Digital Shipyard Market, by Technology, 2020–2030 (USD Million)
      9. TABLE 8 Global Digital Shipyard Market, by End Use, 2020–2030 (USD Million)
      10. TABLE 9 Global Digital Shipyard Market, by Region, 2020–2030 (USD Million)
      11. TABLE 10 North America: Digital Shipyard Market, by Country, 2020–2030(USD Million)
      12. TABLE 11 North America: Digital Shipyard Market, by Process, 2020–2030 (USD Million)
      13. TABLE 12 North America: Digital Shipyard Market, by Capacity, 2020–2030 (USD Million)
      14. TABLE 13 North America: Digital Shipyard Market, by Digitalization Level, 2020–2030 (USD Million)
      15. TABLE 14 North America: Digital Shipyard Market, By Shipyard Type, 2020–2030 (USD Million)
      16. TABLE 15 North America: Digital Shipyard Market, by Technology, 2020–2030(USD Million)
      17. TABLE 16 North America: Digital Shipyard Market, by End Use, 2020–2030(USD Million)
      18. TABLE 17 US: Digital Shipyard Market, by Process, 2020–2030 (USD Million)
      19. TABLE 18 US: Digital Shipyard Market, by Capacity, 2020–2030 (USD Million)
      20. TABLE 19 US: Digital Shipyard Market, by Digitalization Level, 2020–2030 (USD Million)
      21. TABLE 20 US: Digital Shipyard Market, by Shipyard Type, 2020–2030 (USD Million)
      22. TABLE 21 US: Digital Shipyard Market, by Technology, 2020–2030 (USD Million)
      23. TABLE 22 US: Digital Shipyard Market, by End Use, 2020–2030 (USD Million)
      24. TABLE 23 Canada: Digital Shipyard Market, by Process, 2020–2030 (USD Million)
      25. TABLE 24 Canada: Digital Shipyard Market, by Capacity, 2020–2030 (USD Million)
      26. TABLE 25 Canada: Digital Shipyard Market, by Digitalization Level, 2020–2030 (USD Million)
      27. TABLE 26 Canada: Digital Shipyard Market, by Shipyard Type, 2020–2030 (USD Million)
      28. TABLE 27 Canada: Digital Shipyard Market, by Technology, 2020–2030 (USD Million)
      29. TABLE 28 Canada: Digital Shipyard Market, by End Use, 2020–2030 (USD Million)
      30. TABLE 29 Europe: Digital Shipyard Market, by Country, 2020–2030 (USD Million)
      31. TABLE 30 Europe: Digital Shipyard Market, by Process, 2020–2030 (USD Million)
      32. TABLE 31 Europe: Digital Shipyard Market, by Capacity, 2020–2030 (USD Million)
      33. TABLE 32 Europe: Digital Shipyard Market, by Digitalization Level, 2020–2030 (USD Million)
      34. TABLE 33 Europe: Digital Shipyard Market, by Shipyard Type, 2020–2030 (USD Million)
      35. TABLE 34 Europe: Digital Shipyard Market, by Technology, 2020–2030 (USD Million)
      36. TABLE 35 Europe: Digital Shipyard Market, by End Use, 2020–2030 (USD Million)
      37. TABLE 36 UK: Digital Shipyard Market, by Process, 2020–2030 (USD Million)
      38. TABLE 37 UK: Digital Shipyard Market, by Capacity, 2020–2030 (USD Million)
      39. TABLE 38 UK: Digital Shipyard Market, by Digitalization Level, 2020–2030 (USD Million)
      40. TABLE 39 UK: Digital Shipyard Market, by Shipyard Type, 2020–2030 (USD Million)
      41. TABLE 40 UK: Digital Shipyard Market, by Technology, 2020–2030 (USD Million)
      42. TABLE 41 UK: Digital Shipyard Market, by End Use, 2020–2030 (USD Million)
      43. TABLE 42 Germany: Digital Shipyard Market, by Process, 2020–2030 (USD Million)
      44. TABLE 43 Germany: Digital Shipyard Market, by Capacity, 2020–2030 (USD Million)
      45. TABLE 44 Germany: Digital Shipyard Market, by Digitalization Level, 2020–2030 (USD Million)
      46. TABLE 45 Germany: Digital Shipyard Market, by Shipyard Type, 2020–2030 (USD Million)
      47. TABLE 46 Germany: Digital Shipyard Market, by Technology, 2020–2030 (USD Million)
      48. TABLE 47 Germany: Digital Shipyard Market, by End Use, 2020–2030 (USD Million)
      49. TABLE 48 France: Digital Shipyard Market, by Process, 2020–2030 (USD Million)
      50. TABLE 49 France: Digital Shipyard Market, by Capacity, 2020–2030 (USD Million)
      51. TABLE 50 France: Digital Shipyard Market, by Digitalization Level, 2020–2030 (USD Million)
      52. TABLE 51 France: Digital Shipyard Market, by Shipyard Type, 2020–2030 (USD Million)
      53. TABLE 52 France: Digital Shipyard Market, by Technology, 2020–2030 (USD Million)
      54. TABLE 53 France: Digital Shipyard Market, by End Use, 2020–2030 (USD Million)
      55. TABLE 54 Russia: Digital Shipyard Market, by Process, 2020–2030 (USD Million)
      56. TABLE 55 Russia: Digital Shipyard Market, by Capacity, 2020–2030 (USD Million)
      57. TABLE 56 Russia: Digital Shipyard Market, by Digitalization Level, 2020–2030 (USD Million)
      58. TABLE 57 Russia: Digital Shipyard Market, by Shipyard Type, 2020–2030 (USD Million)
      59. TABLE 58 Russia: Digital Shipyard Market, by Technology, 2020–2030 (USD Million)
      60. TABLE 59 Russia: Digital Shipyard Market, by End Use, 2020–2030 (USD Million)
      61. TABLE 60 Netherlands: Digital Shipyard Market, by Process, 2020–2030 (USD Million)
      62. TABLE 61 Netherlands: Digital Shipyard Market, by Capacity, 2020–2030 (USD Million)
      63. TABLE 62 Netherlands: Digital Shipyard Market, by Digitalization Level, 2020–2030 (USD Million)
      64. TABLE 63 Netherlands: Digital Shipyard Market, by Shipyard Type, 2020–2030 (USD Million)
      65. TABLE 64 Netherlands: Digital Shipyard Market, by Technology, 2020–2030 (USD Million)
      66. TABLE 65 Netherlands: Digital Shipyard Market, by End Use, 2020–2030 (USD Million)
      67. TABLE 66 Rest of Europe: Digital Shipyard Market, by Process, 2020–2030 (USD Million)
      68. TABLE 67 Rest of Europe: Digital Shipyard Market, by Capacity, 2020–2030 (USD Million)
      69. TABLE 68 Rest of Europe: Digital Shipyard Market, by Digitalization Level, 2020–2030 (USD Million)
      70. TABLE 69 Rest of Europe: Digital Shipyard Market, by Shipyard Type, 2020–2030 (USD Million)
      71. TABLE 70 Rest of Europe: Digital Shipyard Market, by Technology, 2020–2030 (USD Million)
      72. TABLE 71 Rest of Europe: Digital Shipyard Market, by End Use, 2020–2030 (USD Million)
      73. TABLE 72 Asia-Pacific: Digital Shipyard Market, by Country, 2020–2030 (USD Million)
      74. TABLE 73 Asia-Pacific: Digital Shipyard Market, by Process, 2020–2030 (USD Million)
      75. TABLE 74 Asia-Pacific: Digital Shipyard Market, by Capacity, 2020–2030 (USD Million)
      76. TABLE 75 Asia-Pacific: Digital Shipyard Market, by Digitalization Level, 2020–2030 (USD Million)
      77. TABLE 76 Asia-Pacific: Digital Shipyard Market, by Shipyard Type, 2020–2030 (USD Million)
      78. TABLE 77 Asia-Pacific: Digital Shipyard Market, by Technology, 2020–2030 (USD Million)
      79. TABLE 78 Asia-Pacific: Digital Shipyard Market, by End Use, 2020–2030 (USD Million)
      80. TABLE 79 China: Digital Shipyard Market, by Process, 2020–2030 (USD Million)
      81. TABLE 80 China: Digital Shipyard Market, by Capacity, 2020–2030 (USD Million)
      82. TABLE 81 China: Digital Shipyard Market, by Digitalization Level, 2020–2030 (USD Million)
      83. TABLE 82 China: Digital Shipyard Market, by Shipyard Type, 2020–2030 (USD Million)
      84. TABLE 83 China: Digital Shipyard Market, by Technology, 2020–2030 (USD Million)
      85. TABLE 84 China: Digital Shipyard Market, by End Use, 2020–2030 (USD Million)
      86. TABLE 85 India: Digital Shipyard Market, by Process, 2020–2030 (USD Million)
      87. TABLE 86 India: Digital Shipyard Market, by Capacity, 2020–2030 (USD Million)
      88. TABLE 87 India: Digital Shipyard Market, by Digitalization Level, 2020–2030 (USD Million)
      89. TABLE 88 India: Digital Shipyard Market, by Shipyard Type, 2020–2030 (USD Million)
      90. TABLE 89 India: Digital Shipyard Market, by Technology, 2020–2030 (USD Million)
      91. TABLE 90 India: Digital Shipyard Market, by End Use, 2020–2030 (USD Million)
      92. TABLE 91 Japan: Digital Shipyard Market, by Process, 2020–2030 (USD Million)
      93. TABLE 92 Japan: Digital Shipyard Market, by Capacity, 2020–2030 (USD Million)
      94. TABLE 93 Japan: Digital Shipyard Market, by Digitalization Level, 2020–2030 (USD Million)
      95. TABLE 94 Japan: Digital Shipyard Market, by Shipyard Type, 2020–2030 (USD Million)
      96. TABLE 95 Japan: Digital Shipyard Market, by Technology, 2020–2030 (USD Million)
      97. TABLE 96 Japan: Digital Shipyard Market, by End Use, 2020–2030 (USD Million)
      98. TABLE 97 South Korea: Digital Shipyard Market, by Process, 2020–2030 (USD Million)
      99. TABLE 98 South Korea: Digital Shipyard Market, by Capacity, 2020–2030 (USD Million)
      100. TABLE 99 South Korea: Digital Shipyard Market, by Digitalization Level, 2020–2030 (USD Million)
      101. TABLE 100 South Korea: Digital Shipyard Market, by Shipyard Type, 2020–2030 (USD Million)
      102. TABLE 101 South Korea: Digital Shipyard Market, by Technology, 2020–2030 (USD Million)
      103. TABLE 102 South Korea: Digital Shipyard Market, by End Use, 2020–2030 (USD Million)
      104. TABLE 103 Rest of Asia-Pacific: Digital Shipyard Market, by Process, 2020–2030 (USD Million)
      105. TABLE 104 Rest of Asia-Pacific: Digital Shipyard Market, by Capacity, 2020–2030 (USD Million)
      106. TABLE 105 Rest of Asia-Pacific: Digital Shipyard Market, by Digitalization Level, 2020–2030 (USD Million)
      107. TABLE 106 Rest of Asia-Pacific: Digital Shipyard Market, by Shipyard Type, 2020–2030 (USD Million)
      108. TABLE 107 Rest of Asia-Pacific: Digital Shipyard Market, by Technology, 2020–2030 (USD Million)
      109. TABLE 108 Rest of Asia-Pacific: Digital Shipyard Market, by End Use, 2020–2030 (USD Million)
      110. TABLE 109 Middle East: Digital Shipyard Market, by Country, 2020–2030 (USD Million)
      111. TABLE 110 Middle East: Digital Shipyard Market, by Process, 2020–2030 (USD Million)
      112. TABLE 111 Middle East: Digital Shipyard Market, by Capacity, 2020–2030 (USD Million)
      113. TABLE 112 Middle East: Digital Shipyard Market, by Digitalization Level, 2020–2030 (USD Million)
      114. TABLE 113 Middle East: Digital Shipyard Market, by Shipyard Type, 2020–2030 (USD Million)
      115. TABLE 114 Middle East: Digital Shipyard Market, by Technology, 2020–2030 (USD Million)
      116. TABLE 115 Middle East: Digital Shipyard Market, by End Use, 2020–2030 (USD Million)
      117. TABLE 116 UAE: Digital Shipyard Market, by Process, 2020–2030 (USD Million)
      118. TABLE 117 UAE: Digital Shipyard Market, by Capacity, 2020–2030 (USD Million)
      119. TABLE 118 UAE: Digital Shipyard Market, by Digitalization Level, 2020–2030 (USD Million)
      120. TABLE 119 UAE: Digital Shipyard Market, by Shipyard Type, 2020–2030 (USD Million)
      121. TABLE 120 UAE: Digital Shipyard Market, by Technology, 2020–2030 (USD Million)
      122. TABLE 121 UAE: Digital Shipyard Market, by End Use, 2020–2030 (USD Million)
      123. TABLE 122 Saudi Arabia: Digital Shipyard Market, by Process, 2020–2030 (USD Million)
      124. TABLE 123 Saudi Arabia: Digital Shipyard Market, by Capacity, 2020–2030 (USD Million)
      125. TABLE 124 Saudi Arabia: Digital Shipyard Market, by Digitalization Level, 2020–2030 (USD Million)
      126. TABLE 125 Saudi Arabia: Digital Shipyard Market, by Shipyard Type, 2020–2030 (USD Million)
      127. TABLE 126 Saudi Arabia: Digital Shipyard Market, by Technology, 2020–2030 (USD Million)
      128. TABLE 127 Saudi Arabia: Digital Shipyard Market, by End Use, 2020–2030 (USD Million)
      129. TABLE 128 Israel: Digital Shipyard Market, by Process, 2020–2030 (USD Million)
      130. TABLE 129 Israel: Digital Shipyard Market, by Capacity, 2020–2030 (USD Million)
      131. TABLE 130 Israel: Digital Shipyard Market, by Digitalization Level, 2020–2030 (USD Million)
      132. TABLE 131 Israel: Digital Shipyard Market, by Shipyard Type, 2020–2030 (USD Million)
      133. TABLE 132 Israel: Digital Shipyard Market, by Technology, 2020–2030 (USD Million)
      134. TABLE 133 Israel: Digital Shipyard Market, by End Use, 2020–2030 (USD Million)
      135. TABLE 134 Rest of the Middle East: Digital Shipyard Market, by Process, 2020–2030 (USD Million)
      136. TABLE 135 Rest of the Middle East: Digital Shipyard Market, by Capacity, 2020–2030 (USD Million)
      137. TABLE 136 Rest of the Middle East: Digital Shipyard Market, by Digitalization Level, 2020–2030 (USD Million)
      138. TABLE 137 Rest of the Middle East: Digital Shipyard Market, by Shipyard Type, 2020–2030 (USD Million)
      139. TABLE 138 Rest of the Middle East: Digital Shipyard Market, by Technology, 2020–2030 (USD Million)
      140. TABLE 139 Rest of the Middle East: Digital Shipyard Market, by End Use, 2020–2030 (USD Million)
      141. TABLE 140 Rest of the World: Digital Shipyard Market, by Region, 2020–2030 (USD Million)
      142. TABLE 141 Rest of the World: Digital Shipyard Market, by Process, 2020–2030 (USD Million)
      143. TABLE 142 Rest of the World: Digital Shipyard Market, by Capacity, 2020–2030 (USD Million)
      144. TABLE 143 Rest of the World: Digital Shipyard Market, by Digitalization Level, 2020–2030 (USD Million)
      145. TABLE 144 Rest of the World: Digital Shipyard Market, by Shipyard Type, 2020–2030 (USD Million)
      146. TABLE 145 Rest of the World: Digital Shipyard Market, by Technology, 2020–2030 (USD Million)
      147. TABLE 146 Rest of the World: Digital Shipyard Market, by End Use, 2020–2030 (USD Million)
      148. TABLE 147 Latin America: Digital Shipyard Market, by Process, 2020–2030 (USD Million)
      149. TABLE 148 Latin America: Digital Shipyard Market, by Capacity, 2020–2030 (USD Million)
      150. TABLE 149 Latin America: Digital Shipyard Market, by Digitalization Level, 2020–2030 (USD Million)
      151. TABLE 150 Latin America: Digital Shipyard Market, by Shipyard Type, 2020–2030 (USD Million)
      152. TABLE 151 Latin America: Digital Shipyard Market, by Technology, 2020–2030 (USD Million)
      153. TABLE 152 Latin America: Digital Shipyard Market, by End Use, 2020–2030 (USD Million)
      154. TABLE 153 Africa: Digital Shipyard Market, by Process, 2020–2030 (USD Million)
      155. TABLE 154 Africa: Digital Shipyard Market, by Capacity, 2020–2030 (USD Million)
      156. TABLE 155 Africa: Digital Shipyard Market, by Digitalization Level, 2020–2030 (USD Million)
      157. TABLE 156 Africa: Digital Shipyard Market, by Shipyard Type, 2020–2030 (USD Million)
      158. TABLE 157 Africa: Digital Shipyard Market, by Technology, 2020–2030 (USD Million)
      159. TABLE 158 Africa: Digital Shipyard Market, by End Use, 2020–2030 (USD Million)
      160. TABLE 159 The Most Active Players in the Global Digital Shipyard Market
      161. TABLE 160 Contracts & Agreements
      162. TABLE 161 Mergers & Acquisitions
      163. TABLE 162 Product/Service Developments
      164. TABLE 163 Expansions & Investments
      165. TABLE 164 Joint Ventures & Partnerships   List of Figures
      166. Figure 1 Market Synopsis
      167. Figure 2 Global Digital Shipyard Market: Market Attractiveness Analysis
      168. Figure 3 Global Digital Shipyard Market Analysis, by Process
      169. Figure 4 Global Digital Shipyard Market Analysis, by Capacity
      170. Figure 5 Global Digital Shipyard Market Analysis, by Digitalization Level
      171. Figure 6 Global Digital Shipyard Market Analysis, by Shipyard Type
      172. Figure 7 Global Digital Shipyard Market Analysis, by Technology
      173. Figure 8 Global Digital Shipyard Market Analysis, by End Use
      174. Figure 9 Global Digital Shipyard Market Analysis, by Region
      175. Figure 10 Global Digital Shipyard Market: Market Structure
      176. Figure 11 Key Buying Criteria for Digital Shipyard Technologies
      177. Figure 12 Research Process of MRFR
      178. Figure 13 North America: Market Size & Market Share, by Country, 2020 vs 2030
      179. Figure 14 Europe: Market Size & Market Share, by Country, 2020 vs 2030
      180. Figure 15 Asia-Pacific: Market Size & Market Share, by Country, 2020 vs 2030
      181. Figure 16 Middle East: Market Size & Market Share, by Country, 2020 vs 2030
      182. Figure 17 Rest of the World: Market Size & Market Share, by Country, 2020 vs 2030
      183. Figure 18 Market Dynamics Overview
      184. Figure 19 Drivers Impact Analysis: Global Digital Shipyard Market
      185. Figure 20 Restraints Impact Analysis: Global Digital Shipyard Market
      186. Figure 21 Porter’s Five Forces Analysis of the Global Digital Shipyard Market
      187. Figure 22 Supply Chain: Global Digital Shipyard Market
      188. Figure 23 Global Digital Shipyard Market Share, by Process, 2020 (% Share)
      189. Figure 24 Global Digital Shipyard Market Share, by Digitalization Level, 2020 (% Share)
      190. Figure 25 Global Digital Shipyard Market Share, by Capacity, 2020 (% Share)
      191. Figure 26 Global Digital Shipyard Market Share, by Shipyard Type, 2020 (% Share)
      192. Figure 27 Global Digital Shipyard Market Share, by Technology, 2020 (% Share)
      193. Figure 28 Global Digital Shipyard Market Share, by End Use, 2020 (% Share)
      194. Figure 29 Global Digital Shipyard Market Share, by Region, 2020 (% Share)
      195. Figure 30 North America: Digital Shipyard Market Share, by Country, 2020 (% Share)
      196. Figure 31 Europe: Digital Shipyard Market Share, by Country, 2020 (% Share)
      197. Figure 32 Asia-Pacific: Digital Shipyard Market Share, by Country, 2020 (% Share)
      198. Figure 33 Middle East: Digital Shipyard Market Share, by Country, 2020 (% Share)
      199. Figure 34 Rest of the World: Digital Shipyard Market Share, by Region, 2020 (% Share)
      200. Figure 35 Competitor Dashboard: Global Digital Shipyard Market
      201. Figure 36 Capital Market Ratio and Financial Matrix
      202. Figure 37 Contracts & Agreements: The Major Strategy Adopted by Key Players in the Global Digital Shipyard Market
      203. Figure 38 Benchmarking of Major Competitors
      204. Figure 39 Major Service Providers Market Share Analysis, 2020"

    Digital Shipyard Market Segmentation

    Market Segmentation Overview

    • Detailed segmentation data will be available in the full report
    • Comprehensive analysis by multiple parameters
    • Regional and country-level breakdowns
    • Market size forecasts by segment
    Infographic

    Free Sample Request

    Kindly complete the form below to receive a free sample of this Report

    Get Free Sample

    Customer Strories

    “I am very pleased with how market segments have been defined in a relevant way for my purposes (such as "Portable Freezers & refrigerators" and "last-mile"). In general the report is well structured. Thanks very much for your efforts.”

    Victoria Milne

    Founder
    Case Study
    Chemicals and Materials