Adhesives Sealants Handheld Devices Market Trends
ID: MRFR/CnM/2578-CR
175 Pages
January 2018
Adhesives and Sealants for Handheld Devices Market Research Report Information By Adhesive Type (Hot Melt Adhesives, Waterborne Adhesives, Pressure-Sensitive Adhesives, and Solvent-borne Adhesives), By Sealant Type (Acrylic Latex Sealants, Silicone Sealants, Epoxy Sealants, Polyurethane Sealant and Butyl Sealant), By Application (Laptops, Mobiles and Tablets, Medical devices, and Hard Disc Devi...
Market Summary
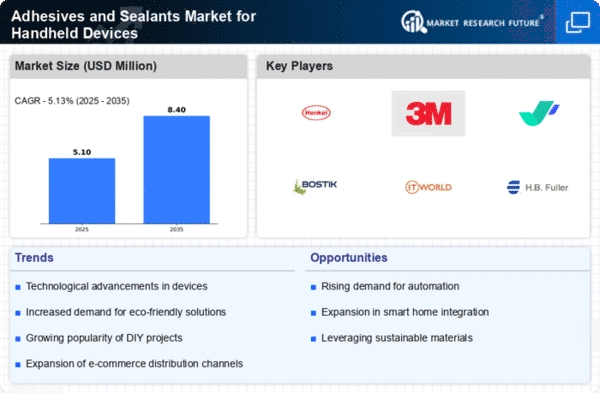
The Global Adhesives and Sealants for Handheld Devices Market is projected to grow significantly from 5.49 USD Billion in 2024 to 11.3 USD Billion by 2035.
Key Market Trends & Highlights
Adhesives and Sealants for Handheld Devices Key Trends and Highlights
- The market is expected to witness a compound annual growth rate (CAGR) of 6.74% from 2025 to 2035.
- By 2035, the market valuation is anticipated to reach 11.3 USD Billion, indicating robust growth potential.
- In 2024, the market is valued at 5.49 USD Billion, reflecting a strong foundation for future expansion.
- Growing adoption of advanced bonding technologies due to increasing demand for lightweight and durable materials is a major market driver.
Market Size & Forecast
| 2024 Market Size | 5.49 (USD Million) |
| 2035 Market Size | 11.3 (USD Million) |
| CAGR (2025-2035) | 6.74% |
| Largest Regional Market Share in 2024 | latin_america) |
Major Players
3M, Henkel AG, Co. KGaA, Tangent Industries, Evonik Industries AG, Novachem Corporation, H.B. Fuller, Dow Corning Corporation
Market Trends
The increasing demand for lightweight and durable materials in handheld devices is driving innovation in adhesive and sealant technologies, which are essential for enhancing device performance and longevity.
U.S. Department of Commerce
Adhesives Sealants Handheld Devices Market Market Drivers
Market Growth Projections
The Global Adhesives and Sealants for Handheld Devices Market Industry is poised for substantial growth, with projections indicating a market size of 5.49 USD Billion in 2024 and an anticipated increase to 11.3 USD Billion by 2035. This growth trajectory suggests a compound annual growth rate of 6.74% from 2025 to 2035, reflecting the increasing reliance on advanced adhesive technologies in the production of handheld devices. The market dynamics are influenced by various factors, including technological advancements, rising consumer demand, and regulatory compliance, all contributing to a robust and evolving landscape for adhesives and sealants in the handheld device sector.
Increasing Smartphone Penetration
The increasing penetration of smartphones globally significantly influences the Global Adhesives and Sealants for Handheld Devices Market Industry. With millions of new smartphone users emerging each year, the demand for reliable adhesive solutions to ensure device integrity and longevity is paramount. This trend is particularly pronounced in emerging markets, where smartphone adoption rates are skyrocketing. As manufacturers strive to produce more durable and aesthetically pleasing devices, the reliance on advanced adhesives becomes more pronounced. By 2035, the market is anticipated to expand to 11.3 USD Billion, reflecting the critical role adhesives play in the production of smartphones and other handheld devices.
Growing Consumer Electronics Market
The Global Adhesives and Sealants for Handheld Devices Market Industry is significantly impacted by the growing consumer electronics market. As consumer electronics continue to evolve, the demand for high-quality adhesives that can withstand rigorous usage and environmental conditions becomes increasingly important. This growth is evident in various sectors, including wearables, tablets, and gaming devices, where adhesive solutions are essential for assembly and performance. The continuous innovation in consumer electronics is expected to drive the market forward, with projections indicating a robust growth trajectory as manufacturers seek to enhance product quality and user satisfaction through superior adhesive technologies.
Regulatory Standards and Compliance
Regulatory standards and compliance requirements are becoming increasingly stringent within the Global Adhesives and Sealants for Handheld Devices Market Industry. Manufacturers are compelled to adhere to environmental regulations and safety standards, which necessitate the use of compliant adhesive solutions. This trend is particularly relevant in regions with strict environmental policies, where the demand for eco-friendly and non-toxic adhesives is on the rise. As a result, companies are investing in the development of sustainable adhesive technologies that meet regulatory requirements while maintaining performance. This shift not only enhances product safety but also positions manufacturers favorably in a competitive market.
Rising Demand for Lightweight Materials
The Global Adhesives and Sealants for Handheld Devices Market Industry experiences a notable surge in demand for lightweight materials, driven by the increasing consumer preference for portable and compact devices. Manufacturers are increasingly adopting advanced adhesive technologies to ensure optimal bonding while minimizing weight. This trend is particularly evident in the smartphone and tablet sectors, where the integration of lightweight materials enhances user experience and device performance. As a result, the market is projected to reach 5.49 USD Billion in 2024, with a significant portion attributed to innovations in adhesive formulations that cater to the lightweight requirements of modern handheld devices.
Technological Advancements in Adhesive Formulations
Technological advancements in adhesive formulations play a crucial role in shaping the Global Adhesives and Sealants for Handheld Devices Market Industry. Innovations such as the development of nanotechnology-based adhesives and bio-based sealants are gaining traction, offering superior performance characteristics. These advancements not only improve the durability and longevity of handheld devices but also align with the growing sustainability trends in manufacturing. The market is expected to witness a compound annual growth rate of 6.74% from 2025 to 2035, as manufacturers increasingly invest in research and development to create high-performance adhesives that meet the evolving needs of consumers.
Market Segment Insights
Regional Insights
Key Companies in the Adhesives Sealants Handheld Devices Market market include

Industry Developments
Future Outlook
Adhesives Sealants Handheld Devices Market Future Outlook
The Adhesives and Sealants for Handheld Devices Market is projected to grow at a 6.74% CAGR from 2024 to 2035, driven by technological advancements and increasing demand for lightweight materials.
New opportunities lie in:
- Develop eco-friendly adhesive formulations to meet sustainability trends.
- Invest in R&D for advanced bonding technologies in flexible displays.
- Expand distribution channels in emerging markets to capture new customer segments.
By 2035, the market is expected to achieve substantial growth, reflecting evolving consumer preferences and technological innovations.
Market Segmentation
Region Outlook
North America
- US
- Canada
- Mexico
Application Outlook
- Laptops
- Mobiles and Tablets
- Medical Devices
- Hard Disc Drives
Sealant Type Outlook
- Acrylic Latex Sealants
- Silicone Sealants
- Epoxy Sealants
- Polyurethane Sealant
- Butyl Sealant
Report Scope
| Attribute/Metric | Details |
| Market Size | 2022: USD 4,882.6 million2030: USD 7946.8 million |
| CAGR | 7.21% |
| Base Year | 2015 |
| Forecast Period | 2022-2030 |
| Historical Data | 2014 |
| Forecast Units | Value (USD Million) |
| Report Coverage | Revenue Forecast, Competitive Landscape, Growth Factors, and Trends |
| Segments Covered | By Adhesives, Sealants, Application and Region |
| Geographies Covered | North America, Europe, Asia-Pacific, and Rest of the World (RoW) |
| Key Vendors | 3M, Henkel AG, and Co. KGaA, Tangent Industries, Evonik Industries AG, Novachem Corporation, H.B. Fuller, and Dow Corning Corporation. |
| Key Market Opportunities | The commonly used adhesive is the hot melt adhesive with better rework ability and dependability properties. |
| Key Market Drivers | Rise in the demand for gaming laptops, and the growth of the electronic markets. |
Market Highlights
Author
Latest Comments
John Doe
This is a great article! Really helped me understand the topic better.
Posted on July 23, 2025, 10:15
AM
Jane Smith
Thanks for sharing this. I’ve bookmarked it for later reference.
Posted on July 22, 2025, 7:45
PM
FAQs
At what CAGR is the Adhesives & Sealants for the Handheld Devices Market predicted to grow during the forecast period?
Adhesives & Sealants for the Handheld Devices Market is predicted to grow at 7.21 % through forecast period of 2016-2023.
What is the forecast period of Adhesives & Sealants for the Handheld Devices Market research report?
The forecast period for Adhesives & Sealants for the Handheld Devices Market research report is 2016-2023.
Which region will lead the Adhesives & Sealants for the Handheld Devices Market?
Adhesives & Sealants for the Handheld Devices Market is dominated by APAC region.
Who are the key players in the Adhesives & Sealants for the Handheld Devices Market?
The main players in the Market are 3M, Henkel AG, and Co. KGaA, Tangent Industries, Evonik Industries AG, Novachem Corporation, H.B. Fuller, and Dow Corning Corporation.
-
Report Prologue
-
Scope of The Report 3.1 Market Definition
-
Research Objectives
- Assumptions
-
Research Objectives
-
Limitations
- Markets Structure
- Secondary Research
- Market Size Estimation
-
20
-
Market Dynamics 5.1 Introduction
-
Drivers
- Penetration of Smartphones
-
Drivers
-
and Tablets to Surge Adhesive & Sealants Demand
- Rising Popularity of
-
Gaming Laptops & Detachable Laptops
- Augmenting Demand for Adhesive
-
& Sealants in PCB Applications
- Growth in consumer electronics to augment
-
adhesives and sealants demand
-
Restraints
- Dramatic Surge in Adhesive
-
Restraints
-
& Sealant Raw Material Prices to Impede Market Growth
- Rapidly Changing
-
Technologies in the Consumer Electronics Market
- Trends & Opportunities
-
Significant FDI in the ASEAN Region From Developed Nations
- Product Innovation
-
For Next Generation Electronic Devices
- Macroeconomic Indicators
-
Rise in disposable income coupled with increased spending on consumer electronics
-
30
-
Market Factor Analysis 6.1 Supply Chain Analysis
-
Raw Material Suppliers
- Distribution Channel
- End-User Industry
- Porter’s
-
Raw Material Suppliers
-
Analysis
- Threat of New
-
Entrants
-
Threat of Rivalry
- Threat of Substitute
- Bargaining
-
Threat of Rivalry
-
power of supplier
- Bargaining Power of Buyers
-
Handheld Devices Market, By Adhesives Type 7.1 Introduction
- Hot Melt Adhesive
- Waterborne Adhesives
- Solvent Based
-
Adhesives
- Others
-
Application 8.1 Introduction
-
Laptops
- Mobile Phones & Tablets
- Medical Devices
- Others
-
Laptops
-
for Handheld Devices Market, By Region 9.1 Introduction
-
North America
- U.S
- Canada
-
Europe
- Germany
- France
-
North America
-
UK
-
Italy
- Spain
- Rest of Europe
-
Asia Pacific
- China
- Japan
- India
- Rest of Asia-Pacific
-
Italy
-
Latin America
- Middle East & Africa
-
Devices Market, By Sealants Type 10.1 Introduction
- Silicone Sealants
- Polyurethane Sealants
- Acrylic Latex Sealants
- Epoxy Sealants
- Others
-
Market, By Sealants Application 11.1 Introduction
- Mobile phone
-
Laptop
-
Hard Disc Drives
- Medical Devices
- Others
-
Hard Disc Drives
-
108
-
Global Sealants for Handheld Devices Market, By Region 12.1 Introduction
-
U.S
- Canada
- Europe
-
U.S
-
Germany
-
France
- UK
- Italy
- Spain
-
France
-
Rest of Europe
-
Asia Pacific
- China
- Japan
-
Asia Pacific
-
India
- Rest of Asia-Pacific
- Latin America
- Middle East
-
& Africa
- Market Share
-
Analysis
- Pricing Analysis
-
Key Developments & Strategies
- Company Overview
- Product/Business Segment Overview
- Financial Updates
-
Key Developments
-
3M
- Company Overview
- Product/Business
-
3M
-
Segment Overview
-
Financial Updates
- Key Developments
-
Financial Updates
-
Evonik Industries AG
-
Company Overview
- Product/Business Segment
-
Company Overview
-
Overview
-
Financial Updates
- Key Developments
- Dow Corning
-
Financial Updates
-
Corporation
-
Company Overview
- Product/Business Segment Overview
- Key Developments
-
H.B Fuller
- Company Profile
- Financial Overview
- Key Developments
- Company Profile
- Product/Business
-
Company Overview
-
Segment Overview
-
Financial Overview
- Key developments
-
Financial Overview
-
Tangent Industries
-
Company profile
- Product/Business Segment
-
Company profile
-
Overview
-
Financial Overview
- Key developments
-
Financial Overview
-
IMPACT ANALYSIS: DRIVERS
-
TABLE
-
IMPACT ANALYSIS: RESTRAINTS
-
IMPACT ANALYSIS: TRENDS & OPPORTUNITIES
-
TABLE
-
GLOBAL ADHESIVES
-
FOR HANDHELD DEVICES MARKET, BY ADHESIVE TYPE 2020-2027 (USD MILLION)
-
TABLE
-
GLOBAL ADHESIVES FOR HANDHELD DEVICES MARKET, BY ADHESIVE TYPE 2020-2027 (‘000 TONS)
-
TABLE
-
GLOBAL ADHESIVES FOR HANDHELD DEVICES MARKET FOR ADHESIVE TYPE, BY REGION, 2020-2027, (USD MILLION)
-
TABLE
-
GLOBAL ADHESIVES FOR HANDHELD DEVICES MARKET FOR ADHESIVE TYPE, BY REGION, 2020-2027, (‘000 TONS)
-
TABLE
-
GLOBAL HOT MELT ADHESIVE FOR HANDHELD DEVICES MARKET, BY REGION 2020-2027 (USD MILLION)
-
GLOBAL HOT MELT ADHESIVE FOR HANDHELD DEVICES MARKET, BY REGION 2020-2027
-
(‘000 TONS)
-
TABLE
-
GLOBAL PRESSURE SENSITIVE ADHESIVES FOR HANDHELD DEVICES MARKET, BY REGION 2020-2027 (USD MILLION)
-
TABLE
-
GLOBAL PRESSURE SENSITIVE ADHESIVES FOR HANDHELD DEVICES MARKET, BY REGION 2020-2027 (‘000 TONS)
-
(USD MILLION)
-
TABLE
-
GLOBAL WATERBORNE ADHESIVES FOR HANDHELD DEVICES MARKET, BY REGION ADHESIVES 2020-2027 (‘000 TONS)
-
TABLE
-
GLOBAL SOLVENT BASED ADHESIVES FOR HANDHELD DEVICES MARKET FOR, BY REGION 2020-2027 (USD MILLION)
-
2020-2027 (‘000 TONS)
-
TABLE
-
GLOBAL OTHERS FOR HANDHELD DEVICES MARKET
-
BY REGION 2020-2027 (USD MILLION)
-
TABLE
-
GLOBAL GLOBAL OTHERS FOR HANDHELD DEVICES MARKET, BY REGION 2020-2027 (‘000 TONS)
-
TABLE
-
GLOBAL ADHESIVES FOR HANDHELD DEVICES MARKET, BY APPLICTAION, 2020-2027, (USD MILLION)
-
TABLE
-
GLOBAL ADHESIVES FOR HANDHELD DEVICES MARKET, BY APPLICATION, 2020-2027, (‘000 TONS)
-
TABLE
-
GLOBAL ADHESIVES FOR HANDHELD DEVICES MARKET FOR APPLICATION, BY REGION, 2020-2027, (USD MILLION)
-
TABLE
-
GLOBAL ADHESIVES FOR HANDHELD DEVICES MARKET FOR APPLICATION, BY REGION, 2020-2027, (‘000 TONS)
-
TABLE
-
GLOBAL ADHESIVES FOR HANDHELD DEVICES MARKET FOR LAPTOPS, BY REGION, 2020-2027, (USD MILLION)
-
GLOBAL ADHESIVES FOR HANDHELD DEVICES MARKET FOR LAPTOPS, BY REGION
-
2020-2027, (‘000 TONS)
-
TABLE
-
GLOBAL ADHESIVES FOR HANDHELD DEVICES MARKET
-
FOR MOBILE PHONES & TABLETS, BY REGION, 2020-2027, (USD MILLION)
-
TABLE
-
GLOBAL ADHESIVES FOR HANDHELD DEVICES MARKET FOR MOBILE PHONES & TABLETS, BY REGION, 2020-2027, (‘000 TONS)
-
TABLE
-
GLOBAL ADHESIVES FOR HANDHELD DEVICES MARKET FOR HARD DISC DRIVES, BY REGION, 2020-2027, (USD MILLION)
-
TABLE
-
GLOBAL ADHESIVES FOR HANDHELD DEVICES MARKET FOR HARD DISC DRIVES, BY REGION, 2020-2027, (‘000 TONS)
-
TABLE
-
GLOBAL ADHESIVES FOR HANDHELD DEVICES MARKET FOR MEDICAL DEVICES, BY REGION, 2020-2027, (USD MILLION)
-
TABLE
-
GLOBAL ADHESIVES FOR HANDHELD DEVICES MARKET FOR MEDICAL DEVICES, BY REGION, 2020-2027, (‘000 TONS)
-
TABLE
-
(USD MILLION)
-
TABLE
-
GLOBAL ADHESIVES FOR HANDHELD DEVICES MARKET FOR OTHERS, BY REGION, 2020-2027, (‘000 TONS)
-
TABLE
-
GLOBAL ADHESIVES FOR HANDHELD DEVICES MARKET, BY REGION, 2020-2027, (USD MILLION)
-
TABLE
-
GLOBAL ADHESIVES FOR HANDHELD DEVICES MARKET, BY REGION, 2020-2027, (‘000 TONS)
-
TABLE
-
GLOBAL ADHESIVES FOR HANDHELD DEVICES MARKET FOR TYPE, BY REGION, 2020-2027, (USD MILLION)
-
TABLE
-
GLOBAL ADHESIVES FOR HANDHELD DEVICES MARKET FOR TYPE, BY REGION
-
2020-2027, (‘000 TONS)
-
TABLE
-
GLOBAL ADHESIVES FOR HANDHELD DEVICES MARKET
-
FOR APPLICATION, BY REGION, 2020-2027, (USD MILLION)
-
TABLE
-
GLOBAL ADHESIVES FOR HANDHELD DEVICES MARKET FOR APPLICATION, BY REGION, 2020-2027, (‘000 TONS)
-
NORTH AMERICA ADHESIVES FOR HANDHELD DEVICES MARKET, BY COUNTRY, 2020-2027
-
(USD MILLION)
-
TABLE
-
NORTH AMERICA ADHESIVES FOR HANDHELD DEVICES MARKET, BY COUNTRY, 2020-2027, (‘000 TONS)
-
TABLE
-
NORTH AMERICA ADHESIVES FOR HANDHELD DEVICES MARKET, BY TYPE, 2020-2027, (USD MILLION)
-
TABLE
-
NORTH AMERICA ADHESIVES FOR HANDHELD DEVICES MARKET, BY TYPE, 2020-2027, (‘000 TONS)
-
TABLE
-
NORTH AMERICA ADHESIVES FOR HANDHELD DEVICES MARKET, BY TYPE, 2020-2027, (USD MILLION)
-
NORTH AMERICA ADHESIVES FOR HANDHELD DEVICES MARKET, BY TYPE, 2020-2027
-
(‘000 TONS)
-
TABLE
-
U.S ADHESIVES FOR HANDHELD DEVICES MARKET, BY TYPE
-
2020-2027, (USD MILLION)
-
TABLE
-
U.S ADHESIVES FOR HANDHELD DEVICES MARKET
-
BY TYPE, 2020-2027, (‘000 TONS)
-
TABLE
-
U.S ADHESIVES FOR HANDHELD DEVICES MARKET, BY APPLICATION, 2020-2027, (USD MILLION)
-
TABLE
-
U.S ADHESIVES FOR HANDHELD DEVICES MARKET, BY APPLICTAION, 2020-2027, (‘000 TONS)
-
TABLE
-
CANADA ADHESIVES FOR HANDHELD DEVICES MARKET, BY TYPE, 2020-2027, (USD MILLION)
-
TABLE
-
TONS)
-
TABLE
-
CANADA ADHESIVES FOR HANDHELD DEVICES MARKET, BY APPLICATION
-
2020-2027, (USD MILLION)
-
TABLE
-
CANADA ADHESIVES FOR HANDHELD DEVICES MARKET
-
BY APPLICATION, 2020-2027, (‘000 TONS)
-
TABLE
-
EUROPE ADHESIVES FOR HANDHELD DEVICES MARKET, BY COUNTRY, 2020-2027, (USD MILLION)
-
TABLE
-
EUROPE ADHESIVES FOR HANDHELD DEVICES MARKET, BY COUNTRY, 2020-2027, (‘000 TONS)
-
TABLE
-
EUROPE ADHESIVES FOR HANDHELD DEVICES MARKET, BY TYPE, 2020-2027, (USD MILLION)
-
EUROPE ADHESIVES FOR HANDHELD DEVICES MARKET, BY TYPE, 2020-2027, (‘000
-
TONS)
-
TABLE
-
EUROPE ADHESIVES FOR HANDHELD DEVICES MARKET, BY TYPE, 2020-2027, (USD MILLION)
-
TABLE
-
EUROPE ADHESIVES FOR HANDHELD DEVICES MARKET, BY TYPE
-
2020-2027, (‘000 TONS)
-
TABLE
-
GERMANY ADHESIVES FOR HANDHELD DEVICES
-
MARKET, BY TYPE, 2020-2027, (USD MILLION)
-
TABLE
-
GERMANY ADHESIVES FOR HANDHELD DEVICES MARKET, BY TYPE, 2020-2027, (‘000 TONS)
-
TABLE
-
GERMANY ADHESIVES FOR HANDHELD DEVICES MARKET, BY APPLICATION, 2020-2027, (USD MILLION)
-
TABLE
-
GERMANY ADHESIVES FOR HANDHELD DEVICES MARKET, BY APPLICATION, 2020-2027, (‘000 TONS)
-
TABLE
-
FRANCE ADHESIVES FOR HANDHELD DEVICES MARKET, BY TYPE, 2020-2027, (USD MILLION)
-
TABLE
-
FRANCE ADHESIVES FOR HANDHELD DEVICES MARKET, BY TYPE
-
2020-2027, (‘000 TONS)
-
TABLE
-
FRANCE ADHESIVES FOR HANDHELD DEVICES MARKET
-
BY APPLICATION, 2020-2027, (USD MILLION)
-
TABLE
-
FRANCE ADHESIVES FOR HANDHELD DEVICES MARKET, BY APPLICATION, 2020-2027, (‘000 TONS)
-
TABLE
-
UK ADHESIVES FOR HANDHELD DEVICES MARKET, BY TYPE, 2020-2027, (USD MILLION)
-
TABLE
-
UK ADHESIVES FOR HANDHELD DEVICES MARKET, BY TYPE, 2020-2027, (‘000 TONS)
-
TABLE
-
UK ADHESIVES FOR HANDHELD DEVICES MARKET, BY APPLICATION, 2020-2027, (USD MILLION)
-
UK ADHESIVES FOR HANDHELD DEVICES MARKET, BY APPLICATION, 2020-2027
-
(‘000 TONS)
-
TABLE
-
ITALY ADHESIVES FOR HANDHELD DEVICES MARKET, BY TYPE
-
2020-2027, (USD MILLION)
-
TABLE
-
ITALY ADHESIVES FOR HANDHELD DEVICES MARKET
-
BY TYPE, 2020-2027, (‘000 TONS)
-
TABLE
-
ITALY ADHESIVES FOR HANDHELD DEVICES MARKET, BY APPLICATION, 2020-2027, (USD MILLION)
-
TABLE
-
ITALY ADHESIVES FOR HANDHELD DEVICES MARKET, BY APPLICATION, 2020-2027, (‘000 TONS)
-
TABLE
-
SPAIN ADHESIVES FOR HANDHELD DEVICES MARKET, BY TYPE, 2020-2027, (USD MILLION)
-
TONS)
-
TABLE
-
SPAIN ADHESIVES FOR HANDHELD DEVICES MARKET, BY APPLICATION, 2020-2027, (USD MILLION)
-
TABLE
-
SPAIN ADHESIVES FOR HANDHELD DEVICES MARKET, BY APPLICATION
-
2020-2027, (‘000 TONS)
-
TABLE
-
REST OF EUROPE ADHESIVES FOR HANDHELD DEVICES
-
MARKET, BY TYPE, 2020-2027, (USD MILLION)
-
TABLE
-
REST OF EUROPE ADHESIVES FOR HANDHELD DEVICES MARKET, BY TYPE, 2020-2027, (‘000 TONS)
-
TABLE
-
REST OF EUROPE ADHESIVES FOR HANDHELD DEVICES MARKET, BY APPLICATION, 2020-2027, (USD MILLION)
-
TABLE
-
REST OF EUROPE ADHESIVES FOR HANDHELD DEVICES MARKET, BY APPLICATION
-
2020-2027, (‘000 TONS)
-
TABLE
-
ASIA PACIFIC ADHESIVES FOR HANDHELD DEVICES
-
MARKET, BY COUNTRY, 2020-2027, (USD MILLION)
-
TABLE
-
ASIA PACIFIC ADHESIVES FOR HANDHELD DEVICES MARKET, BY COUNTRY, 2020-2027, (‘000 TONS)
-
TABLE
-
ASIA PACIFIC ADHESIVES FOR HANDHELD DEVICES MARKET, BY TYPE, 2020-2027, (USD MILLION)
-
ASIA PACIFIC ADHESIVES FOR HANDHELD DEVICES MARKET, BY TYPE, 2020-2027
-
(‘000 TONS)
-
TABLE
-
ASIA PACIFIC ADHESIVES FOR HANDHELD DEVICES MARKET, BY TYPE, 2020-2027, (USD MILLION)
-
TABLE
-
ASIA PACIFIC ADHESIVES FOR HANDHELD DEVICES MARKET, BY TYPE, 2020-2027, (‘000 TONS)
-
TABLE
-
CHINA ADHESIVES FOR HANDHELD DEVICES MARKET, BY TYPE, 2020-2027, (USD MILLION)
-
TABLE
-
CHINA ADHESIVES FOR HANDHELD DEVICES MARKET, BY TYPE, 2020-2027, (‘000 TONS)
-
(USD MILLION)
-
TABLE
-
CHINA ADHESIVES FOR HANDHELD DEVICES MARKET, BY APPLICATION
-
2020-2027, (‘000 TONS)
-
TABLE
-
JAPAN ADHESIVES FOR HANDHELD DEVICES MARKET
-
BY TYPE, 2020-2027, (USD MILLION)
-
TABLE
-
JAPAN ADHESIVES FOR HANDHELD DEVICES MARKET, BY TYPE, 2020-2027, (‘000 TONS)
-
TABLE
-
JAPAN ADHESIVES FOR HANDHELD DEVICES MARKET, BY APPLICATION, 2020-2027, (USD MILLION)
-
TABLE
-
JAPAN ADHESIVES FOR HANDHELD DEVICES MARKET, BY APPLICATION, 2020-2027, (‘000 TONS)
-
TABLE
-
INDIA ADHESIVES FOR HANDHELD DEVICES MARKET, BY TYPE, 2020-2027, (‘000
-
TONS)
-
TABLE
-
INDIA ADHESIVES FOR HANDHELD DEVICES MARKET, BY APPLICATION, 2020-2027, (USD MILLION)
-
TABLE
-
INDIA ADHESIVES FOR HANDHELD DEVICES MARKET, BY APPLICATION
-
2020-2027, (‘000 TONS)
-
TABLE
-
REST OF ASIA-PACIFIC ADHESIVES FOR HANDHELD
-
DEVICES MARKET, BY TYPE, 2020-2027, (USD MILLION)
-
TABLE
-
REST OF ASIA-PACIFIC ADHESIVES FOR HANDHELD DEVICES MARKET, BY TYPE, 2020-2027, (‘000 TONS)
-
2020-2027, (USD MILLION)
-
TABLE
-
REST OF ASIA-PACIFIC ADHESIVES FOR HANDHELD
-
DEVICES MARKET, BY APPLICATION, 2020-2027, (‘000 TONS)
-
TABLE
-
LATIN AMERICA ADHESIVES FOR HANDHELD DEVICES MARKET, BY COUNTRY, 2020-2027, (USD MILLION)
-
LATIN AMERICA ADHESIVES FOR HANDHELD DEVICES MARKET, BY COUNTRY, 2020-2027
-
(‘000 TONS)
-
TABLE
-
LATIN AMERICA ADHESIVES FOR HANDHELD DEVICES MARKET, BY TYPE, 2020-2027, (USD MILLION)
-
TABLE
-
LATIN AMERICA ADHESIVES FOR HANDHELD DEVICES MARKET, BY TYPE, 2020-2027, (‘000 TONS)
-
TABLE
-
LATIN AMERICA ADHESIVES FOR HANDHELD DEVICES MARKET, BY TYPE, 2020-2027, (USD MILLION)
-
TABLE
-
TONS)
-
TABLE
-
MIDDLE EAST & AFRICA ADHESIVES FOR HANDHELD DEVICES MARKET, BY COUNTRY, 2020-2027, (USD MILLION)
-
TABLE
-
MIDDLE EAST & AFRICA ADHESIVES FOR HANDHELD DEVICES MARKET, BY COUNTRY, 2020-2027, (‘000 TONS)
-
TABLE
-
MIDDLE EAST & AFRICA ADHESIVES FOR HANDHELD DEVICES MARKET, BY TYPE, 2020-2027, (USD MILLION)
-
TABLE
-
MIDDLE EAST & AFRICA ADHESIVES FOR HANDHELD DEVICES MARKET, BY TYPE, 2020-2027, (‘000 TONS)
-
TABLE
-
MIDDLE EAST & AFRICA ADHESIVES FOR HANDHELD DEVICES MARKET, BY TYPE, 2020-2027, (USD MILLION)
-
TABLE
-
(‘000 TONS)
-
TABLE
-
GLOBAL SEALANTS FOR HANDHELD DEVICES MARKET, BY SEALANTS TYPE 2020-2027 (USD MILLION)
-
TABLE
-
GLOBAL SEALANTS FOR HANDHELD DEVICES MARKET, BY SEALANTS TYPE 2020-2027 (‘000 TONS)
-
TABLE
-
GLOBAL SEALANTS FOR HANDHELD DEVICES MARKET FOR SEALANTS TYPE, BY REGION, 2020-2027, (USD MILLION)
-
TABLE
-
GLOBAL SEALANTS FOR HANDHELD DEVICES MARKET FOR SEALANTS TYPE, BY REGION, 2020-2027, (‘000 TONS)
-
TABLE
-
GLOBAL SEALANTS FOR HANDHELD DEVICES MARKET FOR SILICONE SEALANTS, BY REGION, 2020-2027, (USD MILLION)
-
TABLE
-
GLOBAL SEALANTS FOR HANDHELD DEVICES MARKET FOR SILICONE SEALANTS, BY REGION, 2020-2027, (‘000 TONS)
-
BY REGION, 2020-2027, (USD MILLION)
-
TABLE
-
GLOBAL SEALANTS FOR HANDHELD DEVICES MARKET FOR POLYURETHANE SEALANTS, BY REGION, 2020-2027, (‘000 TONS)
-
TABLE
-
2020-2027, (USD MILLION)
-
TABLE
-
GLOBAL SEALANTS FOR HANDHELD DEVICES MARKET
-
FOR ACRYLIC LATEX SEALANTS, BY REGION, 2020-2027, (‘000 TONS)
-
TABLE
-
GLOBAL SEALANTS FOR HANDHELD DEVICES MARKET FOR EPOXY SEALANTS, BY REGION, 2020-2027, (USD MILLION)
-
TABLE
-
GLOBAL SEALANTS FOR HANDHELD DEVICES MARKET FOR EPOXY SEALANTS , BY REGION, 2020-2027, (‘000 TONS)
-
TABLE
-
GLOBAL SEALANTS FOR HANDHELD DEVICES MARKET FOR BUTYL SEALANTS, BY REGION, 2020-2027, (USD MILLION)
-
GLOBAL SEALANTS FOR HANDHELD DEVICES MARKET FOR BUTYL SEALANTS , BY
-
REGION, 2020-2027, (‘000 TONS)
-
TABLE
-
GLOBAL SEALANTS FOR HANDHELD DEVICES MARKET FOR OTHERS, BY REGION, 2020-2027, (USD MILLION)
-
TABLE
-
GLOBAL SEALANTS FOR HANDHELD DEVICES MARKET FOR OTHERS, BY REGION, 2020-2027, (‘000 TONS)
-
GLOBAL SEALANTS FOR HANDHELD DEVICES MARKET, BY SEALANTS APPLICATION
-
2020-2027 (USD MILLION)
-
TABLE
-
GLOBAL SEALANTS FOR HANDHELD DEVICES MARKET
-
BY SEALANTS APPLICATION 2020-2027 (‘000 TONS)
-
TABLE
-
GLOBAL SEALANTS FOR HANDHELD DEVICES MARKET FOR SEALANTS APPLICATION, BY REGION, 2020-2027, (USD MILLION)
-
TABLE
-
GLOBAL SEALANTS FOR HANDHELD DEVICES MARKET FOR SEALANTS APPLICATION, BY REGION, 2020-2027, (‘000 TONS)
-
TABLE
-
GLOBAL SEALANTS FOR HANDHELD DEVICES MARKET FOR MOBILE PHONE, BY REGION, 2020-2027, (USD MILLION)
-
GLOBAL SEALANTS FOR HANDHELD DEVICES MARKET FOR MOBILE PHONE, BY REGION
-
2020-2027, (‘000 TONS)
-
TABLE
-
GLOBAL SEALANTS FOR HANDHELD DEVICES
-
MARKET FOR LAPTOP, BY REGION, 2020-2027, (USD MILLION)
-
TABLE
-
GLOBAL SEALANTS FOR HANDHELD DEVICES MARKET FOR LAPTOP, BY REGION, 2020-2027, (‘000 TONS)
-
GLOBAL SEALANTS FOR HANDHELD DEVICES MARKET FOR HARD DISC DRIVES
-
BY REGION, 2020-2027, (USD MILLION)
-
TABLE
-
GLOBAL SEALANTS FOR HANDHELD DEVICES MARKET FOR HARD DISC DRIVES, BY REGION, 2020-2027, (‘000 TONS)
-
TABLE
-
GLOBAL SEALANTS FOR HANDHELD DEVICES MARKET FOR MEDICAL DEVICES, BY REGION, 2020-2027, (USD MILLION)
-
TABLE
-
GLOBAL SEALANTS FOR HANDHELD DEVICES MARKET FOR MEDICAL DEVICES, BY REGION, 2020-2027, (‘000 TONS)
-
TABLE
-
GLOBAL SEALANTS FOR HANDHELD DEVICES MARKET FOR OTHERS, BY REGION, 2020-2027, (USD MILLION)
-
TABLE
-
(‘000 TONS)
-
TABLE
-
GLOBAL SEALANTS FOR HANDHELD DEVICES MARKET, BY REGION, 2020-2027, (USD MILLION)
-
TABLE
-
GLOBAL SEALANTS FOR HANDHELD DEVICES MARKET, BY REGION, 2020-2027, (USD MILLION)
-
TABLE
-
GLOBAL SEALANTS FOR HANDHELD DEVICES MARKET, BY REGION, 2020-2027, (‘000 TONS)
-
TABLE
-
GLOBAL SEALANTS FOR HANDHELD DEVICES MARKET, BY REGION, 2020-2027, (‘000 TONS)
-
TABLE
-
GLOBAL SEALANTS FOR HANDHELD DEVICES MARKET FOR TYPE, BY REGION, 2020-2027, (USD MILLION)
-
TABLE
-
GLOBAL SEALANTS FOR HANDHELD DEVICES MARKET FOR TYPE, BY REGION, 2020-2027, (‘000 TONS)
-
TABLE
-
GLOBAL SEALANTS FOR HANDHELD DEVICES MARKET FOR APPLICATION, BY REGION, 2020-2027, (USD MILLION)
-
TABLE
-
GLOBAL SEALANTS FOR HANDHELD DEVICES MARKET FOR APPLICATION, BY REGION, 2020-2027, (‘000 TONS)
-
TABLE
-
NORTH AMERICA SEALANTS FOR HANDHELD DEVICES MARKET, BY COUNTRY, 2020-2027, (USD MILLION)
-
TABLE
-
NORTH AMERICA SEALANTS FOR HANDHELD DEVICES MARKET, BY COUNTRY, 2020-2027, (‘000 TONS)
-
TABLE
-
NORTH AMERICA SEALANTS FOR HANDHELD DEVICES MARKET, BY TYPE, 2020-2027, (USD MILLION)
-
TABLE
-
TONS)
-
TABLE
-
NORTH AMERICA SEALANTS FOR HANDHELD DEVICES MARKET, BY TYPE
-
2020-2027, (USD MILLION)
-
TABLE
-
NORTH AMERICA SEALANTS FOR HANDHELD DEVICES
-
MARKET, BY TYPE, 2020-2027, (‘000 TONS)
-
TABLE
-
U.S SEALANTS FOR HANDHELD DEVICES MARKET, BY TYPE, 2020-2027, (USD MILLION)
-
TABLE
-
U.S SEALANTS FOR HANDHELD DEVICES MARKET, BY TYPE, 2020-2027, (‘000 TONS)
-
TABLE
-
U.S SEALANTS FOR HANDHELD DEVICES MARKET, BY APPLICATION, 2020-2027, (USD MILLION)
-
TONS)
-
TABLE
-
CANADA SEALANTS FOR HANDHELD DEVICES MARKET, BY TYPE, 2020-2027, (USD MILLION)
-
TABLE
-
CANADA SEALANTS FOR HANDHELD DEVICES MARKET, BY TYPE
-
2020-2027, (‘000 TONS)
-
TABLE
-
CANADA SEALANTS FOR HANDHELD DEVICES
-
MARKET, BY APPLICATION, 2020-2027, (USD MILLION)
-
TABLE
-
CANADA SEALANTS FOR HANDHELD DEVICES MARKET, BY APPLICATION, 2020-2027, (‘000 TONS)
-
TABLE
-
EUROPE SEALANTS FOR HANDHELD DEVICES MARKET, BY COUNTRY, 2020-2027
-
(‘000 TONS)
-
TABLE
-
EUROPE SEALANTS FOR HANDHELD DEVICES MARKET, BY TYPE, 2020-2027, (USD MILLION)
-
TABLE
-
EUROPE SEALANTS FOR HANDHELD DEVICES MARKET, BY TYPE, 2020-2027, (‘000 TONS)
-
TABLE
-
EUROPE SEALANTS FOR HANDHELD DEVICES MARKET, BY TYPE, 2020-2027, (USD MILLION)
-
TABLE
-
EUROPE SEALANTS FOR HANDHELD DEVICES MARKET, BY TYPE, 2020-2027, (‘000 TONS)
-
MILLION)
-
TABLE
-
GERMANY SEALANTS FOR HANDHELD DEVICES MARKET, BY TYPE, 2020-2027, (‘000 TONS)
-
TABLE
-
GERMANY SEALANTS FOR HANDHELD DEVICES MARKET, BY APPLICATION, 2020-2027, (USD MILLION)
-
TABLE
-
GERMANY SEALANTS FOR HANDHELD DEVICES MARKET, BY APPLICATION, 2020-2027, (‘000 TONS)
-
TABLE
-
FRANCE SEALANTS FOR HANDHELD DEVICES MARKET, BY TYPE, 2020-2027, (USD MILLION)
-
TABLE
-
TONS)
-
TABLE
-
FRANCE SEALANTS FOR HANDHELD DEVICES MARKET, BY APPLICATION
-
2020-2027, (USD MILLION)
-
TABLE
-
FRANCE SEALANTS FOR HANDHELD DEVICES MARKET
-
BY APPLICATION, 2020-2027, (‘000 TONS)
-
TABLE
-
UK SEALANTS FOR HANDHELD DEVICES MARKET, BY TYPE, 2020-2027, (USD MILLION)
-
TABLE
-
UK SEALANTS FOR HANDHELD DEVICES MARKET, BY TYPE, 2020-2027, (‘000 TONS)
-
TABLE
-
UK SEALANTS FOR HANDHELD DEVICES MARKET, BY APPLICATION, 2020-2027, (USD MILLION)
-
TONS)
-
TABLE
-
ITALY SEALANTS FOR HANDHELD DEVICES MARKET, BY TYPE, 2020-2027, (USD MILLION)
-
TABLE
-
ITALY SEALANTS FOR HANDHELD DEVICES MARKET, BY TYPE
-
2020-2027, (‘000 TONS)
-
TABLE
-
ITALY SEALANTS FOR HANDHELD DEVICES MARKET
-
BY APPLICATION, 2020-2027, (USD MILLION)
-
TABLE
-
ITALY SEALANTS FOR HANDHELD DEVICES MARKET, BY APPLICATION, 2020-2027, (‘000 TONS)
-
TABLE
-
SPAIN SEALANTS FOR HANDHELD DEVICES MARKET, BY TYPE, 2020-2027, (USD MILLION)
-
TABLE
-
TONS)
-
TABLE
-
SPAIN SEALANTS FOR HANDHELD DEVICES MARKET, BY APPLICATION
-
2020-2027, (USD MILLION)
-
TABLE
-
SPAIN SEALANTS FOR HANDHELD DEVICES MARKET
-
BY APPLICATION, 2020-2027, (‘000 TONS)
-
TABLE
-
REST OF EUROPE SEALANTS FOR HANDHELD DEVICES MARKET, BY TYPE, 2020-2027, (USD MILLION)
-
TABLE
-
REST OF EUROPE SEALANTS FOR HANDHELD DEVICES MARKET, BY TYPE, 2020-2027, (‘000 TONS)
-
TABLE
-
REST OF EUROPE SEALANTS FOR HANDHELD DEVICES MARKET, BY APPLICATION
-
2020-2027, (USD MILLION)
-
TABLE
-
REST OF EUROPE SEALANTS FOR HANDHELD DEVICES
-
MARKET, BY APPLICATION, 2020-2027, (‘000 TONS)
-
TABLE
-
ASIA PACIFIC SEALANTS FOR HANDHELD DEVICES MARKET, BY COUNTRY, 2020-2027, (USD MILLION)
-
TABLE
-
TONS)
-
TABLE
-
ASIA PACIFIC SEALANTS FOR HANDHELD DEVICES MARKET, BY TYPE
-
2020-2027, (USD MILLION)
-
TABLE
-
ASIA PACIFIC SEALANTS FOR HANDHELD DEVICES
-
MARKET, BY TYPE, 2020-2027, (‘000 TONS)
-
TABLE
-
ASIA PACIFIC SEALANTS FOR HANDHELD DEVICES MARKET, BY TYPE, 2020-2027, (USD MILLION)
-
TABLE
-
ASIA PACIFIC SEALANTS FOR HANDHELD DEVICES MARKET, BY TYPE, 2020-2027, (‘000 TONS)
-
CHINA SEALANTS FOR HANDHELD DEVICES MARKET, BY TYPE, 2020-2027, (USD
-
MILLION)
-
TABLE
-
CHINA SEALANTS FOR HANDHELD DEVICES MARKET, BY TYPE, 2020-2027, (‘000 TONS)
-
TABLE
-
CHINA SEALANTS FOR HANDHELD DEVICES MARKET, BY APPLICATION
-
2020-2027, (USD MILLION)
-
TABLE
-
CHINA SEALANTS FOR HANDHELD DEVICES MARKET
-
BY APPLICATION, 2020-2027, (‘000 TONS)
-
TABLE
-
JAPAN SEALANTS FOR HANDHELD DEVICES MARKET, BY TYPE, 2020-2027, (USD MILLION)
-
TABLE
-
JAPAN SEALANTS FOR HANDHELD DEVICES MARKET, BY TYPE, 2020-2027, (‘000 TONS)
-
TABLE
-
JAPAN SEALANTS FOR HANDHELD DEVICES MARKET, BY APPLICATION, 2020-2027, (USD MILLION)
-
(‘000 TONS)
-
TABLE
-
INDIA SEALANTS FOR HANDHELD DEVICES MARKET, BY TYPE
-
2020-2027, (USD MILLION)
-
TABLE
-
INDIA SEALANTS FOR HANDHELD DEVICES MARKET
-
BY TYPE, 2020-2027, (‘000 TONS)
-
TABLE
-
INDIA SEALANTS FOR HANDHELD DEVICES MARKET, BY APPLICATION, 2020-2027, (USD MILLION)
-
TABLE
-
INDIA SEALANTS FOR HANDHELD DEVICES MARKET, BY APPLICATION, 2020-2027, (‘000 TONS)
-
TABLE
-
(USD MILLION)
-
TABLE
-
REST OF ASIA-PACIFIC SEALANTS FOR HANDHELD DEVICES MARKET, BY TYPE, 2020-2027, (‘000 TONS)
-
TABLE
-
REST OF ASIA-PACIFIC SEALANTS FOR HANDHELD DEVICES MARKET, BY APPLICATION, 2020-2027, (USD MILLION)
-
TABLE
-
(‘000 TONS)
-
TABLE
-
LATIN AMERICA SEALANTS FOR HANDHELD DEVICES MARKET, BY COUNTRY, 2020-2027, (USD MILLION)
-
TABLE
-
LATIN AMERICA SEALANTS FOR HANDHELD DEVICES MARKET, BY COUNTRY, 2020-2027, (‘000 TONS)
-
TABLE
-
LATIN AMERICA SEALANTS FOR HANDHELD DEVICES MARKET, BY TYPE, 2020-2027, (USD MILLION)
-
TABLE
-
TONS)
-
TABLE
-
LATIN AMERICA SEALANTS FOR HANDHELD DEVICES MARKET, BY TYPE
-
2020-2027, (USD MILLION)
-
TABLE
-
LATIN AMERICA SEALANTS FOR HANDHELD DEVICES
-
MARKET, BY TYPE, 2020-2027, (‘000 TONS)
-
TABLE
-
MIDDLE EAST & AFRICA SEALANTS FOR HANDHELD DEVICES MARKET, BY COUNTRY, 2020-2027, (USD MILLION)
-
TABLE
-
(‘000 TONS)
-
TABLE
-
MIDDLE EAST & AFRICA SEALANTS FOR HANDHELD DEVICES MARKET, BY TYPE, 2020-2027, (USD MILLION)
-
TABLE
-
MIDDLE EAST & AFRICA SEALANTS FOR HANDHELD DEVICES MARKET, BY TYPE, 2020-2027, (‘000 TONS)
-
2020-2027, (USD MILLION)
-
TABLE
-
MIDDLE EAST & AFRICA SEALANTS FOR HANDHELD
-
DEVICES MARKET, BY TYPE, 2020-2027, (‘000 TONS)
-
TABLE
-
GLOBAL ADHESIVES MARKET FOR HANDHELD DEVICES PRICING & FORECAST (USD/TON) (2020 –2023)
-
GLOBAL SEALANTS MARKET FOR HANDHELD DEVICES PRICING & FORECAST
-
(USD/TON) (2020 –2023)
-
TABLE
-
HENKEL AG & CO. KGAA: SEGMENT OVERVIEW
-
HENKEL AG & CO. KGAA:KEY DEVELOPMENTS
-
TABLE
-
3M: SEGMENT
-
OVERVIEW
-
TABLE
-
3M: KEY DEVELOPMENTS
-
TABLE
-
EVONIK INDUSTRIES AG: SEGMENT OVERVIEW
-
TABLE
-
EVONIK INDUSTRIES AG:KEY DEVELOPMENTS
-
TABLE
-
DOW CORNING CORPORATION: SEGMENT OVERVIEW
-
TABLE
-
FIGURE
-
DOW CORNING CORPORATION: KEY DEVELOPMENTS
-
TABLE
-
PRODUCT/BUSINESS SEGMENT OVERVIEW
-
FIGURE
-
WORLDWIDE MOBILE PHONES & SMARTPHONES SHIPMENT, (2020-2027)
-
FIGURE
-
GLOBAL DETACHBLE LAPTOPS SHIPMENT, (2020-2027)
-
GLOBAL PCB MARKET REVENUE, (2020-2027)
-
FIGURE
-
GLOBAL CONSUMER ELECTRONICS
-
REVENUE, (2020-2027)
-
FIGURE
-
SUPPLY CHAIN ANALYSIS
-
FIGURE
-
GLOBAL ADHESIVES FOR HANDHELD DEVICES MARKET, BY ADHESIVE TYPE 2020-2027 (USD MILLION)
-
FIGURE
-
TONS)
-
FIGURE
-
GLOBAL ADHESIVES FOR HANDHELD DEVICES MARKET, BY APPLICTAION
-
2020-2027, (USD MILLION)
-
FIGURE
-
GLOBAL ADHESIVES FOR HANDHELD DEVICES MARKET
-
BY APPLICATION, 2020-2027, (‘000 TONS)
-
FIGURE
-
GLOBAL ADHESIVES FOR HANDHELD DEVICES MARKET, BY REGION, 2020-2027, (USD MILLION)
-
FIGURE
-
GLOBAL ADHESIVES FOR HANDHELD DEVICES MARKET, BY REGION, 2020-2027, (‘000 TONS)
-
FIGURE
-
GLOBAL SEALANTS FOR HANDHELD DEVICES MARKET, BY SEALANTS TYPE 2020-2027 (USD MILLION)
-
GLOBAL SEALANTS FOR HANDHELD DEVICES MARKET, BY SEALANTS TYPE 2020-2027
-
(‘000 TONS)
-
FIGURE
-
GLOBAL SEALANTS FOR HANDHELD DEVICES MARKET, BY SEALANTS APPLICATION 2020-2027 (USD MILLION)
-
FIGURE
-
GLOBAL SEALANTS FOR HANDHELD DEVICES MARKET, BY SEALANTS APPLICATION 2020-2027 (‘000 TONS)
-
FIGURE
-
MARKET SHARE ANALYSIS, BY KEY PLAYERS (2020 )
-
FIGURE
-
HENKEL AG & CO. KGAA: FINANCIAL UPDATES
-
FIGURE
-
3M: FINANCIAL UPDATES
-
FIGURE
-
EVONIK INDUSTRIES AG: FINANCIAL UPDATES
-
FIGURE
-
DOW CORNING CORPORATION (CONSUMER SOLUTION) : FINANCIAL UPDATES
-
FIGURE
-
H.B FULLER: BUSINESS SEGMENT REVENUE
-
FIGURE
-
H.B FULLER: BUSINESS SEGMENT REVENUE 2020 166 FIGURE
-
H.B FULLER: OPERATING INCOME
-
1 Report Prologue
-
3
-
Scope of The Report
- Market Definition
-
-
Scope of The Study
-
- Research Objectives
-
- Assumptions
-
- Limitations
-
- Markets Structure
- Research Process
- Primary Research
-
- Secondary Research
-
- Market Size Estimation
- Introduction
-
-
Drivers
- Penetration of Smartphones and Tablets to Surge
-
Drivers
-
Adhesive & Sealants Demand
-
- Rising Popularity
-
of Gaming Laptops & Detachable Laptops
-
- Augmenting
-
Demand for Adhesive & Sealants in PCB Applications
-
-
Growth in consumer electronics to augment adhesives and sealants demand
-
- Restraints
-
- Dramatic Surge in Adhesive
-
Sealant Raw Material Prices to Impede Market Growth
-
-
Rapidly Changing Technologies in the Consumer Electronics Market
-
-
Trends & Opportunities
-
- Emerging Electronic
-
Device Assembly Hub in Southeast Asian Nations
-
-
Significant FDI in the ASEAN Region From Developed Nations
-
-
Product Innovation For Next Generation Electronic Devices
-
- Macroeconomic Indicators
-
- Rise in disposable
-
income coupled with increased spending on consumer electronics
-
- Supply Chain Analysis
-
-
Raw Material Suppliers
-
- Adhesives & Sealants Manufacturers
-
- Distribution Channel
-
- End-User Industry
-
- Porter’s
-
Analysis
-
-
Threat of New Entrants
-
- Threat of Rivalry
-
-
Threat of Substitute
-
-
Bargaining power of supplier
- Bargaining Power of Buyers
-
Bargaining power of supplier
-
-
7
-
Global Adhesives for Handheld Devices Market, By Adhesives Type
- Introduction
- Hot Melt Adhesive
-
-
Pressure Sensitive Adhesives
-
- Waterborne Adhesives
- Solvent Based Adhesives
-
- Others
- Introduction
-
-
Laptops
- Mobile Phones & Tablets
-
Laptops
-
-
Hard Disc Drives
-
- Medical Devices
-
- Others
-
- Introduction
-
-
North America
- U.S
-
North America
-
- Canada
- Europe
-
-
Germany
- France
-
Germany
-
-
UK
- Italy
-
UK
-
-
Spain
- Rest of Europe
-
Spain
-
- Asia Pacific
-
- China
-
- Japan
-
- India
-
-
Rest of Asia-Pacific
-
- Latin America
-
-
Middle East & Africa
- Introduction
-
- Silicone Sealants
-
- Polyurethane Sealants
-
-
Acrylic Latex Sealants
-
- Epoxy Sealants
-
- Butyl Sealants
-
- Others
-
Sealants for Handheld Devices Market, By Sealants Application
-
Introduction
- Mobile phone
-
Introduction
-
- Laptop
-
- Hard Disc Drives
-
- Medical Devices
-
- Others
-
Sealants for Handheld Devices Market, By Region
- Introduction
-
- North America
-
- U.S
-
- Canada
-
- Europe
-
- Germany
-
- France
-
- UK
-
- Italy
-
- Spain
-
- Rest of Europe
-
- Asia Pacific
-
- China
-
- Japan
-
- India
-
-
Rest of Asia-Pacific
-
- Latin America
-
-
Middle East & Africa
- Introduction
- Market Share Analysis
-
- Pricing Analysis
-
- Key Developments & Strategies
-
152
- Henkel AG & Co. KGaA
-
- Company Overview
-
- Product/Business Segment Overview
-
- Financial Updates
-
- Key Developments
-
- 3M
-
- Company Overview
-
- Product/Business Segment Overview
-
- Financial Updates
-
- Key Developments
-
- Evonik Industries AG
-
- Company Overview
-
- Product/Business Segment Overview
-
- Financial Updates
-
- Key Developments
-
- Dow Corning Corporation
-
- Company Overview
-
- Product/Business Segment Overview
-
- Financial Updates
-
- Key Developments
-
- H.B Fuller
-
- Company Profile
-
- Financial Overview
-
- Key Developments
-
- Novachem Corporations
-
- Company Profile
-
-
Product/Business Segment Overview
- Financial Overview
-
Product/Business Segment Overview
-
- Key developments
-
- Tangent Industries
-
- Company profile
-
-
Product/Business Segment Overview
- Financial Overview
-
Product/Business Segment Overview
-
- Key developments
-
29
-
2020-2027 (USD MILLION)
-
MARKET, BY ADHESIVE TYPE 2020-2027 (‘000 TONS)
-
ADHESIVES FOR HANDHELD DEVICES MARKET FOR ADHESIVE TYPE, BY REGION, 2020-2027, (USD MILLION)
-
TYPE, BY REGION, 2020-2027, (‘000 TONS)
-
ADHESIVE FOR HANDHELD DEVICES MARKET, BY REGION 2020-2027 (USD MILLION)
-
MARKET, BY REGION 2020-2027 (USD MILLION)
-
SENSITIVE ADHESIVES FOR HANDHELD DEVICES MARKET, BY REGION 2020-2027 (‘000 TONS)
-
BY REGION 2020-2027 (USD MILLION)
-
FOR HANDHELD DEVICES MARKET, BY REGION ADHESIVES 2020-2027 (‘000 TONS)
-
DEVICES MARKET FOR, BY REGION 2020-2027 (‘000 TONS)
-
GLOBAL OTHERS FOR HANDHELD DEVICES MARKET, BY REGION 2020-2027 (USD MILLION)
-
2020-2027, (USD MILLION)
-
MARKET, BY APPLICATION, 2020-2027, (‘000 TONS)
-
ADHESIVES FOR HANDHELD DEVICES MARKET FOR APPLICATION, BY REGION, 2020-2027, (USD MILLION)
-
APPLICATION, BY REGION, 2020-2027, (‘000 TONS)
-
ADHESIVES FOR HANDHELD DEVICES MARKET FOR LAPTOPS, BY REGION, 2020-2027, (USD MILLION)
-
45
-
BY REGION, 2020-2027, (‘000 TONS)
-
HANDHELD DEVICES MARKET FOR MOBILE PHONES & TABLETS, BY REGION, 2020-2027, (USD MILLION)
-
MOBILE PHONES & TABLETS, BY REGION, 2020-2027, (‘000 TONS)
-
2020-2027, (USD MILLION)
-
MARKET FOR HARD DISC DRIVES, BY REGION, 2020-2027, (‘000 TONS)
-
2020-2027, (USD MILLION)
-
MARKET FOR MEDICAL DEVICES, BY REGION, 2020-2027, (‘000 TONS)
-
FOR OTHERS, BY REGION, 2020-2027, (‘000 TONS)
-
ADHESIVES FOR HANDHELD DEVICES MARKET, BY REGION, 2020-2027, (USD MILLION)
-
BY REGION, 2020-2027, (USD MILLION)
-
DEVICES MARKET FOR TYPE, BY REGION, 2020-2027, (‘000 TONS)
-
FOR APPLICATION, BY REGION, 2020-2027, (‘000 TONS)
-
AMERICA ADHESIVES FOR HANDHELD DEVICES MARKET, BY COUNTRY, 2020-2027, (USD MILLION)
-
54
-
2020-2027, (‘000 TONS)
-
DEVICES MARKET, BY TYPE, 2020-2027, (USD MILLION)
-
ADHESIVES FOR HANDHELD DEVICES MARKET, BY TYPE, 2020-2027, (‘000 TONS)
-
BY TYPE, 2020-2027, (‘000 TONS)
-
DEVICES MARKET, BY TYPE, 2020-2027, (USD MILLION)
-
FOR HANDHELD DEVICES MARKET, BY TYPE, 2020-2027, (‘000 TONS)
-
58
-
2020-2027, (‘000 TONS)
-
DEVICES MARKET, BY TYPE, 2020-2027, (USD MILLION)
-
FOR HANDHELD DEVICES MARKET, BY TYPE, 2020-2027, (‘000 TONS)
-
APPLICATION, 2020-2027, (‘000 TONS)
-
FOR HANDHELD DEVICES MARKET, BY COUNTRY, 2020-2027, (USD MILLION)
-
2020-2027, (USD MILLION)
-
MARKET, BY TYPE, 2020-2027, (‘000 TONS)
-
FOR HANDHELD DEVICES MARKET, BY TYPE, 2020-2027, (USD MILLION)
-
2020-2027, (USD MILLION)
-
MARKET, BY TYPE, 2020-2027, (‘000 TONS)
-
FOR HANDHELD DEVICES MARKET, BY APPLICATION, 2020-2027, (USD MILLION)
-
2020-2027, (USD MILLION)
-
MARKET, BY TYPE, 2020-2027, (‘000 TONS)
-
FOR HANDHELD DEVICES MARKET, BY APPLICATION, 2020-2027, (USD MILLION)
-
(USD MILLION)
-
TYPE, 2020-2027, (‘000 TONS)
-
DEVICES MARKET, BY APPLICATION, 2020-2027, (USD MILLION)
-
ADHESIVES FOR HANDHELD DEVICES MARKET, BY APPLICATION, 2020-2027, (‘000 TONS)
-
BY TYPE, 2020-2027, (‘000 TONS)
-
HANDHELD DEVICES MARKET, BY APPLICATION, 2020-2027, (USD MILLION)
-
2020-2027, (USD MILLION)
-
MARKET, BY TYPE, 2020-2027, (‘000 TONS)
-
FOR HANDHELD DEVICES MARKET, BY APPLICATION, 2020-2027, (USD MILLION)
-
BY TYPE, 2020-2027, (USD MILLION)
-
FOR HANDHELD DEVICES MARKET, BY TYPE, 2020-2027, (‘000 TONS)
-
MARKET, BY APPLICATION, 2020-2027, (‘000 TONS)
-
PACIFIC ADHESIVES FOR HANDHELD DEVICES MARKET, BY COUNTRY, 2020-2027, (USD MILLION)
-
76
-
2020-2027, (‘000 TONS)
-
DEVICES MARKET, BY TYPE, 2020-2027, (USD MILLION)
-
ADHESIVES FOR HANDHELD DEVICES MARKET, BY TYPE, 2020-2027, (‘000 TONS)
-
BY TYPE, 2020-2027, (‘000 TONS)
-
HANDHELD DEVICES MARKET, BY TYPE, 2020-2027, (USD MILLION)
-
CHINA ADHESIVES FOR HANDHELD DEVICES MARKET, BY TYPE, 2020-2027, (‘000 TONS)
-
79
-
2020-2027, (USD MILLION)
-
MARKET, BY APPLICATION, 2020-2027, (‘000 TONS)
-
ADHESIVES FOR HANDHELD DEVICES MARKET, BY TYPE, 2020-2027, (USD MILLION)
-
2020-2027, (USD MILLION)
-
MARKET, BY APPLICATION, 2020-2027, (‘000 TONS)
-
ADHESIVES FOR HANDHELD DEVICES MARKET, BY TYPE, 2020-2027, (USD MILLION)
-
2020-2027, (USD MILLION)
-
MARKET, BY APPLICATION, 2020-2027, (‘000 TONS)
-
OF ASIA-PACIFIC ADHESIVES FOR HANDHELD DEVICES MARKET, BY TYPE, 2020-2027, (USD MILLION)
-
MARKET, BY TYPE, 2020-2027, (‘000 TONS)
-
ADHESIVES FOR HANDHELD DEVICES MARKET, BY APPLICATION, 2020-2027, (USD MILLION)
-
85
-
BY APPLICATION, 2020-2027, (‘000 TONS)
-
ADHESIVES FOR HANDHELD DEVICES MARKET, BY COUNTRY, 2020-2027, (USD MILLION)
-
MARKET, BY TYPE, 2020-2027, (USD MILLION)
-
FOR HANDHELD DEVICES MARKET, BY TYPE, 2020-2027, (‘000 TONS)
-
BY TYPE, 2020-2027, (‘000 TONS)
-
ADHESIVES FOR HANDHELD DEVICES MARKET, BY COUNTRY, 2020-2027, (USD MILLION)
-
2020-2027, (‘000 TONS)
-
FOR HANDHELD DEVICES MARKET, BY TYPE, 2020-2027, (USD MILLION)
-
HANDHELD DEVICES MARKET, BY TYPE, 2020-2027, (USD MILLION)
-
MIDDLE EAST & AFRICA ADHESIVES FOR HANDHELD DEVICES MARKET, BY TYPE, 2020-2027, (‘000 TONS)
-
BY SEALANTS TYPE 2020-2027 (USD MILLION)
-
FOR HANDHELD DEVICES MARKET, BY SEALANTS TYPE 2020-2027 (‘000 TONS)
-
FOR SEALANTS TYPE, BY REGION, 2020-2027, (‘000 TONS)
-
GLOBAL SEALANTS FOR HANDHELD DEVICES MARKET FOR SILICONE SEALANTS, BY REGION, 2020-2027, (USD MILLION)
-
FOR SILICONE SEALANTS, BY REGION, 2020-2027, (‘000 TONS)
-
2020-2027, (USD MILLION)
-
MARKET FOR POLYURETHANE SEALANTS, BY REGION, 2020-2027, (‘000 TONS)
-
2020-2027, (USD MILLION)
-
MARKET FOR ACRYLIC LATEX SEALANTS, BY REGION, 2020-2027, (‘000 TONS)
-
FOR EPOXY SEALANTS , BY REGION, 2020-2027, (‘000 TONS)
-
FOR BUTYL SEALANTS , BY REGION, 2020-2027, (‘000 TONS)
-
FOR OTHERS, BY REGION, 2020-2027, (‘000 TONS)
-
SEALANTS FOR HANDHELD DEVICES MARKET, BY SEALANTS APPLICATION 2020-2027 (USD MILLION)
-
101
-
APPLICATION 2020-2027 (‘000 TONS)
-
FOR HANDHELD DEVICES MARKET FOR SEALANTS APPLICATION, BY REGION, 2020-2027, (USD MILLION)
-
SEALANTS APPLICATION, BY REGION, 2020-2027, (‘000 TONS)
-
FOR MOBILE PHONE, BY REGION, 2020-2027, (‘000 TONS)
-
GLOBAL SEALANTS FOR HANDHELD DEVICES MARKET FOR LAPTOP, BY REGION, 2020-2027, (USD MILLION)
-
LAPTOP, BY REGION, 2020-2027, (‘000 TONS)
-
FOR HANDHELD DEVICES MARKET FOR HARD DISC DRIVES, BY REGION, 2020-2027, (USD MILLION)
-
106
-
DRIVES, BY REGION, 2020-2027, (‘000 TONS)
-
FOR HANDHELD DEVICES MARKET FOR MEDICAL DEVICES, BY REGION, 2020-2027, (USD MILLION)
-
107
-
DEVICES, BY REGION, 2020-2027, (‘000 TONS)
-
SEALANTS FOR HANDHELD DEVICES MARKET FOR OTHERS, BY REGION, 2020-2027, (USD MILLION)
-
108
-
BY REGION, 2020-2027, (‘000 TONS)
-
FOR HANDHELD DEVICES MARKET, BY REGION, 2020-2027, (USD MILLION)
-
109
-
2020-2027, (‘000 TONS)
-
DEVICES MARKET, BY REGION, 2020-2027, (‘000 TONS)
-
GLOBAL SEALANTS FOR HANDHELD DEVICES MARKET FOR TYPE, BY REGION, 2020-2027, (USD MILLION)
-
TYPE, BY REGION, 2020-2027, (‘000 TONS)
-
FOR HANDHELD DEVICES MARKET FOR APPLICATION, BY REGION, 2020-2027, (USD MILLION)
-
111
-
BY REGION, 2020-2027, (‘000 TONS)
-
FOR HANDHELD DEVICES MARKET, BY COUNTRY, 2020-2027, (USD MILLION)
-
BY TYPE, 2020-2027, (USD MILLION)
-
FOR HANDHELD DEVICES MARKET, BY TYPE , 2020-2027, (‘000 TONS)
-
BY TYPE, 2020-2027, (‘000 TONS)
-
DEVICES MARKET, BY TYPE, 2020-2027, (USD MILLION)
-
FOR HANDHELD DEVICES MARKET, BY TYPE, 2020-2027, (‘000 TONS)
-
117
-
2020-2027, (‘000 TONS)
-
DEVICES MARKET, BY TYPE, 2020-2027, (USD MILLION)
-
SEALANTS FOR HANDHELD DEVICES MARKET, BY TYPE, 2020-2027, (‘000 TONS)
-
APPLICATION, 2020-2027, (‘000 TONS)
-
FOR HANDHELD DEVICES MARKET, BY COUNTRY, 2020-2027, (USD MILLION)
-
2020-2027, (USD MILLION)
-
MARKET, BY TYPE, 2020-2027, (‘000 TONS)
-
FOR HANDHELD DEVICES MARKET, BY TYPE, 2020-2027, (USD MILLION)
-
2020-2027, (USD MILLION)
-
MARKET, BY TYPE, 2020-2027, (‘000 TONS)
-
FOR HANDHELD DEVICES MARKET, BY APPLICATION, 2020-2027, (USD MILLION)
-
2020-2027, (USD MILLION)
-
MARKET, BY TYPE, 2020-2027, (‘000 TONS)
-
FOR HANDHELD DEVICES MARKET, BY APPLICATION, 2020-2027, (USD MILLION)
-
2020-2027, (USD MILLION)
-
MARKET, BY TYPE, 2020-2027, (‘000 TONS)
-
FOR HANDHELD DEVICES MARKET, BY APPLICATION, 2020-2027, (USD MILLION)
-
2020-2027, (USD MILLION)
-
MARKET, BY TYPE, 2020-2027, (‘000 TONS)
-
FOR HANDHELD DEVICES MARKET, BY APPLICATION, 2020-2027, (USD MILLION)
-
2020-2027, (USD MILLION)
-
MARKET, BY TYPE, 2020-2027, (‘000 TONS)
-
FOR HANDHELD DEVICES MARKET, BY APPLICATION, 2020-2027, (USD MILLION)
-
BY TYPE, 2020-2027, (USD MILLION)
-
FOR HANDHELD DEVICES MARKET, BY TYPE, 2020-2027, (‘000 TONS)
-
MARKET, BY APPLICATION, 2020-2027, (‘000 TONS)
-
PACIFIC SEALANTS FOR HANDHELD DEVICES MARKET, BY COUNTRY, 2020-2027, (USD MILLION)
-
135
-
2020-2027, (‘000 TONS)
-
DEVICES MARKET, BY TYPE, 2020-2027, (USD MILLION)
-
SEALANTS FOR HANDHELD DEVICES MARKET, BY TYPE, 2020-2027, (‘000 TONS)
-
BY TYPE, 2020-2027, (‘000 TONS)
-
HANDHELD DEVICES MARKET, BY TYPE, 2020-2027, (USD MILLION)
-
CHINA SEALANTS FOR HANDHELD DEVICES MARKET, BY TYPE, 2020-2027, (‘000 TONS)
-
138
-
2020-2027, (USD MILLION)
-
MARKET, BY APPLICATION, 2020-2027, (‘000 TONS)
-
SEALANTS FOR HANDHELD DEVICES MARKET, BY TYPE, 2020-2027, (USD MILLION)
-
2020-2027, (USD MILLION)
-
MARKET, BY APPLICATION, 2020-2027, (‘000 TONS)
-
SEALANTS FOR HANDHELD DEVICES MARKET, BY TYPE, 2020-2027, (USD MILLION)
-
2020-2027, (USD MILLION)
-
MARKET, BY APPLICATION, 2020-2027, (‘000 TONS)
-
OF ASIA-PACIFIC SEALANTS FOR HANDHELD DEVICES MARKET, BY TYPE, 2020-2027, (USD MILLION)
-
143
-
BY TYPE, 2020-2027, (‘000 TONS)
-
SEALANTS FOR HANDHELD DEVICES MARKET, BY APPLICATION, 2020-2027, (USD MILLION)
-
MARKET, BY COUNTRY, 2020-2027, (USD MILLION)
-
SEALANTS FOR HANDHELD DEVICES MARKET, BY COUNTRY, 2020-2027, (‘000 TONS)
-
BY TYPE, 2020-2027, (‘000 TONS)
-
FOR HANDHELD DEVICES MARKET, BY TYPE, 2020-2027, (USD MILLION)
-
MARKET, BY COUNTRY, 2020-2027, (USD MILLION)
-
& AFRICA SEALANTS FOR HANDHELD DEVICES MARKET, BY COUNTRY, 2020-2027, (‘000 TONS)
-
MARKET, BY TYPE, 2020-2027, (USD MILLION)
-
AFRICA SEALANTS FOR HANDHELD DEVICES MARKET, BY TYPE, 2020-2027, (‘000 TONS)
-
149
-
BY TYPE, 2020-2027, (USD MILLION)
-
SEALANTS FOR HANDHELD DEVICES MARKET, BY TYPE, 2020-2027, (‘000 TONS)
-
PRICING & FORECAST (USD/TON) (2020 –2023)
-
AG & CO. KGAA: SEGMENT OVERVIEW
-
KGAA:KEY DEVELOPMENTS
-
160
-
CORNING CORPORATION: KEY DEVELOPMENTS
-
OVERVIEW
-
-
DOWN & BOTTOM UP APPROACH
-
FOR HANDHELD DEVICES MARKET
-
SMARTPHONES SHIPMENT, (2020-2027)
-
SHIPMENT, (2020-2027)
-
27
-
MARKET, BY ADHESIVE TYPE 2020-2027 (USD MILLION)
-
FOR HANDHELD DEVICES MARKET, BY ADHESIVE TYPE 2020-2027 (‘000 TONS)
-
APPLICATION, 2020-2027, (‘000 TONS)
-
FOR HANDHELD DEVICES MARKET, BY REGION, 2020-2027, (USD MILLION)
-
TYPE 2020-2027 (USD MILLION)
-
DEVICES MARKET, BY SEALANTS TYPE 2020-2027 (‘000 TONS)
-
BY SEALANTS APPLICATION 2020-2027 (‘000 TONS)
-
SHARE ANALYSIS, BY KEY PLAYERS (2020 )
-
KGAA: FINANCIAL UPDATES
-
(CONSUMER SOLUTION) : FINANCIAL UPDATES
-
SEGMENT REVENUE
-
166
Adhesives & Sealants Market Segmentation
Market Segmentation Overview
- Detailed segmentation data will be available in the full report
- Comprehensive analysis by multiple parameters
- Regional and country-level breakdowns
- Market size forecasts by segment

Free Sample Request
Kindly complete the form below to receive a free sample of this Report
Customer Strories
“I am very pleased with how market segments have been defined in a relevant way for my purposes (such as "Portable Freezers & refrigerators" and "last-mile"). In general the report is well structured. Thanks very much for your efforts.”
Victoria Milne
Founder
Case Study
Leave a Comment