• Cat-intel
  • MedIntelliX
  • Resources
  • About Us
  • Hero Background
    English
    Chinese
    French
    Japanese
    Korean
    German
    Spanish

    Virtual Sensors Market Size

    ID: MRFR/ICT/7272-HCR
    100 Pages
    Ankit Gupta
    October 2025

    Virtual Sensor Market Research Report Information By Component (Solution, Services), By Deployment Mode (Cloud, On-Premise), By End User (Electronics, Automotive & Transportation, Manufacturing & Utilities, Healthcare, Oil & Gas, Aerospace & Defense, Others) And By Region (North America, Europe, Asia-Pacific, And Rest Of The World) –Market Forecast Till 2035

    Share:
    Download PDF ×

    We do not share your information with anyone. However, we may send you emails based on your report interest from time to time. You may contact us at any time to opt-out.

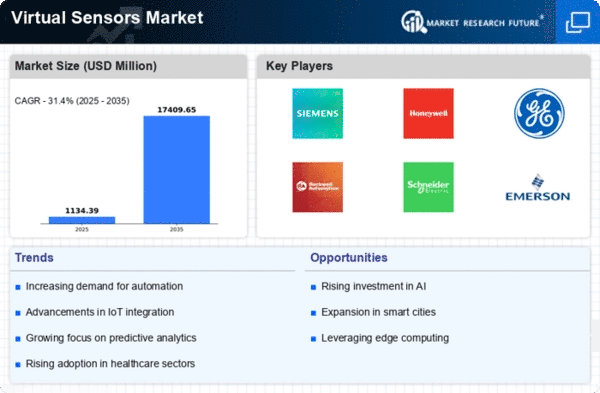
    Virtual Sensors Market Infographic
    $ 4,950.0
    $ 5,950.0
    $ 7,250.0

    Virtual Sensors Size

    Virtual Sensors Market Growth Projections and Opportunities

    The virtual sensors market proves to be a dynamic growth engine due to an increasing demand for a more affordable supplier of quality information and the use of data IoT techniques and virtualization technology. Market dynamics in most cases revolve around the capability of virtual sensors which imitate their physical counterparts to deliver valuable insights and predictive analysis that problems without having additional instruments will be easy to solve. The main reason for the increase in this market is that there is demand for systems of this kind for monitoring and control of processes of industry. In addition to the real sensors and devices, virtual sensors also involve mathematical models and algorithms that help in the way of simulating the physical objects, providing real-time data on aspects like temperature, pressure, and humidity. Firstly, this would lead to the replacement of physical sensors by other devices which in turn will enable them to enhance their decision-making processes and optimize operations.

    A key factor resulted from the fact is the Internet of Things as a very important factor shaping the virtual sensors market dynamics. With the growth and spread of IoT-based use cases over different sectors, the need for low-cost and expandable solutions to collect and process data will become critical. Through IOs systems there is a crucial role which is played by virtual sensors so as to support physical sensors in complement and filling in dues collection. Virtual sensors through IoT can be used where physical sensors are not practical from the perspective of efficiency and also cost to bring about an increase in capabilities.

    The competitive environment of the virtual sensors market is well-versed with traditional players and new entrants in the sector who offer wide-ranging solutions. Virtual sensors are patterning their use in industries including manufacturing, healthcare, and automotive as part of predictive maintenance, resource optimizing and operational efficiency to dimension their systems, respectively. Continuing the development of machine learning and artificial intelligence technologies takes the sensors even further by making them more adaptive and able to learn from their data patterns. This is to say that the more accurate and insightful predictions can be achieved.

    Sustainability and energy efficiency is growing more powerful as well as tendencies in the market. Virtual sensors are used in the systems of energy management which provide businesses with the effective way to track and regulate the consumption to avoid the need to use plenty of physical sensors. This goes hand in hand with the global emphasis on sustainable practices and cost-effective resource utilization, as a result, fueling the adoption of virtual sensors in industries which are focusing on reducing the effects they have on environment.
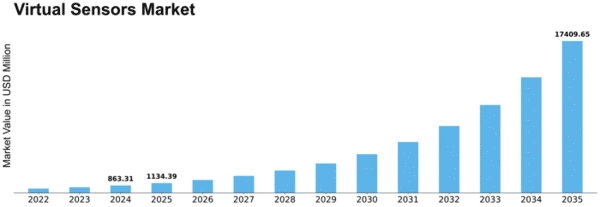
    Virtual Sensors Market Size Graph

    Market Summary

    As per Market Research Future Analysis, the Virtual Sensors Market is projected to grow significantly from USD 1.13 Billion in 2025 to USD 17.41 Billion by 2035, with a remarkable CAGR of 31.40% during the forecast period. The market was valued at USD 0.86 Billion in 2024, driven by increased data-driven business practices and innovations in virtual reality. The rising adoption of IoT and cloud platforms, along with the demand for predictive maintenance, are key factors propelling market growth across various industries.

    Key Market Trends & Highlights

    The Virtual Sensors Market is witnessing transformative trends driven by technological advancements.

    • Market Size in 2024: USD 0.86 Billion; projected to reach USD 17.41 Billion by 2035.
    • CAGR during 2025-2034: 31.40%; Market Size in 2024: USD 0.86 Billion.
    • Cloud segment dominates deployment mode; offers scalability and cost efficiency.
    • Electronics sector leads end-user applications due to high data intensity.

    Market Size & Forecast

    2024 Market Size USD 0.86 Billion
    2035 Market Size USD 17.41 Billion
    CAGR 31.40%
    Largest Regional Market Share in 2024 North America.

    Major Players

    Key players include Aspen Technology Inc, Algorithmica Technologies GmbH, Elliptic Laboratories, General Electric Company, OsiSoft LLC, Siemens AG, Rockwell Automation, ANDATA SmartUQ LLC, Tactile Mobility, Schneider Electric, IntelliDynamics, LMI Technologies, Modelway.

    Market Trends

    Rising adoption of loT and cloud platforms is driving the market growth

    Functional efficiency offered by virtual sensors is driving their uptake across various end-users. Increasing penetration of cloud platforms is expected to create numerous opportunities for adopting virtual sensors. Leading manufacturers are implementing a cloud-based virtual sensing solution as a standard platform. Implementing virtual sensors on a cloud platform helps businesses reduce the cost associated with maintenance and improve data connectivity between the user and sensor-cloud server. In addition to this, such solutions enable effective transport monitoring, weather forecasting, military activities, and the healthcare industry.

    The cloud platform allows end-users to cut down the total cost of ownership and increase data storage capabilities, which has impacted the virtual sensor market CAGR.

    Additionally, virtual sensor-based predictive maintenance allows end-users to determine the conditions of instruments to evaluate when maintenance should be performed. Thus, it helps manufacturers in minimizing unexpected device downtime, lowers the maintenance cost, and extends the equipment life cycle. Environmental pollution regulations have further elevated the demand for virtual sensors among industry verticals. Virtual sensors can be integrated with components such as connectors, hoses and tubing, motors, actuators, and filters. Through constant monitoring, manufacturing industries can provide real-time insights into their machinery by continuously monitoring factors such as vibrations, temperature, ultrasound and electromagnetic.

    Growing adoption of condition-based maintenance (CBM) and IoT-enabled predictive maintenance (PdM) is one of the key reasons behind the adoption of virtual sensors among industry verticals. In addition, the increasing use of the industrial Internet of Things (IoT) for design and manufacturing is expected to play an essential role in this market's growth. Thus, driving the Virtual Sensors market revenue.

    The Global Virtual Sensors Market is poised for substantial growth, driven by advancements in artificial intelligence and the increasing demand for real-time data analytics across various sectors.

    U.S. Department of Commerce

    Virtual Sensors Market Market Drivers

    Market Growth Projections

    The Global Virtual Sensors Market Industry is poised for remarkable growth, with projections indicating an increase from 0.86 USD Billion in 2024 to 17.4 USD Billion by 2035. This trajectory suggests a compound annual growth rate of 31.45% from 2025 to 2035, reflecting the expanding applications and technological advancements in virtual sensor technology. The anticipated growth is driven by various factors, including the rising demand for smart devices, increased focus on energy efficiency, and advancements in artificial intelligence. As industries continue to adopt virtual sensors for enhanced monitoring and analytics, the market is likely to experience substantial expansion.

    Growing Adoption in Healthcare

    The healthcare sector increasingly leverages virtual sensors to improve patient monitoring and diagnostics, thereby propelling the Global Virtual Sensors Market Industry. Virtual sensors facilitate remote health monitoring, allowing healthcare providers to track vital signs and health metrics in real-time. This capability not only enhances patient care but also reduces the burden on healthcare facilities. As the demand for telehealth solutions rises, the integration of virtual sensors into medical devices is expected to expand. This trend may contribute to the market's growth trajectory, with projections indicating a substantial increase in value over the next decade.

    Rising Demand for Smart Devices

    The Global Virtual Sensors Market Industry experiences a notable surge in demand for smart devices, driven by advancements in technology and consumer preferences. As smart homes and IoT devices proliferate, the need for virtual sensors that can monitor and analyze data in real-time becomes increasingly critical. In 2024, the market is valued at 0.86 USD Billion, reflecting a growing acceptance of these technologies. The integration of virtual sensors into various applications, such as smart thermostats and security systems, enhances user experience and operational efficiency, indicating a robust trajectory for growth in the coming years.

    Increased Focus on Energy Efficiency

    Energy efficiency remains a pivotal driver within the Global Virtual Sensors Market Industry. Organizations across sectors are increasingly adopting virtual sensors to optimize energy consumption and reduce operational costs. For instance, virtual sensors can monitor energy usage patterns and provide actionable insights, enabling businesses to implement energy-saving measures. This trend aligns with global sustainability goals, as companies strive to minimize their carbon footprint. The anticipated growth from 0.86 USD Billion in 2024 to 17.4 USD Billion by 2035 underscores the potential impact of energy efficiency initiatives on market expansion.

    Advancements in Artificial Intelligence

    The integration of artificial intelligence into virtual sensor technology significantly enhances the capabilities of the Global Virtual Sensors Market Industry. AI algorithms can process vast amounts of data collected by virtual sensors, enabling predictive analytics and real-time decision-making. This advancement allows for improved accuracy in monitoring environmental conditions, health metrics, and industrial processes. As AI continues to evolve, its synergy with virtual sensors is likely to drive innovation and create new applications across various industries, fostering a competitive landscape that could lead to a compound annual growth rate of 31.45% from 2025 to 2035.

    Emerging Applications in Automotive Industry

    The automotive industry is witnessing a transformative shift with the incorporation of virtual sensors, which is a key driver for the Global Virtual Sensors Market Industry. These sensors play a crucial role in enhancing vehicle safety, navigation, and performance monitoring. For example, virtual sensors can provide real-time data on vehicle conditions, enabling predictive maintenance and improving overall efficiency. As the automotive sector increasingly embraces automation and smart technologies, the demand for virtual sensors is likely to escalate. This trend aligns with the broader market growth, suggesting a promising future for virtual sensor applications in transportation.

    Market Segment Insights

    Virtual Sensors Type Insights

    Based on Components, the global Virtual Sensors market segmentation includes Solutions and Services. The solutions segment dominated the market because solutions are the essential Component of virtual sensors, as they provide the tools and functionality for collecting, processing, and analyzing data. Solutions provide the tools and functionality for collecting, processing and analyzing data.

    Virtual Sensors Deployment Mode Insights

    The global Virtual Sensors market segmentation, based on Deployment Mode, includes Cloud, On-Premise. The cloud segment dominated the market; Cloud-based virtual sensors can be easily scaled up or down to meet the changing needs of an organization. Cloud-based virtual sensors are typically easier to use than on-premise solutions, as they do not require specialized IT skills.

    Figure2: Virtual Sensors Market, by Deployment Mode, 2022&2032 (USD billion)

    Source: Secondary Research, Primary Research, Market Research Future Database and Analyst Review

    Virtual Sensors End User Insights

    Based on End Users, the global Virtual Sensors market segmentation includes Electronics, Automotive & Transportation, Manufacturing & Utilities, Healthcare, Oil & Gas, Aerospace & Defense, and Others. The electronics segment dominated the market because electronics is a highly data-intensive industry, and virtual sensors can be used to collect and analyze data from various sources, such as sensors, actuators, and machines. This means that a large amount of data can be collected and analyzed using virtual sensors.

    Get more detailed insights about Virtual Sensors Market Research Report - Forecast till 2034

    Regional Insights

    By Region, the study provides market insights into North America, Europe, Asia-Pacific and the Rest of the World. The North American Virtual Sensors market area will dominate this market, owing to the presence of key vendors with an increased inclination towards Software as a Solution (SaaS)will boost the market growth in this Region.

    Further, the major countries studied in the market report are The U.S., Canada, German, France, the UK, Italy, Spain, China, Japan, India, Australia, South Korea, and Brazil.

    Figure 3: VIRTUAL SENSORS MARKET SHARE BY REGION 2022 (%)

    VIRTUAL SENSORS MARKET SHARE BY REGION

    Source: Secondary Research, Primary Research, Market Research Future Database and Analyst Review

    Due to technological advancements, Europe's Virtual Sensors market accounts for the second-largest market share. Key players offering virtual sensor solutions are a major reason behind the market growth in the Region. Further, the German Virtual Sensors market held the largest market share, and the UK Virtual Sensors market was the fastest-growing market in the European Region.

    The Asia-Pacific Virtual Sensors Market is expected to grow at the fastest CAGR from 2023 to 2032. This is because ongoing innovations in the field of VR will create lucrative growth opportunities for manufacturers operating in the Region. Moreover, China’s Virtual Sensors market held the largest market share, and the Indian Virtual Sensors market was the fastest-growing market in the Asia-Pacific region.

    Key Players and Competitive Insights

    Leading market players are investing heavily in research and development in order to expand their product lines, which will help the Virtual Sensors market grow even more. Market participants are also undertaking various strategic activities to expand their global footprint, with important market developments including new product launches, contractual agreements, mergers and acquisitions, higher investments, and collaboration with other organizations. The Virtual Sensors industry must offer cost-effective items to expand and survive in a more competitive and rising market climate.

    Manufacturing locally to minimize operational costs is one of the key business tactics manufacturers use in the global Virtual Sensors industry to benefit clients and increase the market sector. In recent years, the Virtual Sensors industry has offered some of the most significant advantages to medicine. Major players in the Virtual Sensors market, including Aspen Technology Inc, Algorithmica Technologies GmbH, Elliptic Laboratories, General Electric Company OsiSoft LLC, Siemens AG, Rockwell Automation, ANDATA SmartUQ LLC, Tactile Mobility Schneider Electric IntelliDynamics LMI Technologies Modelway., and others, are attempting to increase market demand by investing in research and development operations.

    Aspen Technology, Inc., known as AspenTech, provides Software and services for the process industries headquartered in Bedford, Massachusetts. AspenTech has 35 offices globally. Aspen Technology collaborated with Hexagon to accelerate digital transformation among process industries. Aspen Technology and Hexagon PPM will provide a digital twin allowing operators to make better decisions that maximize throughput, quality and uptime for plant infrastructure and the chemical processes.

    OSIsoft, LLC manufactures application software for real-time data management called the PI System. Founded in 1980, OSIsoft was privately held and headquartered in San Leandro, California.- OSIsoft, LLC collaborated with Dianomic Inc. to build and support a set of Linux-based micro-service modules to help discover, connect, secure, and manage smart sensors for OEMs and developers.

    Key Companies in the Virtual Sensors Market market include

    Industry Developments

    • Q2 2024: Elliptic Labs Launches AI Virtual Proximity Sensor on New Smartphone Model Elliptic Labs announced the commercial launch of its AI Virtual Proximity Sensor on a new smartphone model from a major Asian OEM, marking a significant product deployment in the virtual sensors market.
    • Q1 2024: Siemens Expands Xcelerator Portfolio with New Virtual Sensor Capabilities Siemens introduced new virtual sensor features within its Xcelerator portfolio, enabling advanced predictive maintenance and process optimization for industrial clients.
    • Q2 2024: Honeywell Launches Virtual Sensor Suite for Industrial IoT Applications Honeywell unveiled a new suite of virtual sensors designed to enhance data-driven decision-making and operational efficiency in industrial IoT environments.
    • Q1 2024: Schneider Electric Partners with AVEVA to Integrate Virtual Sensor Technology Schneider Electric announced a partnership with AVEVA to integrate virtual sensor technology into AVEVA’s industrial software, aiming to improve real-time monitoring and predictive analytics.
    • Q2 2024: GE Digital Launches Virtual Sensor Analytics for Power Plant Optimization GE Digital introduced a new virtual sensor analytics platform to help power plant operators optimize performance and reduce maintenance costs through advanced data modeling.
    • Q1 2024: Cisco Introduces Virtual Sensor Integration in IoT Networking Solutions Cisco announced the integration of virtual sensor technology into its IoT networking solutions, enabling customers to deploy scalable, software-based sensing across industrial environments.
    • Q2 2024: Elliptic Labs Signs New Licensing Agreement for Virtual Sensor Technology Elliptic Labs signed a new licensing agreement with a leading consumer electronics manufacturer to embed its virtual sensor technology in upcoming device models.
    • Q1 2024: Siemens Acquires Predictive Engineering Startup Specializing in Virtual Sensors Siemens announced the acquisition of a predictive engineering startup focused on virtual sensor development, aiming to strengthen its digital industries portfolio.
    • Q2 2024: Honeywell Secures Major Contract to Deploy Virtual Sensors in Oil & Gas Facilities Honeywell secured a contract to deploy its virtual sensor solutions across multiple oil and gas facilities, supporting enhanced safety and operational efficiency.
    • Q1 2024: Schneider Electric Appoints New Head of Virtual Sensor Solutions Schneider Electric appointed a new executive to lead its virtual sensor solutions division, reflecting the company’s strategic focus on digital transformation.
    • Q2 2024: GE Digital Partners with Cloud Provider to Expand Virtual Sensor Offerings GE Digital announced a partnership with a major cloud provider to expand the reach and scalability of its virtual sensor analytics solutions.
    • Q1 2024: Cisco Invests in Virtual Sensor Startup to Accelerate IoT Innovation Cisco made a strategic investment in a virtual sensor startup, aiming to accelerate innovation in IoT and edge computing applications.

    Future Outlook

    Virtual Sensors Market Future Outlook

    The Global Virtual Sensors Market is projected to grow at a remarkable 31.40% CAGR from 2025 to 2035, driven by advancements in IoT, AI integration, and demand for real-time data analytics.

    New opportunities lie in:

    • Develop AI-driven virtual sensor solutions for predictive maintenance in manufacturing sectors.
    • Leverage cloud computing to enhance virtual sensor data processing capabilities.
    • Create partnerships with automotive firms to integrate virtual sensors in autonomous vehicles.

    By 2035, the Virtual Sensors Market is expected to achieve substantial growth, establishing itself as a cornerstone of digital transformation.

    Market Segmentation

    Virtual Sensors End User Outlook

    • Electronics
    • Automotive & Transportation
    • Manufacturing & Utilities
    • Healthcare
    • Oil & Gas
    • Aerospace & Defense
    • Others

    Virtual Sensors Regional Outlook

    • China
    • Japan
    • India
    • Australia
    • South Korea
    • Rest of Asia-Pacific

    Virtual Sensors Component Outlook

    • Solution
    • Services

    Virtual Sensors Deployment Mode Outlook

    • Cloud
    • On-Premise

    Report Scope

    Report Attribute/Metric Details
    Market Size 2024 0.86 (USD Billion)
    Market Size 2025 1.13 (USD Billion)
    Market Size 2035 17.41 (USD Billion)
    Compound Annual Growth Rate (CAGR) 31.40% (2025 - 2035)
    Report Coverage Revenue Forecast, Competitive Landscape, Growth Factors, and Trends
    Base Year 2024
    Market Forecast Period 2025 - 2035
    Historical Data 2019 - 2023
    Market Forecast Units USD Billion
    Segments Covered Component, Deployment Mode, End Userand Region
    Geographies Covered North America, Europe, AsiaPacific, and the Rest of the World
    Countries Covered The U.S., Canada, German, France, UK, Italy, Spain, China, Japan, India, Australia, South Korea, and Brazil
    Key Companies Profiled Aspen Technology Inc Algorithmica Technologies GmbH Elliptic Laboratories General Electric Company OsiSoft LLC Siemens AG Rockwell Automation ANDATA SmartUQ LLC Tactile Mobility Schneider Electric IntelliDynamics LMI Technologies Modelway
    Key Market Opportunities Ongoing innovations in the field of VR will create lucrative growth opportunities.
    Key Market Dynamics An increase in data-driven business can drive the market.

    Market Highlights

    Author

    Ankit Gupta
    Senior Research Analyst

    She holds an experience of about 6+ years in market research and business consulting, working under the spectrum of information communication technology, telecommunications and semiconductor domains. aarti conceptualizes and implements a scalable business strategy and provides strategic leadership to the clients. her expertise lies in market estimation, competitive intelligence, pipeline analysis, customer assessment, etc.

    Leave a Comment

    Latest Comments

    John Doe
    john@example.com

    This is a great article! Really helped me understand the topic better.

    Posted on July 23, 2025, 10:15 AM
    Jane Smith
    jane@domain.com

    Thanks for sharing this. I’ve bookmarked it for later reference.

    Posted on July 22, 2025, 7:45 PM

    FAQs

    How much is the Virtual Sensors market?

    The global Virtual Sensors market size was valued at USD 0.86 Billion in 2024.

    What is the growth rate of the Virtual Sensors market?

    The global market is projected to grow at a CAGR of 31.4% during the forecast period, 2025-2034.

    Which Region held the largest market share in the Virtual Sensors market?

    North America had the largest share of the global market.

    Who are the key players in the Virtual Sensors market?

    The key players in the market areAspen Technology Inc, Algorithmica Technologies GmbH, Elliptic Laboratories, General Electric Company OsiSoft LLC, Siemens AG, Rockwell Automation, ANDATA SmartUQ LLC, Tactile Mobility Schneider Electric IntelliDynamics LMI Technologies Modelway

    Which Component led the Virtual Sensors market?

    The Solution category dominated the market in 2024.

    Which Deployment Mode had the largest market share in the Virtual Sensors market?

    The Cloud had the largest share of the global market.

    1. Table of Contents
    2. Executive Summary 12
      1. MARKET ATTRACTIVENESS ANALYSIS 14
        1. GLOBAL VIRTUAL SENSORS MARKET, BY COMPONENT 15
        2. GLOBAL VIRTUAL SENSORS MARKET, BY DEPLOYMENT 16
        3. GLOBAL VIRTUAL SENSORS MARKET, BY END USER 17
        4. GLOBAL VIRTUAL SENSORS MARKET, BY REGION 17
    3. Market Introduction 18
      1. DEFINITION 18
      2. Scope of the Study 18
      3. RESEARCH OBJECTIVE 18
      4. MARKET STRUCTURE 19
    4. Research Methodology 20
      1. RESEARCH PROCESS 20
      2. PRIMARY RESEARCH 21
      3. SECONDARY RESEARCH 22
      4. MARKET SIZE ESTIMATION 23
      5. FORECAST MODEL 25
      6. LIST OF ASSUMPTIONS 25
    5. MARKET DYNAMICS 26
      1. INTRODUCTION 26
      2. DRIVERS 27
        1. INCREASED ADOPTION OF PREDICTIVE MAINTENANCE 27
      3. RESTRAINT 28
        1. SECURITY ISSUES WITH CLOUD-BASED SENSING SYSTEMS 28
      4. OPPORTUNITY 28
        1. APPLICATIONS OF VIRTUAL SENSORS IN THE AEROSPACE INDUSTRY 28
      5. CHALLENGES 29
        1. LACK OF AWARENESS REGARDING APPLICATIONS AND BENEFITS OF VIRTUAL SENSORS 29
    6. MARKET FACTOR ANALYSIS 32
      1. VALUE CHAIN ANALYSIS 32
      2. PORTER’S FIVE FORCES 33
        1. THREAT OF NEW ENTRANTS 33
        2. BARGAINING POWER OF SUPPLIERS 33
        3. THREAT OF SUBSTITUTES 34
        4. BARGAINING POWER OF BUYERS 34
        5. COMPETITIVE RIVALRY 34
    7. GLOBAL VIRTUAL SENSORS MARKET, BY END USER 35
      1. OVERVIEW 35
      2. ELECTRONICS 35
      3. AUTOMOTIVE & TRANSPORTATION 35
      4. MANUFACTURING & UTILITIES 35
      5. HEALTHCARE 35
      6. OIL & GAS 35
      7. AEROSPACE & DEFENSE 35
      8. OTHERS 35
    8. GLOBAL VIRTUAL SENSORS MARKET, BY COMPONENT 35
      1. OVERVIEW 35
      2. SOLUTION 35
      3. SERVICES 35
    9. GLOBAL VIRTUAL SENSORS MARKET, BY DEPLOYMENT MODE 38
      1. OVERVIEW 38
      2. CLOUD 38
      3. ON-PREMISE 38
    10. GLOBAL VIRTUAL SENSORS MARKET, BY REGION 41
      1. OVERVIEW 44
      2. NORTH AMERICA 46
        1. US 49
        2. CANADA 51
        3. MEXICO 53
      3. EUROPE 55
        1. GERMANY 58
        2. UK 60
        3. FRANCE 62
        4. ITALY 63
        5. REST OF EUROPE 64
      4. ASIA-PACIFIC 66
        1. CHINA 69
        2. INDIA 71
        3. JAPAN 73
        4. REST OF ASIA-PACIFIC 75
      5. REST OF THE WORLD 77
        1. MIDDLE EAST AND AFRICA 80
        2. SOUTH AMERICA 82
    11. Competitive Landscape 83
      1. COMPETITIVE OVERVIEW 62
      2. COMPETITIVE BENCHMARKING 63
    12. COMPANY PROFILES 64
      1. ALGORITHMICA TECHNOLOGIES GMBH 64
        1. COMPANY OVERVIEW 64
        2. FINANCIAL OVERVIEW 64
        3. PRODUCTS/SOLUTIONS/SERVICES OFFERED 65
        4. KEY DEVELOPMENTS 65
        5. SWOT ANALYSIS 65
        6. KEY STRATEGIES 66
      2. ASPEN TECHNOLOGY INC 67
        1. COMPANY OVERVIEW 67
        2. FINANCIAL OVERVIEW 67
        3. PRODUCTS/SOLUTIONS/SERVICES OFFERED 68
        4. KEY DEVELOPMENTS 68
        5. SWOT ANALYSIS 68
        6. KEY STRATEGIES 69
      3. ELLIPTIC LABORATORIES 70
        1. COMPANY OVERVIEW 70
        2. FINANCIAL OVERVIEW 70
        3. PRODUCTS/SOLUTIONS/SERVICES OFFERED 71
        4. KEY DEVELOPMENTS 71
        5. SWOT ANALYSIS 72
        6. KEY STRATEGIES 72
      4. GENERAL ELECTRIC COMPANY 73
        1. COMPANY OVERVIEW 73
        2. FINANCIAL OVERVIEW 73
        3. PRODUCTS/SOLUTIONS/SERVICES OFFERED 74
        4. KEY DEVELOPMENTS 74
        5. SWOT ANALYSIS 75
        6. KEY STRATEGIES 75
      5. OSISOFT LLC 76
        1. COMPANY OVERVIEW 76
        2. FINANCIAL OVERVIEW 76
        3. PRODUCTS/SOLUTIONS/SERVICES OFFERED 77
        4. KEY DEVELOPMENTS 77
        5. SWOT ANALYSIS 78
        6. KEY STRATEGIES 78
      6. SIEMENS AG 79
        1. COMPANY OVERVIEW 79
        2. FINANCIAL OVERVIEW 79
        3. PRODUCTS/SOLUTIONS/SERVICES OFFERED 80
        4. KEY DEVELOPMENTS 80
        5. SWOT ANALYSIS 80
        6. KEY STRATEGIES 81
      7. ROCKWELL AUTOMATION 82
        1. COMPANY OVERVIEW 82
        2. FINANCIAL OVERVIEW 82
        3. PRODUCTS/SOLUTIONS/SERVICES OFFERED 83
        4. KEY DEVELOPMENTS 83
        5. KEY STRATEGIES 83
      8. ANDATA 84
        1. COMPANY OVERVIEW 84
        2. FINANCIAL OVERVIEW 84
        3. PRODUCTS/ SOLUTIONS/ SERVICES OFFERED 84
        4. KEY STRATEGIES 84
      9. SMARTUQ LLC 85
        1. COMPANY OVERVIEW 85
        2. FINANCIAL OVERVIEW 85
        3. PRODUCTS/ SOLUTIONS/ SERVICES OFFERED 85
        4. KEY STRATEGIES 85
      10. TACTILE MOBILITY 86
        1. COMPANY OVERVIEW 86
        2. FINANCIAL OVERVIEW 86
        3. PRODUCTS/ SOLUTIONS/ SERVICES OFFERED 86
        4. KEY STRATEGIES 86
      11. SCHNEIDER ELECTRIC 76
        1. COMPANY OVERVIEW 76
        2. FINANCIAL OVERVIEW 76
        3. PRODUCTS/SOLUTIONS/SERVICES OFFERED 77
        4. KEY DEVELOPMENTS 77
        5. SWOT ANALYSIS 78
        6. KEY STRATEGIES 78
      12. INTELLIDYNAMICS 79
        1. COMPANY OVERVIEW 79
        2. FINANCIAL OVERVIEW 79
        3. PRODUCTS/SOLUTIONS/SERVICES OFFERED 80
        4. KEY DEVELOPMENTS 80
        5. SWOT ANALYSIS 80
        6. KEY STRATEGIES 81
      13. LMI TECHNOLOGIES 82
        1. COMPANY OVERVIEW 82
        2. FINANCIAL OVERVIEW 82
        3. PRODUCTS/SOLUTIONS/SERVICES OFFERED 83
        4. KEY DEVELOPMENTS 83
        5. KEY STRATEGIES 83
      14. MODELWAY 84
        1. COMPANY OVERVIEW 84
        2. FINANCIAL OVERVIEW 84
        3. PRODUCTS/ SOLUTIONS/ SERVICES OFFERED 84
        4. KEY STRATEGIES 84
      15. EXPUTEC 85
        1. COMPANY OVERVIEW 85
        2. FINANCIAL OVERVIEW 85
        3. PRODUCTS/ SOLUTIONS/ SERVICES OFFERED 85
        4. KEY STRATEGIES 85
    13. List of Tables and Figures
      1. LIST OF TABLES
      2. TABLE 1 PRIMARY INTERVIEWS 21
      3. TABLE 2 LIST OF ASSUMPTIONS 25
      4. TABLE 3 GLOBAL MOBILE GAMBLING MARKET, BY TYPE, 2017–2025 (USD MILLION) 37
      5. TABLE 4 GLOBAL MOBILE GAMBLING MARKET, BY END-USER, 2017–2025 (USD MILLION) 40
      6. TABLE 5 GLOBAL MOBILE GAMBLING MARKET, BY REGION, 2017–2025 (USD MILLION) 42
      7. TABLE 6 EUROPE MOBILE GAMBLING MARKET, BY COUNTRY, 2017–2025 (USD MILLION) 43
      8. TABLE 7 EUROPE MOBILE GAMBLING MARKET, BY TYPE, 2017–2025 (USD MILLION) 43
      9. TABLE 8 EUROPE MOBILE GAMBLING MARKET, BY END-USER, 2017–2025 (USD MILLION) 44
      10. TABLE 9 UK MOBILE GAMBLING MARKET, BY TYPE, 2017–2025 (USD MILLION) 44
      11. TABLE 10 UK MOBILE GAMBLING MARKET, BY END-USER, 2017–2025 (USD MILLION) 45
      12. TABLE 11 GERMANY MOBILE GAMBLING MARKET, BY TYPE, 2017–2025 (USD MILLION) 45
      13. TABLE 12 GERMANY MOBILE GAMBLING MARKET, BY END-USER, 2017–2025 (USD MILLION) 46
      14. TABLE 13 FRANCE MOBILE GAMBLING MARKET, BY TYPE, 2017–2025 (USD MILLION) 46
      15. TABLE 14 FRANCE MOBILE GAMBLING MARKET, BY END-USER, 2017–2025 (USD MILLION) 47
      16. TABLE 15 REST OF EUROPE MOBILE GAMBLING MARKET, BY TYPE, 2017–2025 (USD MILLION) 47
      17. TABLE 16 REST OF EUROPE MOBILE GAMBLING MARKET, BY END-USER, 2017–2025 (USD MILLION) 48
      18. TABLE 17 NORTH AMERICA MOBILE GAMBLING MARKET, BY COUNTRY, 2017–2025 (USD MILLION) 49
      19. TABLE 18 NORTH AMERICA MOBILE GAMBLING MARKET, BY TYPE, 2017–2025 (USD MILLION) 49
      20. TABLE 19 NORTH AMERICA MOBILE GAMBLING MARKET, BY END-USER, 2017–2025 (USD MILLION) 50
      21. TABLE 20 US MOBILE GAMBLING MARKET, BY TYPE, 2017–2025 (USD MILLION) 50
      22. TABLE 21 US MOBILE GAMBLING MARKET, BY END-USER, 2017–2025 (USD MILLION) 51
      23. TABLE 22 CANADA MOBILE GAMBLING MARKET, BY TYPE, 2017–2025 (USD MILLION) 51
      24. TABLE 23 CANADA MOBILE GAMBLING MARKET, BY END-USER, 2017–2025 (USD MILLION) 52
      25. TABLE 24 MEXICO MOBILE GAMBLING MARKET, BY TYPE, 2017–2025 (USD MILLION) 52
      26. TABLE 25 MEXICO MOBILE GAMBLING MARKET, BY END-USER, 2017–2025 (USD MILLION) 53
      27. TABLE 26 ASIA-PACIFIC MOBILE GAMBLING MARKET, BY COUNTRY, 2017–2025 (USD MILLION) 54
      28. TABLE 27 ASIA-PACIFIC MOBILE GAMBLING MARKET, BY TYPE, 2017–2025 (USD MILLION) 54
      29. TABLE 28 ASIA-PACIFIC MOBILE GAMBLING MARKET, BY END-USER, 2017–2025 (USD MILLION) 55
      30. TABLE 29 CHINA MOBILE GAMBLING MARKET, BY TYPE, 2017–2025 (USD MILLION) 55
      31. TABLE 30 CHINA MOBILE GAMBLING MARKET, BY END-USER, 2017–2025 (USD MILLION) 56
      32. TABLE 31 INDIA MOBILE GAMBLING MARKET, BY TYPE, 2017–2025 (USD MILLION) 56
      33. TABLE 32 INDIA MOBILE GAMBLING MARKET, BY END-USER, 2017–2025 (USD MILLION) 57
      34. TABLE 33 JAPAN MOBILE GAMBLING MARKET, BY TYPE, 2017–2025 (USD MILLION) 57
      35. TABLE 34 JAPAN MOBILE GAMBLING MARKET, BY END-USER, 2017–2025 (USD MILLION) 58
      36. TABLE 35 REST OF ASIA-PACIFIC MOBILE GAMBLING MARKET, BY TYPE, 2017–2025 (USD MILLION) 58
      37. TABLE 36 REST OF ASIA-PACIFIC MOBILE GAMBLING MARKET, BY END-USER, 2017–2025 (USD MILLION) 59
      38. TABLE 37 SOUTH AMERICA MOBILE GAMBLING MARKET, BY TYPE, 2017–2025 (USD MILLION) 60
      39. TABLE 38 SOUTH AMERICA MOBILE GAMBLING MARKET, BY END-USER, 2017–2025 (USD MILLION) 60
      40. TABLE 39 MIDDLE EAST AND AFRICA MOBILE GAMBLING MARKET, BY TYPE, 2017–2025 (USD MILLION) 61
      41. TABLE 40 MIDDLE EAST AND AFRICA MOBILE GAMBLING MARKET, BY END-USER, 2017–2025 (USD MILLION) 61
      42. TABLE 41 BETSSON AB: PRODUCTS/SOLUTIONS/SERVICES OFFERED 65
      43. TABLE 42 KINDRED GROUP PLC: PRODUCTS/SOLUTIONS/SERVICES OFFERED 68
      44. TABLE 43 NETENT AB: PRODUCTS/SOLUTIONS/SERVICES OFFERED 71
      45. TABLE 44 NETENT AB: KEY DEVELOPMENTS 71
      46. TABLE 45 PADDY POWER BETFAIR PLC: PRODUCTS/SOLUTIONS/SERVICES OFFERED 74
      47. TABLE 46 PADDY POWER BETFAIR PLC: KEY DEVELOPMENTS 74
      48. TABLE 47 THE 888 GROUP: PRODUCTS/SOLUTIONS/SERVICES OFFERED 77
      49. TABLE 48 THE 888 GROUP: KEY DEVELOPMENTS 77
      50. TABLE 49 SCIENTIFIC GAMES: PRODUCTS/SOLUTIONS/SERVICES OFFERED 80
      51. TABLE 50 LADBROKES: PRODUCTS/SOLUTIONS/SERVICES OFFERED 83
      52. TABLE 51 THE HONG KONG JOCKEY CLUB: PRODUCTS/ SOLUTIONS/ SERVICES OFFERED 84
      53. TABLE 52 CAMELOT: PRODUCTS/ SOLUTIONS/ SERVICES OFFERED 85
      54. TABLE 53 ADDISON GLOBAL LIMITED: PRODUCTS/ SOLUTIONS/ SERVICES OFFERED 86   LIST OF FIGURES
      55. FIGURE 1 MARKET SYNOPSIS 13
      56. FIGURE 2 MARKET ATTRACTIVENESS ANALYSIS: GLOBAL MOBILE GAMBLING MARKET 14
      57. FIGURE 3 GLOBAL MOBILE GAMBLING MARKET ANALYSIS, BY TYPE 15
      58. FIGURE 4 GLOBAL MOBILE GAMBLING MARKET ANALYSIS, BY END-USER 16
      59. FIGURE 5 GLOBAL MOBILE GAMBLING MARKET ANALYSIS, BY REGION, 2018 17
      60. FIGURE 6 GLOBAL MOBILE GAMBLING MARKET: STRUCTURE 19
      61. FIGURE 7 RESEARCH PROCESS 20
      62. FIGURE 8 TOP-DOWN & Bottom-up ApproachES 24
      63. FIGURE 9 MARKET DYNAMIC ANALYSIS OF THE GLOBAL MOBILE GAMBLING MARKET 26
      64. FIGURE 10 DRIVER IMPACT ANALYSIS 28
      65. FIGURE 11 GLOBAL MOBILE GAMBLING MARKET, BY TYPE, 2018 (% SHARE) 36
      66. FIGURE 12 GLOBAL MOBILE GAMBLING MARKET, BY TYPE, 2018 VS 2025 (USD MILLION) 36
      67. FIGURE 13 GLOBAL MOBILE GAMBLING MARKET, BY END-USER, 2018 (% SHARE) 39
      68. FIGURE 14 GLOBAL MOBILE GAMBLING MARKET, BY END-USER, 2018 VS 2025 (USD MILLION) 39
      69. FIGURE 15 GLOBAL MOBILE GAMBLING MARKET, BY REGION, 2018 (% SHARE) 41
      70. FIGURE 16 GLOBAL MOBILE GAMBLING MARKET, BY REGION, 2018 VS 2025 (USD MILLION) 42
      71. FIGURE 17 GLOBAL MOBILE GAMBLING MARKET: COMPETITIVE BENCHMARKING ANALYSIS IN 2018 63

    Virtual Sensors Segmentation

    Virtual Sensors Component Outlook (USD Billion, 2018-2032)

    • Solution
    • Services

    Virtual Sensors Deployment Mode Outlook (USD Billion, 2018-2032)

    • Cloud
    • On-Premise

    Virtual Sensors End User Outlook (USD Billion, 2018-2032)

    • Electronics
    • Automotive & Transportation
    • Manufacturing & Utilities
    • Healthcare
    • Oil & Gas
    • Aerospace & Defense
    • Others

    Virtual Sensors Regional Outlook (USD Billion, 2018-2032)

    • North America Outlook (USD Billion, 2018-2032)

      • North America Virtual Sensors by Component
        • Solution
        • Services
      • North America Virtual Sensors by Deployment Mode
        • Cloud
        • On-Premise
      • North America Virtual Sensors by End User
        • Electronics
        • Automotive & Transportation
        • Manufacturing & Utilities
        • Healthcare
        • Oil & Gas
        • Aerospace & Defense
        • Others
      • US Outlook (USD Billion, 2018-2032)

      • US Virtual Sensors by Component
        • Solution
        • Services
      • US Virtual Sensors Deployment Mode

        • Cloud
        • On-Premise
      • US Virtual Sensors by End User
        • Electronics
        • Automotive & Transportation
        • Manufacturing & Utilities
        • Healthcare
        • Oil & Gas
        • Aerospace & Defense
        • Others
      • CANADA Outlook (USD Billion, 2018-2032)

      • CANADA Virtual Sensors by Component
        • Solution
        • Services
      • CANADA Virtual Sensors by Deployment Mode
        • Cloud
        • On-Premise
      • CANADA Virtual Sensors by End User
        • Electronics
        • Automotive & Transportation
        • Manufacturing & Utilities
        • Healthcare
        • Oil & Gas
        • Aerospace & Defense
        • Others
    • Europe Outlook (USD Billion, 2018-2032)

      • Europe Virtual Sensors by Component
        • Solution
        • Services
      • Europe Virtual Sensors by Deployment Mode
        • Cloud
        • On-Premise
      • Europe Virtual Sensors by End User
        • Electronics
        • Automotive & Transportation
        • Manufacturing & Utilities
        • Healthcare
        • Oil & Gas
        • Aerospace & Defense
        • Others
      • Germany Outlook (USD Billion, 2018-2032)

      • Germany Virtual Sensors by Component
        • Solution
        • Services
      • Germany Virtual Sensors by Deployment Mode
        • Cloud
        • On-Premise
      • Germany Virtual Sensors by End User
        • Electronics
        • Automotive & Transportation
        • Manufacturing & Utilities
        • Healthcare
        • Oil & Gas
        • Aerospace & Defense
        • Others
      • France Outlook (USD Billion, 2018-2032)

      • France Virtual Sensors by Component
        • Solution
        • Services
      • France Virtual Sensors by Deployment Mode
        • Cloud
        • On-Premise
      • France Virtual Sensors by End User
        • Electronics
        • Automotive & Transportation
        • Manufacturing & Utilities
        • Healthcare
        • Oil & Gas
        • Aerospace & Defense
        • Others
      • UK Outlook (USD Billion, 2018-2032)

      • UK Virtual Sensors by Component
        • Solution
        • Services
      • UK Virtual Sensors by Deployment Mode
        • Cloud
        • On-Premise
      • UK Virtual Sensors by End User
        • Electronics
        • Automotive & Transportation
        • Manufacturing & Utilities
        • Healthcare
        • Oil & Gas
        • Aerospace & Defense
        • Others
      • Italy Outlook (USD Billion, 2018-2032)

      • Italy Virtual Sensors by Component

        • Solution
        • Services
      • Italy Virtual Sensors by Deployment Mode
        • Cloud
        • On-Premise
      • Italy Virtual Sensors by End User
        • Electronics
        • Automotive & Transportation
        • Manufacturing & Utilities
        • Healthcare
        • Oil & Gas
        • Aerospace & Defense
        • Others
      • SPAIN Outlook (USD Billion, 2018-2032)

      • Spain Virtual Sensors by Component
        • Solution
        • Services
        • Others
      • Spain Virtual Sensors by Deployment Mode
        • Cloud
        • On-Premise
      • Spain Virtual Sensors by End User
        • Electronics
        • Automotive & Transportation
        • Manufacturing & Utilities
        • Healthcare
        • Oil & Gas
        • Aerospace & Defense
        • Others
      • Rest Of Europe Outlook (USD Billion, 2018-2032)

      • Rest Of Europe Virtual Sensors by Component
        • Solution
        • Services
      • REST OF EUROPE Virtual Sensors by Deployment Mode
        • Cloud
        • On-Premise
      • REST OF EUROPE Virtual Sensors by End User
        • Electronics
        • Automotive & Transportation
        • Manufacturing & Utilities
        • Healthcare
        • Oil & Gas
        • Aerospace & Defense
        • Others
    • Asia-Pacific Outlook (USD Billion, 2018-2032)

      • Asia-Pacific Virtual Sensors by Component
        • Solution
        • Services
      • Asia-Pacific Virtual Sensors by Deployment Mode
        • Cloud
        • On-Premise
      • Asia-Pacific Virtual Sensors by End User
        • Electronics
        • Automotive & Transportation
        • Manufacturing & Utilities
        • Healthcare
        • Oil & Gas
        • Aerospace & Defense
        • Others
    • China Outlook (USD Billion, 2018-2032)

      • China Virtual Sensors by Component
        • Solution
        • Services
      • China Virtual Sensors by Deployment Mode
        • Cloud
        • On-Premise
      • China Virtual Sensors by End User
        • Electronics
        • Automotive & Transportation
        • Manufacturing & Utilities
        • Healthcare
        • Oil & Gas
        • Aerospace & Defense
        • Others
      • Japan Outlook (USD Billion, 2018-2032)

      • Japan Virtual Sensors by Component
        • Solution
        • Services
      • Japan Virtual Sensors by Deployment Mode
        • Cloud
        • On-Premise
      • Japan Virtual Sensors by End User
        • Electronics
        • Automotive & Transportation
        • Manufacturing & Utilities
        • Healthcare
        • Oil & Gas
        • Aerospace & Defense
        • Others
      • India Outlook (USD Billion, 2018-2032)

      • India Virtual Sensors by Component
        • Solution
        • Services
      • India Virtual Sensors by Deployment Mode
        • Cloud
        • On-Premise
      • India Virtual Sensors by End User
        • Electronics
        • Automotive & Transportation
        • Manufacturing & Utilities
        • Healthcare
        • Oil & Gas
        • Aerospace & Defense
        • Others
      • Australia Outlook (USD Billion, 2018-2032)

      • Australia Virtual Sensors by Component
        • Solution
        • Services
      • Australia Virtual Sensors by Deployment Mode
        • Cloud
        • On-Premise
      • Australia Virtual Sensors by End User
        • Electronics
        • Automotive & Transportation
        • Manufacturing & Utilities
        • Healthcare
        • Oil & Gas
        • Aerospace & Defense
        • Others
      • Rest of Asia-Pacific Outlook (USD Billion, 2018-2032)

      • Rest of Asia-Pacific Virtual Sensors by Component
        • Solution
        • Services
      • Rest of Asia-Pacific Virtual Sensors by Deployment Mode
        • Cloud
        • On-Premise
      • Rest of Asia-Pacific Virtual Sensors by End User
        • Electronics
        • Automotive & Transportation
        • Manufacturing & Utilities
        • Healthcare
        • Oil & Gas
        • Aerospace & Defense
        • Others
    • Rest of the World Outlook (USD Billion, 2018-2032)

      • Rest of the World Virtual Sensors by Component
        • Solution
        • Services
      • Rest of the World Virtual Sensors by Deployment Mode
        • Cloud
        • On-Premise
      • Rest of the World Virtual Sensors by End User
        • Electronics
        • Automotive & Transportation
        • Manufacturing & Utilities
        • Healthcare
        • Oil & Gas
        • Aerospace & Defense
        • Others
      • Middle East Outlook (USD Billion, 2018-2032)

      • Middle East Virtual Sensors by Component
        • Solution
        • Services
      • Middle East Virtual Sensors by Deployment Mode
        • Cloud
        • On-Premise
      • Middle East Virtual Sensors by End User
        • Electronics
        • Automotive & Transportation
        • Manufacturing & Utilities
        • Healthcare
        • Oil & Gas
        • Aerospace & Defense
        • Others
      • Africa Outlook (USD Billion, 2018-2032)

      • Africa Virtual Sensors by Component
        • Solution
        • Services
      • Africa Virtual Sensors by Deployment Mode
        • Cloud
        • On-Premise
      • Africa Virtual Sensors by End User

        • Electronics
        • Automotive & Transportation
        • Manufacturing & Utilities
        • Healthcare
        • Oil & Gas
        • Aerospace & Defense
        • Others
      • Latin America Outlook (USD Billion, 2018-2032)

      • Latin America Virtual Sensors by Component
        • Solution
        • Services
      • Latin America Virtual Sensors by Deployment Mode
        • Cloud
        • On-Premise
      • Latin America Virtual Sensors by End User
        • Electronics
        • Automotive & Transportation
        • Manufacturing & Utilities
        • Healthcare
        • Oil & Gas
        • Aerospace & Defense
        • Others
    Infographic

    Free Sample Request

    Kindly complete the form below to receive a free sample of this Report

    Get Free Sample

    Customer Strories

    “I am very pleased with how market segments have been defined in a relevant way for my purposes (such as "Portable Freezers & refrigerators" and "last-mile"). In general the report is well structured. Thanks very much for your efforts.”

    Victoria Milne

    Founder
    Case Study
    Chemicals and Materials