


Virtual Reality Size
Market Size Snapshot
| Year | Value |
|---|---|
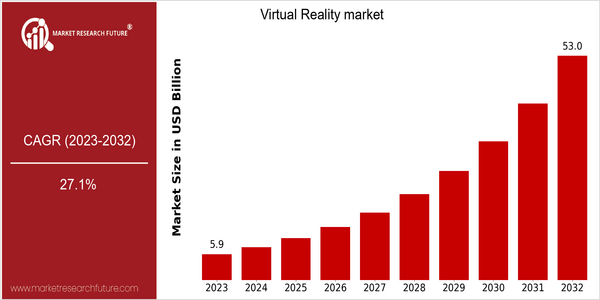
| 2023 | USD 5.91 Billion |
| 2032 | USD 53.01 Billion |
| CAGR (2024-2032) | 27.1 % |
Note – Market size depicts the revenue generated over the financial year
The virtual reality market is expected to grow significantly in the coming years, with the current valuation of $ 5.91 billion in 2023 expected to reach $ 53.01 billion by 2032. This growth is reflected in a CAGR of 27.1% from 2024 to 2032, indicating a steady upward trend, driven by the increasing use of virtual reality in various industries. It is the demand for virtual reality gaming, education, medical simulations and training that is driving this growth. Further, the development of virtual reality technology, such as improved hardware, better graphics and more accessible development tools, will further drive the growth of the market. The leading players in the virtual reality market, such as Meta Platforms Inc., Sony Corp. and HTC Corp., are actively investing in developing new solutions and forming strategic alliances to enhance their market presence. The investment in the Metaverse and the development of social experiences is an example of the strategic orientation of the leading companies in the industry. The collaboration between technology companies and educational institutions will lead to the development of virtual reality applications that will further broaden the market. In the long run, the virtual reality market is expected to experience an unprecedented boom, which will have a major impact on how consumers and businesses interact with digital content.
Regional Market Size
Regional Deep Dive
The Virtual Reality market is growing rapidly in various regions, driven by technological developments, increased use in entertainment and gaming, and a proliferation of applications in industries such as education, health care, and real estate. Each region has its own characteristics, which are influenced by the culture, economic conditions, and regulations. The Virtual Reality market is expected to continue to grow in the next few years, as companies continue to invest in innovation and governments support digital transformation.
Europe
- Europe is seeing a rise in VR adoption in the education sector, with initiatives like the European Commission's 'Digital Education Action Plan' promoting the use of immersive technologies in classrooms to enhance learning experiences.
- Companies such as Varjo and Improbable are pushing the boundaries of VR technology in the gaming and simulation industries, indicating a strong focus on high-fidelity experiences that cater to both entertainment and professional training.
Asia Pacific
- In the Asia-Pacific region, China and Japan are leading the way, where local companies such as HTC and Sony are innovating to meet local tastes.
- The government of South Korea has established a favorable policy environment for virtual reality, and it has invested in virtual reality companies and content, which is expected to help the development of the market.
Latin America
- Latin America is experiencing a growing interest in VR for entertainment and cultural experiences, with local companies developing VR content that reflects regional heritage and storytelling, thus enhancing cultural engagement.
- The Brazilian government has initiated programs to support the development of VR technologies, aiming to boost the local tech ecosystem and encourage innovation in various sectors, including gaming and education.
North America
- The United States is the center of the world in the field of medical virtual reality. There are many companies in the field, such as Oculus Health and AppliedVR, which develop a variety of virtual reality treatments for pain management and rehabilitation.
- Virtual reality has been the subject of much study and experimentation. Major companies like Meta and Google have been investing heavily in the development of hardware and software, which are improving the user experience, especially in the field of games and social interactivity.
Middle East And Africa
- In the Middle East, the VR market is gaining traction in tourism and real estate, with projects like the Dubai VR Park showcasing how immersive experiences can enhance visitor engagement and property marketing.
- The African continent is beginning to explore VR for educational purposes, with organizations like the African Virtual Reality Association promoting the use of VR in schools to improve access to quality education and training.
Did You Know?
“Did you know that VR technology is being used in therapy to treat PTSD, with studies showing that immersive environments can help patients confront and process traumatic memories more effectively?” — American Psychological Association
Segmental Market Size
The virtual reality (VR) market is the most dynamic segment of the market, a result of growing demand for immersion. There are several reasons for this: technological advances in hardware, such as improved head-mounted displays and motion-tracking, as well as an increase in content for games, education and training. And the rise in remote working and virtual collaboration has also fuelled interest in virtual reality. Currently, the market for virtual reality is moving from the trial phase to full-scale implementation, with Meta and HTC leading the way in the consumer and enterprise markets. Several countries in North America and Asia-Pacific are at the forefront of this implementation. The main use cases are gaming, medical and military training simulations, and education platforms that enrich learning experiences. Growth will be driven by macro-economic factors, such as digital transformation and the drive for new remote working and collaboration solutions. 5G and artificial intelligence will help to create a more seamless and more interconnected experience.
Future Outlook
From 2023 to 2032, the virtual reality market is expected to grow at a CAGR of 27.1%. The high growth rate is attributed to the increasing use of virtual reality in the gaming, education, health and real estate industries. By 2032, the penetration of virtual reality is expected to reach about 30% of the world population, mainly due to the development of the hardware industry, the development of software and the creation of virtual reality content. By the end of the forecast period, there will be an estimated one billion active virtual reality users worldwide. And with the advent of 5G, the speed of data transmission and the low latency of the network, the virtual reality experience will be further enhanced. Artificial intelligence and machine learning will also be combined with virtual reality applications, which will enable users to have a more personal experience and further increase the popularity of virtual reality. The report also pointed out that social platforms and remote collaboration and training will be the key trends in the future. Virtual reality has the potential to boost employee productivity and engagement, and as a result, the investment in virtual reality is expected to increase significantly.


Leave a Comment