• Cat-intel
  • MedIntelliX
  • Resources
  • About Us
  • Hero Background
    English
    Chinese
    French
    Japanese
    Korean
    German
    Spanish

    Transient Ischemic Attack Market Trends

    ID: MRFR/Pharma/3590-CR
    226 Pages
    Rahul Gotadki
    July 2019

    Transient Ischemic Attack Market Research Report Information by Diagnosis (Imaging Techniques), Treatment (Surgery and Drugs), Age Groups (0–18 years and above), End-User and Region (Americas, Europe, Asia-Pacific and the Middle East & Africa) - Forecast till 2035

    Share:
    Download PDF ×

    We do not share your information with anyone. However, we may send you emails based on your report interest from time to time. You may contact us at any time to opt-out.

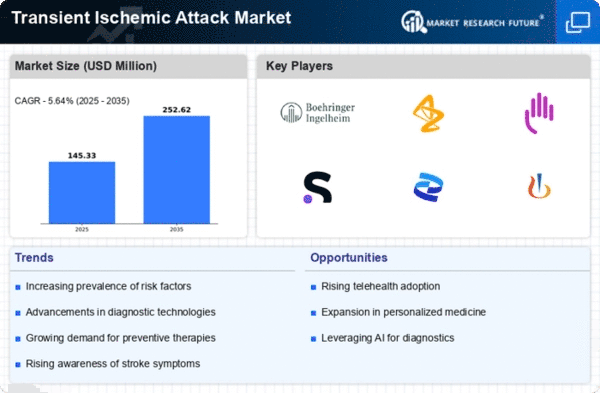
    Transient Ischemic Attack Market Infographic
    $ 4,950.0
    $ 5,950.0
    $ 7,250.0

    Market Trends

    Key Emerging Trends in the Transient Ischemic Attack Market

    The transient ischemic attack (TIA) market is undergoing significant changes due to various factors impacting diagnosis, treatment, and prevention of this condition. One of the prominent trends in the TIA market is the increasing awareness and recognition of TIAs among healthcare professionals and the general population. As awareness campaigns and educational initiatives raise understanding about TIAs and their potential consequences, more individuals are seeking medical attention for symptoms suggestive of TIA, leading to earlier diagnosis and intervention.

    Furthermore, advancements in medical technology and diagnostic tools are reshaping the landscape of TIA diagnosis and management. Improved imaging techniques such as magnetic resonance imaging (MRI) and computed tomography (CT) scans enable healthcare providers to accurately identify TIAs and distinguish them from other conditions with similar symptoms. Additionally, the development of point-of-care diagnostic tests allows for rapid assessment of patients suspected of experiencing a TIA, facilitating timely decision-making regarding treatment and management.

    Another significant trend in the TIA market is the emphasis on secondary prevention strategies to reduce the risk of recurrent strokes or TIAs. As healthcare providers recognize the high risk of subsequent cerebrovascular events following a TIA, there is increasing focus on aggressive management of modifiable risk factors such as hypertension, diabetes, hyperlipidemia, and atrial fibrillation. This includes the widespread use of antithrombotic medications, statins, antihypertensive drugs, and lifestyle modifications to prevent further episodes and improve long-term outcomes for patients with TIAs.

    Moreover, the TIA market is witnessing a shift towards personalized medicine approaches tailored to individual patient characteristics and risk profiles. With advances in genetics and molecular biology, researchers are exploring biomarkers and genetic markers associated with an increased risk of TIAs and stroke. This allows for more targeted interventions and precision medicine strategies aimed at optimizing treatment efficacy and minimizing adverse effects. Additionally, the integration of artificial intelligence and machine learning algorithms into clinical decision-making processes holds promise for identifying high-risk individuals and predicting outcomes following a TIA.

    Furthermore, telemedicine and remote monitoring technologies are playing an increasingly important role in the management of patients with TIAs, particularly in the post-acute phase. Telehealth platforms enable healthcare providers to conduct virtual consultations, monitor patients' symptoms remotely, and adjust treatment plans as needed. This not only enhances access to care, especially for individuals in rural or underserved areas but also facilitates ongoing communication between patients and healthcare providers, leading to improved adherence to treatment regimens and better outcomes.

    Additionally, regulatory changes and healthcare policies are influencing the TIA market, particularly in terms of reimbursement policies and guidelines for stroke prevention and management. As healthcare systems strive to optimize resource utilization and improve quality of care, there is growing emphasis on evidence-based practices and adherence to clinical guidelines for the management of TIAs. This includes initiatives to standardize care protocols, enhance interdisciplinary collaboration among healthcare providers, and implement quality improvement measures to ensure consistent and effective management of TIAs across different healthcare settings.

    Market Summary

    The Global Transient Ischemic Attack Market is projected to grow from 0.12 USD Billion in 2024 to 0.38 USD Billion by 2035.

    Key Market Trends & Highlights

    Transient Ischemic Attack Key Trends and Highlights

    • The market is expected to experience a compound annual growth rate (CAGR) of 11.0% from 2025 to 2035.
    • By 2035, the market valuation is anticipated to reach 0.38 USD Billion, indicating robust growth potential.
    • In 2024, the market is valued at 0.12 USD Billion, reflecting the current demand for TIA management solutions.
    • Growing adoption of advanced diagnostic technologies due to increasing awareness of transient ischemic attacks is a major market driver.

    Market Size & Forecast

    2024 Market Size 0.12 (USD Billion)
    2035 Market Size 0.38 (USD Billion)
    CAGR (2025-2035) 11.0%
    Largest Regional Market Share in 2024 latin_america)

    Major Players

    Koninklijke Philips NV (Netherlands), Stryker Corporation (US), Johnson & Johnson Services Inc (US), Boston Scientific Corporation (US), Sanofi (France), Bayer AG (Germany), Pfizer Inc (US), Siemens AG (US), F. Hoffmann-La Roche AG (Switzerland), GE Healthcare (UK), Penumbra Inc (California), Medtronic PLC (Ireland), Abbott Laboratories (US), Merck & Co., Inc (US), Boehringer Ingelheim GmbH (Germany)

    Market Trends

    The increasing prevalence of transient ischemic attacks underscores the urgent need for enhanced preventive strategies and effective treatment options to mitigate long-term neurological damage.

    Centers for Disease Control and Prevention (CDC)

    Transient Ischemic Attack Market Market Drivers

    Aging Population

    The demographic shift towards an aging population is a crucial factor driving the Global Transient Ischemic Attack Market Industry. As individuals age, the risk of cerebrovascular diseases, including TIAs, escalates. The United Nations projects that by 2030, the global population aged 60 years and older will reach 1.4 billion, creating a larger cohort susceptible to TIAs. This demographic trend necessitates enhanced healthcare services and interventions tailored to older adults, thereby fostering market expansion. The increasing burden of TIAs among the elderly population underscores the importance of developing targeted therapies and preventive measures.

    Rising Incidence of Stroke

    The increasing prevalence of stroke globally is a pivotal driver for the Global Transient Ischemic Attack Market Industry. As per recent health statistics, stroke remains one of the leading causes of morbidity and mortality worldwide. The World Health Organization indicates that approximately 15 million people suffer from stroke annually, with a significant portion experiencing transient ischemic attacks as precursors. This alarming trend underscores the necessity for enhanced diagnostic and therapeutic interventions, thereby propelling market growth. The Global Transient Ischemic Attack Market is projected to reach 0.12 USD Billion in 2024, reflecting the urgent need for effective management strategies.

    Market Trends and Projections

    The Global Transient Ischemic Attack Market Industry is witnessing notable trends that indicate a robust growth trajectory. Projections suggest that the market will expand from 0.12 USD Billion in 2024 to 0.38 USD Billion by 2035, reflecting a compound annual growth rate of 11.0% from 2025 to 2035. This growth is driven by various factors, including advancements in medical technology, increased awareness, and an aging population. The market dynamics are influenced by the evolving healthcare landscape, necessitating continuous adaptation by stakeholders to meet the demands of TIA management.

    Regulatory Support and Funding

    Government initiatives and regulatory support play a vital role in shaping the Global Transient Ischemic Attack Market Industry. Various health authorities are implementing policies aimed at improving stroke care and funding research for innovative treatments. For example, the National Institutes of Health in the United States allocates substantial resources to stroke research, which indirectly benefits TIA management. Such funding encourages the development of new therapies and technologies, thereby enhancing patient care. This supportive regulatory environment is expected to facilitate market growth, as stakeholders are more inclined to invest in TIA-related innovations.

    Increased Awareness and Education

    Growing awareness regarding transient ischemic attacks and their implications is significantly influencing the Global Transient Ischemic Attack Market Industry. Public health campaigns and educational initiatives by health organizations aim to inform individuals about the symptoms and risks associated with TIAs. This heightened awareness encourages early medical intervention, which is essential for preventing subsequent strokes. As a result, healthcare systems are increasingly prioritizing TIA management, leading to a surge in demand for related services and products. The market is expected to experience a compound annual growth rate of 11.0% from 2025 to 2035, driven by these educational efforts.

    Advancements in Medical Technology

    Technological innovations in medical devices and diagnostic tools are transforming the landscape of the Global Transient Ischemic Attack Market Industry. The advent of portable imaging technologies and telemedicine solutions facilitates timely diagnosis and treatment, which is crucial for TIA patients. For instance, advanced MRI techniques enable rapid identification of ischemic episodes, thereby improving patient outcomes. Furthermore, the integration of artificial intelligence in predictive analytics is enhancing risk stratification for TIA patients. These advancements not only improve clinical efficacy but also contribute to the anticipated market growth, with projections indicating a rise to 0.38 USD Billion by 2035.

    Market Segment Insights

    Regional Insights

    Key Companies in the Transient Ischemic Attack Market market include

    Industry Developments

    Future Outlook

    Transient Ischemic Attack Market Future Outlook

    The Global Transient Ischemic Attack Market is projected to grow at an 11.0% CAGR from 2024 to 2035, driven by advancements in diagnostics, increasing awareness, and enhanced treatment options.

    New opportunities lie in:

    • Develop AI-driven diagnostic tools to improve early detection of TIAs.
    • Invest in telehealth solutions for remote monitoring and patient management.
    • Create targeted therapies focusing on high-risk populations to enhance treatment efficacy.

    By 2035, the market is expected to achieve substantial growth, reflecting advancements in treatment and increased patient engagement.

    Market Segmentation

    Market Segmentation

    Transient Ischemic Attack Market, by Region
    • Americas
    • North America
    • US
    • Canada
    • Latin America
    • Europe
    • Western Europe
    • Germany
    • UK
    • France
    • Italy
    • Spain
    • Rest of Western Europe
    • Eastern Europe
    • Asia-Pacific
    • China
    • Japan
    • India
    • Australia
    • South Korea
    • Rest of Asia-Pacific
    • Middle East & Africa
    • Middle East
    • Africa
    Transient Ischemic Attack Market, by End-User
    • Hospitals & Clinics
    • Diagnostic Centers
    • Research Laboratories
    Transient Ischemic Attack Market, by Diagnosis
    • Imaging Techniques
    • Computed Tomography (CT) scan
    • Carotid Duplex Scanning
    • Magnetic Resonance Imaging
    • Echocardiography            
    Transient Ischemic Attack Market, by Treatment
    • Surgery
    • Drugs
    • Antithrombotic agents
    • Antiplatelets
    • Clopidogrel
    • Aspirin
    • Heparins
    • ENOXAPARIN
    • DALTEPARIN
    • Fibrinolytics
    • Tenecteplase
    Transient Ischemic Attack Market, by Age Groups
    • 0–18 years
    • 19–40 years (Millennial)
    • 41–60 years
    • 60+ years

    Report Scope

    Attribute/Metric Details
    Market Size 2030  USD 0.29 Billion 2032
    Compound Annual Growth Rate (CAGR) 9.34% 2032
    Base Year 2021
    Market Forecast Period 2024-2032
    Historical Data 2018 - 2021
    Market Forecast Units Value (USD Million)
    Report Coverage Revenue Forecast, Competitive Landscape, Growth Factors, and Trends
    Segments Covered Product, technology, application, and end-users.
    Geographies Covered Americas, Europe, Asia Pacific and the Middle East and Africa
    Countries Covered China, Japan, India, Australia, South Korea, Australia, Rest of Asia-Pacific
    Key Companies Profiled Koninklijke Philips NV (Netherlands), Stryker Corporation (US), Johnson & Johnson Services Inc (US), Boston Scientific Corporation (US), Sanofi (France), Bayer AG (Germany), Pfizer Inc (US), Siemens AG (US), F. Hoffmann-La Roche AG (Switzerland), GE Healthcare (UK), Penumbra Inc (California), Medtronic PLC (Ireland), Abbott Laboratories (US), Merck & Co., Inc (US), and Boehringer Ingelheim GmbH (Germany).
    Key Market Opportunities Key market opportunities for the Transient Ischemic Attack market include the development of advanced diagnostic tools, innovative treatment options, and personalized medicine approaches to improve early detection and patient outcomes.
    Key Market Dynamics   The key market dynamics for the transient ischemic attack (TIA) market include increasing incidence rates, advances in diagnostic and therapeutic technologies, growing awareness and early intervention, and substantial investment in research and development.

    Market Highlights

    Author

    Rahul Gotadki
    Assistant Manager

    She holds an experience of about 6+ years in market research and business consulting, working under the spectrum of information communication technology, telecommunications and semiconductor domains. aarti conceptualizes and implements a scalable business strategy and provides strategic leadership to the clients. her expertise lies in market estimation, competitive intelligence, pipeline analysis, customer assessment, etc.

    Leave a Comment

    Latest Comments

    John Doe
    john@example.com

    This is a great article! Really helped me understand the topic better.

    Posted on July 23, 2025, 10:15 AM
    Jane Smith
    jane@domain.com

    Thanks for sharing this. I’ve bookmarked it for later reference.

    Posted on July 22, 2025, 7:45 PM

    FAQs

    At what CAGR is the global transient ischemic attack market projected to grow in the forecast period (2024-2032)?

    Transient ischemic attack market projected to grow at approximately 9.24% CAGR during the assessment period (2024-2032).

    How much is the global transient ischemic attack market worth in the future?

    The valuation of the global transient ischemic attack market is estimated to increase to USD 0.29 Billion by the end of 2032.

    What are the major tailwinds pushing the growth of the global transient ischemic attack market?

    Rising need for better treatment due to the increasing prevalence of neurological disorders and increasing R&D investments in biotechnology and pharmaceutical sectors are major tailwinds pushing the growth of the global transient ischemic attack market.

    Which region holds the largest share in the global transient ischemic attack market?

    North America holds the largest share in the global transient ischemic attack market, followed by Europe and the Asia Pacific, respectively.

    Who are the top players in the global transient ischemic attack market?

    EnteroMedics Inc. (U.S.), ElectroCore Medical LLC (U.S.), LivaNova PLC (U.K), Cyberonics, Inc. (US), NeuroMetrix, Inc.(U.S.), Boston Scientific Corporation (US), Inspire Medical Systems Inc.(U.S.), Electrical Geodesics Inc. (U.S.), ImThera Medical (U.S.), Nihon Kohden Corporation (Japan), Esaote (Italy), Masimo Corporation (U.S.), and Hologic (U.S.), are some of the top players operating in the global transient ischemic attack market.

    1. Report Prologue
    2. Executive Summary
    3. Market Introduction
      1. Definition 26
      2. Scope Of Study
      3. 26
      4. List Of Assumptions 26
      5. Market Structure 27
    4. Research Methodology
      1. Research Process 29
      2. Primary
      3. Research 30
      4. Secondary Research 31
      5. Market Size Estimation
      6. 32
      7. Forecast Model 32
    5. Market Dynamics
      1. 5.1
      2. Introduction 34
      3. Drivers 35
        1. Increasing Preference
        2. Rising Prevalence Of Chronic
        3. Improvement In Reimbursement Scenario 37
        4. Rising Geriatric Population 38
      4. For Minimally Invasive Procedures 35
      5. Disorders 36
      6. Restraints 39
        1. Lack Of Skilled Physicians
      7. 5.3.1
      8. Rising Treatment Cost And Hospital Stay 39
      9. 40
      10. Opportunities 41
        1. New Advancements In Catheterization
        2. Guide Wire Assisted Surgery In Elderly Population 41
      11. Devices 41
      12. Mega Trends 41
        1. Telemedicine 41
      13. Macroeconomic
      14. Indicators 41
      15. Technology Trends & Assessment 42
      16. 6
      17. Market Factor Analysis
      18. Porter’s Five Forces Model 44
        1. Threat Of New Entrants 44
        2. Bargaining Power Of Suppliers
        3. Threat Of Substitutes 45
        4. Bargaining Power Of
        5. Intensity Of Rivalry 45
      19. 44
      20. Buyers 45
      21. Supply Chain Analysis
        1. Research &Development 46
        2. Manufacturing
        3. Distribution 46
        4. Marketing & Sales 47
        5. Post-Sales Monitoring 47
      22. 46
      23. 46
      24. Demand & Supply: Gap Analysis
      25. 47
      26. Pricing Analysis 47
      27. Investment Feasibility Analysis
      28. 47
    6. Global Transient Ischemic Attack Market, By Diagnosis
      1. 7.1
      2. Introduction 49
      3. Imaging Techniques 49
        1. Computed Tomography
        2. Carotid Duplex Scanning 51
        3. Magnetic
        4. Echocardiography 52
      4. (CT) Scan 51
      5. Resonance Imaging 52
    7. Global Transient
    8. Ischemic Attack Market, By Treatment
      1. Introduction 54
      2. 8.2
      3. Surgery 54
      4. Drugs 54
        1. Surgery 55
      5. 8.3.2
      6. Drugs 56
      7. 56
      8. 8.3.2.5
      9. Heparins 57
      10. 8.3.2.10
      11. Alteplase 59
      12. 8.3.2.12
      13. Prazosin 60
    9. Global Transient Ischemic
    10. Attack Market, By Age Groups
      1. Introduction 62
      2. 0–18
      3. Years 62
      4. 19–40 Years (Millennial) 62
      5. 41–60
      6. Years 62
      7. 60+ Years 63
        1. 0-18 Years 64
        2. 41-60 Years 65
        3. 60+ Years 65
      8. 9.5.2
      9. 19-40 Years 65
    11. Global Transient Ischemic Attack Market, By End-User
      1. 10.1
      2. Introduction 67
      3. Hospitals & Clinics 67
      4. Diagnostic
      5. Centers 67
      6. Research Laboratories 68
        1. Hospitals
        2. Diagnostic Centers 70
        3. Research Laboratories
      7. 69
      8. 70
    12. Global Transient Ischemic Attack Market, By Region
      1. 11.1
      2. Introduction 72
      3. Americas 73
        1. North America 78
        2. South America
      4. 90
      5. Europe 94
        1. Western Europe
        2. Eastern Europe 127
        3. Asia Pacific 132
        4. Japan 136
        5. China 140
        6. India 144
        7. Australia
        8. Republic Of Korea 152
        9. Rest Of Asia Pacific
      6. 99
      7. 11.3.1.3
      8. U.K. 111
      9. 11.3.1.6
      10. Rest Of Western Europe 123
      11. 11.4
      12. Asia Pacific 131
      13. 148
      14. 156
      15. The Middle East & Africa 160
        1. Middle East
        2. United Arab Emirates 164
        3. Saudi
        4. Rest Of Middle East & Africa 172
      16. And Africa 161
      17. Arabia 168
      18. 12
      19. Competitive Landscape
      20. Company Market Share Analysis 177
        1. Introduction 177
      21. Company Share Analysis 178
      22. 12.3
      23. Recent Developments, 2013–2018 179
    13. Company Profiles
      1. Koninklijke Philips N.V. 184
        1. Company Overview 184
        2. Financial Overview 184
        3. Products Offering 185
        4. Key Developments 185
        5. SWOT Analysis 185
      2. 13.1.6
      3. Key Strategy 186
      4. Stryker Corporation 187
        1. Company
        2. Financial Overview 187
        3. Products
        4. Key Developments 188
        5. SWOT Analysis
        6. Key Strategy 189
      5. Overview 187
      6. Offering 188
      7. 189
      8. Johnson & Johnson Services
        1. Company Overview 190
        2. Financial Overview
        3. Products Offering 191
        4. Key Developments 191
        5. SWOT Analysis 192
        6. Key Strategy 192
        7. Company Overview 193
        8. Financial Overview 193
        9. Products Offering 194
        10. Key Developments 195
        11. SWOT Analysis 195
      9. Inc. 190
      10. 190
      11. 13.4
      12. Boston Scientific Corporation 193
      13. 13.4.6
      14. Key Strategy 195
      15. Sanofi 196
        1. Company Overview 196
        2. Financial Overview 196
        3. Products Offering 197
        4. Key Developments 197
        5. SWOT Analysis 197
        6. Key Strategy 197
      16. Bayer AG 198
        1. Company
        2. Financial Overview 198
        3. Products
        4. Key Developments 199
        5. SWOT Analysis
        6. Key Strategy 199
      17. Overview 198
      18. Offering 199
      19. 199
      20. Pfizer Inc. 200
        1. Company Overview 200
        2. Financial Overview 200
        3. Products Offering 201
        4. Key Developments 201
        5. Key Strategy 201
      21. 13.7.5
      22. SWOT Analysis 201
      23. Siemens AG
        1. Company Overview 202
        2. Financial Overview
        3. Products Offering 203
        4. Key Developments 203
        5. SWOT Analysis 203
        6. Key Strategy 203
        7. Company Overview 204
        8. Products Offering 205
        9. SWOT Analysis 205
        10. Key Strategy
      24. 202
      25. 202
      26. 13.9
      27. F. Hoffmann-La Roche AG 204
      28. 13.9.2
      29. Financial Overview 204
      30. 13.9.4
      31. Key Developments 205
      32. 205
      33. GE Healthcare 206
        1. Company Overview 206
        2. Financial Overview 206
        3. Products Offering 207
        4. Key Developments 207
        5. SWOT Analysis 207
        6. Key Strategy 207
      34. Penumbra, Inc. 208
        1. Financial Overview 208
        2. Key Developments 209
        3. Key Strategy 210
      35. 13.11.1
      36. Company Overview 208
      37. 13.11.3
      38. Products Offering 209
      39. 13.11.5
      40. SWOT Analysis 209
      41. Medtronic
        1. Company Overview 211
        2. Financial Overview
        3. Products Offering 212
        4. Key Developments
        5. SWOT Analysis 212
        6. Key Strategy 213
      42. PLC 211
      43. 211
      44. 212
      45. Abbott Laboratories 214
        1. Company Overview 214
        2. Financial Overview 214
        3. Products Offering 215
        4. Key Developments 215
        5. SWOT Analysis 216
        6. Key Strategy 216
      46. Merck & Co., Inc. 217
        1. Financial Overview 217
        2. Key Developments 218
        3. Key Strategy 218
      47. 13.14.1
      48. Company Overview 217
      49. 13.14.3
      50. Products Offering 218
      51. 13.14.5
      52. SWOT Analysis 218
      53. Boehringer
        1. Company Overview 219
        2. Financial
        3. Products Offering 220
        4. Key Developments
        5. SWOT Analysis 220
        6. Key Strategy 220
      54. Ingelheim GmbH 219
      55. Overview 219
      56. 220
    14. Conclusion
      1. Key Findings 222
        1. CEO’s
        2. Unmet Needs 222
        3. Key Companies
        4. Prediction 222
      2. Viewpoint 222
      3. To Watch 222
    15. Appendix
      1. 15.1
      2. Discussion Blue Print 224
      3. References 225
    16. List Of Tables
    17. MARKET SYNOPSIS 24
    18. LIST OF ASSUMPTIONS 26
    19. PRIMARY INTERVIEWS 30
    20. GLOBAL TRANSIENT ISCHEMIC
    21. ATTACK MARKET, BY DIAGNOSIS, 2020–2027 (USD MILLION) 50
      1. TABLE 5
    22. GLOBAL TRANSIENT ISCHEMIC ATTACK MARKET FOR DIAGNOSIS, BY IMAGING TECHNIQUES, 2020–2027
      1. (USD MILLION) 50
    23. GLOBAL TRANSIENT ISCHEMIC ATTACK MARKET FOR
      1. IMAGING TECHNIQUES, BY COMPUTED TOMOGRAPHY (CT) SCAN,
      2. (USD MILLION) 51
    24. GLOBAL TRANSIENT ISCHEMIC ATTACK MARKET FOR
      1. IMAGING TECHNIQUES, BY CAROTID DUPLEX SCANNING,
      2. MILLION) 51
    25. GLOBAL TRANSIENT ISCHEMIC ATTACK MARKET FOR IMAGING
      1. TECHNIQUES, BY MAGNETIC RESONANCE IMAGING,
      2. 52
    26. GLOBAL TRANSIENT ISCHEMIC ATTACK MARKET FOR IMAGING TECHNIQUES,
      1. BY ECHOCARDIOGRAPHY,
      2. TABLE
    27. GLOBAL TRANSIENT ISCHEMIC ATTACK MARKET, BY TREATMENT, 2020–2027 (USD MILLION)
      1. 55
    28. GLOBAL TRANSIENT ISCHEMIC ATTACK MARKET FOR TREATMENT, BY
      1. SURGERY, 2020–2027 (USD MILLION) 55
    29. GLOBAL TRANSIENT ISCHEMIC
    30. ATTACK MARKET FOR TREATMENT, BY DRUGS, 2020–2027 (USD MILLION) 56
    31. GLOBAL TRANSIENT ISCHEMIC ATTACK MARKET FOR DRUG, BY ANTITHROMBOTIC AGENTS,
    32. GLOBAL TRANSIENT ISCHEMIC ATTACK
    33. MARKET FOR ANTITHROMBOTIC AGENTS, BY ANTIPLATELETS,
      1. MILLION) 56
    34. GLOBAL TRANSIENT ISCHEMIC ATTACK MARKET FOR ANTIPLATELETS,
      1. BY CLOPIDOGREL, 2020–2027 (USD MILLION) 57
    35. GLOBAL TRANSIENT
    36. ISCHEMIC ATTACK MARKET FOR ANTIPLATELETS, BY ASPIRIN, 2020–2027 (USD MILLION)
      1. 57
    37. GLOBAL TRANSIENT ISCHEMIC ATTACK MARKET FOR ANTITHROMBOTIC
      1. AGENTS, BY HEPARINS, 2020–2027 (USD MILLION) 57
    38. GLOBAL
    39. TRANSIENT ISCHEMIC ATTACK MARKET FOR HEPARINS, BY ENOXAPARIN, 2020–2027 (USD
      1. MILLION) 58
    40. GLOBAL TRANSIENT ISCHEMIC ATTACK MARKET FOR HEPARINS,
      1. BY DALTEPARIN, 2020–2027 (USD MILLION) 58
    41. GLOBAL TRANSIENT
    42. ISCHEMIC ATTACK MARKET FOR ANTITHROMBOTIC AGENTS, BY FIBRINOLYTICS,
      1. (USD MILLION) 58
    43. GLOBAL TRANSIENT ISCHEMIC ATTACK MARKET FOR
      1. FIBRINOLYTICS, BY TENECTEPLASE, 2020–2027 (USD MILLION) 59
      2. TABLE
    44. GLOBAL TRANSIENT ISCHEMIC ATTACK MARKET FOR FIBRINOLYTICS, BY ALTEPLASE 2020–2027
      1. (USD MILLION) 59
    45. GLOBAL TRANSIENT ISCHEMIC ATTACK MARKET FOR
      1. DRUGS, BY ANTIHYPERTENSIVE AGENTS, 2020–2027 (USD MILLION) 59
      2. TABLE
    46. GLOBAL TRANSIENT ISCHEMIC ATTACK MARKET FOR ANTIHYPERTENSIVE AGENTS, BY PRAZOSIN,
    47. GLOBAL TRANSIENT ISCHEMIC
    48. ATTACK MARKET FOR ANTIHYPERTENSIVE AGENTS, BY MOXONIDINE,
      1. (USD MILLION) 60
    49. GLOBAL TRANSIENT ISCHEMIC ATTACK MARKET, BY
      1. AGE GROUPS, 2020–2027 (USD MILLION) 63
    50. GLOBAL TRANSIENT
    51. ISCHEMIC ATTACK MARKET FOR AGE GROUP, BY 0-18 YEARS, 2020–2027 (USD MILLION)
      1. 64
    52. GLOBAL TRANSIENT ISCHEMIC ATTACK MARKET FOR AGE GROUP, BY
      1. 19-40 YEARS, 2020–2027 (USD MILLION) 65
    53. GLOBAL TRANSIENT
    54. ISCHEMIC ATTACK MARKET FOR AGE GROUP, BY 41-60 YEARS, 2020–2027 (USD MILLION)
      1. 65
    55. GLOBAL TRANSIENT ISCHEMIC ATTACK MARKET FOR AGE GROUP, BY
      1. 60+ YEARS, 2020–2027 (USD MILLION) 65
    56. GLOBAL TRANSIENT
    57. ISCHEMIC ATTACK MARKET, BY END-USER, 2020–2027 (USD MILLION) 68
      1. TABLE
    58. GLOBAL TRANSIENT ISCHEMIC ATTACK MARKET FOR HOSPITALS, BY REGION, 2020–2027
      1. (USD MILLION) 69
    59. GLOBAL TRANSIENT ISCHEMIC ATTACK MARKET FOR
      1. DIAGNOSTIC CENTERS, BY REGION, 2020–2027 (USD MILLION) 70
      2. TABLE
    60. GLOBAL TRANSIENT ISCHEMIC ATTACK MARKET FOR RESEARCH LABORATORIES, BY REGION,
    61. GLOBAL TRANSIENT ISCHEMIC ATTACK
    62. MARKET, BY REGION, 2020–2027 (USD MILLION) 72
    63. AMERICAS
    64. TRANSIENT ISCHEMIC ATTACK MARKET, BY REGION, 2020–2027 (USD MILLION) 73
    65. AMERICAS TRANSIENT ISCHEMIC ATTACK MARKET, BY DIAGNOSIS, 2020–2027
      1. (USD MILLION) 74
    66. AMERICAS TRANSIENT ISCHEMIC ATTACK MARKET FOR
      1. DIAGNOSIS, BY IMAGING TECHNIQUE, 2020–2027 (USD MILLION) 74
      2. TABLE
    67. AMERICAS TRANSIENT ISCHEMIC ATTACK MARKET BY TREATMENT,, 2020–2027 (USD
      1. MILLION) 74
    68. AMERICAS TRANSIENT ISCHEMIC ATTACK MARKET FOR TREATMENT,
      1. BY DRUGS, 2020–2027 (USD MILLION) 75
    69. AMERICAS TRANSIENT
    70. ISCHEMIC ATTACK MARKET FOR DRUGS, BY ANTITHROMBOTIC AGENTS, 2020–2027 (USD
      1. MILLION) 75
    71. AMERICAS TRANSIENT ISCHEMIC ATTACK MARKET FOR ANTITHROMBOTIC
      1. AGENTS, BY ANTIPLATELETS,
      2. TABLE
    72. AMERICAS TRANSIENT ISCHEMIC ATTACK MARKET FOR ANTITHROMBOTIC AGENTS, BY HEPARINS,
    73. AMERICAS TRANSIENT
    74. ISCHEMIC ATTACK MARKET FOR ANTITHROMBOTIC AGENTS, BY FIBRINOLYTICS,
      1. (USD MILLION) 76
    75. AMERICAS TRANSIENT ISCHEMIC ATTACK MARKET FOR
      1. DRUGS, BY ANTIHYPERTENSIVE AGENTS, 2020–2027 (USD MILLION) 76
      2. TABLE
    76. AMERICAS TRANSIENT ISCHEMIC ATTACK MARKET, BY AGE GROUP, 2020–2027 (USD
      1. MILLION) 77
    77. AMERICAS TRANSIENT ISCHEMIC ATTACK MARKET, BY END-USER,
    78. NORTH AMERICA: TRANSIENT ISCHEMIC
    79. ATTACK MARKET, BY COUNTRY, 2020-2027 (USD MILLION) 78
    80. NORTH
    81. AMERICA TRANSIENT ISCHEMIC ATTACK MARKET, BY DIAGNOSIS, 2020–2027 (USD MILLION)
      1. 78
    82. NORTH AMERICA TRANSIENT ISCHEMIC ATTACK MARKET FOR DIAGNOSIS,
      1. BY IMAGING TECHNIQUE,
      2. TABLE
    83. NORTH AMERICA TRANSIENT ISCHEMIC ATTACK MARKET BY TREATMENT, 2020–2027
      1. (USD MILLION) 79
    84. NORTH AMERICA TRANSIENT ISCHEMIC ATTACK MARKET
      1. FOR TREATMENT, BY DRUGS, 2020–2027 (USD MILLION) 79
    85. NORTH
    86. AMERICA TRANSIENT ISCHEMIC ATTACK MARKET FOR DRUGS, BY ANTITHROMBOTIC AGENTS,
    87. NORTH AMERICA TRANSIENT
    88. ISCHEMIC ATTACK MARKET FOR ANTITHROMBOTIC AGENTS, BY ANTIPLATELETS,
      1. (USD MILLION) 80
    89. NORTH AMERICA TRANSIENT ISCHEMIC ATTACK MARKET
      1. FOR ANTITHROMBOTIC AGENTS, BY HEPARINS,
      2. 80
    90. NORTH AMERICA TRANSIENT ISCHEMIC ATTACK MARKET FOR ANTITHROMBOTIC
      1. AGENTS, BY FIBRINOLYTICS,
      2. TABLE
    91. NORTH AMERICA TRANSIENT ISCHEMIC ATTACK MARKET FOR DRUGS, BY ANTIHYPERTENSIVE
      1. AGENTS,
    92. NORTH AMERICA
    93. TRANSIENT ISCHEMIC ATTACK MARKET, BY AGE GROUP, 2020–2027 (USD MILLION) 81
    94. NORTH AMERICA TRANSIENT ISCHEMIC ATTACK MARKET, BY END-USER, 2020–2027
      1. (USD MILLION) 82
    95. U.S. TRANSIENT ISCHEMIC ATTACK MARKET, BY DIAGNOSIS,
    96. U.S. TRANSIENT ISCHEMIC ATTACK
    97. MARKET FOR DIAGNOSIS, BY IMAGING TECHNIQUE, 2020–2027 (USD MILLION) 82
    98. U.S. TRANSIENT ISCHEMIC ATTACK MARKET BY TREATMENT,, 2020–2027
      1. (USD MILLION) 83
    99. U.S. TRANSIENT ISCHEMIC ATTACK MARKET FOR TREATMENT,
      1. BY DRUGS, 2020–2027 (USD MILLION) 83
    100. U.S. TRANSIENT ISCHEMIC
    101. ATTACK MARKET FOR DRUGS, BY ANTITHROMBOTIC AGENTS 2020–2027 (USD MILLION)
      1. 83
    102. U.S. TRANSIENT ISCHEMIC ATTACK MARKET FOR ANTITHROMBOTIC
      1. AGENTS, BY ANTIPLATELETS,
      2. TABLE
    103. U.S. TRANSIENT ISCHEMIC ATTACK MARKET FOR ANTITHROMBOTIC AGENTS, BY HEPARINS,
    104. U.S. TRANSIENT ISCHEMIC ATTACK
    105. MARKET FOR ANTITHROMBOTIC AGENTS, BY FIBRINOLYTICS,
      1. MILLION) 84
    106. U.S. TRANSIENT ISCHEMIC ATTACK MARKET FOR DRUGS,
      1. BY ANTIHYPERTENSIVE AGENTS, 2020–2027 (USD MILLION) 85
      2. TABLE 69
    107. U.S. TRANSIENT ISCHEMIC ATTACK MARKET, BY AGE GROUP, 2020–2027 (USD MILLION)
      1. 85
    108. U.S. TRANSIENT ISCHEMIC ATTACK MARKET, BY END-USER, 2020–2027
      1. (USD MILLION) 85
    109. CANADA TRANSIENT ISCHEMIC ATTACK MARKET, BY
      1. DIAGNOSIS, 2020–2027 (USD MILLION) 86
    110. CANADA TRANSIENT
    111. ISCHEMIC ATTACK MARKET FOR DIAGNOSIS, BY IMAGING TECHNIQUE, 2020–2027 (USD
      1. MILLION) 86
    112. CANADA TRANSIENT ISCHEMIC ATTACK MARKET BY TREATMENT,,
    113. CANADA TRANSIENT ISCHEMIC ATTACK
    114. MARKET FOR TREATMENT, BY DRUGS, 2020–2027 (USD MILLION) 87
      1. TABLE
    115. CANADA TRANSIENT ISCHEMIC ATTACK MARKET FOR DRUGS, BY ANTITHROMBOTIC AGENTS,
    116. CANADA TRANSIENT ISCHEMIC ATTACK
    117. MARKET FOR ANTITHROMBOTIC AGENTS, BY ANTIPLATELETS,
      1. MILLION) 87
    118. CANADA TRANSIENT ISCHEMIC ATTACK MARKET FOR ANTITHROMBOTIC
      1. AGENTS, BY HEPARINS, 2020–2027 (USD MILLION) 88
    119. CANADA
    120. TRANSIENT ISCHEMIC ATTACK MARKET FOR ANTITHROMBOTIC AGENTS, BY FIBRINOLYTICS,
    121. CANADA TRANSIENT ISCHEMIC
    122. ATTACK MARKET FOR DRUGS, BY ANTIHYPERTENSIVE AGENTS, 2020–2027 (USD MILLION)
      1. 88
    123. CANADA TRANSIENT ISCHEMIC ATTACK MARKET, BY AGE GROUP, 2020–2027
      1. (USD MILLION) 89
    124. CANADA TRANSIENT ISCHEMIC ATTACK MARKET, BY
      1. END-USER, 2020–2027 (USD MILLION) 89
    125. SOUTH AMERICA TRANSIENT
    126. ISCHEMIC ATTACK MARKET, BY DIAGNOSIS, 2020–2027 (USD MILLION) 90
    127. SOUTH AMERICA TRANSIENT ISCHEMIC ATTACK MARKET FOR DIAGNOSIS, BY IMAGING
      1. TECHNIQUE,
    128. SOUTH
      1. AMERICA TRANSIENT ISCHEMIC ATTACK MARKET BY TREATMENT, 2020–2027 (USD MILLION)
      2. 90
    129. SOUTH AMERICA TRANSIENT ISCHEMIC ATTACK MARKET FOR TREATMENT,
      1. BY DRUGS, 2020–2027 (USD MILLION) 91
    130. SOUTH AMERICA TRANSIENT
    131. ISCHEMIC ATTACK MARKET FOR DRUGS, BY ANTITHROMBOTIC AGENTS,
      1. (USD MILLION) 91
    132. SOUTH AMERICA TRANSIENT ISCHEMIC ATTACK MARKET
      1. FOR ANTITHROMBOTIC AGENTS, BY ANTIPLATELETS,
      2. 91
    133. SOUTH AMERICA TRANSIENT ISCHEMIC ATTACK MARKET FOR ANTITHROMBOTIC
      1. AGENTS, BY HEPARINS,
      2. TABLE
    134. SOUTH AMERICA TRANSIENT ISCHEMIC ATTACK MARKET FOR ANTITHROMBOTIC AGENTS, BY
      1. FIBRINOLYTICS,
    135. SOUTH
    136. AMERICA TRANSIENT ISCHEMIC ATTACK MARKET FOR DRUGS, BY ANTIHYPERTENSIVE AGENTS,
    137. SOUTH AMERICA TRANSIENT
    138. ISCHEMIC ATTACK MARKET, BY AGE GROUP, 2020–2027 (USD MILLION) 93
    139. SOUTH AMERICA TRANSIENT ISCHEMIC ATTACK MARKET, BY END-USER, 2020–2027
      1. (USD MILLION) 93
    140. EUROPE TRANSIENT ISCHEMIC ATTACK MARKET, BY
      1. COUNTRY, 2020–2027 (USD MILLION) 94
    141. EUROPE TRANSIENT ISCHEMIC
    142. ATTACK MARKET, BY DIAGNOSIS, 2020–2027 (USD MILLION) 95
      1. TABLE 95
    143. EUROPE TRANSIENT ISCHEMIC ATTACK MARKET FOR DIAGNOSIS, BY IMAGING TECHNIQUE, 2020–2027
      1. (USD MILLION) 95
    144. EUROPE TRANSIENT ISCHEMIC ATTACK MARKET BY
      1. TREATMENT,, 2020–2027 (USD MILLION) 95
    145. EUROPE TRANSIENT
    146. ISCHEMIC ATTACK MARKET FOR TREATMENT, BY DRUGS, 2020–2027 (USD MILLION) 96
    147. EUROPE TRANSIENT ISCHEMIC ATTACK MARKET FOR DRUGS, BY ANTITHROMBOTIC
      1. AGENTS, 2020–2027 (USD MILLION) 96
    148. EUROPE TRANSIENT ISCHEMIC
    149. ATTACK MARKET FOR ANTITHROMBOTIC AGENTS, BY ANTIPLATELETS,
      1. (USD MILLION) 96
    150. EUROPE TRANSIENT ISCHEMIC ATTACK MARKET FOR
      1. ANTITHROMBOTIC AGENTS, BY HEPARINS, 2020–2027 (USD MILLION) 97
      2. TABLE
    151. EUROPE TRANSIENT ISCHEMIC ATTACK MARKET FOR ANTITHROMBOTIC AGENTS, BY FIBRINOLYTICS,
    152. EUROPE TRANSIENT ISCHEMIC
    153. ATTACK MARKET FOR DRUGS, BY ANTIHYPERTENSIVE AGENTS, 2020–2027 (USD MILLION)
      1. 97
    154. EUROPE TRANSIENT ISCHEMIC ATTACK MARKET, BY AGE GROUP, 2020–2027
      1. (USD MILLION) 98
    155. EUROPE TRANSIENT ISCHEMIC ATTACK MARKET, BY
      1. END-USER, 2020–2027 (USD MILLION) 98
    156. WESTERN EUROPE TRANSIENT
    157. ISCHEMIC ATTACK MARKET, BY DIAGNOSIS, 2020–2027 (USD MILLION) 99
    158. WESTERN EUROPE TRANSIENT ISCHEMIC ATTACK MARKET FOR DIAGNOSIS, BY IMAGING
      1. TECHNIQUE,
    159. WESTERN
      1. EUROPE TRANSIENT ISCHEMIC ATTACK MARKET BY TREATMENT, 2020–2027 (USD MILLION)
      2. 99
    160. WESTERN EUROPE TRANSIENT ISCHEMIC ATTACK MARKET FOR TREATMENT,
      1. BY DRUGS, 2020–2027 (USD MILLION) 100
    161. WESTERN EUROPE
    162. TRANSIENT ISCHEMIC ATTACK MARKET FOR DRUGS, BY ANTITHROMBOTIC AGENTS,
      1. (USD MILLION) 100
    163. WESTERN EUROPE TRANSIENT ISCHEMIC ATTACK
    164. MARKET FOR ANTITHROMBOTIC AGENTS, BY ANTIPLATELETS,
      1. MILLION) 100
    165. WESTERN EUROPE TRANSIENT ISCHEMIC ATTACK MARKET
      1. FOR ANTITHROMBOTIC AGENTS, BY HEPARINS,
      2. 101
    166. WESTERN EUROPE TRANSIENT ISCHEMIC ATTACK MARKET FOR ANTITHROMBOTIC
      1. AGENTS, BY FIBRINOLYTICS,
    167. WESTERN EUROPE TRANSIENT ISCHEMIC ATTACK MARKET FOR DRUGS, BY ANTIHYPERTENSIVE
      1. AGENTS,
    168. WESTERN
    169. EUROPE TRANSIENT ISCHEMIC ATTACK MARKET, BY AGE GROUP, 2020–2027 (USD MILLION)
      1. 102
    170. WESTERN EUROPE TRANSIENT ISCHEMIC ATTACK MARKET, BY END-USER,
    171. GERMANY TRANSIENT ISCHEMIC
    172. ATTACK MARKET, BY DIAGNOSIS, 2020–2027 (USD MILLION) 103
      1. TABLE
    173. GERMANY TRANSIENT ISCHEMIC ATTACK MARKET FOR DIAGNOSIS, BY IMAGING TECHNIQUE,
    174. GERMANY TRANSIENT ISCHEMIC
      1. ATTACK MARKET BY TREATMENT, 2020–2027 (USD MILLION) 103
      2. TABLE 119
    175. GERMANY TRANSIENT ISCHEMIC ATTACK MARKET FOR TREATMENT, BY DRUGS, 2020–2027
      1. (USD MILLION) 104
    176. GERMANY TRANSIENT ISCHEMIC ATTACK MARKET
      1. FOR DRUGS, BY ANTITHROMBOTIC AGENTS, 2020–2027 (USD MILLION) 104
    177. GERMANY TRANSIENT ISCHEMIC ATTACK MARKET FOR ANTITHROMBOTIC AGENTS,
      1. BY ANTIPLATELETS,
      2. TABLE
    178. GERMANY TRANSIENT ISCHEMIC ATTACK MARKET FOR ANTITHROMBOTIC AGENTS, BY HEPARINS,
    179. GERMANY TRANSIENT
    180. ISCHEMIC ATTACK MARKET FOR ANTITHROMBOTIC AGENTS, BY FIBRINOLYTICS,
      1. (USD MILLION) 105
    181. GERMANY TRANSIENT ISCHEMIC ATTACK MARKET
      1. FOR DRUGS, BY ANTIHYPERTENSIVE AGENTS, 2020–2027 (USD MILLION) 105
    182. GERMANY TRANSIENT ISCHEMIC ATTACK MARKET, BY AGE GROUP, 2020–2027
      1. (USD MILLION) 106
    183. GERMANY TRANSIENT ISCHEMIC ATTACK MARKET,
      1. BY END-USER, 2020–2027 (USD MILLION) 106
    184. FRANCE TRANSIENT
    185. ISCHEMIC ATTACK MARKET, BY DIAGNOSIS, 2020–2027 (USD MILLION) 107
    186. FRANCE TRANSIENT ISCHEMIC ATTACK MARKET FOR DIAGNOSIS, BY IMAGING TECHNIQUE,
    187. FRANCE TRANSIENT ISCHEMIC
      1. ATTACK MARKET BY TREATMENT, 2020–2027 (USD MILLION) 107
      2. TABLE 130
    188. FRANCE TRANSIENT ISCHEMIC ATTACK MARKET FOR TREATMENT, BY DRUGS, 2020–2027
      1. (USD MILLION) 108
    189. FRANCE TRANSIENT ISCHEMIC ATTACK MARKET FOR
      1. DRUGS, BY ANTITHROMBOTIC AGENTS, 2020–2027 (USD MILLION) 108
      2. TABLE
    190. FRANCE TRANSIENT ISCHEMIC ATTACK MARKET FOR ANTITHROMBOTIC AGENTS, BY ANTIPLATELETS,
    191. FRANCE TRANSIENT
    192. ISCHEMIC ATTACK MARKET FOR ANTITHROMBOTIC AGENTS, BY HEPARINS, 2020–2027 (USD
      1. MILLION) 109
    193. FRANCE TRANSIENT ISCHEMIC ATTACK MARKET FOR ANTITHROMBOTIC
      1. AGENTS, BY FIBRINOLYTICS,
    194. FRANCE TRANSIENT ISCHEMIC ATTACK MARKET FOR DRUGS, BY ANTIHYPERTENSIVE
      1. AGENTS, 2020–2027 (USD MILLION) 109
    195. FRANCE TRANSIENT
    196. ISCHEMIC ATTACK MARKET, BY AGE GROUP, 2020–2027 (USD MILLION) 110
    197. FRANCE TRANSIENT ISCHEMIC ATTACK MARKET, BY END-USER, 2020–2027
      1. (USD MILLION) 110
    198. U.K TRANSIENT ISCHEMIC ATTACK MARKET, BY
      1. DIAGNOSIS, 2020–2027 (USD MILLION) 111
    199. U.K TRANSIENT
    200. ISCHEMIC ATTACK MARKET FOR DIAGNOSIS, BY IMAGING TECHNIQUE, 2020–2027 (USD
      1. MILLION) 111
    201. U.K TRANSIENT ISCHEMIC ATTACK MARKET BY TREATMENT,,
    202. U.K TRANSIENT ISCHEMIC ATTACK
    203. MARKET FOR TREATMENT, BY DRUGS, 2020–2027 (USD MILLION) 112
      1. TABLE
    204. U.K TRANSIENT ISCHEMIC ATTACK MARKET FOR DRUGS, BY ANTITHROMBOTIC AGENTS, 2020–2027
      1. (USD MILLION) 112
    205. U.K TRANSIENT ISCHEMIC ATTACK MARKET FOR
      1. ANTITHROMBOTIC AGENTS, BY ANTIPLATELETS, 2020–2027 (USD MILLION) 112
    206. U.K TRANSIENT ISCHEMIC ATTACK MARKET FOR ANTITHROMBOTIC AGENTS, BY HEPARINS,
    207. U.K TRANSIENT ISCHEMIC ATTACK
    208. MARKET FOR ANTITHROMBOTIC AGENTS, BY FIBRINOLYTICS, 2020–2027 (USD MILLION)
      1. 113
    209. U.K TRANSIENT ISCHEMIC ATTACK MARKET FOR DRUGS, BY ANTIHYPERTENSIVE
      1. AGENTS, 2020–2027 (USD MILLION) 113
    210. U.K TRANSIENT ISCHEMIC
    211. ATTACK MARKET, BY AGE GROUP, 2020–2027 (USD MILLION) 114
      1. TABLE
    212. U.K TRANSIENT ISCHEMIC ATTACK MARKET, BY END-USER, 2020–2027 (USD MILLION)
      1. 114
    213. ITALY TRANSIENT ISCHEMIC ATTACK MARKET, BY DIAGNOSIS, 2020–2027
      1. (USD MILLION) 115
    214. ITALY TRANSIENT ISCHEMIC ATTACK MARKET FOR
      1. DIAGNOSIS, BY IMAGING TECHNIQUE, 2020–2027 (USD MILLION) 115
      2. TABLE
    215. ITALY TRANSIENT ISCHEMIC ATTACK MARKET BY TREATMENT, 2020–2027 (USD MILLION)
      1. 115
    216. ITALY TRANSIENT ISCHEMIC ATTACK MARKET FOR TREATMENT, BY
      1. DRUGS, 2020–2027 (USD MILLION) 116
    217. ITALY TRANSIENT ISCHEMIC
    218. ATTACK MARKET FOR DRUGS, BY ANTITHROMBOTIC AGENTS 2020–2027 (USD MILLION)
      1. 116
    219. ITALY TRANSIENT ISCHEMIC ATTACK MARKET FOR ANTITHROMBOTIC
      1. AGENTS, BY ANTIPLATELETS,
    220. ITALY TRANSIENT ISCHEMIC ATTACK MARKET FOR ANTITHROMBOTIC AGENTS, BY
      1. HEPARINS, 2020–2027 (USD MILLION) 117
    221. ITALY TRANSIENT
    222. ISCHEMIC ATTACK MARKET FOR ANTITHROMBOTIC AGENTS, BY FIBRINOLYTICS,
      1. (USD MILLION) 117
    223. ITALY TRANSIENT ISCHEMIC ATTACK MARKET FOR
      1. DRUGS, BY ANTIHYPERTENSIVE AGENTS, 2020–2027 (USD MILLION) 117
      2. TABLE
    224. ITALY TRANSIENT ISCHEMIC ATTACK MARKET, BY AGE GROUP, 2020–2027 (USD MILLION)
      1. 118
    225. ITALY TRANSIENT ISCHEMIC ATTACK MARKET, BY END-USER, 2020–2027
      1. (USD MILLION) 118
    226. SPAIN TRANSIENT ISCHEMIC ATTACK MARKET, BY
      1. DIAGNOSIS, 2020–2027 (USD MILLION) 119
    227. SPAIN TRANSIENT
    228. ISCHEMIC ATTACK MARKET FOR DIAGNOSIS, BY IMAGING TECHNIQUE, 2020–2027 (USD
      1. MILLION) 119
    229. SPAIN TRANSIENT ISCHEMIC ATTACK MARKET BY TREATMENT,,
    230. SPAIN TRANSIENT ISCHEMIC
    231. ATTACK MARKET FOR TREATMENT, BY DRUGS, 2020–2027 (USD MILLION) 120
    232. SPAIN TRANSIENT ISCHEMIC ATTACK MARKET FOR DRUGS, BY ANTITHROMBOTIC
      1. AGENTS, 2020–2027 (USD MILLION) 120
    233. SPAIN TRANSIENT ISCHEMIC
    234. ATTACK MARKET FOR ANTITHROMBOTIC AGENTS, BY ANTIPLATELETS,
      1. (USD MILLION) 120
    235. SPAIN TRANSIENT ISCHEMIC ATTACK MARKET FOR
      1. ANTITHROMBOTIC AGENTS, BY HEPARINS, 2020–2027 (USD MILLION) 121
      2. TABLE
    236. SPAIN TRANSIENT ISCHEMIC ATTACK MARKET FOR ANTITHROMBOTIC AGENTS, BY FIBRINOLYTICS,
    237. SPAIN TRANSIENT ISCHEMIC
    238. ATTACK MARKET FOR DRUGS, BY ANTIHYPERTENSIVE AGENTS, 2020–2027 (USD MILLION)
      1. 121
    239. SPAIN TRANSIENT ISCHEMIC ATTACK MARKET, BY AGE GROUP, 2020–2027
      1. (USD MILLION) 122
    240. SPAIN TRANSIENT ISCHEMIC ATTACK MARKET, BY
      1. END-USER, 2020–2027 (USD MILLION) 122
    241. REST OF WESTERN
    242. EUROPE TRANSIENT ISCHEMIC ATTACK MARKET, BY DIAGNOSIS, 2020–2027 (USD MILLION)
      1. 123
    243. REST OF WESTERN EUROPE TRANSIENT ISCHEMIC ATTACK MARKET
      1. FOR DIAGNOSIS, BY IMAGING TECHNIQUE,
    244. REST OF WESTERN EUROPE TRANSIENT ISCHEMIC ATTACK MARKET BY TREATMENT,
    245. REST OF WESTERN EUROPE TRANSIENT
    246. ISCHEMIC ATTACK MARKET FOR TREATMENT, BY DRUGS, 2020–2027 (USD MILLION) 124
    247. REST OF WESTERN EUROPE TRANSIENT ISCHEMIC ATTACK MARKET FOR DRUGS,
      1. BY ANTITHROMBOTIC AGENTS,
    248. REST OF WESTERN EUROPE TRANSIENT ISCHEMIC ATTACK MARKET FOR ANTITHROMBOTIC
      1. AGENTS, BY ANTIPLATELETS,
    249. REST OF WESTERN EUROPE TRANSIENT ISCHEMIC ATTACK MARKET FOR ANTITHROMBOTIC
      1. AGENTS, BY HEPARINS,
      2. TABLE
    250. REST OF WESTERN EUROPE TRANSIENT ISCHEMIC ATTACK MARKET FOR ANTITHROMBOTIC AGENTS,
      1. BY FIBRINOLYTICS,
      2. TABLE
    251. REST OF WESTERN EUROPE TRANSIENT ISCHEMIC ATTACK MARKET FOR DRUGS, BY ANTIHYPERTENSIVE
      1. AGENTS,
    252. REST OF
    253. WESTERN EUROPE TRANSIENT ISCHEMIC ATTACK MARKET, BY AGE GROUP, 2020–2027 (USD
      1. MILLION) 126
    254. REST OF WESTERN EUROPE TRANSIENT ISCHEMIC ATTACK
    255. MARKET, BY END-USER, 2020–2027 (USD MILLION) 126
    256. EASTERN
    257. EUROPE TRANSIENT ISCHEMIC ATTACK MARKET, BY DIAGNOSIS, 2020–2027 (USD MILLION)
      1. 127
    258. EASTERN EUROPE TRANSIENT ISCHEMIC ATTACK MARKET FOR DIAGNOSIS,
      1. BY IMAGING TECHNIQUE,
      2. TABLE
    259. EASTERN EUROPE TRANSIENT ISCHE

    Transient Ischemic Attack Market Segmentation

    Market Segmentation Overview

    • Detailed segmentation data will be available in the full report
    • Comprehensive analysis by multiple parameters
    • Regional and country-level breakdowns
    • Market size forecasts by segment
    Infographic

    Free Sample Request

    Kindly complete the form below to receive a free sample of this Report

    Get Free Sample

    Customer Strories

    “I am very pleased with how market segments have been defined in a relevant way for my purposes (such as "Portable Freezers & refrigerators" and "last-mile"). In general the report is well structured. Thanks very much for your efforts.”

    Victoria Milne

    Founder
    Case Study
    Chemicals and Materials