• Cat-intel
  • MedIntelliX
  • Resources
  • About Us
  • Request Free Sample ×

    Kindly complete the form below to receive a free sample of this Report

    Leading companies partner with us for data-driven Insights

    clients tt-cursor

    Telecom Billing Revenue Management Market

    ID: MRFR/ICT/8968-HCR
    100 Pages
    Aarti Dhapte
    September 2025

    Telecom Billing & Revenue Management Market Research Report: Information By Component (Solution, and Services), By Operator Type (Mobile Operators And Internet Service Providers, and Satellite Communication Providers And Cable Network Providers), By Deployment Mode (Cloud, and On-Premise), And By Region (North America, Europe, Asia-Pacific, And Rest Of The World) –Market Forecast Till 2032.

    Share:
    Download PDF ×

    We do not share your information with anyone. However, we may send you emails based on your report interest from time to time. You may contact us at any time to opt-out.

    Telecom Billing & Revenue Management Market Research Report – Forecast till 2032 Infographic
    Purchase Options
    $ 4,950.0
    $ 5,950.0
    $ 7,250.0
    Table of Contents

    Telecom Billing Revenue Management Market Summary

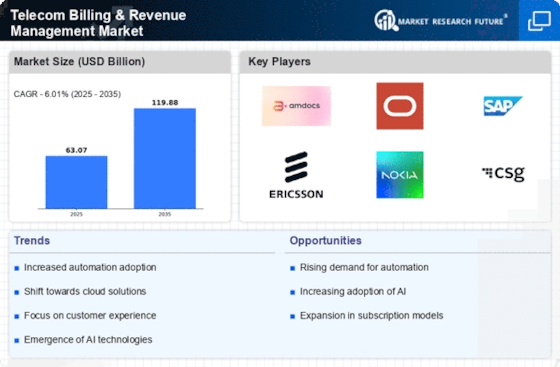
    As per Market Research Future Analysis, the Telecom Billing & Revenue Management Market is set to grow from USD 63.07 billion in 2024 to USD 100.63 billion by 2032, reflecting a CAGR of 6.01% from 2024 to 2032. The market was valued at USD 59 billion in 2023, driven by the expanding telecom industry and increasing cellular subscriptions. Key players are investing in R&D to enhance product offerings and address challenges such as network congestion and service quality decline.

    Key Market Trends & Highlights

    The growth of the telecom industry significantly influences the market dynamics.

    • Market size in 2024: USD 63.07 billion; projected to reach USD 100.63 billion by 2032.
    • CAGR during forecast period: 6.01%; driven by increased telecom services and subscriber growth.
    • Mobile operators and internet service providers dominate the market; expected to see the highest CAGR.
    • On-premises deployment mode leads the market; favored by telecom operators for cost efficiency.

    Market Size & Forecast

    2023 Market Size USD 59 Billion
    2024 Market Size USD 63.07 Billion
    2032 Market Size USD 100.63 Billion
    CAGR 6.01%

    Major Players

    Key companies include Emida, Commerx, Huawei Technologies Co. Ltd., CSG Systems International Inc., Sterlite Technologies Limited, Comarch SA, Optiva Inc., Oracle, and SAP SE.

    Telecom Billing Revenue Management Market Trends

    Growing telecom industry is driving the market growth

    Market CAGR for telecom billing & revenue management is being driven by the growing telecom industry. The process of managing telecom billing and revenue includes management of debt collection as well as communication services. The procedure involves calculating billing and charging information, managing the customer's payments and invoices, and providing information on data utilisation. These solutions are frequently utilised by telecom service providers and digital service providers to improve their operational effectiveness by telecom network optimisation.

    During the projection period, it is predicted that the expansion of the telecom industry would play a significant role in driving demand for telecom billing and revenue management solutions and services. The deployment of advanced services, a growing client base, and the expanding telecom industry have put a strain on the network charging methods now in place.

    Additionally, both telecom operators and consumers confront difficulties due to the ongoing and rapid growth of mobile and internet subscribers, a decline in service quality, network congestion, and a falloff in services. Telecom corporations are putting money into telecom billing and revenue management services to offset these disadvantages. The market's growth is anticipated to be further expedited by the growing importance of determining the profitability and value that a customer brings to the business as well as organizations’ growing preference for unified workflows and automated payment processing solutions for detecting and mitigating revenue leakages.

    Furthermore, with cutting-edge telecom billing and revenue management capabilities, communication service providers must modernize their systems to offer innovative, flexible solutions and services that improve customer satisfaction while being more cost-effective. As CSPs strive to increase customer loyalty and value, the role of telecom billing and revenue management is becoming increasingly crucial. Thus, driving the Telecom Billing & Revenue Management market revenue.

    The ongoing evolution of digital services and the increasing complexity of billing systems necessitate robust revenue management strategies to ensure sustainable growth in the telecom sector.

    Federal Communications Commission (FCC)

    Telecom Billing Revenue Management Market Drivers

    Market Growth Projections

    The Global Telecom Billing and Revenue Management Market Industry is projected to experience substantial growth, with estimates indicating a market size of 119.9 USD Billion by 2035. This growth trajectory reflects the increasing complexity of billing processes as telecom services diversify and consumer expectations evolve. The anticipated CAGR of 6.01% from 2025 to 2035 suggests that the industry will continue to adapt to technological advancements and changing market dynamics. Operators are likely to invest in innovative billing solutions to remain competitive, ensuring they can effectively manage revenue streams and enhance operational efficiency.

    Emergence of 5G Technology

    The rollout of 5G technology is poised to significantly impact the Global Telecom Billing and Revenue Management Market Industry. With the introduction of faster data speeds and lower latency, telecom operators are presented with new revenue opportunities through innovative services such as IoT and enhanced mobile broadband. As 5G adoption accelerates, billing systems must evolve to accommodate complex pricing models and real-time data usage tracking. This evolution is likely to drive market growth, as operators seek to capitalize on the anticipated increase in data consumption and service diversification, further solidifying their competitive position in the market.

    Adoption of Cloud-Based Solutions

    The shift towards cloud-based billing solutions is transforming the Global Telecom Billing and Revenue Management Market Industry. Cloud technology offers scalability, flexibility, and cost-effectiveness, allowing telecom operators to manage billing processes more efficiently. As organizations migrate to the cloud, they can reduce infrastructure costs and improve service delivery. This trend is expected to contribute to the market's growth, with a projected CAGR of 6.01% from 2025 to 2035. By leveraging cloud-based solutions, telecom companies can enhance their ability to analyze customer data, optimize pricing strategies, and ultimately drive revenue growth.

    Regulatory Compliance and Standards

    Regulatory compliance remains a critical driver within the Global Telecom Billing and Revenue Management Market Industry. Governments worldwide are implementing stringent regulations to protect consumer rights and ensure fair billing practices. Compliance with these regulations necessitates robust billing systems that can adapt to changing legal requirements. For instance, telecom operators must ensure transparency in pricing and billing processes, which can lead to increased operational costs. However, the investment in compliant billing systems is likely to yield long-term benefits, as it enhances customer trust and loyalty, ultimately contributing to revenue growth in the sector.

    Increasing Demand for Digital Services

    The Global Telecom Billing and Revenue Management Market Industry is experiencing a surge in demand for digital services, driven by the proliferation of smartphones and high-speed internet. As consumers increasingly rely on mobile applications and digital content, telecom operators are compelled to enhance their billing systems to accommodate diverse service offerings. This shift is reflected in the projected market size of 63.1 USD Billion in 2024, as companies invest in advanced billing solutions to streamline operations and improve customer satisfaction. The integration of digital payment methods further supports this trend, enabling operators to capture revenue from a broader range of services.

    Focus on Customer Experience Management

    Enhancing customer experience is becoming a pivotal focus within the Global Telecom Billing and Revenue Management Market Industry. Telecom operators are increasingly recognizing that a seamless billing experience is essential for customer retention and satisfaction. By implementing advanced analytics and personalized billing solutions, companies can tailor their offerings to meet individual customer needs. This focus on customer experience is expected to drive market growth, as satisfied customers are more likely to remain loyal and contribute to revenue stability. As the industry evolves, operators that prioritize customer-centric billing practices may gain a competitive edge in an increasingly crowded marketplace.

    Market Segment Insights

    Get more detailed insights about Telecom Billing & Revenue Management Market Research Report – Forecast till 2032

    Regional Insights

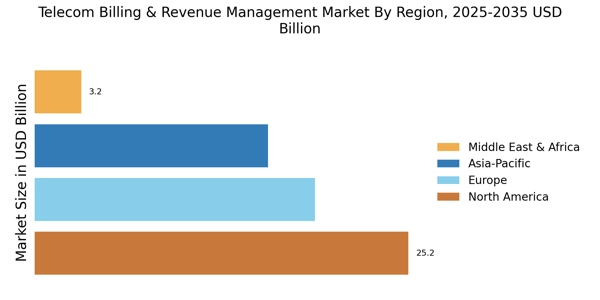
    By region, the study provides market insights into North America, Europe, Asia-Pacific, and Rest of the World. The North American Telecom Billing & Revenue Management market area will dominate this market, owing to the developing telecom industry. In addition, the increasing implementation of latest technologies will boost market growth in this region.

    Further, the major countries studied in the market report are The US, Canada, German, France, the UK, Italy, Spain, China, Japan, India, Australia, South Korea, and Brazil.

    Figure 3: TELECOM BILLING & REVENUE MANAGEMENT MARKET SHARE BY REGION 2022 (USD Billion)

    TELECOM BILLING & REVENUE MANAGEMENT MARKET SHARE BY REGION 2022

    Source: Secondary Research, Primary Research, Market Research Future Database and Analyst Review

    Europe Telecom Billing & Revenue Management market accounts for the second-largest market share due to the regular release of newer services in the telecom industry. Further, the German Telecom Billing & Revenue Management market was the fastest growing region in the market, and the UK Telecom Billing & Revenue Management market held a substantial share in the market.

    The Asia-Pacific Telecom Billing & Revenue Management Market is expected to expand at the quickest CAGR from 2023 to 2032. This is due to growing needs for enhanced billing and revenue management services across the region. Moreover, China’s Telecom Billing & Revenue Management market held the largest market share, and the Indian Telecom Billing & Revenue Management market was the fastest growing market in the Asia-Pacific region.

    Key Players and Competitive Insights

    Leading market players are investing capital and resources across research and development in order to extend their product offerings, this is expected to help the Telecom Billing & Revenue Management market, grow even more. Market participants and manufacturers are also adopting various strategic activities to grow their worldwide presence, with vital market developments including new product developments & launches, contracts & agreements, mergers & acquisitions, increased investments, and collaboration with other similar organizations. To expand and survive in a more competitive and rising market climate, Telecom Billing & Revenue Management industry must offer cost-effective items.

    The manufactures are making use of locally available resources to minimize the production costs which will aid the growth of the Telecom Billing & Revenue Management industry to benefit clients and increase the market sector. In recent years, the Telecom Billing & Revenue Management industry has offered some of the most significant advantages to medicine. Major players in the Telecom Billing & Revenue Management market, including Emida, Commerx, Huawei Technologies Co.

    Ltd., CSG Systems International Inc., Sterlite Technologies Limited, Comarch SA, IntegraTouch LLC., Infozech, Optiva Inc., Oracle, Telefonaktiebolaget LM Ericsson, SAP SE, Netcracker, ZCOM Systems, iNiSolution, and others, are attempting to increase market demand by investing in research and development operations.

    CSG Systems International Inc (CSG)is a supplier of business support solutions for IT-related issues. CSG is essentially a purpose-driven SaaS platform business that helps huge organizations in a variety of industries handle complicated problems with ease. The company's customer-centric approach and cloud-first design help businesses attract, engage, and keep local business and public as customers. The organization offers various services, including financial services, mediation, data management, and revenue management solutions. CSG provides services to the telecommunications, broadband cable, media, retail, healthcare, government, financial services, and insurance sectors.

    In October 2021, A provider of configure, price, and quote (CPQ) and order management systems for the telecoms sector, DGIT Systems, was acquired by CSG. The purchase brings together market-leading technologies that are especially created to simplify the challenges of commercializing the forthcoming wave of multi-party digital products that will propel communications service providers' (CSPs') revenue growth.

    For the telecoms sector, Optiva Inc. is a top supplier of mission-critical, cloud-native revenue management software. The private and public clouds are used to transport our products all over the world. Service providers may successfully grow their businesses by utilising digital, 5G, IoT, and growing market opportunities with the aid of Optiva solutions. The telecommunications sector uses software and services from Optiva for BSS and OSS. These include interconnect billing, customer care, integrated billing, customer experience management, and rating and charging.

    Its products are used by broadband providers in the Americas, Europe, Asia Pacific, the Middle East, and Africa as well as wireless, fixed line, satellite, WiMAX, and MVNO providers. In September 2022, The first 5G telecom charging solution to be sold through Google Cloud Marketplace has been launched, according to Optiva Inc. Because Optiva Charging Engine and Google Cloud are already integrated, CSPs may quickly purchase the software and attach it to other components of their infrastructure in less than 90 days.

    Key Companies in the Telecom Billing Revenue Management Market market include

    Industry Developments

    • Q2 2024: Telecom Egypt and Ericsson sign strategic partnership agreement for billing and revenue management solutions Telecom Egypt announced a strategic partnership with Ericsson to deploy advanced billing and revenue management solutions, aiming to enhance operational efficiency and support new digital services.
    • Q2 2024: Orange selects Netcracker for next-generation billing transformation Orange revealed it has chosen Netcracker Technology to modernize its billing and revenue management systems, supporting the rollout of new converged services and improving customer experience.
    • Q2 2024: Amdocs launches new cloud-native revenue management platform for telecom operators Amdocs introduced a cloud-native revenue management platform designed to help telecom operators accelerate digital transformation and support real-time billing for 5G and IoT services.
    • Q3 2024: Telecom billing startup BillRun raises $15M Series B to expand global operations BillRun, a provider of open-source telecom billing solutions, secured $15 million in Series B funding to scale its platform and enter new international markets.
    • Q3 2024: Nokia wins major billing system contract with Asian telecom operator Nokia announced it has secured a significant contract to supply its billing and revenue management system to a leading Asian telecom operator, supporting the operator’s transition to 5G services.
    • Q3 2024: Cognizant acquires billing software firm Telesoft for undisclosed sum Cognizant completed the acquisition of Telesoft, a specialist in telecom billing software, to strengthen its portfolio of digital transformation solutions for communications service providers.
    • Q4 2024: Comverse appoints new CEO to drive growth in telecom revenue management Comverse announced the appointment of a new CEO, tasked with accelerating the company’s growth in telecom billing and revenue management solutions amid rising demand for digital services.
    • Q4 2024: Vodafone launches AI-powered fraud management module for billing systems Vodafone introduced an AI-powered fraud management module integrated into its billing systems, aiming to reduce revenue leakage and improve customer trust.
    • Q1 2025: Telecom SaaS firm RevStream secures $20M Series C funding RevStream, a SaaS provider specializing in telecom billing and revenue management, raised $20 million in Series C funding to accelerate product development and expand its customer base.
    • Q1 2025: Telefonica partners with Infosys for cloud-based billing transformation Telefonica announced a partnership with Infosys to migrate its billing and revenue management systems to the cloud, aiming to improve scalability and support new digital offerings.
    • Q2 2025: Ericsson opens new R&D center focused on telecom billing innovation Ericsson inaugurated a new research and development center dedicated to advancing telecom billing and revenue management technologies, with a focus on AI and automation.
    • Q2 2025: SAP launches next-gen revenue assurance platform for telecom sector SAP unveiled a next-generation revenue assurance platform tailored for telecom operators, designed to enhance billing accuracy and reduce fraud in increasingly complex service environments.

    Future Outlook

    Telecom Billing Revenue Management Market Future Outlook

    The Telecom Billing & Revenue Management Market is projected to grow at a 6.01% CAGR from 2024 to 2035, driven by digital transformation, increased data consumption, and regulatory compliance demands.

    New opportunities lie in:

    • Leverage AI-driven analytics for personalized billing solutions to enhance customer satisfaction.
    • Develop integrated platforms for seamless multi-service billing to capture diverse revenue streams.
    • Invest in blockchain technology for secure, transparent transactions and fraud prevention.

    By 2035, the market is expected to achieve robust growth, reflecting evolving consumer needs and technological advancements.

    Market Segmentation

    Telecom Billing & Revenue Management Regional Outlook

    • North America
    • Europe
    • Rest of Europe
    • Asia-Pacific
    • China
    • Japan
    • India
    • Australia
    • South Korea
    • Rest of Asia-Pacific
    • Rest of the World
    • Middle East
    • Africa
    • Latin America

    Telecom Billing & Revenue Management Component Outlook (USD Billion, 2018-2032)

    • Software
    • Services

    Telecom Billing & Revenue Management, Operator type Outlook (USD Billion, 2018-2032)

    • Mobile operators and internet service providers
    • Satellite communication providers and cable network providers

    Telecom Billing & Revenue Management Deployment mode Outlook (USD Billion, 2018-2032)

    • Cloud
    • On-premise

    Report Scope

    Report Attribute/Metric Details
    Market Size 2023 USD 59.00 Billion
    Market Size 2024 USD 63.07 Billion
    Market Size 2032 USD 100.63 Billion
    Compound Annual Growth Rate (CAGR) 6.01% (2024-2032)
    Base Year 2023
    Market Forecast Period 2024-2032
    Historical Data 2018- 2022
    Market Forecast Units Value (USD Billion)
    Report Coverage Revenue Forecast, Market Competitive Landscape, Growth Factors, and Trends
    Segments Covered Component, Deployment mode, Operator type, and Region
    Geographies Covered North America, Europe, Asia Pacific, and the Rest of the World
    Countries Covered The US, Canada, German, France, UK, Italy, Spain, China, Japan, India, Australia, South Korea, and Brazil
    Key Companies Profiled Emida, Commerx, Huawei Technologies Co. Ltd., CSG Systems International Inc., Sterlite Technologies Limited, Comarch SA, IntegraTouch LLC
    Key Market Opportunities Growing telecom industry
    Key Market Dynamics Increase in demand for effective billing and revenue management services

    Market Highlights

    Author
    Aarti Dhapte
    Team Lead - Research

    She holds an experience of about 6+ years in Market Research and Business Consulting, working under the spectrum of Information Communication Technology, Telecommunications and Semiconductor domains. Aarti conceptualizes and implements a scalable business strategy and provides strategic leadership to the clients. Her expertise lies in market estimation, competitive intelligence, pipeline analysis, customer assessment, etc.

    Leave a Comment

    FAQs

    1. 'TABLE OF CONTENTS
    2. EXECUTIVE SUMMARY
      1. Market Attractiveness Analysis
        1. Global Telecom Billing & Revenue Management Market, by Component
        2. Global Telecom Billing & Revenue Management Market, by Operator Type
        3. Global Telecom Billing & Revenue Management Market, by Deployment Mode
        4. Global Telecom Billing & Revenue Management Market, by Region
    3. MARKET INTRODUCTION
      1. Definition
      2. Scope of the Study
    4. Market Structure
    5. RESEARCH METHODOLOGY
      1. Research Process
    6. Primary Research
      1. Secondary Research
      2. Market Size Estimation
      3. List of Assumptions
    7. MARKET DYNAMICS
      1. Introduction
    8. Drivers
      1. Rise in number of mobile users
        1. Transformation of
    9. DSPs from CSPs
      1. Increase in number of stakeholders in the telecom industry
      2. Restraint
        1. Stringent government regulations
      3. Opportunity
        1. Rising need to optimize revenue streams using innovative technologies
      4. Challenges
        1. Rising volumes of consumer transactions
    10. Impact of COVID-19
      1. Impact on customer relationship management
    11. Impact on IT industry
      1. Impact Telecom industry
    12. MARKET FACTOR ANALYSIS
      1. Value Chain Analysis/Supply Chain Analysis
      2. Porter’s
    13. Five Forces Model
      1. Bargaining Power of Suppliers
        1. Bargaining
    14. Power of Buyers
      1. Threat of New Entrants
        1. Threat of Substitutes
        2. Intensity of Rivalry
    15. GLOBAL TELECOM BILLING & REVENUE MANAGEMENT
    16. MARKET, BY COMPONENT
      1. Introduction
      2. Software
        1. Mediation
        2. Billing & Charging
        3. Partner & Interconnect Management
        4. Revenue Assurance
        5. Fraud Management
      3. Services
    17. Professional Services
      1. Managed Services
    18. GLOBAL TELECOM BILLING
    19. & REVENUE MANAGEMENT MARKET, BY OPERATOR TYPE
      1. Introduction
    20. Mobile Operators
      1. Internet Service Providers, Satellite Communication Providers,
    21. and Cable Network Providers
    22. GLOBAL TELECOM BILLING & REVENUE MANAGEMENT
    23. MARKET, BY DEPLOYMENT MODE
      1. Introduction
      2. Cloud
      3. On-premises
    24. GLOBAL TELECOM BILLING & REVENUE MANAGEMENT MARKET, BY REGION
    25. Overview
      1. North America
        1. Market Size & Estimates, by Country,
        2. Market Size & Estimates, by Component, 2020–2027
        3. Market Size & Estimates, by Operator Type, 2020–2027
    26. Market Size & Estimates, by Deployment Mode, 2020–2027
      1. US
        1. Market Size & Estimates, by Component, 2020–2027
    27. Market Size & Estimates, by Operator Type, 2020–2027
      1. Market
    28. Size & Estimates, by Deployment Mode, 2020–2027
      1. Canada
        1. Market Size & Estimates, by Component, 2020–2027
    29. Market Size & Estimates, by Operator Type, 2020–2027
      1. Market
    30. Size & Estimates, by Deployment Mode, 2020–2027
      1. Mexico
        1. Market Size & Estimates, by Component, 2020–2027
    31. Market Size & Estimates, by Operator Type, 2020–2027
      1. Market
    32. Size & Estimates, by Deployment Mode, 2020–2027
      1. Europe
    33. Market Size & Estimates, by Country, 2020–2027
      1. Market Size
    34. & Estimates, by Component, 2020–2027
      1. Market Size & Estimates,
    35. by Operator Type, 2020–2027
      1. Market Size & Estimates, by Deployment
    36. Mode, 2020–2027
      1. Germany
        1. Market Size & Estimates,
    37. by Component, 2020–2027
      1. Market Size & Estimates, by Operator
    38. Type, 2020–2027
      1. Market Size & Estimates, by Deployment Mode,
        1. UK
    39. France
      1. Market Size & Estimates, by Component, 2020–2027
        1. Market Size & Estimates, by Operator Type, 2020–2027
    40. Market Size & Estimates, by Deployment Mode, 2020–2027
      1. Rest
    41. of Europe
      1. Market Size & Estimates, by Component, 2020–2027
        1. Market Size & Estimates, by Operator Type, 2020–2027
    42. Market Size & Estimates, by Deployment Mode, 2020–2027
      1. Asia
    43. Pacific
      1. Market Size & Estimates, by Country, 2020–2027
        1. Market Size & Estimates, by Component, 2020–2027
    44. Market Size & Estimates, by Operator Type, 2020–2027
      1. Market
    45. Size & Estimates, by Deployment Mode, 2020–2027
      1. China
    46. Market Size & Estimates, by Component, 2020–2027
      1. Market
    47. Size & Estimates, by Operator Type, 2020–2027
      1. Market Size
    48. & Estimates, by Deployment Mode, 2020–2027
      1. Japan
    49. Market Size & Estimates, by Component, 2020–2027
      1. Market
    50. Size & Estimates, by Operator Type, 2020–2027
      1. Market Size
    51. & Estimates, by Deployment Mode, 2020–2027
      1. India
    52. Market Size & Estimates, by Component, 2020–2027
      1. Market
    53. Size & Estimates, by Operator Type, 2020–2027
      1. Market Size
    54. & Estimates, by Deployment Mode, 2020–2027
      1. Rest of Asia-Pacific
        1. Market Size & Estimates, by Component, 2020–2027
    55. Market Size & Estimates, by Operator Type, 2020–2027
      1. Market
    56. Size & Estimates, by Deployment Mode, 2020–2027
      1. Middle East
    57. & Africa
      1. Market Size & Estimates, by Component, 2020–2027
        1. Market Size & Estimates, by Operator Type, 2020–2027
    58. Market Size & Estimates, by Deployment Mode, 2020–2027
      1. South
    59. America
      1. Market Size & Estimates, by Component, 2020–2027
        1. Market Size & Estimates, by Operator Type, 2020–2027
    60. Market Size & Estimates, by Deployment Mode, 2020–2027
    61. COMPETITIVE LANDSCAPE
      1. Introduction
      2. Key Players Market Share Analysis,
      3. Competitive Benchmarking
      4. Competitor Dashboard
      5. Major Growth Strategy in the market
      6. Key Developments & Growth
    62. Strategies
      1. New Product Development
        1. Mergers & Acquisitions
        2. Contracts & Agreements
    63. COMPANY PROFILES
      1. Netcracker
        1. Company Overview
        2. Financial Overview
        3. Products/Components/Solutions
    64. Offered
      1. Key Developments
        1. SWOT Analysis
        2. Key
    65. Strategies
      1. CSG Systems International, Inc.
        1. Company Overview
        2. Financial Overview
        3. Products/Components/Solutions Offered
        4. Key Developments
        5. SWOT Analysis
        6. Key Strategies
      2. Oracle
        1. Company Overview
        2. Financial Overview
        3. Products/Components/Solutions Offered
        4. Key Developments
        5. SWOT Analysis
        6. Key Strategies
      3. Telefonaktiebolaget
    66. LM Ericsson
      1. Company Overview
        1. Financial Overview
    67. Products/Components/Solutions Offered
      1. Key Developments
    68. SWOT Analysis
      1. Key Strategies
      2. Huawei Technologies Co., Ltd.
        1. Company Overview
        2. Financial Overview
        3. Products/Components/Solutions
    69. Offered
      1. Key Developments
        1. SWOT Analysis
        2. Key
    70. Strategies
      1. SAP SE
        1. Company Overview
        2. Financial
    71. Overview
      1. Products/Components/Solutions Offered
        1. Key Developments
        2. SWOT Analysis
        3. Key Strategies
      2. Comarch SA
    72. Company Overview
      1. Financial Overview
        1. Products/Components/Solutions
    73. Offered
      1. Key Developments
        1. SWOT Analysis
        2. Key
    74. Strategies
      1. Sterlite Technologies Limited
        1. Company Overview
        2. Financial Overview
        3. Products/Components/Solutions Offered
        4. Key Developments
        5. SWOT Analysis
        6. Key Strategies
      2. Emida
        1. Company Overview
        2. Financial Overview
    75. Products/Components/Solutions Offered
      1. Key Developments
    76. SWOT Analysis
      1. Key Strategies
      2. Commerx
        1. Company
    77. Overview
      1. Financial Overview
        1. Products/Components/Solutions
    78. Offered
      1. Key Developments
        1. SWOT Analysis
    79. Key Strategies
      1. Optiva, Inc.
        1. Company Overview
    80. Financial Overview
      1. Products/Components/Solutions Offered
    81. Key Developments
      1. SWOT Analysis
        1. Key Strategies
    82. iNiSolution
      1. Company Overview
        1. Financial Overview
    83. Products/Components/Solutions Offered
      1. Key Developments
    84. SWOT Analysis
      1. Key Strategies
      2. Infozech
        1. Company
    85. Overview
      1. Financial Overview
        1. Products/Components/Solutions
    86. Offered
      1. Key Developments
        1. SWOT Analysis
    87. Key Strategies
      1. IntegraTouch, LLC.
        1. Company Overview
        2. Financial Overview
        3. Products/Components/Solutions Offered
        4. Key Developments
        5. SWOT Analysis
        6. Key Strategies
      2. ZCOM Systems
        1. Company Overview
        2. Financial Overview
        3. Products/Components/Solutions Offered
        4. Key Developments
        5. SWOT Analysis
        6. Key Strategies
    88. MANAGEMENT MARKET, BY COMPONENT, 2020–2027 (USD MILLION)
    89. TELECOM BILLING & REVENUE MANAGEMENT MARKET, BY OPERATOR TYPE, 2020–2027
    90. (USD MILLION)
    91. BY DEPLOYMENT MODE, 2020–2027 (USD MILLION)
    92. & REVENUE MANAGEMENT MARKET, BY REGION, 2020–2027 (USD MILLION)
    93. NORTH AMERICA: TELECOM BILLING & REVENUE MANAGEMENT MARKET, BY COUNTRY, 2020–2027
    94. (USD MILLION)
    95. MARKET, BY COMPONENT, 2020–2027 (USD MILLION)
    96. TELECOM BILLING & REVENUE MANAGEMENT MARKET, BY OPERATOR TYPE, 2020–2027
    97. (USD MILLION)
    98. MARKET, BY DEPLOYMENT MODE, 2020–2027 (USD MILLION)
    99. BILLING & REVENUE MANAGEMENT MARKET, BY COMPONENT, 2020–2027 (USD MILLION)
    100. –2027 (USD MILLION)
    101. MARKET, BY DEPLOYMENT MODE, 2020–2027 (USD MILLION)
    102. TELECOM BILLING & REVENUE MANAGEMENT MARKET, BY COMPONENT, 2020–2027 (USD
    103. MILLION)
    104. BY OPERATOR TYPE, 2020–2027 (USD MILLION)
    105. & REVENUE MANAGEMENT MARKET, BY DEPLOYMENT MODE, 2020–2027 (USD MILLION)
    106. –2027 (USD MILLION)
    107. MANAGEMENT MARKET, BY OPERATOR TYPE, 2020–2027 (USD MILLION)
    108. MEXICO: TELECOM BILLING & REVENUE MANAGEMENT MARKET, BY DEPLOYMENT MODE, 2020–2027
    109. (USD MILLION)
    110. BY COUNTRY, 2020–2027 (USD MILLION)
    111. & REVENUE MANAGEMENT MARKET, BY COMPONENT, 2020–2027 (USD MILLION)
    112. TYPE, 2020–2027 (USD MILLION)
    113. REVENUE MANAGEMENT MARKET, BY DEPLOYMENT MODE, 2020–2027 (USD MILLION)
    114. (USD MILLION)
    115. BY OPERATOR TYPE, 2020–2027 (USD MILLION)
    116. & REVENUE MANAGEMENT MARKET, BY DEPLOYMENT MODE, 2020–2027 (USD MILLION)
    117. –2027 (USD MILLION)
    118. MANAGEMENT MARKET, BY OPERATOR TYPE, 2020–2027 (USD MILLION)
    119. GERMANY: TELECOM BILLING & REVENUE MANAGEMENT MARKET, BY DEPLOYMENT MODE, 2020–2027
    120. (USD MILLION)
    121. BY COMPONENT, 2020–2027 (USD MILLION)
    122. & REVENUE MANAGEMENT MARKET, BY OPERATOR TYPE, 2020–2027 (USD MILLION)
    123. MODE, 2020–2027 (USD MILLION)
    124. & REVENUE MANAGEMENT MARKET, BY COMPONENT, 2020–2027 (USD MILLION)
    125. TYPE, 2020–2027 (USD MILLION)
    126. & REVENUE MANAGEMENT MARKET, BY DEPLOYMENT MODE, 2020–2027 (USD MILLION)
    127. –2027 (USD MILLION)
    128. REVENUE MANAGEMENT MARKET, BY COMPONENT, 2020–2027 (USD MILLION)
    129. ASIA-PACIFIC: TELECOM BILLING & REVENUE MANAGEMENT MARKET, BY OPERATOR TYPE,
    130. –2027 (USD MILLION)
    131. REVENUE MANAGEMENT MARKET, BY DEPLOYMENT MODE, 2020–2027 (USD MILLION)
    132. –2027 (USD MILLION)
    133. MANAGEMENT MARKET, BY OPERATOR TYPE, 2020–2027 (USD MILLION)
    134. CHINA: TELECOM BILLING & REVENUE MANAGEMENT MARKET, BY DEPLOYMENT MODE, 2020–2027
    135. (USD MILLION)
    136. BY COMPONENT, 2020–2027 (USD MILLION)
    137. & REVENUE MANAGEMENT MARKET, BY OPERATOR TYPE, 2020–2027 (USD MILLION)
    138. MODE, 2020–2027 (USD MILLION)
    139. MANAGEMENT MARKET, BY COMPONENT, 2020–2027 (USD MILLION)
    140. TELECOM BILLING & REVENUE MANAGEMENT MARKET, BY OPERATOR TYPE, 2020–2027
    141. (USD MILLION)
    142. BY DEPLOYMENT MODE, 2020–2027 (USD MILLION)
    143. TELECOM BILLING & REVENUE MANAGEMENT MARKET, BY COMPONENT, 2020–2027 (USD
    144. MILLION)
    145. MARKET, BY OPERATOR TYPE, 2020–2027 (USD MILLION)
    146. TELECOM BILLING & REVENUE MANAGEMENT MARKET, BY DEPLOYMENT MODE, 2020–2027
    147. (USD MILLION)
    148. MANAGEMENT MARKET, BY COMPONENT, 2020–2027 (USD MILLION)
    149. EAST AND AFRICA: TELECOM BILLING & REVENUE MANAGEMENT MARKET, BY OPERATOR TYPE,
    150. –2027 (USD MILLION)
    151. & REVENUE MANAGEMENT MARKET, BY DEPLOYMENT MODE, 2020–2027 (USD MILLION)
    152. –2027 (USD MILLION)
    153. REVENUE MANAGEMENT MARKET, BY OPERATOR TYPE, 2020–2027 (USD MILLION)
    154. SOUTH AMERICA: TELECOM BILLING & REVENUE MANAGEMENT MARKET, BY DEPLOYMENT
    155. MODE, 2020–2027 (USD MILLION)
    156. TOP DOWN & BOTTOM-UP APPROACH
    157. MANAGEMENT MARKET, BY COMPONENT, 2020–2027 (USD MILLION)
    158. TELECOM BILLING & REVENUE MANAGEMENT MARKET, BY OPERATOR TYPE, 2020–2027
    159. (USD MILLION)
    160. BY DEPLOYMENT MODE, 2020–2027 (USD MILLION)
    161. & REVENUE MANAGEMENT MARKET, BY REGION, 2020 & 2027 (USD MILLION)
    162. NORTH AMERICA: TELECOM BILLING & REVENUE MANAGEMENT MARKET, BY COUNTRY, 2020–2027
    163. (USD MILLION)
    164. MARKET, BY COMPONENT, 2020–2027 (USD MILLION)
    165. TELECOM BILLING & REVENUE MANAGEMENT MARKET, BY OPERATOR TYPE, 2020–2027
    166. (USD MILLION)
    167. MARKET, BY DEPLOYMENT MODE, 2020–2027 (USD MILLION)
    168. TELECOM BILLING & REVENUE MANAGEMENT MARKET, BY COUNTRY, 2020–2027 (USD
    169. MILLION)
    170. BY COMPONENT, 2020–2027 (USD MILLION)
    171. & REVENUE MANAGEMENT MARKET, BY OPERATOR TYPE, 2020–2027 (USD MILLION)
    172. MODE, 2020–2027 (USD MILLION)
    173. & REVENUE MANAGEMENT MARKET, BY COUNTRY, 2020–2027 (USD MILLION)
    174. ASIA-PACIFIC: TELECOM BILLING & REVENUE MANAGEMENT MARKET, BY COMPONENT,
    175. –2027 (USD MILLION)
    176. REVENUE MANAGEMENT MARKET, BY OPERATOR TYPE, 2020–2027 (USD MILLION)
    177. ASIA-PACIFIC: TELECOM BILLING & REVENUE MANAGEMENT MARKET, BY DEPLOYMENT
    178. MODE, 2020–2027 (USD MILLION)
    179. BILLING & REVENUE MANAGEMENT MARKET, BY COMPONENT, 2020–2027 (USD MILLION)
    180. BY OPERATOR TYPE, 2020–2027 (USD MILLION)
    181. TELECOM BILLING & REVENUE MANAGEMENT MARKET, BY DEPLOYMENT MODE, 2020–2027
    182. (USD MILLION)
    183. MARKET, BY COMPONENT, 2020–2027 (USD MILLION)
    184. TELECOM BILLING & REVENUE MANAGEMENT MARKET, BY OPERATOR TYPE, 2020–2027
    185. (USD MILLION)
    186. MARKET, BY DEPLOYMENT MODE, 2020–2027 (USD MILLION)'

    Market Segmentation Tab

    Telecom Billing & Revenue Management Component Outlook (USD Billion, 2018-2032)

    • Software
    • Services

    Telecom Billing & Revenue Management, Operator type Outlook (USD Billion, 2018-2032)

    • Mobile operators and internet service providers
    • Satellite communication providers and cable network providers

    Telecom Billing & Revenue Management Deployment mode Outlook (USD Billion, 2018-2032)

    • Cloud
    • On-premise

    Telecom Billing & Revenue Management Regional Outlook (USD Billion, 2018-2032)

    • North America Outlook (USD Billion, 2018-2032)

      • North America Telecom Billing & Revenue Management by Component
        • Software
        • Services
      • North America Telecom Billing & Revenue Management by Operator type
        • Mobile operators and internet service providers
        • Satellite communication providers and cable network providers
      • North America Telecom Billing & Revenue Management by Deployment mode
        • Cloud
        • On-premise
      • US Outlook (USD Billion, 2018-2032)

      • US Telecom Billing & Revenue Management by Component
        • Software
        • Services
      • US Telecom Billing & Revenue Management by Operator type
        • Mobile operators and internet service providers
        • Satellite communication providers and cable network providers
      • US Telecom Billing & Revenue Management by Deployment mode
        • Cloud
        • On-premise
      • CANADA Outlook (USD Billion, 2018-2032)

      • CANADA Telecom Billing & Revenue Management by Component
        • Software
        • Services
      • CANADA Telecom Billing & Revenue Management by Operator type
        • Mobile operators and internet service providers
        • Satellite communication providers and cable network providers
      • CANADA Telecom Billing & Revenue Management by Deployment mode
        • Cloud
        • On-premise
    • Europe Outlook (USD Billion, 2018-2032)

      • Europe Telecom Billing & Revenue Management by Component
        • Software
        • Services
      • Europe Telecom Billing & Revenue Management by Operator type
        • Mobile operators and internet service providers
        • Satellite communication providers and cable network providers
      • Europe Telecom Billing & Revenue Management by Deployment mode
        • Cloud
        • On-premise
      • Germany Outlook (USD Billion, 2018-2032)

      • Germany Telecom Billing & Revenue Management by Component
        • Software
        • Services
      • Germany Telecom Billing & Revenue Management by Operator type
        • Mobile operators and internet service providers
        • Satellite communication providers and cable network providers
      • Germany Telecom Billing & Revenue Management by Deployment mode
        • Cloud
        • On-premise
      • France Outlook (USD Billion, 2018-2032)

      • France Telecom Billing & Revenue Management by Component
        • Software
        • Services
      • France Telecom Billing & Revenue Management by Operator type
        • Mobile operators and internet service providers
        • Satellite communication providers and cable network providers
      • France Telecom Billing & Revenue Management by Deployment mode
        • Cloud
        • On-premise
      • UK Outlook (USD Billion, 2018-2032)

      • UK Telecom Billing & Revenue Management by Component
        • Software
        • Services
      • UK Telecom Billing & Revenue Management by Operator type
        • Mobile operators and internet service providers
        • Satellite communication providers and cable network providers
      • UK Telecom Billing & Revenue Management by Deployment mode
        • Cloud
        • On-premise
      • ITALY Outlook (USD Billion, 2018-2032)

      • ITALY Telecom Billing & Revenue Management by Component
        • Software
        • Services
      • ITALY Telecom Billing & Revenue Management by Operator type
        • Mobile operators and internet service providers
        • Satellite communication providers and cable network providers
      • ITALY Telecom Billing & Revenue Management by Deployment mode
        • Cloud
        • On-premise
      • SPAIN Outlook (USD Billion, 2018-2032)

      • Spain Telecom Billing & Revenue Management by Component
        • Software
        • Services
      • Spain Telecom Billing & Revenue Management by Operator type
        • Mobile operators and internet service providers
        • Satellite communication providers and cable network providers
      • Spain Telecom Billing & Revenue Management by Deployment mode
        • Cloud
        • On-premise
      • Rest Of Europe Outlook (USD Billion, 2018-2032)

      • Rest Of Europe Telecom Billing & Revenue Management by Component
        • Software
        • Services
      • REST OF EUROPE Telecom Billing & Revenue Management by Operator type
        • Mobile operators and internet service providers
        • Satellite communication providers and cable network providers
      • REST OF EUROPE Telecom Billing & Revenue Management by Deployment mode
        • Cloud
        • On-premise
    • Asia-Pacific Outlook (USD Billion, 2018-2032)

      • Asia-Pacific Telecom Billing & Revenue Management by Component
        • Software
        • Services
      • Asia-Pacific Telecom Billing & Revenue Management by Operator type
        • Mobile operators and internet service providers
        • Satellite communication providers and cable network providers
      • Asia-Pacific Telecom Billing & Revenue Management by Deployment mode
        • Cloud
        • On-premise
      • China Outlook (USD Billion, 2018-2032)

      • China Telecom Billing & Revenue Management by Component
        • Software
        • Services
      • China Telecom Billing & Revenue Management by Operator type
        • Mobile operators and internet service providers
        • Satellite communication providers and cable network providers
      • China Telecom Billing & Revenue Management by Deployment mode
        • Cloud
        • On-premise
      • Japan Outlook (USD Billion, 2018-2032)

      • Japan Telecom Billing & Revenue Management by Component
        • Software
        • Services
      • Japan Telecom Billing & Revenue Management by Operator type
        • Mobile operators and internet service providers
        • Satellite communication providers and cable network providers
      • Japan Telecom Billing & Revenue Management by Deployment mode
        • Cloud
        • On-premise
      • India Outlook (USD Billion, 2018-2032)

      • India Telecom Billing & Revenue Management by Component
        • Software
        • Services
      • India Telecom Billing & Revenue Management by Operator type
        • Mobile operators and internet service providers
        • Satellite communication providers and cable network providers
      • India Telecom Billing & Revenue Management by Deployment mode
        • Cloud
        • On-premise
      • Australia Outlook (USD Billion, 2018-2032)

      • Australia Telecom Billing & Revenue Management by Component
        • Software
        • Services
      • Australia Telecom Billing & Revenue Management by Operator type
        • Mobile operators and internet service providers
        • Satellite communication providers and cable network providers
      • Australia Telecom Billing & Revenue Management by Deployment mode
        • Cloud
        • On-premise
      • Rest of Asia-Pacific Outlook (USD Billion, 2018-2032)

      • Rest of Asia-Pacific Telecom Billing & Revenue Management by Component
        • Software
        • Services
      • Rest of Asia-Pacific Telecom Billing & Revenue Management by Operator type
        • Mobile operators and internet service providers
        • Satellite communication providers and cable network providers
      • Rest of Asia-Pacific Telecom Billing & Revenue Management by Deployment mode
        • Cloud
        • On-premise
    • Rest of the World Outlook (USD Billion, 2018-2032)

      • Rest of the World Telecom Billing & Revenue Management by Component
        • Software
        • Services
      • Rest of the World Telecom Billing & Revenue Management by Operator type
        • Mobile operators and internet service providers
        • Satellite communication providers and cable network providers
      • Rest of the World Telecom Billing & Revenue Management by Deployment mode
        • Cloud
        • On-premise
      • Middle East Outlook (USD Billion, 2018-2032)

      • Middle East Telecom Billing & Revenue Management by Component
        • Software
        • Services
      • Middle East Telecom Billing & Revenue Management by Operator type
        • Mobile operators and internet service providers
        • Satellite communication providers and cable network providers
      • Middle East Telecom Billing & Revenue Management by Deployment mode
        • Cloud
        • On-premise
      • Africa Outlook (USD Billion, 2018-2032)

      • Africa Telecom Billing & Revenue Management by Component
        • Software
        • Services
      • Africa Telecom Billing & Revenue Management by Operator type
        • Mobile operators and internet service providers
        • Satellite communication providers and cable network providers
      • Africa Telecom Billing & Revenue Management by Deployment mode
        • Cloud
        • On-premise
      • Latin America Outlook (USD Billion, 2018-2032)

      • Latin America Telecom Billing & Revenue Management by Component
        • Software
        • Services
      • Latin America Telecom Billing & Revenue Management by Operator type
        • Mobile operators and internet service providers
        • Satellite communication providers and cable network providers
      • Latin America Telecom Billing & Revenue Management by Deployment mode
        • Cloud
        • On-premise
    Telecom Billing & Revenue Management Market Research Report – Forecast till 2032 Infographic
    Free Sample Request

    Kindly complete the form below to receive a free sample of this Report

    Customer Strories

    “I am very pleased with how market segments have been defined in a relevant way for my purposes (such as "Portable Freezers & refrigerators" and "last-mile"). In general the report is well structured. Thanks very much for your efforts.”

    Victoria Milne Founder
    Case Study

    Chemicals and Materials