• Cat-intel
  • MedIntelliX
  • Resources
  • About Us
  • Request Free Sample ×

    Kindly complete the form below to receive a free sample of this Report

    Leading companies partner with us for data-driven Insights

    clients tt-cursor

    Supply Chain Digital Twin Market

    ID: MRFR/ICT/30944-HCR
    100 Pages
    Aarti Dhapte
    September 2025

    Supply Chain Digital Twin Market Research Report By Application (Manufacturing, Logistics, Retail, Healthcare), By Technology (Internet of Things, Artificial Intelligence, Machine Learning, Big Data Analytics), By End Use (Automotive, Aerospace, Consumer Goods, Pharmaceuticals), By Deployment Mode (Cloud, On-Premises) and By Regional (North America, Europe, South America, Asia Pacific, Middle East and Africa) - Forecast to 2034

    Share:
    Download PDF ×

    We do not share your information with anyone. However, we may send you emails based on your report interest from time to time. You may contact us at any time to opt-out.

    Supply Chain Digital Twin Market Research Report — Global Forecast till 2034 Infographic
    Purchase Options
    $ 4,950.0
    $ 5,950.0
    $ 7,250.0
    Table of Contents

    Supply Chain Digital Twin Market Summary

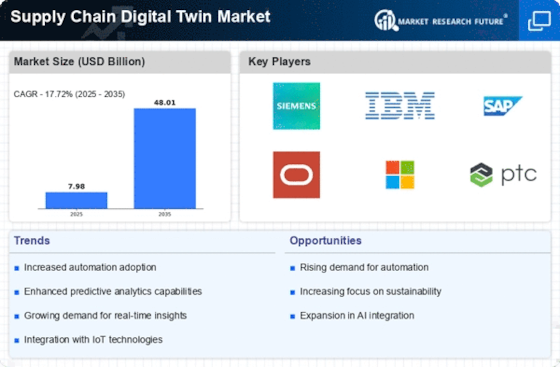
    The Global Supply Chain Digital Twin Market is projected to grow from 6.78 USD Billion in 2024 to 48.0 USD Billion by 2035.

    Key Market Trends & Highlights

    Supply Chain Digital Twin Key Trends and Highlights

    • The market is expected to experience a compound annual growth rate (CAGR) of 19.48% from 2025 to 2035.
    • By 2035, the market valuation is anticipated to reach 48.0 USD Billion, indicating substantial growth potential.
    • In 2024, the market is valued at 6.78 USD Billion, reflecting the increasing interest in digital twin technology.
    • Growing adoption of digital twin technology due to enhanced operational efficiency is a major market driver.

    Market Size & Forecast

    2024 Market Size 6.78 (USD Billion)
    2035 Market Size 48.0 (USD Billion)
    CAGR (2025-2035) 19.48%

    Major Players

    Microsoft, Oracle, Honeywell, Amazon Web Services, Rockwell Automation, Bentley Systems, IBM, Dassault Systemes, Siemens, PTC, Cisco, Altair, SAP, General Electric, Ansys

    Supply Chain Digital Twin Market Trends

    Businesses can leverage digital twins to address challenges like demand forecasting, inventory management, and risk mitigation in supply chains. Integrating IoT devices with digital twins opens avenues for more accurate data collection and real-time analysis, creating a more resilient logistics network. Moreover, as sustainability becomes a priority, digital twins can help organizations identify inefficiencies and implement practices that reduce waste and energy consumption, aligning with corporate social responsibility goals. Recent trends indicate a shift towards the integration of advanced technologies like machine learning and blockchain with digital twins.

    The integration of digital twin technology within supply chains is poised to enhance operational efficiency and resilience, reflecting a transformative shift in how industries manage logistics and production processes.

    U.S. Department of Commerce

    Supply Chain Digital Twin Market Drivers

    Market Growth Projections

    The Global Supply Chain Digital Twin Market Industry is projected to experience substantial growth, with estimates indicating a market value of 48.0 USD Billion by 2035. This growth trajectory reflects the increasing adoption of digital twin technologies across various sectors, driven by the need for enhanced operational efficiency and data-driven decision-making. The anticipated CAGR of 19.48% from 2025 to 2035 underscores the market's potential as organizations seek innovative solutions to navigate complex supply chain challenges. The upward trend in market value suggests a robust future for digital twin applications in supply chain management.

    Rising Complexity of Supply Chains

    As supply chains become more complex due to globalization and diversification, the Global Supply Chain Digital Twin Market Industry is witnessing significant growth. Companies face challenges in managing multi-tier supply chains, necessitating advanced solutions for visibility and control. Digital twins provide a comprehensive view of supply chain dynamics, allowing organizations to identify bottlenecks and optimize processes. This complexity drives the adoption of digital twin technologies, as businesses seek to enhance resilience and adaptability in their operations. The industry's expansion is indicative of this growing need for sophisticated supply chain management.

    Increased Demand for Real-Time Data

    The Global Supply Chain Digital Twin Market Industry experiences heightened demand for real-time data analytics, which enhances decision-making processes. Companies are increasingly adopting digital twin technologies to simulate supply chain operations, allowing for immediate responses to disruptions. For instance, organizations can utilize digital twins to monitor inventory levels and optimize logistics in real-time. This shift is projected to drive the market's growth, with the industry valued at 6.78 USD Billion in 2024, indicating a robust interest in leveraging data for operational efficiency.

    Focus on Sustainability and Efficiency

    The Global Supply Chain Digital Twin Market Industry is increasingly influenced by the focus on sustainability and operational efficiency. Organizations are adopting digital twin solutions to minimize waste and optimize resource utilization, aligning with global sustainability goals. For instance, companies can simulate various scenarios to identify the most eco-friendly logistics routes, thereby reducing carbon footprints. This trend not only enhances corporate responsibility but also improves profitability, as efficient operations often lead to cost savings. The market's growth trajectory reflects this shift towards sustainable practices.

    Advancements in IoT and AI Technologies

    Technological advancements in the Internet of Things (IoT) and artificial intelligence (AI) are pivotal in propelling the Global Supply Chain Digital Twin Market Industry. These technologies facilitate the creation of accurate digital replicas of physical supply chains, enabling predictive analytics and enhanced operational visibility. For example, companies can deploy IoT sensors to gather data on equipment performance, which is then analyzed using AI algorithms to forecast maintenance needs. This integration is expected to contribute to the market's growth, with a projected CAGR of 19.48% from 2025 to 2035.

    Regulatory Compliance and Risk Management

    The Global Supply Chain Digital Twin Market Industry is also shaped by the increasing need for regulatory compliance and risk management. Companies are leveraging digital twin technologies to ensure adherence to industry regulations and standards, particularly in sectors such as pharmaceuticals and food safety. By simulating supply chain processes, organizations can identify potential compliance issues before they arise, thereby mitigating risks. This proactive approach not only safeguards against penalties but also enhances overall supply chain integrity. As regulatory landscapes evolve, the demand for digital twin solutions is likely to rise.

    Market Segment Insights

    Supply Chain Digital Twin Market Application Insights

    The Supply Chain Digital Twin Market is witnessing significant growth across its various applications, valued at 5.76 USD Billion in 2023 and projected to reach 25.0 USD Billion by 2032. The majority holding within this market is seen in the manufacturing sector, which accounted for a valuation of 1.92 USD Billion in 2023 and is expected to reach 8.5 USD Billion by 2032. This sector is crucial as manufacturers leverage digital twin technology to improve productivity, minimize downtime, and enhance operational efficiency in a highly competitive market.

    Following closely is the logistics segment, with a market value of 1.15 USD Billion in 2023, growing to 5.0 USD Billion by 2032. The significance of this area lies in the ability of logistics firms to visualize operations in real-time, facilitating better decision-making and supply chain optimization. The retail sector also plays a vital role, reflecting a valuation of 1.21 USD Billion in 2023, projected to advance to 5.5 USD Billion by 2032. Retailers utilize digital twins to enhance customer engagement and optimize inventory management, ensuring better alignment with consumer demand.

    Lastly, the healthcare sector is not far behind, valued at 1.48 USD Billion in 2023 and expected to grow to 6.0 USD Billion by 2032. This area is significant in improving patient outcomes and streamlining hospital operations through predictive analytics. The Supply Chain Digital Twin Market data reveals a transformative trend where organizations across these applications adopt advanced technologies to strengthen their market position, enhancing overall efficiency and responsiveness. The potential for these sectors reflects not only individual growth but also a broader trend towards digitization in supply chain management, driven by the need for operational excellence and strategic agility.

    As companies face increasing challenges related to cost pressures and consumer expectations, the adoption of digital twin technologies becomes a pivotal opportunity for innovation and enhancing competitive advantage in the evolving landscape. The Supply Chain Digital Twin Market Statistics underscore an optimistic outlook for these applications, fueled by the growing need for real-time monitoring and simulations that can preempt disruptions and optimize resource allocation, making them integral to successful supply chain strategies moving forward.

    Source: Primary Research, Secondary Research, Market Research Future Database and Analyst Review

    Supply Chain Digital Twin Market Technology Insights

    The Supply Chain Digital Twin Market, valued at 5.76 USD Billion in 2023, is undergoing substantial transformation driven by advancements in technology. Each technological segment plays a crucial role in enhancing operational efficiency across supply chains. The Internet of Things (IoT) connects various assets, ensuring real-time data collection and monitoring, which significantly boosts supply chain transparency. Artificial Intelligence (AI) automates decision-making processes, allowing companies to respond swiftly to market fluctuations and enhancing agility.

    Machine Learning technologies further refine predictive analytics capabilities, enabling better forecasting and optimization of resources. Big Data Analytics facilitates the processing of vast quantities of data generated throughout the supply chain, leading to actionable insights. The integration of these technologies creates a digital twin that mirrors physical operations, enabling companies to simulate scenarios and improve resource allocation. This collaboration among diverse technologies forms a foundation for the market's expected growth, driven by the need for enhanced efficiency and responsiveness in an increasingly complex supply chain landscape.

    Overall, the focus on technological advancements within the Supply Chain Digital Twin Market is pivotal in realizing its full potential and addressing evolving industry demands.

    Supply Chain Digital Twin Market End Use Insights

    The Supply Chain Digital Twin Market is positioned for substantial growth, projected to reach a valuation of 5.76 USD billion by 2023. This market is driven by several end-use sectors including Automotive, Aerospace, Consumer Goods, and Pharmaceuticals, each playing a crucial role in the overall ecosystem. Automotive is significant due to its reliance on precision and optimization in production processes, while the Aerospace sector utilizes digital twins to improve operational efficiency and compliance with stringent regulations. The Consumer Goods segment is vital as it enhances customer satisfaction through better supply chain visibility and responsiveness.

    Lastly, Pharmaceuticals benefit by ensuring compliance and reducing lead times in drug development and distribution. The continuous integration of data analytics and IoT in these industries significantly contributes to the market's potential, resulting in robust Supply Chain Digital Twin Market revenue growth and robust Supply Chain Digital Twin Market statistics. Furthermore, the ongoing technological advancements and a shift towards automation are expected to provide lucrative opportunities while navigating challenges like data security and integration complexities in supply chain processes.

    Supply Chain Digital Twin Market Deployment Mode Insights

    The Supply Chain Digital Twin Market is witnessing robust growth in the Deployment Mode segment, which plays a crucial role in enhancing supply chain efficiency and operational accuracy. As of 2023, the market is valued at 5.76 USD Billion, and the substantial demand for digital twins has been reflected in the increasing adoption of various deployment methods. The predominant methods include Cloud and On-Premises deployment, with Cloud solutions being particularly significant due to their scalability and flexibility, allowing businesses to adapt swiftly to changing market conditions.

    On-Premises solutions are also vital, especially for organizations that prioritize data security and control. This diverse deployment landscape meets the needs of various industries, contributing to the market growth and appealing to a wide range of end-users. Supply Chain Digital Twin Market statistics indicate a shift towards cloud-based solutions that facilitate real-time data analysis and reporting, enhancing decision-making processes while minimizing operational risks. The dynamics within this segment showcase opportunities driven by technology advancements and increasing digital transformation initiatives among enterprises, creating a solid foundation for future growth.

    Get more detailed insights about Supply Chain Digital Twin Market Research Report — Global Forecast till 2034

    Regional Insights

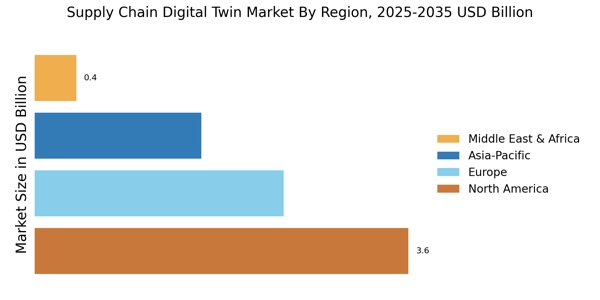
    The Supply Chain Digital Twin Market is expected to reach a valuation of 5.76 USD Billion in 2023, with notable contributions from various regions. North America dominates this sector, holding a significant share valued at 2.1 USD Billion in 2023, which is projected to rise to 10.5 USD Billion by 2032. This region's growth is fueled by advanced technology adoption and strong industrial infrastructure. Europe follows with a market value of 1.5 USD Billion in 2023, anticipated to grow to 6.8 USD Billion by 2032, driven by increasing demand for digital solutions in supply chain optimization.

    The APAC region is valued at 1.4 USD Billion in 2023, with a forecasted increase to 5.7 USD Billion by 2032, reflecting the rapid digital transformation in emerging economies. In South America, the market stands at 0.3 USD Billion, projected to reach 1.5 USD Billion by 2032, while the MEA region, valued at 0.46 USD Billion in 2023, is expected to grow to 1.5 USD Billion, showcasing gradual but steady growth due to rising industrial sectors.

    The Supply Chain Digital Twin Market statistics reflect a strong push toward innovation across regional markets, with opportunities arising from advancements in AI and IoT technologies supporting the industry's expansion.

    Supply Chain Digital Twin Market Regional Insights

    Source: Primary Research, Secondary Research, Market Research Future Database and Analyst Review

    Key Players and Competitive Insights

    The Supply Chain Digital Twin Market is a rapidly evolving sector that leverages advanced technologies to create virtual representations of physical supply chain components. This market is characterized by the integration of IoT, AI, and data analytics to enhance visibility, agility, and efficiency across supply chains. As industries increasingly recognize the value of digital twins for simulation, monitoring, and optimization, competition within this market has intensified. Companies are actively investing in research and development to improve their offerings, cater to diverse customer needs, and stay ahead of competitors.

    The dynamics in this market are influenced by various factors, including technological advancements, regulatory frameworks, customer expectations, and the growing demand for sustainable practices. The emergence of innovative solutions is fostering a landscape where companies can differentiate themselves based on their capabilities and expertise in supply chain management.

    Microsoft has established a significant presence in the Supply Chain Digital Twin Market, primarily by integrating its cloud and AI technologies to deliver advanced analytical solutions. The company leverages its robust Azure platform combined with machine learning and data visualization tools to create detailed digital representations of supply chains. This capability allows organizations to gain insights into their operations, predict disruptions, and enhance decision-making processes. Microsoft’s extensive ecosystem supports seamless connectivity across various supply chain elements, enabling businesses to operate with greater agility and responsiveness.

    The synergy between Microsoft’s technologies and its commitment to innovation positions the company as a formidable player in this evolving market, allowing it to provide comprehensive digital twin solutions tailored to enhance supply chain resilience and performance.

    Oracle has made noteworthy strides in the Supply Chain Digital Twin Market, focusing on delivering comprehensive enterprise resource planning and supply chain management solutions. The company emphasizes the use of artificial intelligence and machine learning capabilities to develop dynamic digital twins that provide real-time insights into supply chain operations. Oracle’s robust applications offer a unified platform that allows organizations to model, monitor, and optimize their supply chain processes effectively. The combination of Oracle's advanced technologies with its rich experience in enterprise solutions enables clients to achieve enhanced visibility, predictive capabilities, and strategic agility.

    By integrating digital twin technology into its broader suite of cloud applications, Oracle continues to strengthen its market position, providing organizations with the tools they require to navigate the complexities of modern supply chains while driving innovation and efficiency.

    Key Companies in the Supply Chain Digital Twin Market market include

    Industry Developments

    In recent months, the Supply Chain Digital Twin Market has witnessed significant developments, particularly as major players like Microsoft, Oracle, and IBM ramp up their investments in digital twin technologies to enhance operational efficiency. The market has been propelled by the increasing demand for real-time analytics and predictive maintenance. Notably, Honeywell and Siemens have collaborated on integrating their digital twin solutions to provide advanced capabilities for monitoring assets throughout their lifecycle. Furthermore, Amazon Web Services has made strides in cloud-based digital twin platforms, enabling businesses to simulate and optimize their supply chain processes effectively.

    The trend of mergers and acquisitions is also prominent, with Rockwell Automation acquiring a smaller tech firm to augment its digital twin capabilities. Similarly, Dassault Systmes has expanded its portfolio through strategic partnerships, enhancing its offerings in the supply chain domain. These moves collectively reflect a dynamic landscape where companies are striving to bolster their digital twin capabilities to meet the growing demands of efficiency and sustainability in supply chain management, contributing to an optimistic market valuation and growth trajectory for the sector.

    Future Outlook

    Supply Chain Digital Twin Market Future Outlook

    The Supply Chain Digital Twin Market is poised for growth at a 19.48% CAGR from 2024 to 2035, driven by advancements in AI, IoT integration, and demand for operational efficiency.

    New opportunities lie in:

    • Develop AI-driven predictive analytics tools for supply chain optimization.
    • Implement blockchain technology to enhance data security and transparency.
    • Create customizable digital twin solutions tailored for specific industry needs.

    By 2035, the Supply Chain Digital Twin Market is expected to achieve substantial growth, reflecting its critical role in global supply chain management.

    Market Segmentation

    Supply Chain Digital Twin Market End Use Outlook

    • Cloud
    • On-Premises

    Supply Chain Digital Twin Market Regional Outlook

    • North America
    • Europe
    • South America
    • Asia Pacific
    • Middle East and Africa

    Supply Chain Digital Twin Market Technology Outlook

    • Automotive
    • Aerospace
    • Consumer Goods
    • Pharmaceuticals

    Supply Chain Digital Twin Market Application Outlook

    • Internet of Things
    • Artificial Intelligence
    • Machine Learning
    • Big Data Analytics

    Supply Chain Digital Twin Market Deployment Mode Outlook

    • North America
    • Europe
    • South America
    • Asia Pacific
    • Middle East and Africa

    Report Scope

    Report Attribute/Metric Details
    Market Size 2024 7.97 (USD Billion)
    Market Size 2025 9.39 (USD Billion)
    Market Size 2034 40.78 (USD Billion)
    Compound Annual Growth Rate (CAGR) 17.72% (2025 - 2034)
    Report Coverage Revenue Forecast, Competitive Landscape, Growth Factors, and Trends
    Base Year 2024
    Market Forecast Period 2025 - 2034
    Historical Data 2019 - 2023
    Market Forecast Units USD Billion
    Key Companies Profiled Microsoft, Oracle, Honeywell, Amazon Web Services, Rockwell Automation, Bentley Systems, IBM, Dassault Systemes, Siemens, PTC, Cisco, Altair, SAP, General Electric, Ansys
    Segments Covered Application, Technology, End Use, Deployment Mode, Regional
    Key Market Opportunities Real-time supply chain visibility, Enhanced predictive analytics capabilities, Improved risk management strategies, Integration with IoT technologies, Increased focus on sustainability solutions
    Key Market Dynamics increased demand for real-time analytics, growing adoption of IoT technologies, need for supply chain resilience, rising focus on sustainability, integration with AI and machine learning
    Countries Covered North America, Europe, APAC, South America, MEA

    Market Highlights

    Author
    Aarti Dhapte
    Team Lead - Research

    She holds an experience of about 6+ years in Market Research and Business Consulting, working under the spectrum of Information Communication Technology, Telecommunications and Semiconductor domains. Aarti conceptualizes and implements a scalable business strategy and provides strategic leadership to the clients. Her expertise lies in market estimation, competitive intelligence, pipeline analysis, customer assessment, etc.

    Leave a Comment

    FAQs

    What is the expected market size of the Supply Chain Digital Twin Market in 2034?

    The market is expected to be valued at 40.18 USD Billion in 2034.

    What is the expected CAGR for the Supply Chain Digital Twin Market from 2025 to 2034?

    The expected CAGR for the market is 17.72% from 2025 to 2034.

    Which region is projected to dominate the Supply Chain Digital Twin Market by 2032?

    North America is projected to dominate the market with a valuation of 10.5 USD Billion in 2032.

    What will be the market value for the Manufacturing application in the Supply Chain Digital Twin Market by 2032?

    The Manufacturing application is projected to reach a market value of 8.5 USD Billion by 2032.

    How much is the Healthcare application expected to be valued in the Supply Chain Digital Twin Market by 2032?

    The Healthcare application is expected to be valued at 6.0 USD Billion in 2032.

    Who are the key players in the Supply Chain Digital Twin Market?

    Major players include Microsoft, Oracle, Honeywell, and Amazon Web Services among others.

    What is the market size for the Logistics application in 2023?

    The Logistics application is valued at 1.15 USD Billion in 2023.

    What will be the projected market size for the European region by 2032?

    The European market size is projected to reach 6.8 USD Billion by 2032.

    What is the expected market value for the Retail application in 2032?

    The Retail application is expected to be valued at 5.5 USD Billion by 2032.

    How much is the South American segment expected to grow by 2032?

    The South American segment is expected to grow to a market value of 1.5 USD Billion by 2032.

    1. 'TABLE OF CONTENTS
    2. EXECUTIVE SUMMARY
    3. Market Overview
      1. Key Findings
      2. Market Segmentation
    4. Competitive Landscape
      1. Challenges and Opportunities
      2. Future Outlook
    5. MARKET INTRODUCTION
      1. Definition
      2. Scope of the study
        1. Research Objective
        2. Assumption
        3. Limitations
    6. RESEARCH METHODOLOGY
      1. Overview
    7. Data Mining
      1. Secondary Research
      2. Primary Research
    8. Primary Interviews and Information Gathering Process
      1. Breakdown of Primary
    9. Respondents
      1. Forecasting Model
      2. Market Size Estimation
    10. Bottom-Up Approach
      1. Top-Down Approach
      2. Data Triangulation
      3. Validation
    11. MARKET DYNAMICS
      1. Overview
      2. Drivers
      3. Restraints
      4. Opportunities
    12. MARKET FACTOR ANALYSIS
      1. Value chain Analysis
      2. Porter''s Five Forces
    13. Analysis
      1. Bargaining Power of Suppliers
        1. Bargaining Power
    14. of Buyers
      1. Threat of New Entrants
        1. Threat of Substitutes
        2. Intensity of Rivalry
      2. COVID-19 Impact Analysis
    15. Market Impact Analysis
      1. Regional Impact
        1. Opportunity and
    16. Threat Analysis
    17. SUPPLY CHAIN DIGITAL TWIN MARKET, BY
    18. APPLICATION (USD BILLION)
      1. Manufacturing
      2. Logistics
    19. Retail
      1. Healthcare
    20. SUPPLY CHAIN DIGITAL TWIN MARKET, BY TECHNOLOGY
    21. (USD BILLION)
      1. Internet of Things
      2. Artificial Intelligence
      3. Machine Learning
      4. Big Data Analytics
    22. SUPPLY CHAIN DIGITAL
    23. TWIN MARKET, BY END USE (USD BILLION)
      1. Automotive
      2. Aerospace
      3. Consumer Goods
      4. Pharmaceuticals
    24. SUPPLY CHAIN DIGITAL
    25. TWIN MARKET, BY DEPLOYMENT MODE (USD BILLION)
      1. Cloud
      2. On-Premises
    26. SUPPLY CHAIN DIGITAL TWIN MARKET, BY REGIONAL (USD BILLION)
    27. North America
      1. US
        1. Canada
      2. Europe
    28. Germany
      1. UK
        1. France
        2. Russia
    29. Italy
      1. Spain
        1. Rest of Europe
      2. APAC
    30. China
      1. India
        1. Japan
        2. South Korea
    31. Malaysia
      1. Thailand
        1. Indonesia
        2. Rest of APAC
      2. South America
        1. Brazil
        2. Mexico
    32. Argentina
      1. Rest of South America
      2. MEA
        1. GCC
    33. Countries
      1. South Africa
        1. Rest of MEA
    34. COMPETITIVE LANDSCAPE
      1. Overview
      2. Competitive Analysis
      3. Market share Analysis
      4. Major Growth Strategy in the Supply
    35. Chain Digital Twin Market
      1. Competitive Benchmarking
      2. Leading
    36. Players in Terms of Number of Developments in the Supply Chain Digital Twin Market
      1. Key developments and growth strategies
        1. New Product Launch/Service
    37. Deployment
      1. Merger & Acquisitions
        1. Joint Ventures
      2. Major Players Financial Matrix
        1. Sales and Operating Income
        2. Major Players R&D Expenditure. 2023
    38. COMPANY PROFILES
      1. Microsoft
        1. Financial Overview
        2. Products Offered
        3. Key Developments
        4. SWOT Analysis
        5. Key Strategies
      2. Oracle
        1. Financial Overview
        2. Products Offered
        3. Key Developments
        4. SWOT Analysis
        5. Key Strategies
      3. Honeywell
        1. Financial Overview
        2. Products Offered
        3. Key Developments
        4. SWOT Analysis
        5. Key Strategies
      4. Amazon Web Services
        1. Financial Overview
        2. Products
    39. Offered
      1. Key Developments
        1. SWOT Analysis
    40. Key Strategies
      1. Rockwell Automation
        1. Financial Overview
        2. Products Offered
        3. Key Developments
        4. SWOT
    41. Analysis
      1. Key Strategies
      2. Bentley Systems
    42. Financial Overview
      1. Products Offered
        1. Key Developments
        2. SWOT Analysis
        3. Key Strategies
      2. IBM
    43. Financial Overview
      1. Products Offered
        1. Key Developments
        2. SWOT Analysis
        3. Key Strategies
      2. Dassault Systemes
        1. Financial Overview
        2. Products Offered
        3. Key
    44. Developments
      1. SWOT Analysis
        1. Key Strategies
    45. Siemens
      1. Financial Overview
        1. Products Offered
    46. Key Developments
      1. SWOT Analysis
        1. Key Strategies
    47. PTC
      1. Financial Overview
        1. Products Offered
    48. Key Developments
      1. SWOT Analysis
        1. Key Strategies
      2. Cisco
        1. Financial Overview
        2. Products Offered
        3. Key Developments
        4. SWOT Analysis
        5. Key
    49. Strategies
      1. Altair
        1. Financial Overview
    50. Products Offered
      1. Key Developments
        1. SWOT Analysis
        2. Key Strategies
      2. SAP
        1. Financial Overview
        2. Products Offered
        3. Key Developments
        4. SWOT
    51. Analysis
      1. Key Strategies
      2. General Electric
    52. Financial Overview
      1. Products Offered
        1. Key Developments
        2. SWOT Analysis
        3. Key Strategies
      2. Ansys
        1. Financial Overview
        2. Products Offered
        3. Key
    53. Developments
      1. SWOT Analysis
        1. Key Strategies
      2. References
      3. Related Reports
    54. TWIN MARKET SIZE ESTIMATES & FORECAST, BY APPLICATION, 2019-2032 (USD BILLIONS)
    55. FORECAST, BY TECHNOLOGY, 2019-2032 (USD BILLIONS)
    56. CHAIN DIGITAL TWIN MARKET SIZE ESTIMATES & FORECAST, BY END USE, 2019-2032 (USD
    57. BILLIONS)
    58. & FORECAST, BY DEPLOYMENT MODE, 2019-2032 (USD BILLIONS)
    59. AMERICA SUPPLY CHAIN DIGITAL TWIN MARKET SIZE ESTIMATES & FORECAST, BY REGIONAL,
    60. 2032 (USD BILLIONS)
    61. ESTIMATES & FORECAST, BY APPLICATION, 2019-2032 (USD BILLIONS)
    62. US SUPPLY CHAIN DIGITAL TWIN MARKET SIZE ESTIMATES & FORECAST, BY TECHNOLOGY,
    63. 2032 (USD BILLIONS)
    64. ESTIMATES & FORECAST, BY END USE, 2019-2032 (USD BILLIONS)
    65. SUPPLY CHAIN DIGITAL TWIN MARKET SIZE ESTIMATES & FORECAST, BY DEPLOYMENT MODE,
    66. 2032 (USD BILLIONS)
    67. ESTIMATES & FORECAST, BY REGIONAL, 2019-2032 (USD BILLIONS)
    68. CANADA SUPPLY CHAIN DIGITAL TWIN MARKET SIZE ESTIMATES & FORECAST, BY APPLICATION,
    69. 2032 (USD BILLIONS)
    70. SIZE ESTIMATES & FORECAST, BY TECHNOLOGY, 2019-2032 (USD BILLIONS)
    71. CANADA SUPPLY CHAIN DIGITAL TWIN MARKET SIZE ESTIMATES & FORECAST, BY END
    72. USE, 2019-2032 (USD BILLIONS)
    73. SIZE ESTIMATES & FORECAST, BY DEPLOYMENT MODE, 2019-2032 (USD BILLIONS)
    74. BY REGIONAL, 2019-2032 (USD BILLIONS)
    75. TWIN MARKET SIZE ESTIMATES & FORECAST, BY APPLICATION, 2019-2032 (USD BILLIONS)
    76. BY TECHNOLOGY, 2019-2032 (USD BILLIONS)
    77. TWIN MARKET SIZE ESTIMATES & FORECAST, BY END USE, 2019-2032 (USD BILLIONS)
    78. BY DEPLOYMENT MODE, 2019-2032 (USD BILLIONS)
    79. DIGITAL TWIN MARKET SIZE ESTIMATES & FORECAST, BY REGIONAL, 2019-2032 (USD BILLIONS)
    80. BY APPLICATION, 2019-2032 (USD BILLIONS)
    81. TWIN MARKET SIZE ESTIMATES & FORECAST, BY TECHNOLOGY, 2019-2032 (USD BILLIONS)
    82. BY END USE, 2019-2032 (USD BILLIONS)
    83. TWIN MARKET SIZE ESTIMATES & FORECAST, BY DEPLOYMENT MODE, 2019-2032 (USD BILLIONS)
    84. BY REGIONAL, 2019-2032 (USD BILLIONS)
    85. MARKET SIZE ESTIMATES & FORECAST, BY APPLICATION, 2019-2032 (USD BILLIONS)
    86. TECHNOLOGY, 2019-2032 (USD BILLIONS)
    87. MARKET SIZE ESTIMATES & FORECAST, BY END USE, 2019-2032 (USD BILLIONS)
    88. UK SUPPLY CHAIN DIGITAL TWIN MARKET SIZE ESTIMATES & FORECAST, BY DEPLOYMENT
    89. MODE, 2019-2032 (USD BILLIONS)
    90. SIZE ESTIMATES & FORECAST, BY REGIONAL, 2019-2032 (USD BILLIONS)
    91. FRANCE SUPPLY CHAIN DIGITAL TWIN MARKET SIZE ESTIMATES & FORECAST, BY APPLICATION,
    92. 2032 (USD BILLIONS)
    93. SIZE ESTIMATES & FORECAST, BY TECHNOLOGY, 2019-2032 (USD BILLIONS)
    94. FRANCE SUPPLY CHAIN DIGITAL TWIN MARKET SIZE ESTIMATES & FORECAST, BY END
    95. USE, 2019-2032 (USD BILLIONS)
    96. SIZE ESTIMATES & FORECAST, BY DEPLOYMENT MODE, 2019-2032 (USD BILLIONS)
    97. BY REGIONAL, 2019-2032 (USD BILLIONS)
    98. TWIN MARKET SIZE ESTIMATES & FORECAST, BY APPLICATION, 2019-2032 (USD BILLIONS)
    99. BY TECHNOLOGY, 2019-2032 (USD BILLIONS)
    100. TWIN MARKET SIZE ESTIMATES & FORECAST, BY END USE, 2019-2032 (USD BILLIONS)
    101. BY DEPLOYMENT MODE, 2019-2032 (USD BILLIONS)
    102. DIGITAL TWIN MARKET SIZE ESTIMATES & FORECAST, BY REGIONAL, 2019-2032 (USD BILLIONS)
    103. BY APPLICATION, 2019-2032 (USD BILLIONS)
    104. TWIN MARKET SIZE ESTIMATES & FORECAST, BY TECHNOLOGY, 2019-2032 (USD BILLIONS)
    105. BY END USE, 2019-2032 (USD BILLIONS)
    106. TWIN MARKET SIZE ESTIMATES & FORECAST, BY DEPLOYMENT MODE, 2019-2032 (USD BILLIONS)
    107. BY REGIONAL, 2019-2032 (USD BILLIONS)
    108. TWIN MARKET SIZE ESTIMATES & FORECAST, BY APPLICATION, 2019-2032 (USD BILLIONS)
    109. BY TECHNOLOGY, 2019-2032 (USD BILLIONS)
    110. TWIN MARKET SIZE ESTIMATES & FORECAST, BY END USE, 2019-2032 (USD BILLIONS)
    111. BY DEPLOYMENT MODE, 2019-2032 (USD BILLIONS)
    112. DIGITAL TWIN MARKET SIZE ESTIMATES & FORECAST, BY REGIONAL, 2019-2032 (USD BILLIONS)
    113. FORECAST, BY APPLICATION, 2019-2032 (USD BILLIONS)
    114. SUPPLY CHAIN DIGITAL TWIN MARKET SIZE ESTIMATES & FORECAST, BY TECHNOLOGY, 2019-2032
    115. (USD BILLIONS)
    116. ESTIMATES & FORECAST, BY END USE, 2019-2032 (USD BILLIONS)
    117. OF EUROPE SUPPLY CHAIN DIGITAL TWIN MARKET SIZE ESTIMATES & FORECAST, BY DEPLOYMENT
    118. MODE, 2019-2032 (USD BILLIONS)
    119. TWIN MARKET SIZE ESTIMATES & FORECAST, BY REGIONAL, 2019-2032 (USD BILLIONS)
    120. BY APPLICATION, 2019-2032 (USD BILLIONS)
    121. TWIN MARKET SIZE ESTIMATES & FORECAST, BY TECHNOLOGY, 2019-2032 (USD BILLIONS)
    122. BY END USE, 2019-2032 (USD BILLIONS)
    123. MARKET SIZE ESTIMATES & FORECAST, BY DEPLOYMENT MODE, 2019-2032 (USD BILLIONS)
    124. BY REGIONAL, 2019-2032 (USD BILLIONS)
    125. TWIN MARKET SIZE ESTIMATES & FORECAST, BY APPLICATION, 2019-2032 (USD BILLIONS)
    126. BY TECHNOLOGY, 2019-2032 (USD BILLIONS)
    127. TWIN MARKET SIZE ESTIMATES & FORECAST, BY END USE, 2019-2032 (USD BILLIONS)
    128. BY DEPLOYMENT MODE, 2019-2032 (USD BILLIONS)
    129. DIGITAL TWIN MARKET SIZE ESTIMATES & FORECAST, BY REGIONAL, 2019-2032 (USD BILLIONS)
    130. BY APPLICATION, 2019-2032 (USD BILLIONS)
    131. TWIN MARKET SIZE ESTIMATES & FORECAST, BY TECHNOLOGY, 2019-2032 (USD BILLIONS)
    132. BY END USE, 2019-2032 (USD BILLIONS)
    133. TWIN MARKET SIZE ESTIMATES & FORECAST, BY DEPLOYMENT MODE, 2019-2032 (USD BILLIONS)
    134. BY REGIONAL, 2019-2032 (USD BILLIONS)
    135. TWIN MARKET SIZE ESTIMATES & FORECAST, BY APPLICATION, 2019-2032 (USD BILLIONS)
    136. BY TECHNOLOGY, 2019-2032 (USD BILLIONS)
    137. TWIN MARKET SIZE ESTIMATES & FORECAST, BY END USE, 2019-2032 (USD BILLIONS)
    138. BY DEPLOYMENT MODE, 2019-2032 (USD BILLIONS)
    139. DIGITAL TWIN MARKET SIZE ESTIMATES & FORECAST, BY REGIONAL, 2019-2032 (USD BILLIONS)
    140. FORECAST, BY APPLICATION, 2019-2032 (USD BILLIONS)
    141. CHAIN DIGITAL TWIN MARKET SIZE ESTIMATES & FORECAST, BY TECHNOLOGY, 2019-2032
    142. (USD BILLIONS)
    143. ESTIMATES & FORECAST, BY END USE, 2019-2032 (USD BILLIONS)
    144. KOREA SUPPLY CHAIN DIGITAL TWIN MARKET SIZE ESTIMATES & FORECAST, BY DEPLOYMENT
    145. MODE, 2019-2032 (USD BILLIONS)
    146. TWIN MARKET SIZE ESTIMATES & FORECAST, BY REGIONAL, 2019-2032 (USD BILLIONS)
    147. BY APPLICATION, 2019-2032 (USD BILLIONS)
    148. TWIN MARKET SIZE ESTIMATES & FORECAST, BY TECHNOLOGY, 2019-2032 (USD BILLIONS)
    149. BY END USE, 2019-2032 (USD BILLIONS)
    150. TWIN MARKET SIZE ESTIMATES & FORECAST, BY DEPLOYMENT MODE, 2019-2032 (USD BILLIONS)
    151. BY REGIONAL, 2019-2032 (USD BILLIONS)
    152. TWIN MARKET SIZE ESTIMATES & FORECAST, BY APPLICATION, 2019-2032 (USD BILLIONS)
    153. BY TECHNOLOGY, 2019-2032 (USD BILLIONS)
    154. TWIN MARKET SIZE ESTIMATES & FORECAST, BY END USE, 2019-2032 (USD BILLIONS)
    155. BY DEPLOYMENT MODE, 2019-2032 (USD BILLIONS)
    156. DIGITAL TWIN MARKET SIZE ESTIMATES & FORECAST, BY REGIONAL, 2019-2032 (USD BILLIONS)
    157. FORECAST, BY APPLICATION, 2019-2032 (USD BILLIONS)
    158. CHAIN DIGITAL TWIN MARKET SIZE ESTIMATES & FORECAST, BY TECHNOLOGY, 2019-2032
    159. (USD BILLIONS)
    160. & FORECAST, BY END USE, 2019-2032 (USD BILLIONS)
    161. CHAIN DIGITAL TWIN MARKET SIZE ESTIMATES & FORECAST, BY DEPLOYMENT MODE, 2019-2032
    162. (USD BILLIONS)
    163. & FORECAST, BY REGIONAL, 2019-2032 (USD BILLIONS)
    164. SUPPLY CHAIN DIGITAL TWIN MARKET SIZE ESTIMATES & FORECAST, BY APPLICATION,
    165. 2032 (USD BILLIONS)
    166. MARKET SIZE ESTIMATES & FORECAST, BY TECHNOLOGY, 2019-2032 (USD BILLIONS)
    167. BY END USE, 2019-2032 (USD BILLIONS)
    168. DIGITAL TWIN MARKET SIZE ESTIMATES & FORECAST, BY DEPLOYMENT MODE, 2019-2032
    169. (USD BILLIONS)
    170. ESTIMATES & FORECAST, BY REGIONAL, 2019-2032 (USD BILLIONS)
    171. SOUTH AMERICA SUPPLY CHAIN DIGITAL TWIN MARKET SIZE ESTIMATES & FORECAST, BY
    172. APPLICATION, 2019-2032 (USD BILLIONS)
    173. DIGITAL TWIN MARKET SIZE ESTIMATES & FORECAST, BY TECHNOLOGY, 2019-2032 (USD
    174. BILLIONS)
    175. & FORECAST, BY END USE, 2019-2032 (USD BILLIONS)
    176. SUPPLY CHAIN DIGITAL TWIN MARKET SIZE ESTIMATES & FORECAST, BY DEPLOYMENT MODE,
    177. 2032 (USD BILLIONS)
    178. MARKET SIZE ESTIMATES & FORECAST, BY REGIONAL, 2019-2032 (USD BILLIONS)
    179. BY APPLICATION, 2019-2032 (USD BILLIONS)
    180. TWIN MARKET SIZE ESTIMATES & FORECAST, BY TECHNOLOGY, 2019-2032 (USD BILLIONS)
    181. BY END USE, 2019-2032 (USD BILLIONS)
    182. TWIN MARKET SIZE ESTIMATES & FORECAST, BY DEPLOYMENT MODE, 2019-2032 (USD BILLIONS)
    183. BY REGIONAL, 2019-2032 (USD BILLIONS)
    184. TWIN MARKET SIZE ESTIMATES & FORECAST, BY APPLICATION, 2019-2032 (USD BILLIONS)
    185. BY TECHNOLOGY, 2019-2032 (USD BILLIONS)
    186. TWIN MARKET SIZE ESTIMATES & FORECAST, BY END USE, 2019-2032 (USD BILLIONS)
    187. BY DEPLOYMENT MODE, 2019-2032 (USD BILLIONS)
    188. DIGITAL TWIN MARKET SIZE ESTIMATES & FORECAST, BY REGIONAL, 2019-2032 (USD BILLIONS)
    189. FORECAST, BY APPLICATION, 2019-2032 (USD BILLIONS)
    190. CHAIN DIGITAL TWIN MARKET SIZE ESTIMATES & FORECAST, BY TECHNOLOGY, 2019-2032
    191. (USD BILLIONS)
    192. ESTIMATES & FORECAST, BY END USE, 2019-2032 (USD BILLIONS)
    193. ARGENTINA SUPPLY CHAIN DIGITAL TWIN MARKET SIZE ESTIMATES & FORECAST, BY DEPLOYMENT
    194. MODE, 2019-2032 (USD BILLIONS)
    195. MARKET SIZE ESTIMATES & FORECAST, BY REGIONAL, 2019-2032 (USD BILLIONS)
    196. & FORECAST, BY APPLICATION, 2019-2032 (USD BILLIONS)
    197. SOUTH AMERICA SUPPLY CHAIN DIGITAL TWIN MARKET SIZE ESTIMATES & FORECAST, BY
    198. TECHNOLOGY, 2019-2032 (USD BILLIONS)
    199. CHAIN DIGITAL TWIN MARKET SIZE ESTIMATES & FORECAST, BY END USE, 2019-2032 (USD
    200. BILLIONS)
    201. SIZE ESTIMATES & FORECAST, BY DEPLOYMENT MODE, 2019-2032 (USD BILLIONS)
    202. & FORECAST, BY REGIONAL, 2019-2032 (USD BILLIONS)
    203. CHAIN DIGITAL TWIN MARKET SIZE ESTIMATES & FORECAST, BY APPLICATION, 2019-2032
    204. (USD BILLIONS)
    205. & FORECAST, BY TECHNOLOGY, 2019-2032 (USD BILLIONS)
    206. CHAIN DIGITAL TWIN MARKET SIZE ESTIMATES & FORECAST, BY END USE, 2019-2032 (USD
    207. BILLIONS)
    208. FORECAST, BY DEPLOYMENT MODE, 2019-2032 (USD BILLIONS)
    209. CHAIN DIGITAL TWIN MARKET SIZE ESTIMATES & FORECAST, BY REGIONAL, 2019-2032
    210. (USD BILLIONS)
    211. ESTIMATES & FORECAST, BY APPLICATION, 2019-2032 (USD BILLIONS)
    212. GCC COUNTRIES SUPPLY CHAIN DIGITAL TWIN MARKET SIZE ESTIMATES & FORECAST, BY
    213. TECHNOLOGY, 2019-2032 (USD BILLIONS)
    214. DIGITAL TWIN MARKET SIZE ESTIMATES & FORECAST, BY END USE, 2019-2032 (USD BILLIONS)
    215. FORECAST, BY DEPLOYMENT MODE, 2019-2032 (USD BILLIONS)
    216. SUPPLY CHAIN DIGITAL TWIN MARKET SIZE ESTIMATES & FORECAST, BY REGIONAL, 2019-2032
    217. (USD BILLIONS)
    218. ESTIMATES & FORECAST, BY APPLICATION, 2019-2032 (USD BILLIONS)
    219. SOUTH AFRICA SUPPLY CHAIN DIGITAL TWIN MARKET SIZE ESTIMATES & FORECAST, BY
    220. TECHNOLOGY, 2019-2032 (USD BILLIONS)
    221. DIGITAL TWIN MARKET SIZE ESTIMATES & FORECAST, BY END USE, 2019-2032 (USD BILLIONS)
    222. FORECAST, BY DEPLOYMENT MODE, 2019-2032 (USD BILLIONS)
    223. SUPPLY CHAIN DIGITAL TWIN MARKET SIZE ESTIMATES & FORECAST, BY REGIONAL, 2019-2032
    224. (USD BILLIONS)
    225. ESTIMATES & FORECAST, BY APPLICATION, 2019-2032 (USD BILLIONS)
    226. REST OF MEA SUPPLY CHAIN DIGITAL TWIN MARKET SIZE ESTIMATES & FORECAST, BY TECHNOLOGY,
    227. 2032 (USD BILLIONS)
    228. MARKET SIZE ESTIMATES & FORECAST, BY END USE, 2019-2032 (USD BILLIONS)
    229. REST OF MEA SUPPLY CHAIN DIGITAL TWIN MARKET SIZE ESTIMATES & FORECAST,
    230. BY DEPLOYMENT MODE, 2019-2032 (USD BILLIONS)
    231. CHAIN DIGITAL TWIN MARKET SIZE ESTIMATES & FORECAST, BY REGIONAL, 2019-2032
    232. (USD BILLIONS)
    233. MARKET SYNOPSIS
    234. ANALYSIS
    235. US SUPPLY CHAIN DIGITAL TWIN MARKET ANALYSIS BY END USE
    236. CHAIN DIGITAL TWIN MARKET ANALYSIS BY DEPLOYMENT MODE
    237. CHAIN DIGITAL TWIN MARKET ANALYSIS BY REGIONAL
    238. DIGITAL TWIN MARKET ANALYSIS BY APPLICATION
    239. DIGITAL TWIN MARKET ANALYSIS BY TECHNOLOGY
    240. DIGITAL TWIN MARKET ANALYSIS BY END USE
    241. TWIN MARKET ANALYSIS BY DEPLOYMENT MODE
    242. TWIN MARKET ANALYSIS BY REGIONAL
    243. MARKET ANALYSIS
    244. BY APPLICATION
    245. BY TECHNOLOGY
    246. BY END USE
    247. DEPLOYMENT MODE
    248. BY REGIONAL
    249. UK SUPPLY CHAIN DIGITAL TWIN MARKET ANALYSIS BY DEPLOYMENT MODE
    250. UK SUPPLY CHAIN DIGITAL TWIN MARKET ANALYSIS BY REGIONAL
    251. SUPPLY CHAIN DIGITAL TWIN MARKET ANALYSIS BY APPLICATION
    252. SUPPLY CHAIN DIGITAL TWIN MARKET ANALYSIS BY TECHNOLOGY
    253. SUPPLY CHAIN DIGITAL TWIN MARKET ANALYSIS BY END USE
    254. CHAIN DIGITAL TWIN MARKET ANALYSIS BY DEPLOYMENT MODE
    255. CHAIN DIGITAL TWIN MARKET ANALYSIS BY REGIONAL
    256. DIGITAL TWIN MARKET ANALYSIS BY APPLICATION
    257. DIGITAL TWIN MARKET ANALYSIS BY TECHNOLOGY
    258. DIGITAL TWIN MARKET ANALYSIS BY END USE
    259. TWIN MARKET ANALYSIS BY DEPLOYMENT MODE
    260. TWIN MARKET ANALYSIS BY REGIONAL
    261. MARKET ANALYSIS BY APPLICATION
    262. MARKET ANALYSIS BY TECHNOLOGY
    263. ANALYSIS BY END USE
    264. BY DEPLOYMENT MODE
    265. BY REGIONAL
    266. APPLICATION
    267. TECHNOLOGY
    268. USE
    269. MODE
    270. USE
    271. DEPLOYMENT MODE
    272. ANALYSIS BY REGIONAL
    273. CHINA SUPPLY CHAIN DIGITAL TWIN MARKET ANALYSIS BY DEPLOYMENT MODE
    274. CHINA SUPPLY CHAIN DIGITAL TWIN MARKET ANALYSIS BY REGIONAL
    275. INDIA SUPPLY CHAIN DIGITAL TWIN MARKET ANALYSIS BY APPLICATION
    276. INDIA SUPPLY CHAIN DIGITAL TWIN MARKET ANALYSIS BY TECHNOLOGY
    277. SUPPLY CHAIN DIGITAL TWIN MARKET ANALYSIS BY END USE
    278. CHAIN DIGITAL TWIN MARKET ANALYSIS BY DEPLOYMENT MODE
    279. CHAIN DIGITAL TWIN MARKET ANALYSIS BY REGIONAL
    280. DIGITAL TWIN MARKET ANALYSIS BY APPLICATION
    281. DIGITAL TWIN MARKET ANALYSIS BY TECHNOLOGY
    282. TWIN MARKET ANALYSIS BY END USE
    283. MARKET ANALYSIS BY DEPLOYMENT MODE
    284. MARKET ANALYSIS BY REGIONAL
    285. MARKET ANALYSIS BY APPLICATION
    286. TWIN MARKET ANALYSIS BY TECHNOLOGY
    287. TWIN MARKET ANALYSIS BY END USE
    288. TWIN MARKET ANALYSIS BY DEPLOYMENT MODE
    289. DIGITAL TWIN MARKET ANALYSIS BY REGIONAL
    290. DIGITAL TWIN MARKET ANALYSIS BY APPLICATION
    291. DIGITAL TWIN MARKET ANALYSIS BY TECHNOLOGY
    292. DIGITAL TWIN MARKET ANALYSIS BY END USE
    293. TWIN MARKET ANALYSIS BY DEPLOYMENT MODE
    294. TWIN MARKET ANALYSIS BY REGIONAL
    295. TWIN MARKET ANALYSIS BY APPLICATION
    296. TWIN MARKET ANALYSIS BY TECHNOLOGY
    297. TWIN MARKET ANALYSIS BY END USE
    298. MARKET ANALYSIS BY DEPLOYMENT MODE
    299. TWIN MARKET ANALYSIS BY REGIONAL
    300. TWIN MARKET ANALYSIS BY APPLICATION
    301. TWIN MARKET ANALYSIS BY TECHNOLOGY
    302. TWIN MARKET ANALYSIS BY END USE
    303. TWIN MARKET ANALYSIS BY DEPLOYMENT MODE
    304. DIGITAL TWIN MARKET ANALYSIS BY REGIONAL
    305. DIGITAL TWIN MARKET ANALYSIS BY APPLICATION
    306. CHAIN DIGITAL TWIN MARKET ANALYSIS BY TECHNOLOGY
    307. CHAIN DIGITAL TWIN MARKET ANALYSIS BY END USE
    308. CHAIN DIGITAL TWIN MARKET ANALYSIS BY DEPLOYMENT MODE
    309. SUPPLY CHAIN DIGITAL TWIN MARKET ANALYSIS BY REGIONAL
    310. SUPPLY CHAIN DIGITAL TWIN MARKET ANALYSIS
    311. TWIN MARKET ANALYSIS BY APPLICATION
    312. TWIN MARKET ANALYSIS BY TECHNOLOGY
    313. TWIN MARKET ANALYSIS BY END USE
    314. MARKET ANALYSIS BY DEPLOYMENT MODE
    315. TWIN MARKET ANALYSIS BY REGIONAL
    316. MARKET ANALYSIS BY APPLICATION
    317. MARKET ANALYSIS BY TECHNOLOGY
    318. MARKET ANALYSIS BY END USE
    319. ANALYSIS BY DEPLOYMENT MODE
    320. ANALYSIS BY REGIONAL
    321. ANALYSIS BY APPLICATION
    322. ANALYSIS BY TECHNOLOGY
    323. ANALYSIS BY END USE
    324. ANALYSIS BY DEPLOYMENT MODE
    325. MARKET ANALYSIS BY REGIONAL
    326. DIGITAL TWIN MARKET ANALYSIS BY APPLICATION
    327. SUPPLY CHAIN DIGITAL TWIN MARKET ANALYSIS BY TECHNOLOGY
    328. SOUTH AMERICA SUPPLY CHAIN DIGITAL TWIN MARKET ANALYSIS BY END USE
    329. REST OF SOUTH AMERICA SUPPLY CHAIN DIGITAL TWIN MARKET ANALYSIS BY DEPLOYMENT
    330. MODE
    331. BY REGIONAL
    332. USE
    333. DEPLOYMENT MODE
    334. ANALYSIS BY REGIONAL
    335. ANALYSIS BY APPLICATION
    336. MARKET ANALYSIS BY TECHNOLOGY
    337. TWIN MARKET ANALYSIS BY END USE
    338. TWIN MARKET ANALYSIS BY DEPLOYMENT MODE
    339. DIGITAL TWIN MARKET ANALYSIS BY REGIONAL
    340. DIGITAL TWIN MARKET ANALYSIS BY APPLICATION
    341. CHAIN DIGITAL TWIN MARKET ANALYSIS BY TECHNOLOGY
    342. CHAIN DIGITAL TWIN MARKET ANALYSIS BY END USE
    343. CHAIN DIGITAL TWIN MARKET ANALYSIS BY DEPLOYMENT MODE
    344. MEA SUPPLY CHAIN DIGITAL TWIN MARKET ANALYSIS BY REGIONAL
    345. BUYING CRITERIA OF SUPPLY CHAIN DIGITAL TWIN MARKET
    346. OF MRFR
    347. DRIVERS IMPACT ANALYSIS: SUPPLY CHAIN DIGITAL TWIN MARKET
    348. RESTRAINTS IMPACT ANALYSIS: SUPPLY CHAIN DIGITAL TWIN MARKET
    349. / VALUE CHAIN: SUPPLY CHAIN DIGITAL TWIN MARKET
    350. TWIN MARKET, BY APPLICATION, 2024 (% SHARE)
    351. TWIN MARKET, BY APPLICATION, 2019 TO 2032 (USD Billions)
    352. CHAIN DIGITAL TWIN MARKET, BY TECHNOLOGY, 2024 (% SHARE)
    353. CHAIN DIGITAL TWIN MARKET, BY TECHNOLOGY, 2019 TO 2032 (USD Billions)
    354. SUPPLY CHAIN DIGITAL TWIN MARKET, BY END USE, 2024 (% SHARE)
    355. SUPPLY CHAIN DIGITAL TWIN MARKET, BY END USE, 2019 TO 2032 (USD Billions)
    356. SUPPLY CHAIN DIGITAL TWIN MARKET, BY DEPLOYMENT MODE, 2024 (% SHARE)
    357. SUPPLY CHAIN DIGITAL TWIN MARKET, BY DEPLOYMENT MODE, 2019 TO 2032 (USD Billions)
    358. Billions)

    Supply Chain Digital Twin Market Segmentation


    • Supply Chain Digital Twin Market By Application (USD Billion, 2019-2032)

      • Manufacturing
      • Logistics
      • Retail
      • Healthcare

    • Supply Chain Digital Twin Market By Technology (USD Billion, 2019-2032)

      • Internet of Things
      • Artificial Intelligence
      • Machine Learning
      • Big Data Analytics

    • Supply Chain Digital Twin Market By End Use (USD Billion, 2019-2032)

      • Automotive
      • Aerospace
      • Consumer Goods
      • Pharmaceuticals

    • Supply Chain Digital Twin Market By Deployment Mode (USD Billion, 2019-2032)

      • Cloud
      • On-Premises

    • Supply Chain Digital Twin Market By Regional (USD Billion, 2019-2032)

      • North America
      • Europe
      • South America
      • Asia Pacific
      • Middle East and Africa

    Supply Chain Digital Twin Market Regional Outlook (USD Billion, 2019-2032)


    • North America Outlook (USD Billion, 2019-2032)

      • North America Supply Chain Digital Twin Market by Application Type

        • Manufacturing
        • Logistics
        • Retail
        • Healthcare
      • North America Supply Chain Digital Twin Market by Technology Type

        • Internet of Things
        • Artificial Intelligence
        • Machine Learning
        • Big Data Analytics
      • North America Supply Chain Digital Twin Market by End Use Type

        • Automotive
        • Aerospace
        • Consumer Goods
        • Pharmaceuticals
      • North America Supply Chain Digital Twin Market by Deployment Mode Type

        • Cloud
        • On-Premises
      • North America Supply Chain Digital Twin Market by Regional Type

        • US
        • Canada
      • US Outlook (USD Billion, 2019-2032)
      • US Supply Chain Digital Twin Market by Application Type

        • Manufacturing
        • Logistics
        • Retail
        • Healthcare
      • US Supply Chain Digital Twin Market by Technology Type

        • Internet of Things
        • Artificial Intelligence
        • Machine Learning
        • Big Data Analytics
      • US Supply Chain Digital Twin Market by End Use Type

        • Automotive
        • Aerospace
        • Consumer Goods
        • Pharmaceuticals
      • US Supply Chain Digital Twin Market by Deployment Mode Type

        • Cloud
        • On-Premises
      • CANADA Outlook (USD Billion, 2019-2032)
      • CANADA Supply Chain Digital Twin Market by Application Type

        • Manufacturing
        • Logistics
        • Retail
        • Healthcare
      • CANADA Supply Chain Digital Twin Market by Technology Type

        • Internet of Things
        • Artificial Intelligence
        • Machine Learning
        • Big Data Analytics
      • CANADA Supply Chain Digital Twin Market by End Use Type

        • Automotive
        • Aerospace
        • Consumer Goods
        • Pharmaceuticals
      • CANADA Supply Chain Digital Twin Market by Deployment Mode Type

        • Cloud
        • On-Premises
    • Europe Outlook (USD Billion, 2019-2032)

      • Europe Supply Chain Digital Twin Market by Application Type

        • Manufacturing
        • Logistics
        • Retail
        • Healthcare
      • Europe Supply Chain Digital Twin Market by Technology Type

        • Internet of Things
        • Artificial Intelligence
        • Machine Learning
        • Big Data Analytics
      • Europe Supply Chain Digital Twin Market by End Use Type

        • Automotive
        • Aerospace
        • Consumer Goods
        • Pharmaceuticals
      • Europe Supply Chain Digital Twin Market by Deployment Mode Type

        • Cloud
        • On-Premises
      • Europe Supply Chain Digital Twin Market by Regional Type

        • Germany
        • UK
        • France
        • Russia
        • Italy
        • Spain
        • Rest of Europe
      • GERMANY Outlook (USD Billion, 2019-2032)
      • GERMANY Supply Chain Digital Twin Market by Application Type

        • Manufacturing
        • Logistics
        • Retail
        • Healthcare
      • GERMANY Supply Chain Digital Twin Market by Technology Type

        • Internet of Things
        • Artificial Intelligence
        • Machine Learning
        • Big Data Analytics
      • GERMANY Supply Chain Digital Twin Market by End Use Type

        • Automotive
        • Aerospace
        • Consumer Goods
        • Pharmaceuticals
      • GERMANY Supply Chain Digital Twin Market by Deployment Mode Type

        • Cloud
        • On-Premises
      • UK Outlook (USD Billion, 2019-2032)
      • UK Supply Chain Digital Twin Market by Application Type

        • Manufacturing
        • Logistics
        • Retail
        • Healthcare
      • UK Supply Chain Digital Twin Market by Technology Type

        • Internet of Things
        • Artificial Intelligence
        • Machine Learning
        • Big Data Analytics
      • UK Supply Chain Digital Twin Market by End Use Type

        • Automotive
        • Aerospace
        • Consumer Goods
        • Pharmaceuticals
      • UK Supply Chain Digital Twin Market by Deployment Mode Type

        • Cloud
        • On-Premises
      • FRANCE Outlook (USD Billion, 2019-2032)
      • FRANCE Supply Chain Digital Twin Market by Application Type

        • Manufacturing
        • Logistics
        • Retail
        • Healthcare
      • FRANCE Supply Chain Digital Twin Market by Technology Type

        • Internet of Things
        • Artificial Intelligence
        • Machine Learning
        • Big Data Analytics
      • FRANCE Supply Chain Digital Twin Market by End Use Type

        • Automotive
        • Aerospace
        • Consumer Goods
        • Pharmaceuticals
      • FRANCE Supply Chain Digital Twin Market by Deployment Mode Type

        • Cloud
        • On-Premises
      • RUSSIA Outlook (USD Billion, 2019-2032)
      • RUSSIA Supply Chain Digital Twin Market by Application Type

        • Manufacturing
        • Logistics
        • Retail
        • Healthcare
      • RUSSIA Supply Chain Digital Twin Market by Technology Type

        • Internet of Things
        • Artificial Intelligence
        • Machine Learning
        • Big Data Analytics
      • RUSSIA Supply Chain Digital Twin Market by End Use Type

        • Automotive
        • Aerospace
        • Consumer Goods
        • Pharmaceuticals
      • RUSSIA Supply Chain Digital Twin Market by Deployment Mode Type

        • Cloud
        • On-Premises
      • ITALY Outlook (USD Billion, 2019-2032)
      • ITALY Supply Chain Digital Twin Market by Application Type

        • Manufacturing
        • Logistics
        • Retail
        • Healthcare
      • ITALY Supply Chain Digital Twin Market by Technology Type

        • Internet of Things
        • Artificial Intelligence
        • Machine Learning
        • Big Data Analytics
      • ITALY Supply Chain Digital Twin Market by End Use Type

        • Automotive
        • Aerospace
        • Consumer Goods
        • Pharmaceuticals
      • ITALY Supply Chain Digital Twin Market by Deployment Mode Type

        • Cloud
        • On-Premises
      • SPAIN Outlook (USD Billion, 2019-2032)
      • SPAIN Supply Chain Digital Twin Market by Application Type

        • Manufacturing
        • Logistics
        • Retail
        • Healthcare
      • SPAIN Supply Chain Digital Twin Market by Technology Type

        • Internet of Things
        • Artificial Intelligence
        • Machine Learning
        • Big Data Analytics
      • SPAIN Supply Chain Digital Twin Market by End Use Type

        • Automotive
        • Aerospace
        • Consumer Goods
        • Pharmaceuticals
      • SPAIN Supply Chain Digital Twin Market by Deployment Mode Type

        • Cloud
        • On-Premises
      • REST OF EUROPE Outlook (USD Billion, 2019-2032)
      • REST OF EUROPE Supply Chain Digital Twin Market by Application Type

        • Manufacturing
        • Logistics
        • Retail
        • Healthcare
      • REST OF EUROPE Supply Chain Digital Twin Market by Technology Type

        • Internet of Things
        • Artificial Intelligence
        • Machine Learning
        • Big Data Analytics
      • REST OF EUROPE Supply Chain Digital Twin Market by End Use Type

        • Automotive
        • Aerospace
        • Consumer Goods
        • Pharmaceuticals
      • REST OF EUROPE Supply Chain Digital Twin Market by Deployment Mode Type

        • Cloud
        • On-Premises
    • APAC Outlook (USD Billion, 2019-2032)

      • APAC Supply Chain Digital Twin Market by Application Type

        • Manufacturing
        • Logistics
        • Retail
        • Healthcare
      • APAC Supply Chain Digital Twin Market by Technology Type

        • Internet of Things
        • Artificial Intelligence
        • Machine Learning
        • Big Data Analytics
      • APAC Supply Chain Digital Twin Market by End Use Type

        • Automotive
        • Aerospace
        • Consumer Goods
        • Pharmaceuticals
      • APAC Supply Chain Digital Twin Market by Deployment Mode Type

        • Cloud
        • On-Premises
      • APAC Supply Chain Digital Twin Market by Regional Type

        • China
        • India
        • Japan
        • South Korea
        • Malaysia
        • Thailand
        • Indonesia
        • Rest of APAC
      • CHINA Outlook (USD Billion, 2019-2032)
      • CHINA Supply Chain Digital Twin Market by Application Type

        • Manufacturing
        • Logistics
        • Retail
        • Healthcare
      • CHINA Supply Chain Digital Twin Market by Technology Type

        • Internet of Things
        • Artificial Intelligence
        • Machine Learning
        • Big Data Analytics
      • CHINA Supply Chain Digital Twin Market by End Use Type

        • Automotive
        • Aerospace
        • Consumer Goods
        • Pharmaceuticals
      • CHINA Supply Chain Digital Twin Market by Deployment Mode Type

        • Cloud
        • On-Premises
      • INDIA Outlook (USD Billion, 2019-2032)
      • INDIA Supply Chain Digital Twin Market by Application Type

        • Manufacturing
        • Logistics
        • Retail
        • Healthcare
      • INDIA Supply Chain Digital Twin Market by Technology Type

        • Internet of Things
        • Artificial Intelligence
        • Machine Learning
        • Big Data Analytics
      • INDIA Supply Chain Digital Twin Market by End Use Type

        • Automotive
        • Aerospace
        • Consumer Goods
        • Pharmaceuticals
      • INDIA Supply Chain Digital Twin Market by Deployment Mode Type

        • Cloud
        • On-Premises
      • JAPAN Outlook (USD Billion, 2019-2032)
      • JAPAN Supply Chain Digital Twin Market by Application Type

        • Manufacturing
        • Logistics
        • Retail
        • Healthcare
      • JAPAN Supply Chain Digital Twin Market by Technology Type

        • Internet of Things
        • Artificial Intelligence
        • Machine Learning
        • Big Data Analytics
      • JAPAN Supply Chain Digital Twin Market by End Use Type

        • Automotive
        • Aerospace
        • Consumer Goods
        • Pharmaceuticals
      • JAPAN Supply Chain Digital Twin Market by Deployment Mode Type

        • Cloud
        • On-Premises
      • SOUTH KOREA Outlook (USD Billion, 2019-2032)
      • SOUTH KOREA Supply Chain Digital Twin Market by Application Type

        • Manufacturing
        • Logistics
        • Retail
        • Healthcare
      • SOUTH KOREA Supply Chain Digital Twin Market by Technology Type

        • Internet of Things
        • Artificial Intelligence
        • Machine Learning
        • Big Data Analytics
      • SOUTH KOREA Supply Chain Digital Twin Market by End Use Type

        • Automotive
        • Aerospace
        • Consumer Goods
        • Pharmaceuticals
      • SOUTH KOREA Supply Chain Digital Twin Market by Deployment Mode Type

        • Cloud
        • On-Premises
      • MALAYSIA Outlook (USD Billion, 2019-2032)
      • MALAYSIA Supply Chain Digital Twin Market by Application Type

        • Manufacturing
        • Logistics
        • Retail
        • Healthcare
      • MALAYSIA Supply Chain Digital Twin Market by Technology Type

        • Internet of Things
        • Artificial Intelligence
        • Machine Learning
        • Big Data Analytics
      • MALAYSIA Supply Chain Digital Twin Market by End Use Type

        • Automotive
        • Aerospace
        • Consumer Goods
        • Pharmaceuticals
      • MALAYSIA Supply Chain Digital Twin Market by Deployment Mode Type

        • Cloud
        • On-Premises
      • THAILAND Outlook (USD Billion, 2019-2032)
      • THAILAND Supply Chain Digital Twin Market by Application Type

        • Manufacturing
        • Logistics
        • Retail
        • Healthcare
      • THAILAND Supply Chain Digital Twin Market by Technology Type

        • Internet of Things
        • Artificial Intelligence
        • Machine Learning
        • Big Data Analytics
      • THAILAND Supply Chain Digital Twin Market by End Use Type

        • Automotive
        • Aerospace
        • Consumer Goods
        • Pharmaceuticals
      • THAILAND Supply Chain Digital Twin Market by Deployment Mode Type

        • Cloud
        • On-Premises
      • INDONESIA Outlook (USD Billion, 2019-2032)
      • INDONESIA Supply Chain Digital Twin Market by Application Type

        • Manufacturing
        • Logistics
        • Retail
        • Healthcare
      • INDONESIA Supply Chain Digital Twin Market by Technology Type

        • Internet of Things
        • Artificial Intelligence
        • Machine Learning
        • Big Data Analytics
      • INDONESIA Supply Chain Digital Twin Market by End Use Type

        • Automotive
        • Aerospace
        • Consumer Goods
        • Pharmaceuticals
      • INDONESIA Supply Chain Digital Twin Market by Deployment Mode Type

        • Cloud
        • On-Premises
      • REST OF APAC Outlook (USD Billion, 2019-2032)
      • REST OF APAC Supply Chain Digital Twin Market by Application Type

        • Manufacturing
        • Logistics
        • Retail
        • Healthcare
      • REST OF APAC Supply Chain Digital Twin Market by Technology Type

        • Internet of Things
        • Artificial Intelligence
        • Machine Learning
        • Big Data Analytics
      • REST OF APAC Supply Chain Digital Twin Market by End Use Type

        • Automotive
        • Aerospace
        • Consumer Goods
        • Pharmaceuticals
      • REST OF APAC Supply Chain Digital Twin Market by Deployment Mode Type

        • Cloud
        • On-Premises
    • South America Outlook (USD Billion, 2019-2032)

      • South America Supply Chain Digital Twin Market by Application Type

        • Manufacturing
        • Logistics
        • Retail
        • Healthcare
      • South America Supply Chain Digital Twin Market by Technology Type

        • Internet of Things
        • Artificial Intelligence
        • Machine Learning
        • Big Data Analytics
      • South America Supply Chain Digital Twin Market by End Use Type

        • Automotive
        • Aerospace
        • Consumer Goods
        • Pharmaceuticals
      • South America Supply Chain Digital Twin Market by Deployment Mode Type

        • Cloud
        • On-Premises
      • South America Supply Chain Digital Twin Market by Regional Type

        • Brazil
        • Mexico
        • Argentina
        • Rest of South America
      • BRAZIL Outlook (USD Billion, 2019-2032)
      • BRAZIL Supply Chain Digital Twin Market by Application Type

        • Manufacturing
        • Logistics
        • Retail
        • Healthcare
      • BRAZIL Supply Chain Digital Twin Market by Technology Type

        • Internet of Things
        • Artificial Intelligence
        • Machine Learning
        • Big Data Analytics
      • BRAZIL Supply Chain Digital Twin Market by End Use Type

        • Automotive
        • Aerospace
        • Consumer Goods
        • Pharmaceuticals
      • BRAZIL Supply Chain Digital Twin Market by Deployment Mode Type

        • Cloud
        • On-Premises
      • MEXICO Outlook (USD Billion, 2019-2032)
      • MEXICO Supply Chain Digital Twin Market by Application Type

        • Manufacturing
        • Logistics
        • Retail
        • Healthcare
      • MEXICO Supply Chain Digital Twin Market by Technology Type

        • Internet of Things
        • Artificial Intelligence
        • Machine Learning
        • Big Data Analytics
      • MEXICO Supply Chain Digital Twin Market by End Use Type

        • Automotive
        • Aerospace
        • Consumer Goods
        • Pharmaceuticals
      • MEXICO Supply Chain Digital Twin Market by Deployment Mode Type

        • Cloud
        • On-Premises
      • ARGENTINA Outlook (USD Billion, 2019-2032)
      • ARGENTINA Supply Chain Digital Twin Market by Application Type

        • Manufacturing
        • Logistics
        • Retail
        • Healthcare
      • ARGENTINA Supply Chain Digital Twin Market by Technology Type

        • Internet of Things
        • Artificial Intelligence
        • Machine Learning
        • Big Data Analytics
      • ARGENTINA Supply Chain Digital Twin Market by End Use Type

        • Automotive
        • Aerospace
        • Consumer Goods
        • Pharmaceuticals
      • ARGENTINA Supply Chain Digital Twin Market by Deployment Mode Type

        • Cloud
        • On-Premises
      • REST OF SOUTH AMERICA Outlook (USD Billion, 2019-2032)
      • REST OF SOUTH AMERICA Supply Chain Digital Twin Market by Application Type

        • Manufacturing
        • Logistics
        • Retail
        • Healthcare
      • REST OF SOUTH AMERICA Supply Chain Digital Twin Market by Technology Type

        • Internet of Things
        • Artificial Intelligence
        • Machine Learning
        • Big Data Analytics
      • REST OF SOUTH AMERICA Supply Chain Digital Twin Market by End Use Type

        • Automotive
        • Aerospace
        • Consumer Goods
        • Pharmaceuticals
      • REST OF SOUTH AMERICA Supply Chain Digital Twin Market by Deployment Mode Type

        • Cloud
        • On-Premises
    • MEA Outlook (USD Billion, 2019-2032)

      • MEA Supply Chain Digital Twin Market by Application Type

        • Manufacturing
        • Logistics
        • Retail
        • Healthcare
      • MEA Supply Chain Digital Twin Market by Technology Type

        • Internet of Things
        • Artificial Intelligence
        • Machine Learning
        • Big Data Analytics
      • MEA Supply Chain Digital Twin Market by End Use Type

        • Automotive
        • Aerospace
        • Consumer Goods
        • Pharmaceuticals
      • MEA Supply Chain Digital Twin Market by Deployment Mode Type

        • Cloud
        • On-Premises
      • MEA Supply Chain Digital Twin Market by Regional Type

        • GCC Countries
        • South Africa
        • Rest of MEA
      • GCC COUNTRIES Outlook (USD Billion, 2019-2032)
      • GCC COUNTRIES Supply Chain Digital Twin Market by Application Type

        • Manufacturing
        • Logistics
        • Retail
        • Healthcare
      • GCC COUNTRIES Supply Chain Digital Twin Market by Technology Type

        • Internet of Things
        • Artificial Intelligence
        • Machine Learning
        • Big Data Analytics
      • GCC COUNTRIES Supply Chain Digital Twin Market by End Use Type

        • Automotive
        • Aerospace
        • Consumer Goods
        • Pharmaceuticals
      • GCC COUNTRIES Supply Chain Digital Twin Market by Deployment Mode Type

        • Cloud
        • On-Premises
      • SOUTH AFRICA Outlook (USD Billion, 2019-2032)
      • SOUTH AFRICA Supply Chain Digital Twin Market by Application Type

        • Manufacturing
        • Logistics
        • Retail
        • Healthcare
      • SOUTH AFRICA Supply Chain Digital Twin Market by Technology Type

        • Internet of Things
        • Artificial Intelligence
        • Machine Learning
        • Big Data Analytics
      • SOUTH AFRICA Supply Chain Digital Twin Market by End Use Type

        • Automotive
        • Aerospace
        • Consumer Goods
        • Pharmaceuticals
      • SOUTH AFRICA Supply Chain Digital Twin Market by Deployment Mode Type

        • Cloud
        • On-Premises
      • REST OF MEA Outlook (USD Billion, 2019-2032)
      • REST OF MEA Supply Chain Digital Twin Market by Application Type

        • Manufacturing
        • Logistics
        • Retail
        • Healthcare
      • REST OF MEA Supply Chain Digital Twin Market by Technology Type

        • Internet of Things
        • Artificial Intelligence
        • Machine Learning
        • Big Data Analytics
      • REST OF MEA Supply Chain Digital Twin Market by End Use Type

        • Automotive
        • Aerospace
        • Consumer Goods
        • Pharmaceuticals
      • REST OF MEA Supply Chain Digital Twin Market by Deployment Mode Type

        • Cloud
        • On-Premises
    Report Infographic
    Free Sample Request

    Kindly complete the form below to receive a free sample of this Report

    Customer Strories

    “I am very pleased with how market segments have been defined in a relevant way for my purposes (such as "Portable Freezers & refrigerators" and "last-mile"). In general the report is well structured. Thanks very much for your efforts.”

    Victoria Milne Founder
    Case Study

    Chemicals and Materials