• Cat-intel
  • MedIntelliX
  • Resources
  • About Us
  • Request Free Sample ×

    Kindly complete the form below to receive a free sample of this Report

    Leading companies partner with us for data-driven Insights

    clients tt-cursor

    Solar Power Window Market

    ID: MRFR/E&P/39306-HCR
    128 Pages
    Sejal Akre
    September 2025

    Solar Power Window Market Research Report By Technology (Crystalline Solar, Thin-Film Solar, Perovskite Solar), By Application (Commercial Buildings, Residential Buildings, Transportation), By Transparency Level (Fully Transparent, Semi-Transparent, Tinted), By Power Capacity (Less than 100 W, 100-500 W, 500-1000 W, Over 1000 W) and By Regional (North America, Europe, South America, Asia Pacific, Middle East and Africa) - Forecast to 2034

    Share:
    Download PDF ×

    We do not share your information with anyone. However, we may send you emails based on your report interest from time to time. You may contact us at any time to opt-out.

    Solar Power Window Market Research Report - Global Forecast 2034 Infographic
    Purchase Options
    $ 4,950.0
    $ 5,950.0
    $ 7,250.0
    Table of Contents

    Solar Power Window Market Summary

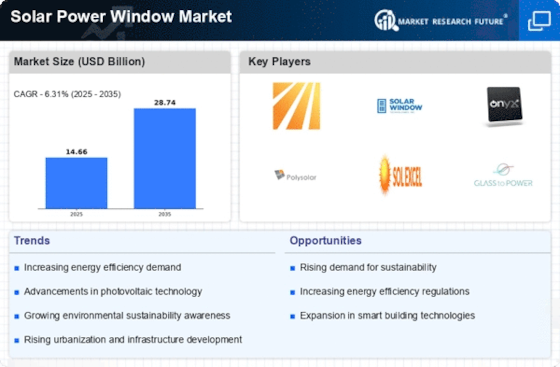
    The Global Solar Power Window Market is projected to grow significantly from 14.7 USD Billion in 2024 to 28.7 USD Billion by 2035.

    Key Market Trends & Highlights

    Solar Power Window Key Trends and Highlights

    • The market is expected to experience a compound annual growth rate (CAGR) of 6.31 percent from 2025 to 2035.
    • By 2035, the market valuation is anticipated to reach 28.7 USD Billion, indicating robust growth potential.
    • In 2024, the market is valued at 14.7 USD Billion, reflecting a strong foundation for future expansion.
    • Growing adoption of solar power technology due to increasing environmental awareness is a major market driver.

    Market Size & Forecast

    2024 Market Size 14.7 (USD Billion)
    2035 Market Size 28.7 (USD Billion)
    CAGR (2025-2035) 6.31%

    Major Players

    Ubiquitous Energy, Physee, Glasshape, SolarWindow Technologies, Inc., Polyera Corporation, Onyx Solar Energy, Magna International Inc., View, Inc., Heliatek GmbH, Elevate Textiles Limited, Eastman Chemical Company, Hanwha Q CELLS, Konarka Technologies, Inc., 3M Company, KYOCERA Corporation, AkzoNobel N.V., AGC Inc., Bridgestone Corporation

    Solar Power Window Market Trends

    There are opportunities available to explore other uses for solar power windows apart from usual residential houses, such as commercial buildings, transportation means, and portable gadgets, among others. This will create room for remote management smart grids and appear with IoT (Internet of Things) applications.

    On the other hand, recent trends suggest heightened interest in visual appeal, where producers offer greater choices in terms of customization and color palette. Research, on the other hand, has been committed to enhancing efficiency in energy conversion reducing glare while improving durability. In addition to this, recent alliances indicate strategic partnerships that promise quick innovations when it comes to expanding product lines offered by different companies.

    The integration of solar power technology into window systems appears to represent a transformative shift in energy efficiency and building design, potentially redefining urban landscapes and reducing reliance on conventional energy sources.

    U.S. Department of Energy

    Solar Power Window Market Drivers

    Market Growth Projections

    The Global Solar Power Window Market Industry is poised for substantial growth, with projections indicating a market value of 14.7 USD Billion in 2024 and 28.7 USD Billion by 2035. This growth trajectory reflects a compound annual growth rate of 6.31% from 2025 to 2035. The increasing adoption of solar technologies, coupled with supportive government policies and rising energy costs, is likely to drive this expansion. As the market evolves, it may witness further innovations and enhancements, solidifying its position within the broader renewable energy landscape.

    Government Incentives and Support

    Government incentives and support are pivotal in propelling the Global Solar Power Window Market Industry forward. Many countries are offering tax credits, rebates, and grants to encourage the installation of solar technologies. Such financial incentives lower the initial investment barrier for consumers and businesses, making solar power windows a more viable option. This supportive regulatory environment is likely to contribute to a compound annual growth rate of 6.31% from 2025 to 2035. As governments prioritize renewable energy, the market is expected to benefit from enhanced funding and policy frameworks.

    Growing Demand for Renewable Energy

    The Global Solar Power Window Market Industry is experiencing a notable surge in demand for renewable energy solutions. This trend is driven by increasing awareness of climate change and the need for sustainable energy sources. Governments worldwide are implementing policies to promote renewable energy, which is likely to enhance the adoption of solar technologies. As a result, the market is projected to reach 14.7 USD Billion in 2024, reflecting a growing inclination towards eco-friendly alternatives. This shift not only aligns with global sustainability goals but also encourages innovation in solar technologies, including solar power windows.

    Technological Advancements in Solar Technology

    Technological advancements play a crucial role in the evolution of the Global Solar Power Window Market Industry. Innovations in photovoltaic materials and energy efficiency are enhancing the performance of solar windows, making them more attractive to consumers and businesses alike. For instance, the development of transparent solar cells allows for energy generation without compromising aesthetics. These advancements are expected to drive market growth, with projections indicating a market value of 28.7 USD Billion by 2035. As technology continues to evolve, it may lead to increased efficiency and reduced costs, further stimulating adoption.

    Rising Energy Costs and Energy Efficiency Awareness

    Rising energy costs are prompting consumers and businesses to seek energy-efficient solutions, thereby benefiting the Global Solar Power Window Market Industry. As electricity prices continue to escalate, the appeal of solar power windows, which can generate energy while serving as functional building materials, becomes increasingly pronounced. This growing awareness of energy efficiency is likely to drive adoption rates, as consumers recognize the long-term savings associated with solar technologies. The market's trajectory suggests that as energy costs rise, the demand for solar power windows will correspondingly increase, reinforcing their role in sustainable energy solutions.

    Increasing Urbanization and Infrastructure Development

    The Global Solar Power Window Market Industry is significantly influenced by increasing urbanization and infrastructure development. As urban areas expand, the demand for energy-efficient buildings rises, leading to a greater interest in solar power windows. These windows not only provide energy generation capabilities but also contribute to building aesthetics and sustainability. In densely populated regions, integrating solar technology into architectural designs is becoming a priority. This trend is likely to drive market growth as urban planners and architects seek innovative solutions to meet energy demands while adhering to sustainability standards.

    Market Segment Insights

    Solar Power Window Market Technology Insights

    The Solar Power Window Market is segmented by technology into crystalline solar, thin-film solar, and perovskite solar. Crystalline solar is the most mature technology, accounting for over 90% of the market in 2023. Thin-film solar is a newer technology that is gaining market share due to its lower cost and flexibility. Perovskite solar is a very new technology that has the potential to be even more efficient than crystalline solar.

    The crystalline solar segment is expected to continue to dominate the market in the coming years, but thin-film solar and perovskite solar are expected to grow at a faster rate.By 2032, thin-film solar is expected to account for over 25% of the market, and perovskite solar is expected to account for over 10%.

    The growth of the solar power window market is being driven by a number of factors, including the increasing demand for renewable energy, the falling cost of solar panels, and the growing awareness of the environmental benefits of solar energy. The market is expected to be driven by the increasing demand for renewable energy and the falling cost of solar panels.

    Here are some additional insights into the technology segment of the solar power window market: Crystalline solar is the most efficient and durable technology, but it is also the most expensive. Thin-film solar is less efficient and durable than crystalline solar, but it is also less expensive. Perovskite solar is a very new technology with the potential to be more efficient than crystalline solar and less expensive than thin-film solar. The choice of technology for a solar power window depends on a number of factors, including the cost, efficiency, durability, and aesthetics.

    Source: Primary Research, Secondary Research, MRFR Database and Analyst Review

    Solar Power Window Market Application Insights

    The Solar Power Window Market segmentation by Application is expected to grow significantly in the coming years, with each segment offering unique growth opportunities. The commercial buildings segment is projected to account for the largest share of the market, due to the increasing demand for energy-efficient solutions in commercial spaces. The residential buildings segment is also expected to witness substantial growth, driven by the rising awareness of the benefits of solar power and government incentives. The transportation segment is expected to gain traction in the coming years, as the demand for electric vehicles and other sustainable transportation solutions increases.

    Solar Power Window Market Transparency Level Insights

    Based on Transparency Level, the market is segmented into fully transparent, semi-transparent, and tinted windows. Fully transparent windows allow the maximum amount of natural light to pass through, while semi-transparent windows provide some level of privacy while still allowing natural light to enter. Tinted windows offer the highest level of privacy but reduce the amount of natural light that can pass through. The fully transparent segment is expected to hold the largest share of the Solar Power Window Market revenue in 2023 due to its ability to provide both natural light and energy savings.

    The semi-transparent segment is expected to grow at a significant rate, as it offers a balance between privacy and natural light. The tinted segment is expected to account for a smaller share of the market, as it offers the least amount of natural light. Key players in the Solar Power Window Market include companies such as Ubiquitous Energy, Physee, and Glasshape. These companies are investing in research and development to improve the efficiency and affordability of solar power windows.

    Solar Power Window Market Power Capacity Insights

    The power capacity segment is a crucial aspect of the Solar Power Window Market segmentation, influencing market growth and industry dynamics. Among the sub-segments, 'Less than 100 W' held the dominant revenue share in 2023, owing to its widespread adoption in residential and small commercial applications. The '100-500 W' segment is projected to exhibit significant growth over the forecast period, driven by increasing demand for solar power windows in commercial buildings and industrial facilities. '500-1000 W' segment is expected to witness a steady growth rate, catering to applications in larger commercial and industrial projects.

    The 'Over 1000 W' segment is anticipated to gain traction in the future, as technological advancements enable the production of high-capacity solar power windows for large-scale projects. Overall, the power capacity segment offers diverse options to meet the varying requirements of different applications, contributing to the growth of the Solar Power Window Market.

    Get more detailed insights about Solar Power Window Market Research Report - Global Forecast 2034

    Regional Insights

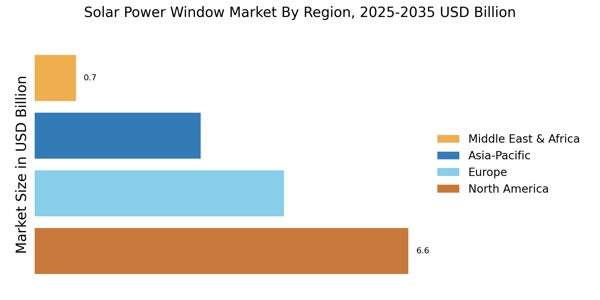
    The regional segmentation of the Solar Power Window Market provides insights into the market's geographic distribution and performance. North America leads the market with a significant share due to the presence of major players and government initiatives promoting clean energy. Europe follows closely, driven by stringent environmental regulations and increasing demand for energy efficiency. APAC is expected to witness substantial growth in the coming years, owing to rising urbanization and industrialization in countries like China and India. South America and MEA are emerging markets with immense potential for solar power windows as governments prioritize renewable energy sources and infrastructure development.

    By 2024, the Solar Power Window Market is projected to reach a market size of USD 15.6 billion, with a CAGR of 7.2% during the forecast period of 2024-2032.

    Solar Power Window Market Regional Insights

    Source: Primary Research, Secondary Research, MRFR Database and Analyst Review

    Key Players and Competitive Insights

    Major players in the solar power window market industry engage in strategic collaborations, partnerships, mergers and acquisitions to strengthen their market positions. Leading Solar Power Window Market players invest heavily in research and development to introduce advanced technologies and innovative products. These companies also focus on expanding their distribution channels and geographic reach to cater to a wider customer base. The Solar Power Window Market industry is characterized by intense competition, with numerous established and emerging players vying for market share. One of the leading competitors in the Solar Power Window Market is Ubiquitous Energy.

    The company specializes in developing and manufacturing transparent photovoltaic glass that can be integrated into windows and other surfaces. Ubiquitous Energy's solar power windows offer numerous advantages, including high energy efficiency, transparency, and durability. The company has established partnerships with major players in the construction and automotive industries to integrate its technology into various applications. Another prominent competitor in the Solar Power Window Market is Physee. The company focuses on producing flexible and lightweight solar panels that can be easily integrated into different surfaces.

    Physee's solar panels are designed to be aesthetically appealing and blend seamlessly with building facades and other applications. The company has collaborated with architects and designers to create innovative and sustainable building solutions that incorporate its solar technology.

    Key Companies in the Solar Power Window Market market include

    Industry Developments

    The Solar Power Window Market is anticipated to exhibit steady growth in the coming years. In 2023, the market was valued at approximately USD 12.96 billion, and it is projected to reach USD 22.5 billion by 2032, expanding at a CAGR of 6.31% during the forecast period (2025-2034). Increasing demand for energy-efficient solutions, coupled with government initiatives promoting renewable energy sources, is driving market growth. Technological advancements, such as improved efficiency and reduced production costs, are further fueling market expansion. Additionally, rising environmental concerns and awareness about the benefits of solar energy are contributing to market growth.

    Key industry participants are focusing on strategic partnerships, acquisitions, and new product launches to gain a competitive edge.

    Future Outlook

    Solar Power Window Market Future Outlook

    The Solar Power Window Market is projected to grow at a 6.31% CAGR from 2024 to 2035, driven by advancements in photovoltaic technology, increasing energy efficiency demands, and supportive government policies.

    New opportunities lie in:

    • Develop integrated solar window solutions for commercial buildings to enhance energy efficiency.
    • Invest in R&D for transparent solar cells to expand residential market applications.
    • Form strategic partnerships with construction firms to embed solar windows in new developments.

    By 2035, the Solar Power Window Market is expected to be a pivotal component of sustainable architecture.

    Market Segmentation

    Solar Power Window Market Regional Outlook

    • North America
    • Europe
    • South America
    • Asia Pacific
    • Middle East and Africa

    Solar Power Window Market Technology Outlook

    • Commercial Buildings
    • Residential Buildings
    • Transportation

    Solar Power Window Market Application Outlook

    • Fully Transparent
    • Semi-Transparent
    • Tinted

    Solar Power Window Market Power Capacity Outlook

    • North America
    • Europe
    • South America
    • Asia Pacific
    • Middle East and Africa

    Solar Power Window Market Transparency Level Outlook

    • Less than 100 W
    • 100-500 W
    • 500-1000 W
    • Over 1000 W

    Report Scope

    Report Attribute/Metric Details
    Market Size 2024   14.66 (USD Billion)
    Market Size 2025   15.58 (USD Billion)
    Market Size 2034    27.04 (USD Billion)
    Compound Annual Growth Rate (CAGR)      6.31% (2025 - 2034)
    Report Coverage Revenue Forecast, Competitive Landscape, Growth Factors, and Trends
    Base Year 2024
    Market Forecast Period 2025 - 2034
    Historical Data 2019 - 2023
    Market Forecast Units USD Billion
    Key Companies Profiled SolarWindow Technologies, Inc., Polyera Corporation, Onyx Solar Energy, Magna International Inc., View, Inc., Heliatek GmbH, Elevate Textiles Limited, Eastman Chemical Company, Hanwha Q CELLS, Konarka Technologies, Inc., 3M Company, KYOCERA Corporation, AkzoNobel N.V., AGC Inc., Bridgestone Corporation
    Segments Covered Technology, Application, Transparency Level, Power Capacity, Regional
    Key Market Opportunities 1 Increased demand for sustainable building solutions 2 Government incentives and regulations promoting energy efficiency 3 Growing adoption of smart home technologies 4 Technological advancements improving window efficiency 5 Expanding construction sector in developing regions
    Key Market Dynamics Key Market Dynamics 1 Increasing demand for energy efficiency 2 Growth in the construction industry 3 Government incentives for renewable energy 4 Technological advancements in solar cell efficiency 5 Rising consumer awareness of environmental sustainability
    Countries Covered North America, Europe, APAC, South America, MEA

    Market Highlights

    Author
    Sejal Akre
    Senior Research Analyst

    She has over 5 years of rich experience, in market research and consulting providing valuable market insights to client. Hands on expertise in management consulting, and extensive knowledge in domain including ICT, Automotive & Transportation and Aerospace & Defense. She is skilled in Go-to market strategy, industry analysis, market sizing, in depth company profiling, competitive intelligence & benchmarking and value chain amongst others.

    Leave a Comment

    FAQs

    What is the current market size of the Solar Power Window Market?

    The Solar Power Window Market is expected to reach a valuation of USD 14.66 billion in 2024 and is projected to grow at a CAGR of 6.31% to reach USD 27.04 billion by 2034.

    What are the key regions driving the growth of the Solar Power Window Market?

    The Asia-Pacific region is anticipated to dominate the market throughout the forecast period. Countries like China, India, and Japan are expected to contribute significantly to the growth of the market in this region due to increasing government initiatives and rising demand for energy-efficient solutions.

    What are the major applications of Solar Power Windows?

    Solar power windows find applications in various sectors, including residential, commercial, and industrial buildings. They are used to generate electricity from sunlight and can be integrated into building designs to reduce energy consumption and reliance on conventional energy sources.

    Who are the key competitors in the Solar Power Window Market?

    The Solar Power Window Market is characterized by the presence of several prominent players, including View, Inc., Physee, Glassbel, Onyx Solar, and AGC. These companies are focused on developing innovative technologies and expanding their product offerings to meet the growing demand for solar power windows.

    What are the key trends influencing the growth of the Solar Power Window Market?

    The growth of the Solar Power Window Market is driven by several key trends, including rising environmental concerns, increasing demand for energy-efficient solutions, and technological advancements that enhance the efficiency and aesthetics of solar power windows.

    What are the challenges faced by the Solar Power Window Market?

    Despite the growth potential, the Solar Power Window Market also faces certain challenges, such as high manufacturing costs, limited production capacity, and competition from conventional energy sources. Overcoming these challenges will be crucial for the sustained growth of the market.

    What are the opportunities for growth in the Solar Power Window Market?

    The Solar Power Window Market presents numerous opportunities for growth. Increasing government incentives, technological advancements, and rising awareness about environmental sustainability are expected to drive market expansion in the coming years.

    What is the expected growth rate of the Solar Power Window Market?

    The Solar Power Window Market is anticipated to grow at a steady pace in the coming years. The market is expected to witness a CAGR of 6.31% from 2024 to 2032, driven by increasing demand for energy-efficient solutions and technological advancements.

    What are the major factors driving the adoption of Solar Power Windows?

    The adoption of solar power windows is primarily driven by their ability to generate renewable energy, reduce energy consumption, and enhance building aesthetics. They offer environmental benefits, cost savings, and design flexibility, making them an attractive option for architects, building owners, and consumers.

    What are the potential applications of Solar Power Windows beyond traditional building applications?

    Solar power windows have the potential to extend beyond traditional building applications and find innovative uses. They can be integrated into electric vehicles to generate energy while driving, incorporated into portable devices for off-grid power generation, and utilized in smart cities for powering streetlights and other urban infrastructure.

    1. 'TABLE OF CONTENTS
    2. EXECUTIVE SUMMARY
    3. Market Overview
      1. Key Findings
      2. Market Segmentation
    4. Competitive Landscape
      1. Challenges and Opportunities
      2. Future Outlook
    5. MARKET INTRODUCTION
      1. Definition
      2. Scope of the study
        1. Research Objective
        2. Assumption
        3. Limitations
    6. RESEARCH METHODOLOGY
      1. Overview
    7. Data Mining
      1. Secondary Research
      2. Primary Research
    8. Primary Interviews and Information Gathering Process
      1. Breakdown of Primary
    9. Respondents
      1. Forecasting Model
      2. Market Size Estimation
    10. Bottom-Up Approach
      1. Top-Down Approach
      2. Data Triangulation
      3. Validation
    11. MARKET DYNAMICS
      1. Overview
      2. Drivers
      3. Restraints
      4. Opportunities
    12. MARKET FACTOR ANALYSIS
      1. Value chain Analysis
      2. Porter''s Five Forces
    13. Analysis
      1. Bargaining Power of Suppliers
        1. Bargaining Power
    14. of Buyers
      1. Threat of New Entrants
        1. Threat of Substitutes
        2. Intensity of Rivalry
      2. COVID-19 Impact Analysis
    15. Market Impact Analysis
      1. Regional Impact
        1. Opportunity and
    16. Threat Analysis
    17. SOLAR POWER WINDOW MARKET, BY TECHNOLOGY
    18. (USD BILLION)
      1. Crystalline Solar
      2. Thin-Film Solar
    19. Perovskite Solar
    20. SOLAR POWER WINDOW MARKET, BY APPLICATION (USD BILLION)
      1. Commercial Buildings
      2. Residential Buildings
      3. Transportation
    21. SOLAR POWER WINDOW MARKET, BY TRANSPARENCY LEVEL (USD BILLION)
    22. Fully Transparent
      1. Semi-Transparent
      2. Tinted
    23. SOLAR POWER
    24. WINDOW MARKET, BY POWER CAPACITY (USD BILLION)
      1. Less than 100 W
    25. 500 W
      1. 500-1000 W
      2. Over 1000 W
    26. SOLAR POWER WINDOW
    27. MARKET, BY REGIONAL (USD BILLION)
      1. North America
        1. US
        2. Canada
      2. Europe
        1. Germany
        2. UK
    28. France
      1. Russia
        1. Italy
        2. Spain
    29. Rest of Europe
      1. APAC
        1. China
        2. India
    30. Japan
      1. South Korea
        1. Malaysia
        2. Thailand
        3. Indonesia
        4. Rest of APAC
      2. South America
    31. Brazil
      1. Mexico
        1. Argentina
        2. Rest of South
    32. America
      1. MEA
        1. GCC Countries
        2. South Africa
        3. Rest of MEA
    33. COMPETITIVE LANDSCAPE
    34. Overview
      1. Competitive Analysis
      2. Market share Analysis
      3. Major Growth Strategy in the Solar Power Window Market
      4. Competitive
    35. Benchmarking
      1. Leading Players in Terms of Number of Developments in the
    36. Solar Power Window Market
      1. Key developments and growth strategies
        1. New Product Launch/Service Deployment
        2. Merger & Acquisitions
        3. Joint Ventures
      2. Major Players Financial Matrix
    37. Sales and Operating Income
      1. Major Players R&D Expenditure. 2023
    38. COMPANY PROFILES
      1. SolarWindow Technologies, Inc.
    39. Financial Overview
      1. Products Offered
        1. Key Developments
        2. SWOT Analysis
        3. Key Strategies
      2. Polyera Corporation
        1. Financial Overview
        2. Products Offered
        3. Key
    40. Developments
      1. SWOT Analysis
        1. Key Strategies
    41. Onyx Solar Energy
      1. Financial Overview
        1. Products Offered
        2. Key Developments
        3. SWOT Analysis
        4. Key Strategies
      2. Magna International Inc.
        1. Financial Overview
    42. Products Offered
      1. Key Developments
        1. SWOT Analysis
        2. Key Strategies
      2. View, Inc.
        1. Financial Overview
        2. Products Offered
        3. Key Developments
        4. SWOT
    43. Analysis
      1. Key Strategies
      2. Heliatek GmbH
        1. Financial
    44. Overview
      1. Products Offered
        1. Key Developments
    45. SWOT Analysis
      1. Key Strategies
      2. Elevate Textiles Limited
        1. Financial Overview
        2. Products Offered
        3. Key
    46. Developments
      1. SWOT Analysis
        1. Key Strategies
    47. Eastman Chemical Company
      1. Financial Overview
        1. Products
    48. Offered
      1. Key Developments
        1. SWOT Analysis
    49. Key Strategies
      1. Hanwha Q CELLS
        1. Financial Overview
    50. Products Offered
      1. Key Developments
        1. SWOT Analysis
        2. Key Strategies
      2. Konarka Technologies, Inc.
    51. Financial Overview
      1. Products Offered
        1. Key Developments
        2. SWOT Analysis
        3. Key Strategies
      2. 3M Company
        1. Financial Overview
        2. Products Offered
    52. Key Developments
      1. SWOT Analysis
        1. Key Strategies
      2. KYOCERA Corporation
        1. Financial Overview
        2. Products
    53. Offered
      1. Key Developments
        1. SWOT Analysis
    54. Key Strategies
      1. AkzoNobel N.V.
        1. Financial Overview
        2. Products Offered
        3. Key Developments
        4. SWOT
    55. Analysis
      1. Key Strategies
      2. AGC Inc.
        1. Financial
    56. Overview
      1. Products Offered
        1. Key Developments
    57. SWOT Analysis
      1. Key Strategies
      2. Bridgestone Corporation
        1. Financial Overview
        2. Products Offered
    58. Key Developments
      1. SWOT Analysis
        1. Key Strategies
    59. APPENDIX
      1. References
      2. Related Reports
    60. POWER WINDOW MARKET SIZE ESTIMATES & FORECAST, BY TECHNOLOGY, 2019-2032 (USD
    61. BILLIONS)
    62. & FORECAST, BY APPLICATION, 2019-2032 (USD BILLIONS)
    63. SOLAR POWER WINDOW MARKET SIZE ESTIMATES & FORECAST, BY TRANSPARENCY LEVEL,
    64. 2032 (USD BILLIONS)
    65. SIZE ESTIMATES & FORECAST, BY POWER CAPACITY, 2019-2032 (USD BILLIONS)
    66. NORTH AMERICA SOLAR POWER WINDOW MARKET SIZE ESTIMATES & FORECAST, BY REGIONAL,
    67. 2032 (USD BILLIONS)
    68. & FORECAST, BY TECHNOLOGY, 2019-2032 (USD BILLIONS)
    69. POWER WINDOW MARKET SIZE ESTIMATES & FORECAST, BY APPLICATION, 2019-2032 (USD
    70. BILLIONS)
    71. BY TRANSPARENCY LEVEL, 2019-2032 (USD BILLIONS)
    72. MARKET SIZE ESTIMATES & FORECAST, BY POWER CAPACITY, 2019-2032 (USD BILLIONS)
    73. 2032 (USD BILLIONS)
    74. & FORECAST, BY TECHNOLOGY, 2019-2032 (USD BILLIONS)
    75. POWER WINDOW MARKET SIZE ESTIMATES & FORECAST, BY APPLICATION, 2019-2032 (USD
    76. BILLIONS)
    77. FORECAST, BY TRANSPARENCY LEVEL, 2019-2032 (USD BILLIONS)
    78. SOLAR POWER WINDOW MARKET SIZE ESTIMATES & FORECAST, BY POWER CAPACITY, 2019-2032
    79. (USD BILLIONS)
    80. FORECAST, BY REGIONAL, 2019-2032 (USD BILLIONS)
    81. WINDOW MARKET SIZE ESTIMATES & FORECAST, BY TECHNOLOGY, 2019-2032 (USD BILLIONS)
    82. BY APPLICATION, 2019-2032 (USD BILLIONS)
    83. MARKET SIZE ESTIMATES & FORECAST, BY TRANSPARENCY LEVEL, 2019-2032 (USD BILLIONS)
    84. BY POWER CAPACITY, 2019-2032 (USD BILLIONS)
    85. MARKET SIZE ESTIMATES & FORECAST, BY REGIONAL, 2019-2032 (USD BILLIONS)
    86. TECHNOLOGY, 2019-2032 (USD BILLIONS)
    87. MARKET SIZE ESTIMATES & FORECAST, BY APPLICATION, 2019-2032 (USD BILLIONS)
    88. TRANSPARENCY LEVEL, 2019-2032 (USD BILLIONS)
    89. WINDOW MARKET SIZE ESTIMATES & FORECAST, BY POWER CAPACITY, 2019-2032 (USD BILLIONS)
    90. BY REGIONAL, 2019-2032 (USD BILLIONS)
    91. SIZE ESTIMATES & FORECAST, BY TECHNOLOGY, 2019-2032 (USD BILLIONS)
    92. UK SOLAR POWER WINDOW MARKET SIZE ESTIMATES & FORECAST, BY APPLICATION,
    93. 2032 (USD BILLIONS)
    94. & FORECAST, BY TRANSPARENCY LEVEL, 2019-2032 (USD BILLIONS)
    95. UK SOLAR POWER WINDOW MARKET SIZE ESTIMATES & FORECAST, BY POWER CAPACITY, 2019-2032
    96. (USD BILLIONS)
    97. FORECAST, BY REGIONAL, 2019-2032 (USD BILLIONS)
    98. WINDOW MARKET SIZE ESTIMATES & FORECAST, BY TECHNOLOGY, 2019-2032 (USD BILLIONS)
    99. BY APPLICATION, 2019-2032 (USD BILLIONS)
    100. MARKET SIZE ESTIMATES & FORECAST, BY TRANSPARENCY LEVEL, 2019-2032 (USD BILLIONS)
    101. BY POWER CAPACITY, 2019-2032 (USD BILLIONS)
    102. MARKET SIZE ESTIMATES & FORECAST, BY REGIONAL, 2019-2032 (USD BILLIONS)
    103. 2032 (USD BILLIONS)
    104. & FORECAST, BY APPLICATION, 2019-2032 (USD BILLIONS)
    105. SOLAR POWER WINDOW MARKET SIZE ESTIMATES & FORECAST, BY TRANSPARENCY LEVEL,
    106. 2032 (USD BILLIONS)
    107. & FORECAST, BY POWER CAPACITY, 2019-2032 (USD BILLIONS)
    108. SOLAR POWER WINDOW MARKET SIZE ESTIMATES & FORECAST, BY REGIONAL, 2019-2032
    109. (USD BILLIONS)
    110. FORECAST, BY TECHNOLOGY, 2019-2032 (USD BILLIONS)
    111. WINDOW MARKET SIZE ESTIMATES & FORECAST, BY APPLICATION, 2019-2032 (USD BILLIONS)
    112. TRANSPARENCY LEVEL, 2019-2032 (USD BILLIONS)
    113. MARKET SIZE ESTIMATES & FORECAST, BY POWER CAPACITY, 2019-2032 (USD BILLIONS)
    114. REGIONAL, 2019-2032 (USD BILLIONS)
    115. SIZE ESTIMATES & FORECAST, BY TECHNOLOGY, 2019-2032 (USD BILLIONS)
    116. SPAIN SOLAR POWER WINDOW MARKET SIZE ESTIMATES & FORECAST, BY APPLICATION,
    117. 2032 (USD BILLIONS)
    118. & FORECAST, BY TRANSPARENCY LEVEL, 2019-2032 (USD BILLIONS)
    119. SPAIN SOLAR POWER WINDOW MARKET SIZE ESTIMATES & FORECAST, BY POWER CAPACITY,
    120. 2032 (USD BILLIONS)
    121. & FORECAST, BY REGIONAL, 2019-2032 (USD BILLIONS)
    122. SOLAR POWER WINDOW MARKET SIZE ESTIMATES & FORECAST, BY TECHNOLOGY, 2019-2032
    123. (USD BILLIONS)
    124. & FORECAST, BY APPLICATION, 2019-2032 (USD BILLIONS)
    125. EUROPE SOLAR POWER WINDOW MARKET SIZE ESTIMATES & FORECAST, BY TRANSPARENCY
    126. LEVEL, 2019-2032 (USD BILLIONS)
    127. MARKET SIZE ESTIMATES & FORECAST, BY POWER CAPACITY, 2019-2032 (USD BILLIONS)
    128. BY REGIONAL, 2019-2032 (USD BILLIONS)
    129. SIZE ESTIMATES & FORECAST, BY TECHNOLOGY, 2019-2032 (USD BILLIONS)
    130. APAC SOLAR POWER WINDOW MARKET SIZE ESTIMATES & FORECAST, BY APPLICATION,
    131. 2032 (USD BILLIONS)
    132. & FORECAST, BY TRANSPARENCY LEVEL, 2019-2032 (USD BILLIONS)
    133. APAC SOLAR POWER WINDOW MARKET SIZE ESTIMATES & FORECAST, BY POWER CAPACITY,
    134. 2032 (USD BILLIONS)
    135. & FORECAST, BY REGIONAL, 2019-2032 (USD BILLIONS)
    136. POWER WINDOW MARKET SIZE ESTIMATES & FORECAST, BY TECHNOLOGY, 2019-2032 (USD
    137. BILLIONS)
    138. BY APPLICATION, 2019-2032 (USD BILLIONS)
    139. MARKET SIZE ESTIMATES & FORECAST, BY TRANSPARENCY LEVEL, 2019-2032 (USD BILLIONS)
    140. POWER CAPACITY, 2019-2032 (USD BILLIONS)
    141. MARKET SIZE ESTIMATES & FORECAST, BY REGIONAL, 2019-2032 (USD BILLIONS)
    142. 2032 (USD BILLIONS)
    143. & FORECAST, BY APPLICATION, 2019-2032 (USD BILLIONS)
    144. POWER WINDOW MARKET SIZE ESTIMATES & FORECAST, BY TRANSPARENCY LEVEL, 2019-2032
    145. (USD BILLIONS)
    146. FORECAST, BY POWER CAPACITY, 2019-2032 (USD BILLIONS)
    147. POWER WINDOW MARKET SIZE ESTIMATES & FORECAST, BY REGIONAL, 2019-2032 (USD BILLIONS)
    148. TECHNOLOGY, 2019-2032 (USD BILLIONS)
    149. SIZE ESTIMATES & FORECAST, BY APPLICATION, 2019-2032 (USD BILLIONS)
    150. JAPAN SOLAR POWER WINDOW MARKET SIZE ESTIMATES & FORECAST, BY TRANSPARENCY
    151. LEVEL, 2019-2032 (USD BILLIONS)
    152. SIZE ESTIMATES & FORECAST, BY POWER CAPACITY, 2019-2032 (USD BILLIONS)
    153. JAPAN SOLAR POWER WINDOW MARKET SIZE ESTIMATES & FORECAST, BY REGIONAL,
    154. 2032 (USD BILLIONS)
    155. ESTIMATES & FORECAST, BY TECHNOLOGY, 2019-2032 (USD BILLIONS)
    156. SOUTH KOREA SOLAR POWER WINDOW MARKET SIZE ESTIMATES & FORECAST, BY APPLICATION,
    157. 2032 (USD BILLIONS)
    158. ESTIMATES & FORECAST, BY TRANSPARENCY LEVEL, 2019-2032 (USD BILLIONS)
    159. SOUTH KOREA SOLAR POWER WINDOW MARKET SIZE ESTIMATES & FORECAST, BY POWER
    160. CAPACITY, 2019-2032 (USD BILLIONS)
    161. MARKET SIZE ESTIMATES & FORECAST, BY REGIONAL, 2019-2032 (USD BILLIONS)
    162. TECHNOLOGY, 2019-2032 (USD BILLIONS)
    163. MARKET SIZE ESTIMATES & FORECAST, BY APPLICATION, 2019-2032 (USD BILLIONS)
    164. TRANSPARENCY LEVEL, 2019-2032 (USD BILLIONS)
    165. WINDOW MARKET SIZE ESTIMATES & FORECAST, BY POWER CAPACITY, 2019-2032 (USD BILLIONS)
    166. BY REGIONAL, 2019-2032 (USD BILLIONS)
    167. MARKET SIZE ESTIMATES & FORECAST, BY TECHNOLOGY, 2019-2032 (USD BILLIONS)
    168. APPLICATION, 2019-2032 (USD BILLIONS)
    169. MARKET SIZE ESTIMATES & FORECAST, BY TRANSPARENCY LEVEL, 2019-2032 (USD BILLIONS)
    170. BY POWER CAPACITY, 2019-2032 (USD BILLIONS)
    171. WINDOW MARKET SIZE ESTIMATES & FORECAST, BY REGIONAL, 2019-2032 (USD BILLIONS)
    172. BY TECHNOLOGY, 2019-2032 (USD BILLIONS)
    173. MARKET SIZE ESTIMATES & FORECAST, BY APPLICATION, 2019-2032 (USD BILLIONS)
    174. TRANSPARENCY LEVEL, 2019-2032 (USD BILLIONS)
    175. WINDOW MARKET SIZE ESTIMATES & FORECAST, BY POWER CAPACITY, 2019-2032 (USD BILLIONS)
    176. BY REGIONAL, 2019-2032 (USD BILLIONS)
    177. MARKET SIZE ESTIMATES & FORECAST, BY TECHNOLOGY, 2019-2032 (USD BILLIONS)
    178. BY APPLICATION, 2019-2032 (USD BILLIONS)
    179. WINDOW MARKET SIZE ESTIMATES & FORECAST, BY TRANSPARENCY LEVEL, 2019-2032 (USD
    180. BILLIONS)
    181. & FORECAST, BY POWER CAPACITY, 2019-2032 (USD BILLIONS)
    182. OF APAC SOLAR POWER WINDOW MARKET SIZE ESTIMATES & FORECAST, BY REGIONAL, 2019-2032
    183. (USD BILLIONS)
    184. & FORECAST, BY TECHNOLOGY, 2019-2032 (USD BILLIONS)
    185. SOLAR POWER WINDOW MARKET SIZE ESTIMATES & FORECAST, BY APPLICATION, 2019-2032
    186. (USD BILLIONS)
    187. & FORECAST, BY TRANSPARENCY LEVEL, 2019-2032 (USD BILLIONS)
    188. SOUTH AMERICA SOLAR POWER WINDOW MARKET SIZE ESTIMATES & FORECAST, BY POWER
    189. CAPACITY, 2019-2032 (USD BILLIONS)
    190. MARKET SIZE ESTIMATES & FORECAST, BY REGIONAL, 2019-2032 (USD BILLIONS)
    191. TECHNOLOGY, 2019-2032 (USD BILLIONS)
    192. MARKET SIZE ESTIMATES & FORECAST, BY APPLICATION, 2019-2032 (USD BILLIONS)
    193. TRANSPARENCY LEVEL, 2019-2032 (USD BILLIONS)
    194. WINDOW MARKET SIZE ESTIMATES & FORECAST, BY POWER CAPACITY, 2019-2032 (USD BILLIONS)
    195. BY REGIONAL, 2019-2032 (USD BILLIONS)
    196. MARKET SIZE ESTIMATES & FORECAST, BY TECHNOLOGY, 2019-2032 (USD BILLIONS)
    197. APPLICATION, 2019-2032 (USD BILLIONS)
    198. MARKET SIZE ESTIMATES & FORECAST, BY TRANSPARENCY LEVEL, 2019-2032 (USD BILLIONS)
    199. BY POWER CAPACITY, 2019-2032 (USD BILLIONS)
    200. WINDOW MARKET SIZE ESTIMATES & FORECAST, BY REGIONAL, 2019-2032 (USD BILLIONS)
    201. BY TECHNOLOGY, 2019-2032 (USD BILLIONS)
    202. MARKET SIZE ESTIMATES & FORECAST, BY APPLICATION, 2019-2032 (USD BILLIONS)
    203. BY TRANSPARENCY LEVEL, 2019-2032 (USD BILLIONS)
    204. POWER WINDOW MARKET SIZE ESTIMATES & FORECAST, BY POWER CAPACITY, 2019-2032
    205. (USD BILLIONS)
    206. & FORECAST, BY REGIONAL, 2019-2032 (USD BILLIONS)
    207. AMERICA SOLAR POWER WINDOW MARKET SIZE ESTIMATES & FORECAST, BY TECHNOLOGY,
    208. 2032 (USD BILLIONS)
    209. MARKET SIZE ESTIMATES & FORECAST, BY APPLICATION, 2019-2032 (USD BILLIONS)
    210. FORECAST, BY TRANSPARENCY LEVEL, 2019-2032 (USD BILLIONS)
    211. OF SOUTH AMERICA SOLAR POWER WINDOW MARKET SIZE ESTIMATES & FORECAST, BY POWER
    212. CAPACITY, 2019-2032 (USD BILLIONS)
    213. POWER WINDOW MARKET SIZE ESTIMATES & FORECAST, BY REGIONAL, 2019-2032 (USD BILLIONS)
    214. TECHNOLOGY, 2019-2032 (USD BILLIONS)
    215. SIZE ESTIMATES & FORECAST, BY APPLICATION, 2019-2032 (USD BILLIONS)
    216. MEA SOLAR POWER WINDOW MARKET SIZE ESTIMATES & FORECAST, BY TRANSPARENCY
    217. LEVEL, 2019-2032 (USD BILLIONS)
    218. ESTIMATES & FORECAST, BY POWER CAPACITY, 2019-2032 (USD BILLIONS)
    219. MEA SOLAR POWER WINDOW MARKET SIZE ESTIMATES & FORECAST, BY REGIONAL, 2019-2032
    220. (USD BILLIONS)
    221. & FORECAST, BY TECHNOLOGY, 2019-2032 (USD BILLIONS)
    222. SOLAR POWER WINDOW MARKET SIZE ESTIMATES & FORECAST, BY APPLICATION, 2019-2032
    223. (USD BILLIONS)
    224. & FORECAST, BY TRANSPARENCY LEVEL, 2019-2032 (USD BILLIONS)
    225. GCC COUNTRIES SOLAR POWER WINDOW MARKET SIZE ESTIMATES & FORECAST, BY POWER
    226. CAPACITY, 2019-2032 (USD BILLIONS)
    227. MARKET SIZE ESTIMATES & FORECAST, BY REGIONAL, 2019-2032 (USD BILLIONS)
    228. BY TECHNOLOGY, 2019-2032 (USD BILLIONS)
    229. WINDOW MARKET SIZE ESTIMATES & FORECAST, BY APPLICATION, 2019-2032 (USD BILLIONS)
    230. BY TRANSPARENCY LEVEL, 2019-2032 (USD BILLIONS)
    231. POWER WINDOW MARKET SIZE ESTIMATES & FORECAST, BY POWER CAPACITY, 2019-2032
    232. (USD BILLIONS)
    233. & FORECAST, BY REGIONAL, 2019-2032 (USD BILLIONS)
    234. SOLAR POWER WINDOW MARKET SIZE ESTIMATES & FORECAST, BY TECHNOLOGY, 2019-2032
    235. (USD BILLIONS)
    236. & FORECAST, BY APPLICATION, 2019-2032 (USD BILLIONS)
    237. MEA SOLAR POWER WINDOW MARKET SIZE ESTIMATES & FORECAST, BY TRANSPARENCY LEVEL,
    238. 2032 (USD BILLIONS)
    239. SIZE ESTIMATES & FORECAST, BY POWER CAPACITY, 2019-2032 (USD BILLIONS)
    240. REST OF MEA SOLAR POWER WINDOW MARKET SIZE ESTIMATES & FORECAST, BY REGIONAL,
    241. 2032 (USD BILLIONS)
    242. MARKET SYNOPSIS
    243. US SOLAR POWER WINDOW MARKET ANALYSIS BY APPLICATION
    244. POWER WINDOW MARKET ANALYSIS BY TRANSPARENCY LEVEL
    245. WINDOW MARKET ANALYSIS BY POWER CAPACITY
    246. ANALYSIS BY REGIONAL
    247. TECHNOLOGY
    248. EUROPE SOLAR POWER WINDOW MARKET ANALYSIS
    249. WINDOW MARKET ANALYSIS BY TECHNOLOGY
    250. MARKET ANALYSIS BY APPLICATION
    251. ANALYSIS BY TRANSPARENCY LEVEL
    252. ANALYSIS BY POWER CAPACITY
    253. BY REGIONAL
    254. UK SOLAR POWER WINDOW MARKET ANALYSIS BY TRANSPARENCY LEVEL
    255. UK SOLAR POWER WINDOW MARKET ANALYSIS BY POWER CAPACITY
    256. POWER WINDOW MARKET ANALYSIS BY REGIONAL
    257. MARKET ANALYSIS BY TECHNOLOGY
    258. ANALYSIS BY APPLICATION
    259. BY TRANSPARENCY LEVEL
    260. BY POWER CAPACITY
    261. REGIONAL
    262. RUSSIA SOLAR POWER WINDOW MARKET ANALYSIS BY TRANSPARENCY LEVEL
    263. RUSSIA SOLAR POWER WINDOW MARKET ANALYSIS BY POWER CAPACITY
    264. RUSSIA SOLAR POWER WINDOW MARKET ANALYSIS BY REGIONAL
    265. POWER WINDOW MARKET ANALYSIS BY TECHNOLOGY
    266. MARKET ANALYSIS BY APPLICATION
    267. ANALYSIS BY TRANSPARENCY LEVEL
    268. ANALYSIS BY POWER CAPACITY
    269. BY REGIONAL
    270. SPAIN SOLAR POWER WINDOW MARKET ANALYSIS BY TRANSPARENCY LEVEL
    271. SPAIN SOLAR POWER WINDOW MARKET ANALYSIS BY POWER CAPACITY
    272. SPAIN SOLAR POWER WINDOW MARKET ANALYSIS BY REGIONAL
    273. SOLAR POWER WINDOW MARKET ANALYSIS BY TECHNOLOGY
    274. SOLAR POWER WINDOW MARKET ANALYSIS BY APPLICATION
    275. SOLAR POWER WINDOW MARKET ANALYSIS BY TRANSPARENCY LEVEL
    276. EUROPE SOLAR POWER WINDOW MARKET ANALYSIS BY POWER CAPACITY
    277. OF EUROPE SOLAR POWER WINDOW MARKET ANALYSIS BY REGIONAL
    278. POWER WINDOW MARKET ANALYSIS
    279. BY TECHNOLOGY
    280. INDIA SOLAR POWER WINDOW MARKET ANALYSIS BY TECHNOLOGY
    281. POWER WINDOW MARKET ANALYSIS BY APPLICATION
    282. MARKET ANALYSIS BY TRANSPARENCY LEVEL
    283. MARKET ANALYSIS BY POWER CAPACITY
    284. ANALYSIS BY REGIONAL
    285. TECHNOLOGY
    286. SOUTH KOREA SOLAR POWER WINDOW MARKET ANALYSIS BY TECHNOLOGY
    287. KOREA SOLAR POWER WINDOW MARKET ANALYSIS BY APPLICATION
    288. SOLAR POWER WINDOW MARKET ANALYSIS BY TRANSPARENCY LEVEL
    289. KOREA SOLAR POWER WINDOW MARKET ANALYSIS BY POWER CAPACITY
    290. KOREA SOLAR POWER WINDOW MARKET ANALYSIS BY REGIONAL
    291. POWER WINDOW MARKET ANALYSIS BY TECHNOLOGY
    292. WINDOW MARKET ANALYSIS BY APPLICATION
    293. MARKET ANALYSIS BY TRANSPARENCY LEVEL
    294. MARKET ANALYSIS BY POWER CAPACITY
    295. ANALYSIS BY REGIONAL
    296. BY TECHNOLOGY
    297. INDONESIA SOLAR POWER WINDOW MARKET ANALYSIS BY TECHNOLOGY
    298. INDONESIA SOLAR POWER WINDOW MARKET ANALYSIS BY APPLICATION
    299. SOLAR POWER WINDOW MARKET ANALYSIS BY TRANSPARENCY LEVEL
    300. SOLAR POWER WINDOW MARKET ANALYSIS BY POWER CAPACITY
    301. SOLAR POWER WINDOW MARKET ANALYSIS BY REGIONAL
    302. POWER WINDOW MARKET ANALYSIS BY TECHNOLOGY
    303. WINDOW MARKET ANALYSIS BY APPLICATION
    304. WINDOW MARKET ANALYSIS BY TRANSPARENCY LEVEL
    305. POWER WINDOW MARKET ANALYSIS BY POWER CAPACITY
    306. POWER WINDOW MARKET ANALYSIS BY REGIONAL
    307. WINDOW MARKET ANALYSIS
    308. BY TECHNOLOGY
    309. MEXICO SOLAR POWER WINDOW MARKET ANALYSIS BY TECHNOLOGY
    310. SOLAR POWER WINDOW MARKET ANALYSIS BY APPLICATION
    311. POWER WINDOW MARKET ANALYSIS BY TRANSPARENCY LEVEL
    312. POWER WINDOW MARKET ANALYSIS BY POWER CAPACITY
    313. WINDOW MARKET ANALYSIS BY REGIONAL
    314. MARKET ANALYSIS BY TECHNOLOGY
    315. ANALYSIS BY APPLICATION
    316. BY TRANSPARENCY LEVEL
    317. BY POWER CAPACITY
    318. BY REGIONAL
    319. BY TECHNOLOGY
    320. ANALYSIS BY APPLICATION
    321. MARKET ANALYSIS BY TRANSPARENCY LEVEL
    322. POWER WINDOW MARKET ANALYSIS BY POWER CAPACITY
    323. SOLAR POWER WINDOW MARKET ANALYSIS BY REGIONAL
    324. WINDOW MARKET ANALYSIS
    325. ANALYSIS BY TECHNOLOGY
    326. ANALYSIS BY APPLICATION
    327. ANALYSIS BY TRANSPARENCY LEVEL
    328. MARKET ANALYSIS BY POWER CAPACITY
    329. MARKET ANALYSIS BY REGIONAL
    330. ANALYSIS BY TECHNOLOGY
    331. ANALYSIS BY APPLICATION
    332. ANALYSIS BY TRANSPARENCY LEVEL
    333. MARKET ANALYSIS BY POWER CAPACITY
    334. MARKET ANALYSIS BY REGIONAL
    335. ANALYSIS BY TECHNOLOGY
    336. BY APPLICATION
    337. BY TRANSPARENCY LEVEL
    338. BY POWER CAPACITY
    339. BY REGIONAL
    340. WINDOW MARKET
    341. SUPPLY / VALUE CHAIN: SOLAR POWER WINDOW MARKET
    342. WINDOW MARKET, BY TECHNOLOGY, 2024 (% SHARE)
    343. MARKET, BY TECHNOLOGY, 2019 TO 2032 (USD Billions)
    344. WINDOW MARKET, BY APPLICATION, 2024 (% SHARE)
    345. MARKET, BY APPLICATION, 2019 TO 2032 (USD Billions)
    346. WINDOW MARKET, BY TRANSPARENCY LEVEL, 2024 (% SHARE)
    347. WINDOW MARKET, BY TRANSPARENCY LEVEL, 2019 TO 2032 (USD Billions)
    348. SOLAR POWER WINDOW MARKET, BY POWER CAPACITY, 2024 (% SHARE)
    349. POWER WINDOW MARKET, BY POWER CAPACITY, 2019 TO 2032 (USD Billions)
    350. SOLAR POWER WINDOW MARKET, BY REGIONAL, 2024 (% SHARE)
    351. POWER WINDOW MARKET, BY REGIONAL, 2019 TO 2032 (USD Billions)
    352. BENCHMARKING OF MAJOR COMPETITORS'

    Solar Power Window Market Segmentation

    • Solar Power Window Market By Technology (USD Billion, 2019-2032)

      • Crystalline Solar
      • Thin-Film Solar
      • Perovskite Solar
    • Solar Power Window Market By Application (USD Billion, 2019-2032)

      • Commercial Buildings
      • Residential Buildings
      • Transportation
    • Solar Power Window Market By Transparency Level (USD Billion, 2019-2032)

      • Fully Transparent
      • Semi-Transparent
      • Tinted
    • Solar Power Window Market By Power Capacity (USD Billion, 2019-2032)

      • Less than 100 W
      • 100-500 W
      • 500-1000 W
      • Over 1000 W
    • Solar Power Window Market By Regional (USD Billion, 2019-2032)

      • North America
      • Europe
      • South America
      • Asia Pacific
      • Middle East and Africa

    Solar Power Window Market Regional Outlook (USD Billion, 2019-2032)

    • North America Outlook (USD Billion, 2019-2032)

      • North America Solar Power Window Market by Technology Type

        • Crystalline Solar
        • Thin-Film Solar
        • Perovskite Solar
      • North America Solar Power Window Market by Application Type

        • Commercial Buildings
        • Residential Buildings
        • Transportation
      • North America Solar Power Window Market by Transparency Level Type

        • Fully Transparent
        • Semi-Transparent
        • Tinted
      • North America Solar Power Window Market by Power Capacity Type

        • Less than 100 W
        • 100-500 W
        • 500-1000 W
        • Over 1000 W
      • North America Solar Power Window Market by Regional Type

        • US
        • Canada
      • US Outlook (USD Billion, 2019-2032)
      • US Solar Power Window Market by Technology Type

        • Crystalline Solar
        • Thin-Film Solar
        • Perovskite Solar
      • US Solar Power Window Market by Application Type

        • Commercial Buildings
        • Residential Buildings
        • Transportation
      • US Solar Power Window Market by Transparency Level Type

        • Fully Transparent
        • Semi-Transparent
        • Tinted
      • US Solar Power Window Market by Power Capacity Type

        • Less than 100 W
        • 100-500 W
        • 500-1000 W
        • Over 1000 W
      • CANADA Outlook (USD Billion, 2019-2032)
      • CANADA Solar Power Window Market by Technology Type

        • Crystalline Solar
        • Thin-Film Solar
        • Perovskite Solar
      • CANADA Solar Power Window Market by Application Type

        • Commercial Buildings
        • Residential Buildings
        • Transportation
      • CANADA Solar Power Window Market by Transparency Level Type

        • Fully Transparent
        • Semi-Transparent
        • Tinted
      • CANADA Solar Power Window Market by Power Capacity Type

        • Less than 100 W
        • 100-500 W
        • 500-1000 W
        • Over 1000 W
    • Europe Outlook (USD Billion, 2019-2032)

      • Europe Solar Power Window Market by Technology Type

        • Crystalline Solar
        • Thin-Film Solar
        • Perovskite Solar
      • Europe Solar Power Window Market by Application Type

        • Commercial Buildings
        • Residential Buildings
        • Transportation
      • Europe Solar Power Window Market by Transparency Level Type

        • Fully Transparent
        • Semi-Transparent
        • Tinted
      • Europe Solar Power Window Market by Power Capacity Type

        • Less than 100 W
        • 100-500 W
        • 500-1000 W
        • Over 1000 W
      • Europe Solar Power Window Market by Regional Type

        • Germany
        • UK
        • France
        • Russia
        • Italy
        • Spain
        • Rest of Europe
      • GERMANY Outlook (USD Billion, 2019-2032)
      • GERMANY Solar Power Window Market by Technology Type

        • Crystalline Solar
        • Thin-Film Solar
        • Perovskite Solar
      • GERMANY Solar Power Window Market by Application Type

        • Commercial Buildings
        • Residential Buildings
        • Transportation
      • GERMANY Solar Power Window Market by Transparency Level Type

        • Fully Transparent
        • Semi-Transparent
        • Tinted
      • GERMANY Solar Power Window Market by Power Capacity Type

        • Less than 100 W
        • 100-500 W
        • 500-1000 W
        • Over 1000 W
      • UK Outlook (USD Billion, 2019-2032)
      • UK Solar Power Window Market by Technology Type

        • Crystalline Solar
        • Thin-Film Solar
        • Perovskite Solar
      • UK Solar Power Window Market by Application Type

        • Commercial Buildings
        • Residential Buildings
        • Transportation
      • UK Solar Power Window Market by Transparency Level Type

        • Fully Transparent
        • Semi-Transparent
        • Tinted
      • UK Solar Power Window Market by Power Capacity Type

        • Less than 100 W
        • 100-500 W
        • 500-1000 W
        • Over 1000 W
      • FRANCE Outlook (USD Billion, 2019-2032)
      • FRANCE Solar Power Window Market by Technology Type

        • Crystalline Solar
        • Thin-Film Solar
        • Perovskite Solar
      • FRANCE Solar Power Window Market by Application Type

        • Commercial Buildings
        • Residential Buildings
        • Transportation
      • FRANCE Solar Power Window Market by Transparency Level Type

        • Fully Transparent
        • Semi-Transparent
        • Tinted
      • FRANCE Solar Power Window Market by Power Capacity Type

        • Less than 100 W
        • 100-500 W
        • 500-1000 W
        • Over 1000 W
      • RUSSIA Outlook (USD Billion, 2019-2032)
      • RUSSIA Solar Power Window Market by Technology Type

        • Crystalline Solar
        • Thin-Film Solar
        • Perovskite Solar
      • RUSSIA Solar Power Window Market by Application Type

        • Commercial Buildings
        • Residential Buildings
        • Transportation
      • RUSSIA Solar Power Window Market by Transparency Level Type

        • Fully Transparent
        • Semi-Transparent
        • Tinted
      • RUSSIA Solar Power Window Market by Power Capacity Type

        • Less than 100 W
        • 100-500 W
        • 500-1000 W
        • Over 1000 W
      • ITALY Outlook (USD Billion, 2019-2032)
      • ITALY Solar Power Window Market by Technology Type

        • Crystalline Solar
        • Thin-Film Solar
        • Perovskite Solar
      • ITALY Solar Power Window Market by Application Type

        • Commercial Buildings
        • Residential Buildings
        • Transportation
      • ITALY Solar Power Window Market by Transparency Level Type

        • Fully Transparent
        • Semi-Transparent
        • Tinted
      • ITALY Solar Power Window Market by Power Capacity Type

        • Less than 100 W
        • 100-500 W
        • 500-1000 W
        • Over 1000 W
      • SPAIN Outlook (USD Billion, 2019-2032)
      • SPAIN Solar Power Window Market by Technology Type

        • Crystalline Solar
        • Thin-Film Solar
        • Perovskite Solar
      • SPAIN Solar Power Window Market by Application Type

        • Commercial Buildings
        • Residential Buildings
        • Transportation
      • SPAIN Solar Power Window Market by Transparency Level Type

        • Fully Transparent
        • Semi-Transparent
        • Tinted
      • SPAIN Solar Power Window Market by Power Capacity Type

        • Less than 100 W
        • 100-500 W
        • 500-1000 W
        • Over 1000 W
      • REST OF EUROPE Outlook (USD Billion, 2019-2032)
      • REST OF EUROPE Solar Power Window Market by Technology Type

        • Crystalline Solar
        • Thin-Film Solar
        • Perovskite Solar
      • REST OF EUROPE Solar Power Window Market by Application Type

        • Commercial Buildings
        • Residential Buildings
        • Transportation
      • REST OF EUROPE Solar Power Window Market by Transparency Level Type

        • Fully Transparent
        • Semi-Transparent
        • Tinted
      • REST OF EUROPE Solar Power Window Market by Power Capacity Type

        • Less than 100 W
        • 100-500 W
        • 500-1000 W
        • Over 1000 W
    • APAC Outlook (USD Billion, 2019-2032)

      • APAC Solar Power Window Market by Technology Type

        • Crystalline Solar
        • Thin-Film Solar
        • Perovskite Solar
      • APAC Solar Power Window Market by Application Type

        • Commercial Buildings
        • Residential Buildings
        • Transportation
      • APAC Solar Power Window Market by Transparency Level Type

        • Fully Transparent
        • Semi-Transparent
        • Tinted
      • APAC Solar Power Window Market by Power Capacity Type

        • Less than 100 W
        • 100-500 W
        • 500-1000 W
        • Over 1000 W
      • APAC Solar Power Window Market by Regional Type

        • China
        • India
        • Japan
        • South Korea
        • Malaysia
        • Thailand
        • Indonesia
        • Rest of APAC
      • CHINA Outlook (USD Billion, 2019-2032)
      • CHINA Solar Power Window Market by Technology Type

        • Crystalline Solar
        • Thin-Film Solar
        • Perovskite Solar
      • CHINA Solar Power Window Market by Application Type

        • Commercial Buildings
        • Residential Buildings
        • Transportation
      • CHINA Solar Power Window Market by Transparency Level Type

        • Fully Transparent
        • Semi-Transparent
        • Tinted
      • CHINA Solar Power Window Market by Power Capacity Type

        • Less than 100 W
        • 100-500 W
        • 500-1000 W
        • Over 1000 W
      • INDIA Outlook (USD Billion, 2019-2032)
      • INDIA Solar Power Window Market by Technology Type

        • Crystalline Solar
        • Thin-Film Solar
        • Perovskite Solar
      • INDIA Solar Power Window Market by Application Type

        • Commercial Buildings
        • Residential Buildings
        • Transportation
      • INDIA Solar Power Window Market by Transparency Level Type

        • Fully Transparent
        • Semi-Transparent
        • Tinted
      • INDIA Solar Power Window Market by Power Capacity Type

        • Less than 100 W
        • 100-500 W
        • 500-1000 W
        • Over 1000 W
      • JAPAN Outlook (USD Billion, 2019-2032)
      • JAPAN Solar Power Window Market by Technology Type

        • Crystalline Solar
        • Thin-Film Solar
        • Perovskite Solar
      • JAPAN Solar Power Window Market by Application Type

        • Commercial Buildings
        • Residential Buildings
        • Transportation
      • JAPAN Solar Power Window Market by Transparency Level Type

        • Fully Transparent
        • Semi-Transparent
        • Tinted
      • JAPAN Solar Power Window Market by Power Capacity Type

        • Less than 100 W
        • 100-500 W
        • 500-1000 W
        • Over 1000 W
      • SOUTH KOREA Outlook (USD Billion, 2019-2032)
      • SOUTH KOREA Solar Power Window Market by Technology Type

        • Crystalline Solar
        • Thin-Film Solar
        • Perovskite Solar
      • SOUTH KOREA Solar Power Window Market by Application Type

        • Commercial Buildings
        • Residential Buildings
        • Transportation
      • SOUTH KOREA Solar Power Window Market by Transparency Level Type

        • Fully Transparent
        • Semi-Transparent
        • Tinted
      • SOUTH KOREA Solar Power Window Market by Power Capacity Type

        • Less than 100 W
        • 100-500 W
        • 500-1000 W
        • Over 1000 W
      • MALAYSIA Outlook (USD Billion, 2019-2032)
      • MALAYSIA Solar Power Window Market by Technology Type

        • Crystalline Solar
        • Thin-Film Solar
        • Perovskite Solar
      • MALAYSIA Solar Power Window Market by Application Type

        • Commercial Buildings
        • Residential Buildings
        • Transportation
      • MALAYSIA Solar Power Window Market by Transparency Level Type

        • Fully Transparent
        • Semi-Transparent
        • Tinted
      • MALAYSIA Solar Power Window Market by Power Capacity Type

        • Less than 100 W
        • 100-500 W
        • 500-1000 W
        • Over 1000 W
      • THAILAND Outlook (USD Billion, 2019-2032)
      • THAILAND Solar Power Window Market by Technology Type

        • Crystalline Solar
        • Thin-Film Solar
        • Perovskite Solar
      • THAILAND Solar Power Window Market by Application Type

        • Commercial Buildings
        • Residential Buildings
        • Transportation
      • THAILAND Solar Power Window Market by Transparency Level Type

        • Fully Transparent
        • Semi-Transparent
        • Tinted
      • THAILAND Solar Power Window Market by Power Capacity Type

        • Less than 100 W
        • 100-500 W
        • 500-1000 W
        • Over 1000 W
      • INDONESIA Outlook (USD Billion, 2019-2032)
      • INDONESIA Solar Power Window Market by Technology Type

        • Crystalline Solar
        • Thin-Film Solar
        • Perovskite Solar
      • INDONESIA Solar Power Window Market by Application Type

        • Commercial Buildings
        • Residential Buildings
        • Transportation
      • INDONESIA Solar Power Window Market by Transparency Level Type

        • Fully Transparent
        • Semi-Transparent
        • Tinted
      • INDONESIA Solar Power Window Market by Power Capacity Type

        • Less than 100 W
        • 100-500 W
        • 500-1000 W
        • Over 1000 W
      • REST OF APAC Outlook (USD Billion, 2019-2032)
      • REST OF APAC Solar Power Window Market by Technology Type

        • Crystalline Solar
        • Thin-Film Solar
        • Perovskite Solar
      • REST OF APAC Solar Power Window Market by Application Type

        • Commercial Buildings
        • Residential Buildings
        • Transportation
      • REST OF APAC Solar Power Window Market by Transparency Level Type

        • Fully Transparent
        • Semi-Transparent
        • Tinted
      • REST OF APAC Solar Power Window Market by Power Capacity Type

        • Less than 100 W
        • 100-500 W
        • 500-1000 W
        • Over 1000 W
    • South America Outlook (USD Billion, 2019-2032)

      • South America Solar Power Window Market by Technology Type

        • Crystalline Solar
        • Thin-Film Solar
        • Perovskite Solar
      • South America Solar Power Window Market by Application Type

        • Commercial Buildings
        • Residential Buildings
        • Transportation
      • South America Solar Power Window Market by Transparency Level Type

        • Fully Transparent
        • Semi-Transparent
        • Tinted
      • South America Solar Power Window Market by Power Capacity Type

        • Less than 100 W
        • 100-500 W
        • 500-1000 W
        • Over 1000 W
      • South America Solar Power Window Market by Regional Type

        • Brazil
        • Mexico
        • Argentina
        • Rest of South America
      • BRAZIL Outlook (USD Billion, 2019-2032)
      • BRAZIL Solar Power Window Market by Technology Type

        • Crystalline Solar
        • Thin-Film Solar
        • Perovskite Solar
      • BRAZIL Solar Power Window Market by Application Type

        • Commercial Buildings
        • Residential Buildings
        • Transportation
      • BRAZIL Solar Power Window Market by Transparency Level Type

        • Fully Transparent
        • Semi-Transparent
        • Tinted
      • BRAZIL Solar Power Window Market by Power Capacity Type

        • Less than 100 W
        • 100-500 W
        • 500-1000 W
        • Over 1000 W
      • MEXICO Outlook (USD Billion, 2019-2032)
      • MEXICO Solar Power Window Market by Technology Type

        • Crystalline Solar
        • Thin-Film Solar
        • Perovskite Solar
      • MEXICO Solar Power Window Market by Application Type

        • Commercial Buildings
        • Residential Buildings
        • Transportation
      • MEXICO Solar Power Window Market by Transparency Level Type

        • Fully Transparent
        • Semi-Transparent
        • Tinted
      • MEXICO Solar Power Window Market by Power Capacity Type

        • Less than 100 W
        • 100-500 W
        • 500-1000 W
        • Over 1000 W
      • ARGENTINA Outlook (USD Billion, 2019-2032)
      • ARGENTINA Solar Power Window Market by Technology Type

        • Crystalline Solar
        • Thin-Film Solar
        • Perovskite Solar
      • ARGENTINA Solar Power Window Market by Application Type

        • Commercial Buildings
        • Residential Buildings
        • Transportation
      • ARGENTINA Solar Power Window Market by Transparency Level Type

        • Fully Transparent
        • Semi-Transparent
        • Tinted
      • ARGENTINA Solar Power Window Market by Power Capacity Type

        • Less than 100 W
        • 100-500 W
        • 500-1000 W
        • Over 1000 W
      • REST OF SOUTH AMERICA Outlook (USD Billion, 2019-2032)
      • REST OF SOUTH AMERICA Solar Power Window Market by Technology Type

        • Crystalline Solar
        • Thin-Film Solar
        • Perovskite Solar
      • REST OF SOUTH AMERICA Solar Power Window Market by Application Type

        • Commercial Buildings
        • Residential Buildings
        • Transportation
      • REST OF SOUTH AMERICA Solar Power Window Market by Transparency Level Type

        • Fully Transparent
        • Semi-Transparent
        • Tinted
      • REST OF SOUTH AMERICA Solar Power Window Market by Power Capacity Type

        • Less than 100 W
        • 100-500 W
        • 500-1000 W
        • Over 1000 W
    • MEA Outlook (USD Billion, 2019-2032)

      • MEA Solar Power Window Market by Technology Type

        • Crystalline Solar
        • Thin-Film Solar
        • Perovskite Solar
      • MEA Solar Power Window Market by Application Type

        • Commercial Buildings
        • Residential Buildings
        • Transportation
      • MEA Solar Power Window Market by Transparency Level Type

        • Fully Transparent
        • Semi-Transparent
        • Tinted
      • MEA Solar Power Window Market by Power Capacity Type

        • Less than 100 W
        • 100-500 W
        • 500-1000 W
        • Over 1000 W
      • MEA Solar Power Window Market by Regional Type

        • GCC Countries
        • South Africa
        • Rest of MEA
      • GCC COUNTRIES Outlook (USD Billion, 2019-2032)
      • GCC COUNTRIES Solar Power Window Market by Technology Type

        • Crystalline Solar
        • Thin-Film Solar
        • Perovskite Solar
      • GCC COUNTRIES Solar Power Window Market by Application Type

        • Commercial Buildings
        • Residential Buildings
        • Transportation
      • GCC COUNTRIES Solar Power Window Market by Transparency Level Type

        • Fully Transparent
        • Semi-Transparent
        • Tinted
      • GCC COUNTRIES Solar Power Window Market by Power Capacity Type

        • Less than 100 W
        • 100-500 W
        • 500-1000 W
        • Over 1000 W
      • SOUTH AFRICA Outlook (USD Billion, 2019-2032)
      • SOUTH AFRICA Solar Power Window Market by Technology Type

        • Crystalline Solar
        • Thin-Film Solar
        • Perovskite Solar
      • SOUTH AFRICA Solar Power Window Market by Application Type

        • Commercial Buildings
        • Residential Buildings
        • Transportation
      • SOUTH AFRICA Solar Power Window Market by Transparency Level Type

        • Fully Transparent
        • Semi-Transparent
        • Tinted
      • SOUTH AFRICA Solar Power Window Market by Power Capacity Type

        • Less than 100 W
        • 100-500 W
        • 500-1000 W
        • Over 1000 W
      • REST OF MEA Outlook (USD Billion, 2019-2032)
      • REST OF MEA Solar Power Window Market by Technology Type

        • Crystalline Solar
        • Thin-Film Solar
        • Perovskite Solar
      • REST OF MEA Solar Power Window Market by Application Type

        • Commercial Buildings
        • Residential Buildings
        • Transportation
      • REST OF MEA Solar Power Window Market by Transparency Level Type

        • Fully Transparent
        • Semi-Transparent
        • Tinted
      • REST OF MEA Solar Power Window Market by Power Capacity Type

        • Less than 100 W
        • 100-500 W
        • 500-1000 W
        • Over 1000 W
    Report Infographic
    Free Sample Request

    Kindly complete the form below to receive a free sample of this Report

    Customer Strories

    “I am very pleased with how market segments have been defined in a relevant way for my purposes (such as "Portable Freezers & refrigerators" and "last-mile"). In general the report is well structured. Thanks very much for your efforts.”

    Victoria Milne Founder
    Case Study

    Chemicals and Materials