• Cat-intel
  • MedIntelliX
  • Resources
  • About Us
  • Hero Background
    English
    Chinese
    French
    Japanese
    Korean
    German
    Spanish

    Smart Connected Devices Market Share

    ID: MRFR/SEM/4213-HCR
    100 Pages
    Shubham Munde
    October 2025

    Smart Connected Devices Market Research Report Information By Product (Smartphones, Smart Watch, Smart Glasses, Wireless Printers, Smart Meters, Smart Cameras, Connected Bulbs, Smart Locks), End User (Industrial, Commercial, Residential)- Industry Forecast Till 2035

    Share:
    Download PDF ×

    We do not share your information with anyone. However, we may send you emails based on your report interest from time to time. You may contact us at any time to opt-out.

    Smart Connected Devices Market Infographic
    $ 4,950.0
    $ 5,950.0
    $ 7,250.0

    Market Share

    Smart Connected Devices Market Share Analysis

    In the dynamic landscape of the Smart Connected Devices Market, companies deploy various market share positioning strategies to gain a competitive edge and establish themselves as leaders in this rapidly evolving industry. One crucial strategy involves continuous innovation and differentiation. Companies invest heavily in research and development to create smart connected devices with advanced features, improved connectivity, and enhanced functionalities. Whether it's smartphones, smartwatches, or other IoT devices, staying at the forefront of technological advancements is paramount. By offering cutting-edge products, companies attract consumers who seek the latest and most sophisticated smart devices, positioning themselves as industry innovators.

    Cost leadership is another pivotal strategy within the Smart Connected Devices Market. Companies aim to provide cost-effective solutions by optimizing manufacturing processes, negotiating favorable supplier agreements, and enhancing overall operational efficiency. This approach appeals to a broad customer base, particularly those who prioritize affordability without compromising on quality. Strategic partnerships with component suppliers and distribution channels are often leveraged to ensure a streamlined supply chain, contributing to overall cost-effectiveness.

    Market segmentation plays a crucial role in effective market share positioning within the Smart Connected Devices Market. Companies identify specific consumer segments or target markets based on demographics, preferences, or use-case scenarios. Tailoring products to address the unique needs of these segments allows companies to capture significant market shares within specific niches. For example, a company might focus on developing ruggedized smart devices for outdoor enthusiasts or specialized health monitoring features for the elderly population.

    Strategic collaborations and partnerships are instrumental in enhancing market share within the Smart Connected Devices Market. Companies often form alliances with tech giants, software developers, or other device manufacturers to create seamless ecosystems. This integration ensures that smart devices can work cohesively with various platforms and services, enhancing the overall user experience. Additionally, collaborations with telecom providers can optimize connectivity, ensuring that smart devices remain connected and functional in diverse environments.

    Effective marketing and brand positioning are critical components of market share strategies within the Smart Connected Devices Market. Companies invest in marketing campaigns to highlight the benefits of their smart devices, emphasizing factors such as user-friendly interfaces, interoperability, and unique features. Building a strong brand identity establishes trust and credibility, influencing consumers to choose specific smart devices over competitors. Leveraging digital marketing channels, participating in industry events, and engaging with consumers through various platforms contribute to a robust market presence.

    Market Summary

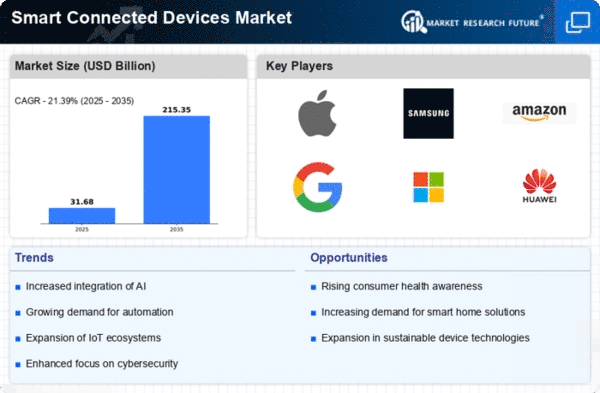
    As per Market Research Future Analysis, the Smart Connected Devices Market was valued at USD 21.5 billion in 2023 and is projected to grow from USD 26.1 billion in 2024 to USD 123.4 billion by 2032, with a CAGR of 21.4% during the forecast period. The market is driven by increasing demand for IoT and cloud-based platforms, alongside technological advancements that enhance energy efficiency and comfort. However, challenges such as the complexity of system upgrades and budget constraints may hinder growth. The APAC region is expected to lead market expansion, supported by government initiatives and investments in smart connected systems.

    Key Market Trends & Highlights

    The Smart Connected Devices Market is experiencing rapid growth driven by technological advancements and increasing consumer demand.

    • Market Size in 2023: USD 21.5 billion Projected Market Size by 2032: USD 123.4 billion CAGR from 2024 to 2032: 21.4% APAC region expected to grow at the highest rate during the forecast period

    Market Size & Forecast

    2023 Market Size USD 21.5 billion
    2024 Market Size USD 26.1 billion
    2032 Market Size USD 123.4 billion
    CAGR (2024-2032) 21.4%

    Major Players

    <p>Intel Corporation, Broadcom Corporation, Texas Instruments, ABB Ltd, Google, Amazon</p>

    Market Trends

    <p>The proliferation of smart connected devices is reshaping consumer interactions and driving innovation across various sectors, indicating a transformative shift in technology adoption.</p>

    U.S. Department of Commerce

    Smart Connected Devices Market Market Drivers

    Rising Consumer Demand for Smart Devices

    The Global Smart Connected Devices Market Industry experiences a notable surge in consumer demand for smart devices, driven by the increasing integration of technology into daily life. In 2024, the market is projected to reach 26.1 USD Billion, reflecting a growing preference for devices that enhance convenience and connectivity. Consumers are increasingly seeking smart home devices, wearables, and connected appliances that offer seamless integration with their lifestyles. This trend indicates a shift towards a more connected living environment, where devices communicate and collaborate, thereby improving user experience and efficiency.

    Market Segment Insights

    Regional Insights

    Key Companies in the Smart Connected Devices Market market include

    Industry Developments

    Amazon:

    • September 28, 2023- Launched "Astro," a home robot offering security, companionship, and entertainment features.
    • February 8, 2024- Partnered with Qualcomm to develop edge computing solutions for smart devices.

    Google:

    • July 28, 2023- Unveiled the Pixel Buds Pro with improved noise cancellation and multipoint connectivity.
    • January 4, 2024- Announced advancements in its Matter smart home platform.

    Intended Audience

    • Potential Market Investors
    • Smart Connected Device Manufacturers And Vendors
    • Enterprises, Business and Corporate Entities
    • Research And Development Institutions
    • Company Headquarters
    • Management and Marketing Systems
    • Government and Public Entities
    • Members of Public Associations Functioning for the Benefit of Established Companies
    • Startups

    Future Outlook

    Smart Connected Devices Market Future Outlook

    <p>The <a href="https://www.marketresearchfuture.com/reports/us-smart-connected-devices-market-18143">Smart Connected Devices Market </a>is poised for robust growth at 21.42% CAGR from 2024 to 2035, driven by advancements in IoT, AI integration, and consumer demand for automation.</p>

    New opportunities lie in:

    • <p>Develop AI-driven analytics platforms for enhanced device interoperability.&nbsp;</p><p>Invest in sustainable materials for eco-friendly smart devices.&nbsp;</p><p>Create subscription models for software updates and device management services.</p>

    <p>By 2035, the Smart Connected Devices Market is expected to achieve substantial growth, reflecting evolving consumer preferences and technological advancements.</p>

    Market Segmentation

    Smart Connected Devices Module Outlook

    • Hardware
    • APM software & platform
    • Service

    Smart Connected Devices Industry Outlook

    • Automotive & Transportation
    • Energy & Power
    • Healthcare
    • Smart Agriculture
    • Factory Automation
    • Others (Metal & Mining
    • Food & beverage
    • and Textile)
    • Americas
    • Europe
    • APAC
    • RoW
    • Intel Corporation (U.S.)
    • iSolution international Pvt. Ltd ( Philippines)
    • Broadcom Corporation (U.S.)
    • OMCS International (U.S.)
    • Freescale Semiconductor
    • Inc. (U.S.)
    • Maintenance Assistant Inc. (U.S.)
    • ARM holding plc (U.K.)
    • Bentley systems incorporated (U.S.)
    • Texas Instruments (U.S.)
    • Cypress Semiconductor (U.S.)
    • ABB Ltd (Switzerland)
    • Rockwell Automation (U.S.)
    • NXP Semiconductor (Netherlands)
    • September 28
    •  2023- Launched "Astro
    • " a home robot offering security
    •  companionship
    •  and entertainment features.
    • February 8
    •  2024- Partnered with Qualcomm to develop edge computing solutions for smart devices.
    • July 28
    •  2023- Unveiled the Pixel Buds Pro with improved noise cancellation and multipoint connectivity.
    • January 4
    • 2024- Announced advancements in its Matter smart home platform.
    • Potential Market Investors
    • Smart Connected Device Manufacturers And Vendors
    • Enterprises
    • Business and Corporate Entities
    • Research And Development Institutions
    • Company Headquarters
    • Management and Marketing Systems
    • Government and Public Entities
    • Members of Public Associations Functioning for the Benefit of Established Companies
    • Startups

    Report Scope

    Report Attribute/MetricDetails
    Market Size 2032123.4 Billion
    CAGR21.4%
    Base Year2023
    Forecast Period2024-2032
    Historical Data2018 and 2022
    Forecast UnitsValue (USD Million)
    Report CoverageRevenue Forecast, Competitive Landscape, Growth Factors, and Trends
    Segments CoveredBy Module, Industry and Geography
    Geographies CoveredNorth America, Europe, Asia-Pacific, and Rest of the World (RoW)
    Key VendorsSony Corporation (Japan), Samsung Electronics Co. Ltd. (South Korea), Motorola Solutions Inc. (U.S.), Nokia Networks (Finland), LG Corporation (South Korea), Hewlett-Packard (U.S.), HTC Corporation (Taiwan), Apple Inc. (U.S.), Dell Inc. (U.S.), Gionee Communication Equipment Co. Ltd (China), Micromax Informatics (India), Videocon Industries Ltd. (India), Acer Inc. (Taiwan), Lenovo Group Ltd. (Hong Kong), Blackberry Ltd. (Canada), and ZTE Corporation (China)
    Key Market OpportunitiesThe growth of the market in North America is attributed to technological advancements and increased adoption of smart connected devices across various industry verticals.
    Key Market Drivers·  Major factors driving the growth of smart connected devices market include the growing demand for smartphones, tablets, and other smart devices and growing popularity of bringing your own device.·  Increasing demand for mobile smart connected devices is expected to drive the growth of the global smart connected devices market.

    Market Highlights

    Author

    Shubham Munde
    Research Analyst Level II

    She holds an experience of about 6+ years in market research and business consulting, working under the spectrum of information communication technology, telecommunications and semiconductor domains. aarti conceptualizes and implements a scalable business strategy and provides strategic leadership to the clients. her expertise lies in market estimation, competitive intelligence, pipeline analysis, customer assessment, etc.

    Leave a Comment

    Latest Comments

    John Doe
    john@example.com

    This is a great article! Really helped me understand the topic better.

    Posted on July 23, 2025, 10:15 AM
    Jane Smith
    jane@domain.com

    Thanks for sharing this. I’ve bookmarked it for later reference.

    Posted on July 22, 2025, 7:45 PM

    FAQs

    What are the major tailwinds pushing the growth of the global smart connected devices market?

    Growing demand for smart devices, such as smartphones, tablets and BYOD trend are the major tailwinds pushing the growth of the global smart connected devices market.

    Which is the major segment in the global smart connected devices market?

    Smart locks by product is the largest segment in the global smart connected devices market.

    Who are the top players in the global smart connected devices market?

    Samsung Electronics Co. Ltd. (South Korea), Sony Corporation (Japan), Motorola Solutions Inc. (U.S.), LG Corporation (South Korea), Nokia Networks (Finland), Hewlett- Packard (U.S.), Apple Inc. (U.S.), HTC Corporation (Taiwan), Dell Inc. (U.S.), Micromax Informatics (India), Gionee Communication Equipment Co. Ltd (China), Videocon Industries Ltd. (India), Lenovo Group Ltd. (Hong Kong), Acer Inc. (Taiwan), ZTE Corporation (China), and Blackberry Ltd. (Canada), are some of the top players operating in the global smart connected devices market.

    1. . Global Smart Connected Devices Market by Product
      1. Introduction
      2. Media Players
      3. Market Estimates & Forecast, 2024-2032
      4. Market Estimates & Forecast by Region, 2024-2032
      5. Smart Watch
      6. Market Estimates & Forecast, 2024-2032
      7. Market Estimates & Forecast by Region, 2024-2032
      8. Smart Band
      9. Market Estimates & Forecast, 2024-2032
      10. Market Estimates & Forecast by Region, 2024-2032
      11. Smart Glasses
      12. Market Estimates & Forecast, 2024-2032
      13. Market Estimates & Forecast by Region, 2024-2032
      14. Smart Clothing
      15. Market Estimates & Forecast, 2024-2032
      16. Market Estimates & Forecast by Region, 2024-2032
      17. Wireless Printers
      18. Market Estimates & Forecast, 2024-2032
      19. Market Estimates & Forecast by Region, 2024-2032
      20. Smart Meters
      21. Market Estimates & Forecast, 2024-2032
      22. Market Estimates & Forecast by Region, 2024-2032
      23. Smart Cameras
      24. Market Estimates & Forecast, 2024-2032
      25. Market Estimates & Forecast by Region, 2024-2032
      26. Connected Bulbs
      27. Market Estimates & Forecast, 2024-2032
      28. Market Estimates & Forecast by Region, 2024-2032
      29. Smart Locks
      30. Market Estimates & Forecast, 2024-2032
      31. Market Estimates & Forecast by Region, 2024-2032
      32. Smart Thermostats
      33. Market Estimates & Forecast, 2024-2032
      34. Market Estimates & Forecast by Region, 2024-2032
      35. Smart Home Appliances
      36. Market Estimates & Forecast, 2024-2032
      37. Market Estimates & Forecast by Region, 2024-2032
      38. Smartphones
      39. Market Estimates & Forecast, 2024-2032
      40. Market Estimates & Forecast by Region, 2024-2032
      41. Tablets
      42. Market Estimates & Forecast, 2024-2032
      43. Market Estimates & Forecast by Region, 2024-2032
    2. Introduction
    3. Media Players
    4. Market Estimates & Forecast, 2024-2032
    5. Market Estimates & Forecast by Region, 2024-2032
    6. Smart Watch
    7. Market Estimates & Forecast, 2024-2032
    8. Market Estimates & Forecast by Region, 2024-2032
    9. Smart Band
    10. Market Estimates & Forecast, 2024-2032
    11. Market Estimates & Forecast by Region, 2024-2032
    12. Smart Glasses
    13. Market Estimates & Forecast, 2024-2032
    14. Market Estimates & Forecast by Region, 2024-2032
    15. Smart Clothing
    16. Market Estimates & Forecast, 2024-2032
    17. Market Estimates & Forecast by Region, 2024-2032
    18. Wireless Printers
    19. Market Estimates & Forecast, 2024-2032
    20. Market Estimates & Forecast by Region, 2024-2032
    21. Smart Meters
    22. Market Estimates & Forecast, 2024-2032
    23. Market Estimates & Forecast by Region, 2024-2032
    24. Smart Cameras
    25. Market Estimates & Forecast, 2024-2032
    26. Market Estimates & Forecast by Region, 2024-2032
    27. Connected Bulbs
    28. Market Estimates & Forecast, 2024-2032
    29. Market Estimates & Forecast by Region, 2024-2032
    30. Smart Locks
    31. Market Estimates & Forecast, 2024-2032
    32. Market Estimates & Forecast by Region, 2024-2032
    33. Smart Thermostats
    34. Market Estimates & Forecast, 2024-2032
    35. Market Estimates & Forecast by Region, 2024-2032
    36. Smart Home Appliances
    37. Market Estimates & Forecast, 2024-2032
    38. Market Estimates & Forecast by Region, 2024-2032
    39. Smartphones
    40. Market Estimates & Forecast, 2024-2032
    41. Market Estimates & Forecast by Region, 2024-2032
    42. Tablets
    43. Market Estimates & Forecast, 2024-2032
    44. Market Estimates & Forecast by Region, 2024-2032
    45. . Global Smart Connected Devices Market by End User
      1. Introduction
      2. Industrial
      3. Market Estimates & Forecast, 2024-2032
      4. Market Estimates & Forecast by Region, 2024-2032
      5. Commercial
      6. Market Estimates & Forecast, 2024-2032
      7. Market Estimates & Forecast by Region, 2024-2032
      8. Residential
      9. Market Estimates & Forecast, 2024-2032
      10. Market Estimates & Forecast by Region, 2024-2032
    46. Introduction
    47. Industrial
    48. Market Estimates & Forecast, 2024-2032
    49. Market Estimates & Forecast by Region, 2024-2032
    50. Commercial
    51. Market Estimates & Forecast, 2024-2032
    52. Market Estimates & Forecast by Region, 2024-2032
    53. Residential
    54. Market Estimates & Forecast, 2024-2032
    55. Market Estimates & Forecast by Region, 2024-2032
    56. . Global Smart Connected Devices Market by Region
      1. Introduction
      2. North America
      3. Market Estimates & Forecast, 2024-2032
      4. Market Estimates & Forecast by Product, 2024-2032
      5. Market Estimates & Forecast by End User, 2024-2032
      6. U.S.
      7. Market Estimates & Forecast, 2024-2032
      8. Market Estimates & Forecast by Product, 2024-2032
      9. Market Estimates & Forecast by End User, 2024-2032
      10. Canada
      11. Market Estimates & Forecast, 2024-2032
      12. Market Estimates & Forecast by Product, 2024-2032
      13. Market Estimates & Forecast by End User, 2024-2032
      14. Mexico
      15. Market Estimates & Forecast, 2024-2032
      16. Market Estimates & Forecast by Product, 2024-2032
      17. Market Estimates & Forecast by End User, 2024-2032
      18. Europe
      19. Market Estimates & Forecast, 2024-2032
      20. Market Estimates & Forecast by Product, 2024-2032
      21. Market Estimates & Forecast by End User, 2024-2032
      22. Germany
      23. Market Estimates & Forecast, 2024-2032
      24. Market Estimates & Forecast by Product, 2024-2032
      25. Market Estimates & Forecast by End User, 2024-2032
      26. France
      27. Market Estimates & Forecast, 2024-2032
      28. Market Estimates & Forecast by Product, 2024-2032
      29. Market Estimates & Forecast by End User, 2024-2032
      30. Italy
      31. Market Estimates & Forecast, 2024-2032
      32. Market Estimates & Forecast by Product, 2024-2032
      33. Market Estimates & Forecast by End User, 2024-2032
      34. Spain
      35. Market Estimates & Forecast, 2024-2032
      36. Market Estimates & Forecast by Product, 2024-2032
      37. Market Estimates & Forecast by End User 2024-2032
      38. U.K
      39. Market Estimates & Forecast, 2024-2032
      40. Market Estimates & Forecast by Product, 2024-2032
      41. Market Estimates & Forecast by End User, 2024-2032
      42. Asia Pacific
      43. Market Estimates & Forecast, 2024-2032
      44. Market Estimates & Forecast by Product, 2024-2032
      45. Market Estimates & Forecast by End User, 2024-2032
      46. China
      47. Market Estimates & Forecast, 2024-2032
      48. Market Estimates & Forecast by Product, 2024-2032
      49. Market Estimates & Forecast by End User, 2024-2032
      50. India
      51. Market Estimates & Forecast, 2024-2032
      52. Market Estimates & Forecast by Product, 2024-2032
      53. Market Estimates & Forecast by End User, 2024-2032
      54. Japan
      55. Market Estimates & Forecast, 2024-2032
      56. Market Estimates & Forecast by Product, 2024-2032
      57. Market Estimates & Forecast by End User, 2024-2032
      58. Rest of Asia Pacific
      59. Market Estimates & Forecast, 2024-2032
      60. Market Estimates & Forecast by Product, 2024-2032
      61. Market Estimates & Forecast by End User, 2024-2032
      62. Rest of the World
      63. Market Estimates & Forecast, 2024-2032
      64. Market Estimates & Forecast by Product, 2024-2032
      65. Market Estimates & Forecast by End User, 2024-2032
      66. The Middle East & Africa
      67. Market Estimates & Forecast, 2024-2032
      68. Market Estimates & Forecast by Product, 2024-2032
      69. Market Estimates & Forecast by End User, 2024-2032
      70. Latin America
      71. Market Estimates & Forecast, 2024-2032
      72. Market Estimates & Forecast by Product, 2024-2032
      73. Market Estimates & Forecast by End User, 2024-2032
    57. Introduction
    58. North America
    59. Market Estimates & Forecast, 2024-2032
    60. Market Estimates & Forecast by Product, 2024-2032
    61. Market Estimates & Forecast by End User, 2024-2032
    62. U.S.
    63. Market Estimates & Forecast, 2024-2032
    64. Market Estimates & Forecast by Product, 2024-2032
    65. Market Estimates & Forecast by End User, 2024-2032
    66. Canada
    67. Market Estimates & Forecast, 2024-2032
    68. Market Estimates & Forecast by Product, 2024-2032
    69. Market Estimates & Forecast by End User, 2024-2032
    70. Mexico
    71. Market Estimates & Forecast, 2024-2032
    72. Market Estimates & Forecast by Product, 2024-2032
    73. Market Estimates & Forecast by End User, 2024-2032
    74. Europe
    75. Market Estimates & Forecast, 2024-2032
    76. Market Estimates & Forecast by Product, 2024-2032
    77. Market Estimates & Forecast by End User, 2024-2032
    78. Germany
    79. Market Estimates & Forecast, 2024-2032
    80. Market Estimates & Forecast by Product, 2024-2032
    81. Market Estimates & Forecast by End User, 2024-2032
    82. France
    83. Market Estimates & Forecast, 2024-2032
    84. Market Estimates & Forecast by Product, 2024-2032
    85. Market Estimates & Forecast by End User, 2024-2032
    86. Italy
    87. Market Estimates & Forecast, 2024-2032
    88. Market Estimates & Forecast by Product, 2024-2032
    89. Market Estimates & Forecast by End User, 2024-2032
    90. Spain
    91. Market Estimates & Forecast, 2024-2032
    92. Market Estimates & Forecast by Product, 2024-2032
    93. Market Estimates & Forecast by End User 2024-2032
    94. U.K
    95. Market Estimates & Forecast, 2024-2032
    96. Market Estimates & Forecast by Product, 2024-2032
    97. Market Estimates & Forecast by End User, 2024-2032
    98. Asia Pacific
    99. Market Estimates & Forecast, 2024-2032
    100. Market Estimates & Forecast by Product, 2024-2032
    101. Market Estimates & Forecast by End User, 2024-2032
    102. China
    103. Market Estimates & Forecast, 2024-2032
    104. Market Estimates & Forecast by Product, 2024-2032
    105. Market Estimates & Forecast by End User, 2024-2032
    106. India
    107. Market Estimates & Forecast, 2024-2032
    108. Market Estimates & Forecast by Product, 2024-2032
    109. Market Estimates & Forecast by End User, 2024-2032
    110. Japan
    111. Market Estimates & Forecast, 2024-2032
    112. Market Estimates & Forecast by Product, 2024-2032
    113. Market Estimates & Forecast by End User, 2024-2032
    114. Rest of Asia Pacific
    115. Market Estimates & Forecast, 2024-2032
    116. Market Estimates & Forecast by Product, 2024-2032
    117. Market Estimates & Forecast by End User, 2024-2032
    118. Rest of the World
    119. Market Estimates & Forecast, 2024-2032
    120. Market Estimates & Forecast by Product, 2024-2032
    121. Market Estimates & Forecast by End User, 2024-2032
    122. The Middle East & Africa
    123. Market Estimates & Forecast, 2024-2032
    124. Market Estimates & Forecast by Product, 2024-2032
    125. Market Estimates & Forecast by End User, 2024-2032
    126. Latin America
    127. Market Estimates & Forecast, 2024-2032
    128. Market Estimates & Forecast by Product, 2024-2032
    129. Market Estimates & Forecast by End User, 2024-2032
    130. . Company Landscape
    131. . Company Profiles
      1. Sony Corporation (Japan)
      2. Company Overview
      3. Product/Business Segment Overview
      4. Financial Updates
      5. Key Developments
      6. Samsung Electronics Co. Ltd. (South Korea)
      7. Company Overview
      8. Product/Business Segment Overview
      9. Financial Updates
      10. Key Developments
      11. Motorola Solutions Inc. (U.S.)
      12. Company Overview
      13. Product/Business Segment Overview
      14. Financial Updates
      15. Key Developments
      16. Nokia Networks (Finland)
      17. Company Overview
      18. Product/Business Segment Overview
      19. Financial Updates
      20. Key Developments
      21. LG Corporation (South Korea)
      22. Company Overview
      23. Product/Business Segment Overview
      24. Financial Updates
      25. Key Developments
      26. Hewlett-Packard (U.S.)
      27. Company Overview
      28. Product/Business Segment Overview
      29. Financial Updates
      30. Key Developments
      31. HTC Corporation (Taiwan)
      32. Company Overview
      33. Product/Business Segment Overview
      34. Financial Updates
      35. Key Developments
      36. Apple Inc. (U.S.)
      37. Company Overview
      38. Product/Business Segment Overview
      39. Financial Updates
      40. Key Developments
      41. Dell Inc. (U.S.)
      42. Company Overview
      43. Product/Business Segment Overview
      44. Financial Updates
      45. Key Developments
      46. Gionee Communication Equipment Co. Ltd (China)
      47. Company Overview
      48. Product/Business Segment Overview
      49. Financial Updates
      50. Key Developments
      51. Micromax Informatics (India)
      52. Company Overview
      53. Product/Business Segment Overview
      54. Financial Updates
      55. Key Developments
      56. Videocon Industries Ltd. (India)
      57. Company Overview
      58. Product/Business Segment Overview
      59. Financial Updates
      60. Key Developments
      61. Acer Inc. (Taiwan)
      62. Company Overview
      63. Product/Business Segment Overview
      64. Financial Updates
      65. Key Developments
      66. Lenovo Group Ltd. (Hong Kong)
      67. Company Overview
      68. Product/Business Segment Overview
      69. Financial Updates
      70. Key Developments
      71. Blackberry Ltd. (Canada)
      72. Company Overview
      73. Product/Business Segment Overview
      74. Financial Updates
      75. Key Developments
      76. ZTE Corporation (China)
      77. Company Overview
      78. Product/Business Segment Overview
      79. Financial Updates
      80. Key Developments 12 Conclusion   LIST OF TABLES Table 1 Global Smart Connected Devices Market: By Region, 2024-2032 Table 2 North America Smart Connected Devices Market: By Country, 2024-2032 Table 3 Europe Smart Connected Devices Market: By Country, 2024-2032 Table 4 Asia-Pacific Smart Connected Devices Market: By Country, 2024-2032 Table 5 Middle East & Africa Smart Connected Devices Market: By Country, 2024-2032 Table 6 Latin America Smart Connected Devices Market: By Country, 2024-2032 Table 7 Global Smart Connected Devices by Product Market: By Regions, 2024-2032 Table 8 North America Smart Connected Devices by Product Market: By Country, 2024-2032 Table 9 Europe Smart Connected Devices by Product Market: By Country, 2024-2032 Table10 Asia-Pacific Smart Connected Devices by Product Market: By Country, 2024-2032 Table11 Middle East & Africa Smart Connected Devices by Product Market: By Country, 2024-2032 Table12 Latin America Smart Connected Devices by Product Market: By Country, 2024-2032 Table13 Global Smart Connected Devices by End User Market: By Regions, 2024-2032 Table14 North America Smart Connected Devices by End User Market: By Country, 2024-2032 Table15 Europe Smart Connected Devices by End User Market: By Country, 2024-2032 Table16 Asia-Pacific Smart Connected Devices by End User Market: By Country, 2024-2032 Table17 Middle East & Africa Smart Connected Devices by End User Market: By Country, 2024-2032 Table18 Latin America Smart Connected Devices by End User Market: By Country, 2024-2032 Table19 Global Product Market: By Region, 2024-2032 Table20 Global End User Market: By Region, 2024-2032 Table21 North America Smart Connected Devices Market, By Country Table22 North America Smart Connected Devices Market, By Product Table23 North America Smart Connected Devices Market, By End User Table24 Europe: Smart Connected Devices Market, By Country Table25 Europe: Smart Connected Devices Market, By Product Table26 Europe: Smart Connected Devices Market, By End User Table27 Asia-Pacific: Smart Connected Devices Market, By Country Table28 Asia-Pacific: Smart Connected Devices Market, By Product Table29 Asia-Pacific: Smart Connected Devices Market, By End User Table30 Middle East & Africa: Smart Connected Devices Market, By Country Table31 Middle East & Africa Smart Connected Devices Market, By Product Table32 Middle East & Africa Smart Connected Devices Market, By End User Table33 Latin America: Smart Connected Devices Market, By Country Table34 Latin America Smart Connected Devices Market, By Product Table35 Latin America Smart Connected Devices Market, By End User   LIST OF FIGURES FIGURE 1 Global Smart Connected Devices Market Segmentation FIGURE 2 Forecast Methodology FIGURE 3 Porter’s Five Forces Analysis of Global Smart Connected Devices Market FIGURE 4 Value Chain of Global Smart Connected Devices Market FIGURE 5 Share of Global Smart Connected Devices Market in 2020, by country (in %) FIGURE 6 Global Smart Connected Devices Market, 2024-2032, FIGURE 7 Sub segments of Product FIGURE 8 Global Smart Connected Devices Market size by Product, 2020 FIGURE 9 Share of Global Smart Connected Devices Market by Product, 2024 TO 2032 FIGURE 10 Global Smart Connected Devices Market size by End User, 2020 FIGURE 11 Share of Global Smart Connected Devices Market by End User, 2024 TO 2032
    132. Sony Corporation (Japan)
    133. Company Overview
    134. Product/Business Segment Overview
    135. Financial Updates
    136. Key Developments
    137. Samsung Electronics Co. Ltd. (South Korea)
    138. Company Overview
    139. Product/Business Segment Overview
    140. Financial Updates
    141. Key Developments
    142. Motorola Solutions Inc. (U.S.)
    143. Company Overview
    144. Product/Business Segment Overview
    145. Financial Updates
    146. Key Developments
    147. Nokia Networks (Finland)
    148. Company Overview
    149. Product/Business Segment Overview
    150. Financial Updates
    151. Key Developments
    152. LG Corporation (South Korea)
    153. Company Overview
    154. Product/Business Segment Overview
    155. Financial Updates
    156. Key Developments
    157. Hewlett-Packard (U.S.)
    158. Company Overview
    159. Product/Business Segment Overview
    160. Financial Updates
    161. Key Developments
    162. HTC Corporation (Taiwan)
    163. Company Overview
    164. Product/Business Segment Overview
    165. Financial Updates
    166. Key Developments
    167. Apple Inc. (U.S.)
    168. Company Overview
    169. Product/Business Segment Overview
    170. Financial Updates
    171. Key Developments
    172. Dell Inc. (U.S.)
    173. Company Overview
    174. Product/Business Segment Overview
    175. Financial Updates
    176. Key Developments
    177. Gionee Communication Equipment Co. Ltd (China)
    178. Company Overview
    179. Product/Business Segment Overview
    180. Financial Updates
    181. Key Developments
    182. Micromax Informatics (India)
    183. Company Overview
    184. Product/Business Segment Overview
    185. Financial Updates
    186. Key Developments
    187. Videocon Industries Ltd. (India)
    188. Company Overview
    189. Product/Business Segment Overview
    190. Financial Updates
    191. Key Developments
    192. Acer Inc. (Taiwan)
    193. Company Overview
    194. Product/Business Segment Overview
    195. Financial Updates
    196. Key Developments
    197. Lenovo Group Ltd. (Hong Kong)
    198. Company Overview
    199. Product/Business Segment Overview
    200. Financial Updates
    201. Key Developments
    202. Blackberry Ltd. (Canada)
    203. Company Overview
    204. Product/Business Segment Overview
    205. Financial Updates
    206. Key Developments
    207. ZTE Corporation (China)
    208. Company Overview
    209. Product/Business Segment Overview
    210. Financial Updates
    211. Key Developments 12 Conclusion   LIST OF TABLES Table 1 Global Smart Connected Devices Market: By Region, 2024-2032 Table 2 North America Smart Connected Devices Market: By Country, 2024-2032 Table 3 Europe Smart Connected Devices Market: By Country, 2024-2032 Table 4 Asia-Pacific Smart Connected Devices Market: By Country, 2024-2032 Table 5 Middle East & Africa Smart Connected Devices Market: By Country, 2024-2032 Table 6 Latin America Smart Connected Devices Market: By Country, 2024-2032 Table 7 Global Smart Connected Devices by Product Market: By Regions, 2024-2032 Table 8 North America Smart Connected Devices by Product Market: By Country, 2024-2032 Table 9 Europe Smart Connected Devices by Product Market: By Country, 2024-2032 Table10 Asia-Pacific Smart Connected Devices by Product Market: By Country, 2024-2032 Table11 Middle East & Africa Smart Connected Devices by Product Market: By Country, 2024-2032 Table12 Latin America Smart Connected Devices by Product Market: By Country, 2024-2032 Table13 Global Smart Connected Devices by End User Market: By Regions, 2024-2032 Table14 North America Smart Connected Devices by End User Market: By Country, 2024-2032 Table15 Europe Smart Connected Devices by End User Market: By Country, 2024-2032 Table16 Asia-Pacific Smart Connected Devices by End User Market: By Country, 2024-2032 Table17 Middle East & Africa Smart Connected Devices by End User Market: By Country, 2024-2032 Table18 Latin America Smart Connected Devices by End User Market: By Country, 2024-2032 Table19 Global Product Market: By Region, 2024-2032 Table20 Global End User Market: By Region, 2024-2032 Table21 North America Smart Connected Devices Market, By Country Table22 North America Smart Connected Devices Market, By Product Table23 North America Smart Connected Devices Market, By End User Table24 Europe: Smart Connected Devices Market, By Country Table25 Europe: Smart Connected Devices Market, By Product Table26 Europe: Smart Connected Devices Market, By End User Table27 Asia-Pacific: Smart Connected Devices Market, By Country Table28 Asia-Pacific: Smart Connected Devices Market, By Product Table29 Asia-Pacific: Smart Connected Devices Market, By End User Table30 Middle East & Africa: Smart Connected Devices Market, By Country Table31 Middle East & Africa Smart Connected Devices Market, By Product Table32 Middle East & Africa Smart Connected Devices Market, By End User Table33 Latin America: Smart Connected Devices Market, By Country Table34 Latin America Smart Connected Devices Market, By Product Table35 Latin America Smart Connected Devices Market, By End User   LIST OF FIGURES FIGURE 1 Global Smart Connected Devices Market Segmentation FIGURE 2 Forecast Methodology FIGURE 3 Porter’s Five Forces Analysis of Global Smart Connected Devices Market FIGURE 4 Value Chain of Global Smart Connected Devices Market FIGURE 5 Share of Global Smart Connected Devices Market in 2020, by country (in %) FIGURE 6 Global Smart Connected Devices Market, 2024-2032, FIGURE 7 Sub segments of Product FIGURE 8 Global Smart Connected Devices Market size by Product, 2020 FIGURE 9 Share of Global Smart Connected Devices Market by Product, 2024 TO 2032 FIGURE 10 Global Smart Connected Devices Market size by End User, 2020 FIGURE 11 Share of Global Smart Connected Devices Market by End User, 2024 TO 2032
    212. List of Tables and Figures
      1. Table FIGURE 1 Global Smart Connected Devices Market Segmentation FIGURE 2 Forecast Methodology FIGURE 3 Porter’s Five Forces Analysis of Global Smart Connected Devices Market FIGURE 4 Value Chain of Global Smart Connected Devices Market FIGURE 5 Share of Global Smart Connected Devices Market in 2020, by country (in %) FIGURE 6 Global Smart Connected Devices Market, 2024-2032, FIGURE 7 Sub segments of Product FIGURE 8 Global Smart Connected Devices Market size by Product, 2020 FIGURE 9 Share of Global Smart Connected Devices Market by Product, 2024 TO 2032 FIGURE 10 Global Smart Connected Devices Market size by End User, 2020 FIGURE 11 Share of Global Smart Connected Devices Market by End User, 2024 TO 2032
    213. Table FIGURE 1 Global Smart Connected Devices Market Segmentation FIGURE 2 Forecast Methodology FIGURE 3 Porter’s Five Forces Analysis of Global Smart Connected Devices Market FIGURE 4 Value Chain of Global Smart Connected Devices Market FIGURE 5 Share of Global Smart Connected Devices Market in 2020, by country (in %) FIGURE 6 Global Smart Connected Devices Market, 2024-2032, FIGURE 7 Sub segments of Product FIGURE 8 Global Smart Connected Devices Market size by Product, 2020 FIGURE 9 Share of Global Smart Connected Devices Market by Product, 2024 TO 2032 FIGURE 10 Global Smart Connected Devices Market size by End User, 2020 FIGURE 11 Share of Global Smart Connected Devices Market by End User, 2024 TO 2032

    Smart Connected Devices Market Segmentation

    Market Segmentation Overview

    • Detailed segmentation data will be available in the full report
    • Comprehensive analysis by multiple parameters
    • Regional and country-level breakdowns
    • Market size forecasts by segment
    Infographic

    Free Sample Request

    Kindly complete the form below to receive a free sample of this Report

    Get Free Sample

    Customer Strories

    “I am very pleased with how market segments have been defined in a relevant way for my purposes (such as "Portable Freezers & refrigerators" and "last-mile"). In general the report is well structured. Thanks very much for your efforts.”

    Victoria Milne

    Founder
    Case Study
    Chemicals and Materials