• Cat-intel
  • MedIntelliX
  • Resources
  • About Us
  • Request Free Sample ×

    Kindly complete the form below to receive a free sample of this Report

    Leading companies partner with us for data-driven Insights

    clients tt-cursor

    Smart Building Market

    ID: MRFR/SEM/1328-CR
    232 Pages
    Shubham Munde
    July 2025

    Smart Buildings Market Research Report Information By Solution Type (Building Automation Systems, Energy Management Systems, Security & Access Control Systems, Others), By Technology (AI for Predictive Maintenance, IoT for Device Connectivity, Cloud Computing for Remote Monitoring & Management, AR & VR, Others), By Application (Energy Optimization & Management, Space Management, Safety & Security), By Functionality Type (Energy Management Solution, Building Automation Solution, Security & Access Control, Others) &...

    Share:
    Download PDF ×

    We do not share your information with anyone. However, we may send you emails based on your report interest from time to time. You may contact us at any time to opt-out.

    Smart Buildings Market Research Report – Forecast Till 2035 Infographic
    Purchase Options
    $ 4,950.0
    $ 5,950.0
    $ 7,250.0
    Table of Contents

    Smart Building Market Summary

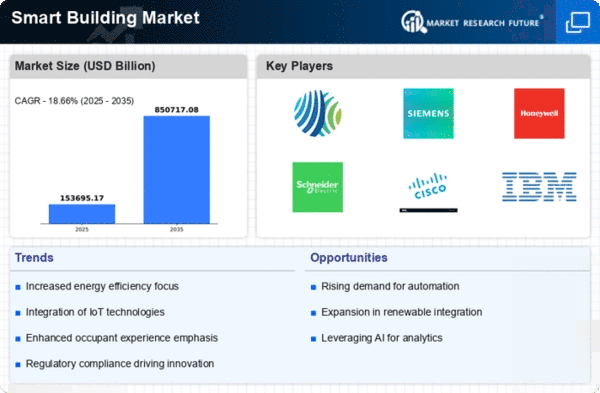
    As per Market Research Future Analysis, the Global Smart Buildings Market was valued at USD 83.49 billion in 2024 and is projected to reach USD 427.33 billion by 2035, growing at a CAGR of 16.1% from 2025 to 2035. The market is driven by advancements in technology, government support for energy-efficient solutions, and the increasing need for sustainable building practices. Smart buildings provide valuable data for optimizing energy consumption and operational efficiency, addressing the significant energy usage in the building sector, which accounts for 42% of global electricity consumption. The commercial segment leads the market, contributing approximately 46.24% to the revenue in 2022, while North America holds the largest market share at 36.87%.

    Key Market Trends & Highlights

    Key trends driving the Smart Buildings Market include energy efficiency, automation, and security enhancements.

    • Smart Buildings Market Size in 2025: USD 96.37 Billion
    • Projected Market Size by 2035: USD 427.33 Billion
    • CAGR from 2025 to 2035: 16.1%
    • Commercial segment contributed ~46.24% to market revenue in 2022

    Market Size & Forecast

    2024 Market Size USD 83.49 Billion
    2025 Market Size USD 96.37 Billion
    2035 Market Size USD 427.33 Billion

    Major Players

    Control4 Corporation, HCL Technologies Limited, Panasonic Corporation, Advantech Co. Ltd, Johnson Controls International PLC, Hitachi Ltd, Sony Corporation, IBM Corporation, Cisco Systems, Honeywell International, Inc., Emerson Electric Co, Overkiz, ABB Group, Huawei Technologies Co. Ltd, Siemens AG.

    Smart Building Market Trends

    The ongoing integration of advanced technologies in building management systems is reshaping the landscape of urban infrastructure, fostering enhanced energy efficiency and sustainability in smart buildings.

    U.S. Department of Energy

    Smart Building Market Drivers

    Market Growth Projections

    The Global Smart Buildings Market Industry is projected to experience substantial growth in the coming years. With a market value of 83.5 USD Billion in 2024, it is anticipated to reach 427.3 USD Billion by 2035. This growth trajectory indicates a compound annual growth rate of 16.0 percent from 2025 to 2035. Such projections highlight the increasing adoption of smart technologies in buildings, driven by factors such as energy efficiency, sustainability, and technological advancements. As the market evolves, stakeholders are likely to explore new opportunities and innovations to meet the demands of a rapidly changing environment.

    Increased Focus on Sustainability

    The Global Smart Buildings Market Industry is witnessing a heightened focus on sustainability as environmental concerns gain prominence. Building owners and developers are increasingly prioritizing sustainable practices, such as using renewable energy sources and implementing green building materials. This shift is driven by both consumer demand and regulatory pressures. For example, LEED certification has become a benchmark for sustainable building practices, encouraging the integration of smart technologies that enhance energy efficiency. As sustainability becomes a key consideration in building design and operation, the market for smart buildings is likely to expand significantly.

    Rising Demand for Energy Efficiency

    The Global Smart Buildings Market Industry experiences a notable surge in demand for energy-efficient solutions. As energy costs continue to rise, building owners increasingly seek technologies that optimize energy consumption. Smart buildings utilize advanced sensors and automation systems to monitor and control energy usage, leading to significant cost savings. For instance, the implementation of smart lighting and HVAC systems can reduce energy consumption by up to 30 percent. This trend is expected to contribute to the market's growth, with projections indicating a market value of 83.5 USD Billion in 2024 and a remarkable increase to 427.3 USD Billion by 2035, reflecting a compound annual growth rate of 16.0 percent from 2025 to 2035.

    Government Initiatives and Regulations

    Government initiatives and regulations play a pivotal role in shaping the Global Smart Buildings Market Industry. Many countries are implementing stringent building codes and standards aimed at enhancing energy efficiency and sustainability. For example, the European Union has set ambitious targets for reducing carbon emissions, which encourages the adoption of smart building technologies. Such regulations not only promote energy-efficient practices but also provide financial incentives for building owners to invest in smart technologies. This regulatory landscape is likely to drive market growth, as compliance with these standards becomes increasingly essential for new constructions and renovations.

    Technological Advancements in IoT and AI

    Technological advancements in the Internet of Things (IoT) and artificial intelligence (AI) are transforming the Global Smart Buildings Market Industry. The integration of IoT devices enables real-time monitoring and control of building systems, enhancing operational efficiency. AI algorithms analyze data collected from various sensors to optimize building performance, predict maintenance needs, and improve occupant comfort. For instance, smart thermostats can learn user preferences and adjust heating and cooling accordingly, leading to energy savings. As these technologies continue to evolve, their adoption in smart buildings is expected to accelerate, further fueling market growth.

    Growing Urbanization and Population Density

    The Global Smart Buildings Market Industry is significantly influenced by the trends of growing urbanization and increasing population density. As urban areas expand, the demand for efficient and technologically advanced buildings rises. Smart buildings offer solutions to manage resources effectively in densely populated environments, addressing challenges such as energy consumption, waste management, and security. For instance, smart waste management systems can optimize collection routes based on real-time data, reducing operational costs and environmental impact. This urbanization trend is expected to drive the market forward, as cities seek innovative solutions to accommodate their growing populations.

    Market Segment Insights

    Smart Buildings

    Based on Solution Type, this segment includes Building Automation Systems (BAS) (HVAC Control Systems, Lighting Control Systems, Smart Elevator and Escalator Systems), Energy Management Systems (Smart Meters and Energy Monitoring, Renewable Energy Integration (Solar Panels, Wind Turbines), Demand Response Systems), Security and Access Control Systems (Smart Surveillance Cameras, Biometric and RFID Access Control, Intrusion Detection Systems), IoT-Enabled Infrastructure (Occupancy and Motion Sensors, Connected Appliances and Devices, Smart Thermostats), Communication Systems (Unified Communication Platforms, Smart Intercom Systems). 

    The Energy Management Systems segment dominated the global market in 2024, while it is projected to be the fastest–growing segment during the forecast period. An energy management system (EMS) is a set of tools combining software and hardware that optimally distributes energy flows between connected distributed energy resources (DERs). Companies use energy management systems to optimize the generation, storage and/or consumption of electricity to lower both costs and emissions and stabilize the power grid. EMS collects, analyzes and visualizes data in real time and dynamically controls energy flows.

    An energy management system is the building block of future energy use cases as it intelligently monitors and controls a variety of energy assets within a household, building or larger site.

    FIGURE 2: SMART BUILDINGS MARKET SHARE BY SOLUTION TYPE 2024 AND 2035 (USD BILLION)

    Get more detailed insights about Smart Buildings Market Research Report – Forecast Till 2035

    Regional Insights

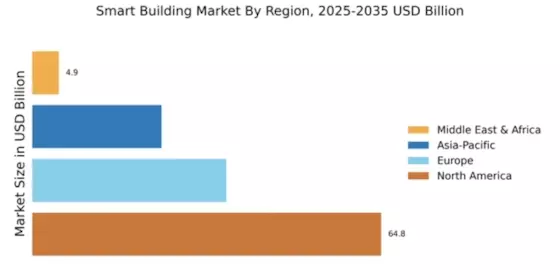
    Based on the Region, the global Smart Buildings are segmented into North America, Europe, Asia-Pacific, South America and Middle East & Africa. The North America dominated the global market in 2024, while the Europe is projected to be the fastest–growing segment during the forecast period. Major demand factors driving the North America market are the increased demand for energy efficiency & sustainability and government regulations & green building initiatives and IOT-enabled smart automation in buildings. 

    A smart building in North America is one that utilizes advanced technologies such as Internet of Things (IoT) devices, sensors, and automated systems to improve energy efficiency, enhance occupant comfort, and reduce operational costs. These buildings are designed to optimize performance and sustainability by monitoring and adjusting lighting, heating, ventilation, and air conditioning (HVAC), as well as security and safety systems.

    FIGURE 3: SMART BUILDINGS MARKET VALUE BY REGION 2024 AND 2035 (USD BILLION)

    SMART BUILDINGS MARKET VALUE BY REGION 2024 AND 2035

    Source: Secondary Research, Primary Research, MRFR Database, and Analyst Review

    Further, the countries considered in the scope of the Application Tracking System Market are the US, Canada, Mexico, Germany, UK, France, Russia, Italy, Spain, China, India, Japan, South Korea, Malaysia, Thailand, Indonesia, Brazil, Argentina, GCC Countries, South Africa and others.

    Key Players and Competitive Insights

    Many global, regional, and local vendors characterize the Smart Buildings Market. The market is highly competitive, with all the players competing to gain market share. Intense competition, rapid advances in technology, frequent changes in government policies, and environmental regulations are key factors that confront market growth. The vendors compete based on cost, product quality, reliability, and government regulations. Vendors must provide cost-efficient, high-quality products to survive and succeed in an intensely competitive market.

    The major competitors in the market are Itron, Inc., Panasonic Holdings Corporation, Johnson Controls, HCL Technologies Ltd., Cisco Systems, Inc., ABB Group, Siemens, Hitachi Ltd., Honeywell, IBM are among others. The Smart Buildings Market is a consolidated market due to increasing competition, acquisitions, mergers and other strategic market developments and decisions to improve operational effectiveness.

    Key Companies in the Smart Building Market market include

    Industry Developments

    Future Outlook

    Smart Building Market Future Outlook

    The Smart Buildings Market is projected to grow at a 16.0% CAGR from 2024 to 2035, driven by advancements in IoT, energy efficiency, and regulatory support.

    New opportunities lie in:

    • Develop integrated AI solutions for predictive maintenance in smart buildings.
    • Invest in renewable energy technologies to enhance sustainability in building operations.
    • Create user-friendly platforms for real-time energy management and analytics.

    By 2035, the Smart Buildings Market is expected to achieve substantial growth, reflecting enhanced technological integration and sustainability.

    Market Segmentation

    Regional Outlook

    North America
    • US
    • Canada
    • Mexico

    Smart Buildings Regional Outlook

    North America
    • US
    • Canada
    • Mexico

    Smart Buildings by Technology Outlook

    • Artificial Intelligence (AI) for Predictive Maintenance
    • Internet of Things (IoT) for Device Connectivity
    • Cloud Computing for Remote Monitoring and Management
    • Blockchain for Secure Data Sharing
    • Augmented Reality (AR) and Virtual Reality (VR)
    • Others

    Smart Buildings by Application Outlook

    • Energy Optimization and Management
    • Space Management
    • Safety and Security Enhancement
    • Predictive Maintenance and Analytics
    • Environmental Monitoring
    • Others

    Smart Buildings by Building Type Outlook

    Residential Buildings
    • Apartments and Smart Homes
    • Multi-Family Housing

    Smart Buildings by Solution Type Outlook

    Building Automation Systems (BAS)
    • HVAC Control Systems
    • Lighting Control Systems
    • Smart Elevator and Escalator Systems

    Smart Buildings by Functionality Type Outlook

    Energy Management Solution
    • Smart Meters
    • Battery Storage System
    • Others

    Report Scope

    Report Attribute/Metric

    Details

    Market Size 2024

    USD 83.49 Billion

    Market Size 2025

    USD 96.37 Billion

    Market Size 2035

    USD 427.33 Billion

    Compound Annual Growth Rate (CAGR)

    16.1% (2025-2035)

    Base Year

    2024

    Forecast Period

    2025-2035

    Historical Data

    2019-2023

    Forecast Units

    Value (USD Billion)

    Report Coverage

    Revenue Forecast, Competitive Landscape, Growth Factors, and Trends

    Segments Covered

    By Solution Type, By Technology, By Application, By Building Type, By Functionality Type

    Geographies Covered

    North America, Europe, Asia Pacific, South America, Middle East & Africa

    Countries Covered

    The US, Canada, Mexico, Germany, UK, France, Russia, Italy, Spain, China, India, Japan, South Korea, Malaysia, Thailand, Indonesia, Brazil, Argentina, GCC Countries, South Africa

    Key Companies Profiled

    Itron, Inc., Panasonic Holdings Corporation, Johnson Controls, HCL Technologies Ltd., Cisco Systems, Inc., ABB Group, Siemens, Hitachi, Ltd., Honeywell, IBM

    Key Market Opportunities

    ·         Integration of renewable energy technologies (rets) in smart buildings

    ·         Growth in retrofit and upgrade projects for existing buildings

    Key Market Dynamics

    ·         Increased demand for energy efficiency & sustainability

    ·         Government regulations & green building initiatives

    ·         Iot-enabled smart automation in buildings

    Market Highlights

    Author
    Shubham Munde
    Research Analyst Level II

    With a technical background in information technology & semiconductors, Shubham has 4.5+ years of experience in market research and analytics with the tasks of data mining, analysis, and project execution. He is the POC for our clients, for their consulting projects running under the ICT/Semiconductor domain. Shubham holds a Bachelor’s in Information and Technology and a Master of Business Administration (MBA). Shubham has executed over 150 research projects for our clients under the brand name Market Research Future in the last 2 years. His core skill is building the research respondent relation for gathering the primary information from industry and market estimation for niche markets. He is having expertise in conducting secondary & primary research, market estimations, market projections, competitive analysis, analysing current market trends and market dynamics, deep-dive analysis on market scenarios, consumer behaviour, technological impact analysis, consulting, analytics, etc. He has worked on fortune 500 companies' syndicate and consulting projects along with several government projects. He has worked on the projects of top tech brands such as IBM, Google, Microsoft, AWS, Meta, Oracle, Cisco Systems, Samsung, Accenture, VMware, Schneider Electric, Dell, HP, Ericsson, and so many others. He has worked on Metaverse, Web 3.0, Zero-Trust security, cyber-security, blockchain, quantum computing, robotics, 5G technology, High-Performance computing, data centers, AI, automation, IT equipment, sensors, semiconductors, consumer electronics and so many tech domain projects.

    Leave a Comment

    FAQs

    How much is the Smart Buildings Market?

    USD 83.49 Billion is the Smart Buildings Market in 2024

    Which Application holds the largest market share?

    The Energy Optimization and Management segment by Application holds the largest market share and grows at a CAGR of 31.8 % during the forecast period.

    Which region holds the largest market share in the Smart Buildings Market?

    North America holds the largest market share in the Smart Buildings Market.

    Who are the prominent players in the Smart Buildings Market?

    Itron, Inc., Panasonic Holdings Corporation, Johnson Controls, HCL Technologies Ltd., Cisco Systems, Inc., ABB Group, Siemens, Hitachi, Ltd., Honeywell, IBM are prominent players in the Smart Buildings Market.

    Which Technology segment led the Smart Buildings Market?

    The Internet of Things (IoT) for Device Connectivity segment dominated the market in 2024.

    1. EXECUTIVE SUMMARY
    2. MARKET INTRODUCTION
      1. DEFINITION
      2. SCOPE OF THE STUDY
      3. RESEARCH OBJECTIVE
      4. MARKET STRUCTURE
    3. RESEARCH METHODOLOGY
      1. OVERVIEW
      2. DATA
    4. FLOW
      1. DATA MINING PROCESS
      2. PURCHASED DATABASE:
      3. SECONDARY
    5. SOURCES:
      1. SECONDARY RESEARCH DATA FLOW:
      2. PRIMARY RESEARCH:
        1. PRIMARY RESEARCH DATA FLOW:
        2. PRIMARY RESEARCH: NUMBER OF INTERVIEWS
    6. CONDUCTED
      1. PRIMARY RESEARCH: REGIONAL COVERAGE
      2. APPROACHES FOR
    7. MARKET SIZE ESTIMATION:
      1. CONSUMPTION & NET TRADE APPROACH
    8. REVENUE ANALYSIS APPROACH
      1. DATA FORECASTING
        1. DATA FORECASTING
    9. TECHNIQUE
      1. DATA MODELING
        1. MICROECONOMIC FACTOR ANALYSIS:
    10. DATA MODELING:
      1. TEAMS AND ANALYST CONTRIBUTION
    11. MARKET DYNAMICS
      1. OVERVIEW
      2. DRIVERS
        1. INCREASED DEMAND FOR ENERGY EFFICIENCY
    12. & SUSTAINABILITY
      1. GOVERNMENT REGULATIONS & GREEN BUILDING INITIATIVES
        1. IOT-ENABLED SMART AUTOMATION IN BUILDINGS
      2. RESTRAINTS
    13. COMPLEX INTEGRATION WITH LEGACY SYSTEMS
      1. DATA SECURITY & PRIVACY CONCERNS
      2. OPPORTUNITIES
        1. INTEGRATION OF RENEWABLE ENERGY TECHNOLOGIES (RETS)
    14. IN SMART BUILDINGS
      1. GROWTH IN RETROFIT AND UPGRADE PROJECTS FOR EXISTING
    15. BUILDINGS
      1. TRENDS
        1. ADVANCED SECURITY SYSTEMS
        2. CLOUD-BASED
    16. BUILDING MANAGEMENT SYSTEMS (BMS)
      1. COVID-19 IMPACT ANALYSIS
        1. IMPACT
    17. ON SEMICONDUCTOR MANUFACTURERS
      1. IMPACT ON SMART BUILDINGS MARKET
    18. IMPACT OF MARKET DEMAND
      1. IMPACT OF MARKET PRICING
    19. MARKET FACTOR ANALYSIS
      1. SUPPLY CHAIN
        1. COMPONENT SUPPLIERS
        2. PLATFORM
    20. DEVELOPERS
      1. SYSTEM INTEGRATORS
        1. END USER
      2. PORTER’S
    21. FIVE FORCES MODEL
      1. THREAT OF NEW ENTRANTS
        1. BARGAINING POWER
    22. OF SUPPLIERS
      1. THREAT OF SUBSTITUTES
        1. BARGAINING POWER OF BUYERS
        2. INTENSITY OF RIVALRY
    23. GLOBAL SMART BUILDINGS MARKET, BY SOLUTION TYPE
      1. INTRODUCTION
      2. BUILDING AUTOMATION SYSTEMS (BAS)
      3. ENERGY MANAGEMENT
    24. SYSTEMS
      1. SECURITY AND ACCESS CONTROL SYSTEMS
      2. IOT-ENABLED INFRASTRUCTURE
      3. COMMUNICATION SYSTEMS
    25. GLOBAL SMART BUILDINGS MARKET, BY TECHNOLOGY
      1. INTRODUCTION
      2. ARTIFICIAL INTELLIGENCE (AI) FOR PREDICTIVE MAINTENANCE
      3. INTERNET OF THINGS (IOT) FOR DEVICE CONNECTIVITY
      4. CLOUD COMPUTING
    26. FOR REMOTE MONITORING AND MANAGEMENT
      1. BLOCKCHAIN FOR SECURE DATA SHARING
      2. AUGMENTED REALITY (AR) AND VIRTUAL REALITY (VR)
    27. GLOBAL SMART BUILDINGS
    28. MARKET, BY APPLICATION
      1. INTRODUCTION
      2. ENERGY OPTIMIZATION AND MANAGEMENT
      3. SPACE MANAGEMENT
      4. SAFETY AND SECURITY ENHANCEMENT
      5. PREDICTIVE
    29. MAINTENANCE AND ANALYTICS
      1. ENVIRONMENTAL MONITORING
    30. GLOBAL SMART
    31. BUILDINGS MARKET, BY BUILDING TYPE
      1. INTRODUCTION
      2. RESIDENTIAL BUILDINGS
      3. COMMERCIAL BUILDINGS
      4. INDUSTRIAL BUILDINGS
      5. INSTITUTIONAL
    32. BUILDINGS
    33. GLOBAL SMART BUILDINGS MARKET, BY FUNCTIONALITY TYPE
    34. INTRODUCTION
      1. ENERGY MANAGEMENT SOLUTION
      2. BUILDING AUTOMATION
    35. SOLUTION
      1. SECURITY AND ACCESS CONTROL SOLUTIONS
      2. IOT AND CONNECTIVITY
    36. SOLUTIONS
      1. SPACE AND OCCUPANCY MANAGEMENT
      2. COMFORT AND WELLNESS
    37. SOLUTIONS
      1. DATA ANALYTICS AND MANAGEMENT SOLUTIONS
      2. SMART POWER
    38. UTILITIES AND SOLUTION
      1. INFRASTRUCTURE MANAGEMENT SOLUTION
    39. GLOBAL
    40. SMART BUILDINGS MARKET, BY REGION
      1. OVERVIEW
      2. NORTH AMERICA
        1. US
        2. CANADA
        3. MEXICO
      3. EUROPE
        1. GERMANY
        2. UK
        3. FRANCE
        4. RUSSIA
        5. ITALY
    41. SPAIN
      1. REST OF EUROPE
      2. ASIA PACIFIC
        1. CHINA
    42. INDIA
      1. JAPAN
        1. SOUTH KOREA
        2. MALAYSIA
    43. THAILAND
      1. INDONESIA
        1. REST OF ASIA PACIFIC
      2. SOUTH
    44. AMERICA
      1. BRAZIL
        1. ARGENTINA
        2. REST OF SOUTH AMERICA
      2. MIDDLE EAST AFRICA
        1. GCC COUNTRIES
        2. SOUTH AFRICA
        3. REST OF MIDDLE EAST AFRICA
    45. COMPETITIVE LANDSCAPE
      1. INTRODUCTION
      2. COMPETITOR DASHBOARD
      3. COMPANY MARKET SHARE ANALYSIS, 2024 (VALUE)
      4. KEY DEVELOPMENTS & GROWTH STRATEGIES
        1. NEW PRODUCT LAUNCH/
    46. DEVELOPMENT
      1. MERGER & ACQUISITION
        1. CONTRACTS, AWARDS &
    47. AGREEMENTS
      1. EXPANSIONS & INVESTMENTS
    48. COMPANY PROFILES
      1. ITRON, INC.
        1. COMPANY OVERVIEW
        2. FINANCIAL OVERVIEW
        3. PRODUCTS/SOLUTIONS/SERVICES OFFERED
        4. KEY DEVELOPMENTS
    49. SWOT ANALYSIS
      1. KEY STRATEGIES
      2. PANASONIC HOLDINGS CORPORATION
        1. COMPANY OVERVIEW
        2. FINANCIAL OVERVIEW
        3. PRODUCTS/SOLUTIONS/SERVICES
    50. OFFERED
      1. KEY DEVELOPMENTS
        1. SWOT ANALYSIS
        2. KEY STRATEGIES
      2. JOHNSON CONTROLS
        1. COMPANY OVERVIEW
        2. FINANCIAL OVERVIEW
        3. PRODUCTS/SOLUTIONS/SERVICES OFFERED
        4. KEY DEVELOPMENTS
    51. SWOT ANALYSIS
      1. KEY STRATEGIES
      2. HCL TECHNOLOGIES LTD.
    52. COMPANY OVERVIEW
      1. FINANCIAL OVERVIEW
        1. PRODUCTS/SOLUTIONS/SERVICES
    53. OFFERED
      1. KEY DEVELOPMENTS
        1. SWOT ANALYSIS
        2. KEY STRATEGIES
      2. CISCO SYSTEMS, INC.
        1. COMPANY OVERVIEW
        2. FINANCIAL OVERVIEW
        3. PRODUCTS/SOLUTIONS/SERVICES OFFERED
        4. KEY DEVELOPMENTS
    54. SWOT ANALYSIS
      1. KEY STRATEGIES
      2. ABB GROUP
        1. COMPANY
    55. OVERVIEW
      1. FINANCIAL OVERVIEW
        1. PRODUCTS/SOLUTIONS/SERVICES
    56. OFFERED
      1. KEY DEVELOPMENTS
        1. SWOT ANALYSIS
        2. KEY STRATEGIES
      2. SIEMENS
        1. COMPANY OVERVIEW
        2. FINANCIAL OVERVIEW
    57. PRODUCTS/SOLUTIONS/SERVICES OFFERED
      1. KEY DEVELOPMENTS
        1. SWOT
    58. ANALYSIS
      1. KEY STRATEGIES
      2. HITACHI, LTD.
        1. COMPANY
    59. OVERVIEW
      1. FINANCIAL OVERVIEW
        1. PRODUCTS/SOLUTIONS/SERVICES
    60. OFFERED
      1. KEY DEVELOPMENTS
        1. SWOT ANALYSIS
        2. KEY STRATEGIES
      2. HONEYWELL
        1. COMPANY OVERVIEW
        2. FINANCIAL OVERVIEW
        3. PRODUCTS/SOLUTIONS/SERVICES OFFERED
        4. KEY DEVELOPMENTS
    61. SWOT ANALYSIS
      1. KEY STRATEGIES
      2. IBM
        1. COMPANY OVERVIEW
        2. FINANCIAL OVERVIEW
        3. PRODUCTS/SOLUTIONS/SERVICES OFFERED
        4. KEY DEVELOPMENTS
        5. SWOT ANALYSIS
        6. KEY STRATEGIES
    62. LIST
    63. OF TABLES
    64. COUNTRIES AND REGIONS FOR LEED IN 2023
    65. BY SOLUTION TYPE, 2019-2035 (USD BILLION)
    66. BY TECHNOLOGY, 2019-2035 (USD BILLION)
    67. BY APPLICATION, 2019-2035 (USD BILLION)
    68. BY BUILDING TYPE, 2019-2035 (USD BILLION)
    69. BY FUNCTIONALITY TYPE, 2019-2035 (USD BILLION)
    70. MARKET, BY REGION, 2019-2035 (USD BILLION)
    71. MARKET, BY REGION, 2019-2035 (USD BILLION)
    72. MARKET, BY SOLUTION TYPE, 2019-2035 (USD BILLION)
    73. BUILDINGS MARKET, BY TECHNOLOGY, 2019-2035 (USD BILLION)
    74. SMART BUILDINGS MARKET, BY APPLICATION, 2019-2035 (USD BILLION)
    75. AMERICA SMART BUILDINGS MARKET, BY BUILDING TYPE, 2019-2035 (USD BILLION)
    76. NORTH AMERICA SMART BUILDINGS MARKET, BY FUNCTIONALITY TYPE, 2019-2035 (USD BILLION)
    77. BILLION)
    78. (USD BILLION)
    79. (USD BILLION)
    80. (USD BILLION)
    81. (USD BILLION)
    82. 2035 (USD BILLION)
    83. 2035 (USD BILLION)
    84. TYPE, 2019-2035 (USD BILLION)
    85. 2035 (USD BILLION)
    86. 2035 (USD BILLION)
    87. TYPE, 2019-2035 (USD BILLION)
    88. TYPE, 2019-2035 (USD BILLION)
    89. TYPE, 2019-2035 (USD BILLION)
    90. 2035 (USD BILLION)
    91. 2035 (USD BILLION)
    92. TYPE, 2019-2035 (USD BILLION)
    93. TYPE, 2019-2035 (USD BILLION)
    94. TYPE, 2019-2035 (USD BILLION)
    95. 2035 (USD BILLION)
    96. 2035 (USD BILLION)
    97. 2035 (USD BILLION)
    98. TYPE, 2019-2035 (USD BILLION)
    99. TYPE, 2019-2035 (USD BILLION)
    100. 2035 (USD BILLION)
    101. 2035 (USD BILLION)
    102. TYPE, 2019-2035 (USD BILLION)
    103. TYPE, 2019-2035 (USD BILLION)
    104. TYPE, 2019-2035 (USD BILLION)
    105. 2035 (USD BILLION)
    106. 2035 (USD BILLION)
    107. TYPE, 2019-2035 (USD BILLION)
    108. TYPE, 2019-2035 (USD BILLION)
    109. TYPE, 2019-2035 (USD BILLION)
    110. 2035 (USD BILLION)
    111. 2035 (USD BILLION)
    112. TYPE, 2019-2035 (USD BILLION)
    113. TYPE, 2019-2035 (USD BILLION)
    114. TYPE, 2019-2035 (USD BILLION)
    115. 2035 (USD BILLION)
    116. 2035 (USD BILLION)
    117. TYPE, 2019-2035 (USD BILLION)
    118. TYPE, 2019-2035 (USD BILLION)
    119. BY SOLUTION TYPE, 2019-2035 (USD BILLION)
    120. MARKET, BY TECHNOLOGY, 2019-2035 (USD BILLION)
    121. BUILDINGS MARKET, BY APPLICATION, 2019-2035 (USD BILLION)
    122. EUROPE SMART BUILDINGS MARKET, BY BUILDING TYPE, 2019-2035 (USD BILLION)
    123. REST OF EUROPE SMART BUILDINGS MARKET, BY FUNCTIONALITY TYPE, 2019-2035 (USD
    124. BILLION)
    125. (USD BILLION)
    126. 2035 (USD BILLION)
    127. 2035 (USD BILLION)
    128. 2035 (USD BILLION)
    129. TYPE, 2019-2035 (USD BILLION)
    130. BY FUNCTIONALITY TYPE, 2019-2035 (USD BILLION)
    131. MARKET, BY SOLUTION TYPE, 2019-2035 (USD BILLION)
    132. MARKET, BY TECHNOLOGY, 2019-2035 (USD BILLION)
    133. MARKET, BY APPLICATION, 2019-2035 (USD BILLION)
    134. MARKET, BY BUILDING TYPE, 2019-2035 (USD BILLION)
    135. MARKET, BY FUNCTIONALITY TYPE, 2019-2035 (USD BILLION)
    136. BUILDINGS MARKET, BY SOLUTION TYPE, 2019-2035 (USD BILLION)
    137. SMART BUILDINGS MARKET, BY TECHNOLOGY, 2019-2035 (USD BILLION)
    138. SMART BUILDINGS MARKET, BY APPLICATION, 2019-2035 (USD BILLION)
    139. SMART BUILDINGS MARKET, BY BUILDING TYPE, 2019-2035 (USD BILLION)
    140. INDIA SMART BUILDINGS MARKET, BY FUNCTIONALITY TYPE, 2019-2035 (USD BILLION)
    141. BILLION)
    142. (USD BILLION)
    143. 2035 (USD BILLION)
    144. TYPE, 2019-2035 (USD BILLION)
    145. BY FUNCTIONALITY TYPE, 2019-2035 (USD BILLION)
    146. MARKET, BY SOLUTION TYPE, 2019-2035 (USD BILLION)
    147. MARKET, BY TECHNOLOGY, 2019-2035 (USD BILLION)
    148. MARKET, BY APPLICATION, 2019-2035 (USD BILLION)
    149. MARKET, BY BUILDING TYPE, 2019-2035 (USD BILLION)
    150. BUILDINGS MARKET, BY FUNCTIONALITY TYPE, 2019-2035 (USD BILLION)
    151. THAILAND SMART BUILDINGS MARKET, BY SOLUTION TYPE, 2019-2035 (USD BILLION)
    152. THAILAND SMART BUILDINGS MARKET, BY TECHNOLOGY, 2019-2035 (USD BILLION)
    153. THAILAND SMART BUILDINGS MARKET, BY APPLICATION, 2019-2035 (USD BILLION)
    154. BILLION)
    155. (USD BILLION)
    156. (USD BILLION)
    157. (USD BILLION)
    158. 2035 (USD BILLION)
    159. TYPE, 2019-2035 (USD BILLION)
    160. MARKET, BY SOLUTION TYPE, 2019-2035 (USD BILLION)
    161. SMART BUILDINGS MARKET, BY TECHNOLOGY, 2019-2035 (USD BILLION)
    162. OF ASIA PACIFIC SMART BUILDINGS MARKET, BY APPLICATION, 2019-2035 (USD BILLION)
    163. (USD BILLION)
    164. TYPE, 2019-2035 (USD BILLION)
    165. BY REGION, 2019-2035 (USD BILLION)
    166. MARKET, BY SOLUTION TYPE, 2019-2035 (USD BILLION)
    167. BUILDINGS MARKET, BY TECHNOLOGY, 2019-2035 (USD BILLION)
    168. SMART BUILDINGS MARKET, BY APPLICATION, 2019-2035 (USD BILLION)
    169. AMERICA SMART BUILDINGS MARKET, BY BUILDING TYPE, 2019-2035 (USD BILLION)
    170. SOUTH AMERICA SMART BUILDINGS MARKET, BY FUNCTIONALITY TYPE, 2019-2035 (USD
    171. BILLION)
    172. (USD BILLION)
    173. (USD BILLION)
    174. (USD BILLION)
    175. (USD BILLION)
    176. 2035 (USD BILLION)
    177. TYPE, 2019-2035 (USD BILLION)
    178. TECHNOLOGY, 2019-2035 (USD BILLION)
    179. BY APPLICATION, 2019-2035 (USD BILLION)
    180. MARKET, BY BUILDING TYPE, 2019-2035 (USD BILLION)
    181. BUILDINGS MARKET, BY FUNCTIONALITY TYPE, 2019-2035 (USD BILLION)
    182. REST OF SOUTH AMERICA SMART BUILDINGS MARKET, BY SOLUTION TYPE, 2019-2035 (USD BILLION)
    183. (USD BILLION)
    184. 2035 (USD BILLION)
    185. BY BUILDING TYPE, 2019-2035 (USD BILLION)
    186. BUILDINGS MARKET, BY FUNCTIONALITY TYPE, 2019-2035 (USD BILLION)
    187. MIDDLE EAST AFRICA SMART BUILDINGS MARKET, BY REGION, 2019-2035 (USD BILLION)
    188. (USD BILLION)
    189. 2035 (USD BILLION)
    190. BY APPLICATION, 2019-2035 (USD BILLION)
    191. BUILDINGS MARKET, BY BUILDING TYPE, 2019-2035 (USD BILLION)
    192. EAST AFRICA SMART BUILDINGS MARKET, BY FUNCTIONALITY TYPE, 2019-2035 (USD BILLION)
    193. BILLION)
    194. (USD BILLION)
    195. 2035 (USD BILLION)
    196. BUILDING TYPE, 2019-2035 (USD BILLION)
    197. MARKET, BY FUNCTIONALITY TYPE, 2019-2035 (USD BILLION)
    198. SMART BUILDINGS MARKET, BY SOLUTION TYPE, 2019-2035 (USD BILLION)
    199. SOUTH AFRICA SMART BUILDINGS MARKET, BY TECHNOLOGY, 2019-2035 (USD BILLION)
    200. SOUTH AFRICA SMART BUILDINGS MARKET, BY APPLICATION, 2019-2035 (USD BILLION)
    201. BILLION)
    202. 2035 (USD BILLION)
    203. MARKET, BY SOLUTION TYPE, 2019-2035 (USD BILLION)
    204. EAST AFRICA SMART BUILDINGS MARKET, BY TECHNOLOGY, 2019-2035 (USD BILLION)
    205. REST OF MIDDLE EAST AFRICA SMART BUILDINGS MARKET, BY APPLICATION, 2019-2035
    206. (USD BILLION)
    207. BY BUILDING TYPE, 2019-2035 (USD BILLION)
    208. SMART BUILDINGS MARKET, BY FUNCTIONALITY TYPE, 2019-2035 (USD BILLION)
    209. NEW PRODUCT LAUNCH
    210. AWARDS & AGREEMENTS S
    211. ITRON, INC.: PRODUCTS/SOLUTIONS/SERVICES OFFERED
    212. CONTROLS: PRODUCTS/SOLUTIONS/SERVICES OFFERED
    213. DEVELOPMENTS
    214. CISCO SYSTEMS, INC.: KEY DEVELOPMENTS
    215. OFFERED
    216. OFFERED
    217. OFFERED
    218. OFFERED
    219. OFFERED
    220. MARKET: MARKET GROWTH FACTOR ANALYSIS (2019-2035)
    221. ANALYSIS
    222. FORECAST
    223. PORTER'S FIVE FORCES ANALYSIS: GLOBAL SMART BUILDING MARKET
    224. SMART BUILDINGS MARKET, BY SOLUTION TYPE, 2024 (% SHARE)
    225. BUILDINGS MARKET, BY SOLUTION TYPE, 2024 VS 2035 (USD BILLION)
    226. SMART BUILDINGS MARKET, BY TECHNOLOGY, 2024 (% SHARE)
    227. BUILDINGS MARKET, BY TECHNOLOGY, 2024 VS 2035 (USD BILLION)
    228. SMART BUILDINGS MARKET, BY APPLICATION, 2024 (% SHARE)
    229. BUILDINGS MARKET, BY APPLICATION, 2024 VS 2035 (USD BILLION)
    230. SMART BUILDINGS MARKET, BY BUILDING TYPE, 2024 (% SHARE)
    231. BUILDINGS MARKET, BY BUILDING TYPE, 2024 VS 2035 (USD BILLION)
    232. SMART BUILDINGS MARKET, BY FUNCTIONALITY TYPE, 2024 (% SHARE)
    233. SMART BUILDINGS MARKET, BY FUNCTIONALITY TYPE, 2024 VS 2035 (USD BILLION)
    234. GLOBAL SMART BUILDINGS MARKET, BY REGION, 2024 (% SHARE)
    235. SMART BUILDINGS MARKET, BY REGION, 2024 VS 2035 (USD BILLION)
    236. AMERICA SMART BUILDINGS MARKET, BY REGION, 2024 (% SHARE)
    237. SMART BUILDINGS MARKET, BY REGION, 2024 VS 2035 (USD BILLION)
    238. SMART BUILDINGS MARKET, BY REGION, 2024 (% SHARE)
    239. MARKET, BY REGION, 2024 VS 2035 (USD BILLION)
    240. BUILDINGS MARKET, BY REGION, 2024 (% SHARE)
    241. MARKET, BY REGION, 2024 VS 2035 (USD BILLION)
    242. BUILDINGS MARKET, BY REGION, 2024 (% SHARE)
    243. MARKET, BY REGION, 2024 VS 2035 (USD BILLION)
    244. SMART BUILDINGS MARKET, BY REGION, 2024 (% SHARE)
    245. SMART BUILDINGS MARKET, BY REGION, 2024 VS 2035 (USD BILLION)
    246. DASHBOARD: SMART BUILDINGS MARKET
    247. COMPETITIVE ANALSIS, 2024 (USD BILLION) (% SHARE)
    248. OVERVIEW SNAPSHOT
    249. HOLDINGS CORPORATION: FINANCIAL OVERVIEW SNAPSHOT
    250. CORPORATION: SWOT ANALYSIS
    251. FINANCIAL OVERVIEW SNAPSHOT
    252. SYSTEMS, INC.: SWOT ANALYSIS
    253. SNAPSHOT
    254. OVERVIEW SNAPSHOT
    255. FINANCIAL OVERVIEW SNAPSHOT
    256. IBM: FINANCIAL OVERVIEW SNAPSHOT

    Smart Buildings Market Segmentation

    • Global Smart Building, By Automation Outlook (USD Million, 2018-2032)
      • Intelligent Security System
        • Video Surveillance System
        • Access Control System
        • Emergency Management System
      • Building Energy Management System
        • Energy Management System
        • HVAC Control System
        • Lighting Control System
        • Renewable Energy System
        • CO2 Emission Monitoring System
        • Others
      • Infrastructure Management System
        • Elevators and Escalators Management System
        • Smart Water Management System
        • EV Charging Infrastructure
        • Parking Management System
      • Network Management System
    • Global Smart Building, By Application Outlook (USD Million, 2018-2032)
      • Commercial
      • Industrial
      • Government & Public Infrastructure
      • Residential

    Global Smart Building Regional Outlook (USD Million, 2018-2032)

    • North America Outlook (USD Million, 2018-2032)
    • North America Smart Building, By Automation Outlook (USD Million, 2018-2032)
      • Intelligent Security System
        • Video Surveillance System
        • Access Control System
        • Emergency Management System
      • Building Energy Management System
        • Energy Management System
        • HVAC Control System
        • Lighting Control System
        • Renewable Energy System
        • CO2 Emission Monitoring System
        • Others
      • Infrastructure Management System
        • Elevators and Escalators Management System
        • Smart Water Management System
        • EV Charging Infrastructure
        • Parking Management System
      • Network Management System
    • North America Smart Building, By Application Outlook (USD Million, 2018-2032)
      • Commercial
      • Industrial
      • Government & Public Infrastructure
      • Residential
    • US Outlook (USD Million, 2018-2032)
    • US Smart Building, By Automation Outlook (USD Million, 2018-2032)
      • Intelligent Security System
        • Video Surveillance System
        • Access Control System
        • Emergency Management System
      • Building Energy Management System
        • Energy Management System
        • HVAC Control System
        • Lighting Control System
        • Renewable Energy System
        • CO2 Emission Monitoring System
        • Others
      • Infrastructure Management System
        • Elevators and Escalators Management System
        • Smart Water Management System
        • EV Charging Infrastructure
        • Parking Management System
      • Network Management System
    • US Smart Building, By Application Outlook (USD Million, 2018-2032)
      • Commercial
      • Industrial
      • Government & Public Infrastructure
      • Residential
    • Canada Outlook (USD Million, 2018-2032)
    • Canada Smart Building, By Automation Outlook (USD Million, 2018-2032)
      • Intelligent Security System
        • Video Surveillance System
        • Access Control System
        • Emergency Management System
      • Building Energy Management System
        • Energy Management System
        • HVAC Control System
        • Lighting Control System
        • Renewable Energy System
        • CO2 Emission Monitoring System
        • Others
      • Infrastructure Management System
        • Elevators and Escalators Management System
        • Smart Water Management System
        • EV Charging Infrastructure
        • Parking Management System
      • Network Management System
    • Canada Smart Building, By Application Outlook (USD Million, 2018-2032)
      • Commercial
      • Industrial
      • Government & Public Infrastructure
      • Residential
    • Mexico Outlook (USD Million, 2018-2032)
    • Mexico Smart Building, By Automation Outlook (USD Million, 2018-2032)
      • Intelligent Security System
        • Video Surveillance System
        • Access Control System
        • Emergency Management System
      • Building Energy Management System
        • Energy Management System
        • HVAC Control System
        • Lighting Control System
        • Renewable Energy System
        • CO2 Emission Monitoring System
        • Others
      • Infrastructure Management System
        • Elevators and Escalators Management System
        • Smart Water Management System
        • EV Charging Infrastructure
        • Parking Management System
      • Network Management System
    • Mexico Smart Building, By Application Outlook (USD Million, 2018-2032)
      • Commercial
      • Industrial
      • Government & Public Infrastructure
      • Residential
    • Europe Outlook (USD Million, 2018-2032)
    • Europe Smart Building, By Automation Outlook (USD Million, 2018-2032)
      • Intelligent Security System
        • Video Surveillance System
        • Access Control System
        • Emergency Management System
      • Building Energy Management System
        • Energy Management System
        • HVAC Control System
        • Lighting Control System
        • Renewable Energy System
        • CO2 Emission Monitoring System
        • Others
      • Infrastructure Management System
        • Elevators and Escalators Management System
        • Smart Water Management System
        • EV Charging Infrastructure
        • Parking Management System
      • Network Management System
    • Europe Smart Building, By Application Outlook (USD Million, 2018-2032)
      • Commercial
      • Industrial
      • Government & Public Infrastructure
      • Residential


    • Germany Outlook (USD Million, 2018-2032)
    • Germany Smart Building, By Automation Outlook (USD Million, 2018-2032)
      • Intelligent Security System
        • Video Surveillance System
        • Access Control System
        • Emergency Management System
      • Building Energy Management System
        • Energy Management System
        • HVAC Control System
        • Lighting Control System
        • Renewable Energy System
        • CO2 Emission Monitoring System
        • Others
      • Infrastructure Management System
        • Elevators and Escalators Management System
        • Smart Water Management System
        • EV Charging Infrastructure
        • Parking Management System
      • Network Management System
    • Germany Smart Building, By Application Outlook (USD Million, 2018-2032)
      • Commercial
      • Industrial
      • Government & Public Infrastructure
      • Residential


    • France Outlook (USD Million, 2018-2032)
    • France Smart Building, By Automation Outlook (USD Million, 2018-2032)
      • Intelligent Security System
        • Video Surveillance System
        • Access Control System
        • Emergency Management System
      • Building Energy Management System
        • Energy Management System
        • HVAC Control System
        • Lighting Control System
        • Renewable Energy System
        • CO2 Emission Monitoring System
        • Others
      • Infrastructure Management System
        • Elevators and Escalators Management System
        • Smart Water Management System
        • EV Charging Infrastructure
        • Parking Management System
      • Network Management System
    • France Smart Building, By Application Outlook (USD Million, 2018-2032)
      • Commercial
      • Industrial
      • Government & Public Infrastructure
      • Residential


    • UK Outlook (USD Million, 2018-2032)
    • UK Smart Building, By Automation Outlook (USD Million, 2018-2032)
      • Intelligent Security System
        • Video Surveillance System
        • Access Control System
        • Emergency Management System
      • Building Energy Management System
        • Energy Management System
        • HVAC Control System
        • Lighting Control System
        • Renewable Energy System
        • CO2 Emission Monitoring System
        • Others
      • Infrastructure Management System
        • Elevators and Escalators Management System
        • Smart Water Management System
        • EV Charging Infrastructure
        • Parking Management System
      • Network Management System
    • UK Smart Building, By Application Outlook (USD Million, 2018-2032)
      • Commercial
      • Industrial
      • Government & Public Infrastructure
      • Residential


    • Rest of Europe Outlook (USD Million, 2018-2032)
    • Rest of Europe Smart Building, By Automation Outlook (USD Million, 2018-2032)
      • Intelligent Security System
        • Video Surveillance System
        • Access Control System
        • Emergency Management System
      • Building Energy Management System
        • Energy Management System
        • HVAC Control System
        • Lighting Control System
        • Renewable Energy System
        • CO2 Emission Monitoring System
        • Others
      • Infrastructure Management System
        • Elevators and Escalators Management System
        • Smart Water Management System
        • EV Charging Infrastructure
        • Parking Management System
      • Network Management System
    • Rest of Europe Smart Building, By Application Outlook (USD Million, 2018-2032)
      • Commercial
      • Industrial
      • Government & Public Infrastructure
      • Residential
    • Asia-Pacific Outlook (USD Million, 2018-2032)
    • Asia-Pacific Smart Building, By Automation Outlook (USD Million, 2018-2032)
      • Intelligent Security System
        • Video Surveillance System
        • Access Control System
        • Emergency Management System
      • Building Energy Management System
        • Energy Management System
        • HVAC Control System
        • Lighting Control System
        • Renewable Energy System
        • CO2 Emission Monitoring System
        • Others
      • Infrastructure Management System
        • Elevators and Escalators Management System
        • Smart Water Management System
        • EV Charging Infrastructure
        • Parking Management System
      • Network Management System
    • Asia-Pacific Smart Building, By Application Outlook (USD Million, 2018-2032)
      • Commercial
      • Industrial
      • Government & Public Infrastructure
      • Residential
    • China Outlook (USD Million, 2018-2032)
    • China Smart Building, By Automation Outlook (USD Million, 2018-2032)
      • Intelligent Security System
        • Video Surveillance System
        • Access Control System
        • Emergency Management System
      • Building Energy Management System
        • Energy Management System
        • HVAC Control System
        • Lighting Control System
        • Renewable Energy System
        • CO2 Emission Monitoring System
        • Others
      • Infrastructure Management System
        • Elevators and Escalators Management System
        • Smart Water Management System
        • EV Charging Infrastructure
        • Parking Management System
      • Network Management System
    • China Smart Building, By Application Outlook (USD Million, 2018-2032)
      • Commercial
      • Industrial
      • Government & Public Infrastructure
      • Residential
    • India Outlook (USD Million, 2018-2032)
    • India Smart Building, By Automation Outlook (USD Million, 2018-2032)
      • Intelligent Security System
        • Video Surveillance System
        • Access Control System
        • Emergency Management System
      • Building Energy Management System
        • Energy Management System
        • HVAC Control System
        • Lighting Control System
        • Renewable Energy System
        • CO2 Emission Monitoring System
        • Others
      • Infrastructure Management System
        • Elevators and Escalators Management System
        • Smart Water Management System
        • EV Charging Infrastructure
        • Parking Management System
      • Network Management System
    • India Smart Building, By Application Outlook (USD Million, 2018-2032)
      • Commercial
      • Industrial
      • Government & Public Infrastructure
      • Residential
    • Japan Outlook (USD Million, 2018-2032)
    • Japan Smart Building, By Automation Outlook (USD Million, 2018-2032)
      • Intelligent Security System
        • Video Surveillance System
        • Access Control System
        • Emergency Management System
      • Building Energy Management System
        • Energy Management System
        • HVAC Control System
        • Lighting Control System
        • Renewable Energy System
        • CO2 Emission Monitoring System
        • Others
      • Infrastructure Management System
        • Elevators and Escalators Management System
        • Smart Water Management System
        • EV Charging Infrastructure
        • Parking Management System
      • Network Management System
    • Japan Smart Building, By Application Outlook (USD Million, 2018-2032)
      • Commercial
      • Industrial
      • Government & Public Infrastructure
      • Residential
    • South Korea Outlook (USD Million, 2018-2032)
    • South Korea Smart Building, By Automation Outlook (USD Million, 2018-2032)
      • Intelligent Security System
        • Video Surveillance System
        • Access Control System
        • Emergency Management System
      • Building Energy Management System
        • Energy Management System
        • HVAC Control System
        • Lighting Control System
        • Renewable Energy System
        • CO2 Emission Monitoring System
        • Others
      • Infrastructure Management System
        • Elevators and Escalators Management System
        • Smart Water Management System
        • EV Charging Infrastructure
        • Parking Management System
      • Network Management System
    • South Korea Smart Building, By Application Outlook (USD Million, 2018-2032)
      • Commercial
      • Industrial
      • Government & Public Infrastructure
      • Residential
    • Rest of Asia-Pacific Outlook (USD Million, 2018-2032)
    • Rest of Asia-Pacific Smart Building, By Automation Outlook (USD Million, 2018-2032)
      • Intelligent Security System
        • Video Surveillance System
        • Access Control System
        • Emergency Management System
      • Building Energy Management System
        • Energy Management System
        • HVAC Control System
        • Lighting Control System
        • Renewable Energy System
        • CO2 Emission Monitoring System
        • Others
      • Infrastructure Management System
        • Elevators and Escalators Management System
        • Smart Water Management System
        • EV Charging Infrastructure
        • Parking Management System
      • Network Management System
    • Rest of Asia-Pacific Smart Building, By Application Outlook (USD Million, 2018-2032)
      • Commercial
      • Industrial
      • Government & Public Infrastructure
      • Residential
    • Middle East & Africa Outlook (USD Million, 2018-2032)
    • Middle East & Africa Smart Building, By Automation Outlook (USD Million, 2018-2032)
      • Intelligent Security System
        • Video Surveillance System
        • Access Control System
        • Emergency Management System
      • Building Energy Management System
        • Energy Management System
        • HVAC Control System
        • Lighting Control System
        • Renewable Energy System
        • CO2 Emission Monitoring System
        • Others
      • Infrastructure Management System
        • Elevators and Escalators Management System
        • Smart Water Management System
        • EV Charging Infrastructure
        • Parking Management System
      • Network Management System
    • Middle East & Africa Smart Building, By Application Outlook (USD Million, 2018-2032)
      • Commercial
      • Industrial
      • Government & Public Infrastructure
      • Residential
    • South America Outlook (USD Million, 2018-2032)
    • South America Smart Building, By Automation Outlook (USD Million, 2018-2032)
      • Intelligent Security System
        • Video Surveillance System
        • Access Control System
        • Emergency Management System
      • Building Energy Management System
        • Energy Management System
        • HVAC Control System
        • Lighting Control System
        • Renewable Energy System
        • CO2 Emission Monitoring System
        • Others
      • Infrastructure Management System
        • Elevators and Escalators Management System
        • Smart Water Management System
        • EV Charging Infrastructure
        • Parking Management System
      • Network Management System
    • South America Smart Building, By Application Outlook (USD Million, 2018-2032)
      • Commercial
      • Industrial
      • Government & Public Infrastructure
      • Residential
    Smart Buildings Market Research Report – Forecast Till 2035 Infographic
    Free Sample Request

    Kindly complete the form below to receive a free sample of this Report

    Customer Strories

    “I am very pleased with how market segments have been defined in a relevant way for my purposes (such as "Portable Freezers & refrigerators" and "last-mile"). In general the report is well structured. Thanks very much for your efforts.”

    Victoria Milne Founder
    Case Study

    Chemicals and Materials