• Cat-intel
  • MedIntelliX
  • Resources
  • About Us
  • Hero Background
    English
    Chinese
    French
    Japanese
    Korean
    German
    Spanish

    Silver Nitrate Market Share

    ID: MRFR/CnM/17322-CR
    161 Pages
    Anshula Mandaokar
    July 2025

    Silver Nitrate Market Research Report Information by Grade Type (Analytical Reagent Grade (ARG), Active Pharmaceutical Ingredient (API) Grade, Photographic Grade, Others), by Application (Photography & Jewellery, Medicine & Healthcare, Glass Coating, Textile, Others) and Region (North America, Europe, Asia-Pacific, Middle East & Africa, South America) - Forecast till 2035

    Share:
    Download PDF ×

    We do not share your information with anyone. However, we may send you emails based on your report interest from time to time. You may contact us at any time to opt-out.

    Silver Nitrate Market Infographic
    $ 4,950.0
    $ 5,950.0
    $ 7,250.0

    Market Share

    Silver Nitrate Market Share Analysis

    In the Silver Nitrate market, companies employ a variety of strategies to position themselves effectively and capture market share. One such strategy is product differentiation. Companies focus on offering silver nitrate with unique features such as purity levels, particle size distribution, or specific applications in industries like photography, healthcare, or electronics. By highlighting these distinctive qualities, companies can attract customers seeking specialized solutions and gain a competitive edge, thereby securing a portion of the market share. Cost leadership is another critical strategy utilized in the Silver Nitrate market. Companies strive to produce silver nitrate at a lower cost compared to competitors while maintaining quality standards. This enables them to offer competitive pricing, appealing to cost-conscious customers and gaining market share. Cost leadership strategies often involve optimizing production processes, sourcing raw materials efficiently, and leveraging economies of scale to reduce manufacturing costs. By providing cost-effective solutions without compromising quality, companies can broaden their customer base and increase their market share. Market segmentation plays a significant role in market share positioning within the Silver Nitrate industry. Companies segment the market based on factors such as purity levels, end-use applications (e.g., photography, wound care, mirror coating), or geographic regions. By understanding the unique needs and preferences of each segment, companies can tailor their products, services, and marketing strategies to better serve targeted customer groups. This targeted approach enables companies to penetrate specific market niches more effectively and gain market share within those segments. Strategic partnerships and alliances are also crucial for market share positioning in the Silver Nitrate market. Collaborating with other companies, silver nitrate producers, distributors, or industry associations can provide access to complementary resources, expertise, and distribution channels that enhance competitiveness and market penetration. Joint ventures, partnerships, or alliances can facilitate market expansion and strengthen market position by combining strengths and sharing risks. By leveraging strategic partnerships, companies can access new markets, expand their product portfolio, and increase their overall market share. Innovation and continuous product development are essential components of market share positioning strategies in the Silver Nitrate market. Companies invest in research and development to introduce new silver nitrate products, formulations, or applications that address evolving customer needs, industry trends, and regulatory requirements. Innovation allows companies to differentiate themselves from competitors by offering advanced solutions that deliver enhanced performance, purity, or environmental benefits. By continuously innovating and improving their product offerings, companies can attract customers seeking the latest advancements and secure a larger share of the market. Effective marketing and branding are critical for communicating the value proposition of Silver Nitrate products and influencing customer perceptions in the market. Through targeted marketing campaigns, branding initiatives, and educational efforts, companies can raise awareness about the benefits of silver nitrate and build trust and credibility with customers. By effectively communicating the advantages of their products, such as antimicrobial properties in healthcare or light sensitivity in photography, companies can attract customers and gain market share over time. Lastly, continuous monitoring of market trends, competitor activities, and regulatory developments is essential for adapting and refining market share positioning strategies in the Silver Nitrate market. By staying informed about industry dynamics, customer preferences, and policy changes, companies can identify emerging opportunities and threats. This enables them to adjust their strategies accordingly, seize opportunities for growth, and mitigate risks that could affect their market share. Continuous market monitoring and strategic agility are essential for maintaining a competitive edge and sustaining market share in the dynamic Silver Nitrate market landscape.

    Market Summary

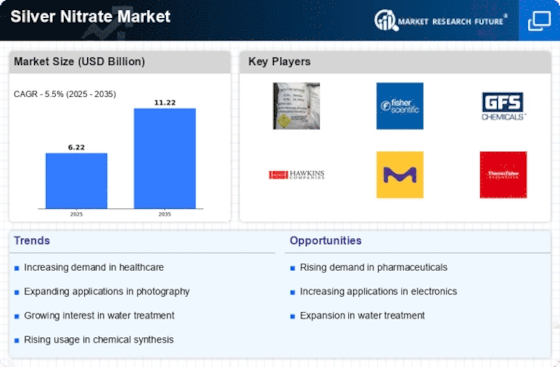
    As per Market Research Future Analysis, the global silver nitrate market was valued at USD 6.22 Billion in 2024 and is projected to grow to USD 11.22 Billion by 2035, with a CAGR of 5.50% from 2025 to 2035. The market is driven by the increasing demand for antimicrobial applications in healthcare, particularly in wound management and eye treatments. Additionally, the rise in infrastructure projects and technological advancements in electronics are contributing to the growing consumption of silver nitrate across various industries.

    Key Market Trends & Highlights

    Key trends influencing the silver nitrate market include technological advancements and increased global demand.

    • Silver nitrate's application in electronics is rising due to miniaturization and enhanced conductivity requirements.
    • The USP Grade segment dominated the market, reflecting the globalized trade demand across industries.
    • The Medical & Pharmaceuticals sector generated the most income, driven by silver nitrate's antimicrobial properties.
    • The Asia-Pacific region is expected to grow at the fastest CAGR from 2023 to 2032, led by infrastructure development.

    Market Size & Forecast

    2024 Market Size USD 6.22 Billion
    2035 Market Size USD 11.22 Billion
    CAGR (2025-2035) 5.50%
    Largest Regional Market Share in 2024 North America

    Major Players

    Key players in the silver nitrate market include American Elements, Avantor, GFS Chemicals, Merck, ProChem, Ames Goldsmith Corporation, Chenzhous Nonferrous Metals JSC, Columbus Chemical Industries (CCI), and Spectrum Chemical Manufacturing Corporation.

    Market Trends

    The demand for silver nitrate is anticipated to grow as its applications in various sectors, including pharmaceuticals and photography, continue to expand, reflecting a broader trend towards the utilization of silver compounds in modern technologies.

    U.S. Geological Survey

    Silver Nitrate Market Market Drivers

    Growing Demand in Healthcare

    The Global Silver Nitrate Market Industry is experiencing a surge in demand due to its extensive applications in the healthcare sector. Silver nitrate is utilized as an antiseptic and in wound care products, which is particularly relevant as healthcare facilities increasingly prioritize infection control. The market is projected to reach 6.33 USD Billion in 2024, reflecting a growing recognition of silver's antimicrobial properties. This trend is likely to continue as healthcare providers adopt advanced materials and treatments, potentially driving the market further as the global population ages and healthcare needs evolve.

    Market Segment Insights

    Silver Nitrate

    Based on Grade Type, this segment includes Analytical Reagent Grade (ARG), Active Pharmaceutical Ingredient (API) Grade, Photographic Grade, Others. The Photographic Grade segment dominated the global market in 2024, while the others segment is projected to be the fastest–growing segment during the forecast period. Photographic grade silver nitrate is primarily used in producing light-sensitive materials for traditional film photography and medical imaging. 

    This grade is essential in photography and jewelry, as it is the main component in black-and-white film development, X-ray films, fine art photography, holography, and security printing. In the medicine and healthcare sector, photographic-grade silver nitrate plays a crucial role in medical imaging, particularly in the production of X-ray films for diagnostic applications. Its glass coating application involves the manufacturing of specialized optical coatings for photographic and imaging lenses. Although its presence in the textile industry is minimal, it can be used in coatings for high-end reflective or photographic fabric applications.

    FIGURE 2: SILVER NITRATE MARKET SHARE BY GRADE TYPE 2024 AND 2035 (USD BILLION)

    Source: Secondary Research, Primary Research, MRFR Database and Analyst Review

    Silver Nitrate

    Based on Application, this segment includes Photography & Jewellery, Medicine & Healthcare, Glass Coating, Textile, Others. The Medicine & Healthcare segment dominated the global market in 2024, while the others segment is projected to be the fastest–growing segment during the forecast period. Silver nitrate, particularly API-grade and analytical reagent-grade, plays a crucial role in the medicine and healthcare industry due to its powerful antimicrobial, cauterizing, and diagnostic properties. Its application spans across pharmaceuticals, dermatology, ophthalmology, wound care, and medical imaging. 

    One of the most common uses of API-grade silver nitrate is wound care and dermatology. It is widely used as a cauterizing agent for minor injuries, burns, and chronic ulcers. Silver nitrate sticks are frequently used in medical settings for removing warts and treating skin infections. In ophthalmology, silver nitrate solutions have been historically used in newborn eye drops to prevent bacterial infections such as neonatal conjunctivitis. With growing concerns about antibiotic resistance, the demand for silver-based antimicrobial agents is increasing, further driving the need for silver nitrate in pharmaceutical and medical applications.

    Get more detailed insights about Silver Nitrate Market Research Report – Forecast Till 2035

    Regional Insights

    Based on the Region, the global Silver Nitrate is segmented into North America, Europe, Asia-Pacific, Middle East & Africa and South America. The North America dominated the global market in 2024, while the Asia-Pacific is projected to be the fastest–growing segment during the forecast period. Major demand factors driving the North America market are the rising demand for silver-based medical applications (antimicrobial, wound care, cauterization) and growth in industrial applications (mirrors, silver plating, photography) and increased use in electronic components manufacturing. 

    The United States dominates the regional market due to its strong pharmaceutical and healthcare sectors. Silver nitrate is widely used in wound care treatments, medical devices, and antimicrobial coatings, contributing significantly to demand. Additionally, the U.S. has a well-established nanotechnology and electronics industry, utilizing silver nitrate in conductive inks for flexible electronics, printed circuit boards, and advanced sensors. Government investments in biotechnology and sustainable chemistry are further supporting market expansion.

    FIGURE 3: SILVER NITRATE MARKET VALUE BY REGION 2024 AND 2035 (USD BILLION)

    SILVER NITRATE MARKET VALUE BY REGION 2024 AND 2035

    Source: Secondary Research, Primary Research, MRFR Database, and Analyst Review

    Further, the countries considered in the scope of the Application Tracking System Market are the United States, Canada, Mexico, Germany, United Kingdom, France, Italy, Russia, Spain, China, India, Japan, South Korea, Malaysia, Thailand, Indonesia, GCC Countries, South Africa, Argentina, Brazil and others.

    Key Players and Competitive Insights

    Many global, regional, and local vendors characterize the Silver Nitrate Market. The market is highly competitive, with all the players competing to gain market share. Intense competition, rapid advances in technology, frequent changes in government policies, and environmental regulations are key factors that confront market growth. The vendors compete based on cost, product quality, reliability, and government regulations. Vendors must provide cost-efficient, high-quality products to survive and succeed in an intensely competitive market.

    The major competitors in the market are American Elements, Avantor, Merck, Ames Goldsmith Corporation, Columbus Chemical Industries (CCI), GFS Chemicals, Spectrum Chemical Manufacturing Corp, Rochester Silver Works LLC, Forbes Pharmaceuticals, Thermo Fisher Scientific are among others. The Silver Nitrate Market is a consolidated market due to increasing competition, acquisitions, mergers and other strategic market developments and decisions to improve operational effectiveness.

    Key Companies in the Silver Nitrate Market market include

    Industry Developments

    Future Outlook

    Silver Nitrate Market Future Outlook

    The Silver Nitrate Market is projected to grow at a 5.50% CAGR from 2025 to 2035, driven by increasing demand in healthcare, electronics, and water treatment sectors.

    New opportunities lie in:

    • Expand production capabilities to meet rising demand in pharmaceuticals.
    • Invest in R&D for innovative applications in nanotechnology.
    • Develop strategic partnerships with water treatment companies for sustainable solutions.

    By 2035, the Silver Nitrate Market is expected to achieve substantial growth, reflecting evolving industry needs.

    Market Segmentation

    Regional Outlook

    • United States
    • Canada
    • Mexico

    Silver Nitrate Regional Outlook

    • United States
    • Canada
    • Mexico

    Silver Nitrate by Grade Type Outlook

    • Analytical Reagent Grade (ARG)
    • Active Pharmaceutical Ingredient (API) Grade
    • Photographic Grade
    • Others

    Silver Nitrate by Application Outlook

    • Photography & Jewellery
    • Medicine & Healthcare
    • Glass Coating
    • Textile
    • Others

    Report Scope

    Report Attribute/Metric

    Details

    Market Size 2024

    USD 6.33 Billion

    Market Size 2025

    USD 6.72 Billion

    Market Size 2035

    11.22

    Compound Annual Growth Rate (CAGR)

    5.50% (2025 - 2035)

    Base Year

    2024

    Forecast Period

    2025 - 2035

    Historical Data

    2019-2023

    Forecast Units

    Value, Volume (USD Billion, Tons)

    Report Coverage

    Revenue Forecast, Competitive Landscape, Growth Factors, and Trends

    Segments Covered

    By Grade Type, By Application

    Geographies Covered

    North America, Europe, Asia Pacific, Middle East & Africa, South America

    Countries Covered

    The United States, Canada, Mexico, Germany, United Kingdom, France, Italy, Russia, Spain, China, India, Japan, South Korea, Malaysia, Thailand, Indonesia, GCC Countries, South Africa, Argentina, Brazil

    Key Companies Profiled

    American Elements, Avantor, Merck, Ames Goldsmith Corporation, Columbus Chemical Industries (CCI), GFS Chemicals, Spectrum Chemical Manufacturing Corp, Rochester Silver Works LLC, Forbes Pharmaceuticals, Thermo Fisher Scientific

    Key Market Opportunities

    ·         Expansion in Nanotechnology and Advance Material Applications

    Key Market Dynamics

    ·         Rising demand for silver-based medical applications (antimicrobial, wound care, cauterization)

    ·         Growth in industrial applications (mirrors, silver plating, photography)

    ·         Increased use in electronic components manufacturing

    Market Highlights

    Author

    Anshula Mandaokar
    Team Lead - Research

    She holds an experience of about 6+ years in market research and business consulting, working under the spectrum of information communication technology, telecommunications and semiconductor domains. aarti conceptualizes and implements a scalable business strategy and provides strategic leadership to the clients. her expertise lies in market estimation, competitive intelligence, pipeline analysis, customer assessment, etc.

    Leave a Comment

    Latest Comments

    John Doe
    john@example.com

    This is a great article! Really helped me understand the topic better.

    Posted on July 23, 2025, 10:15 AM
    Jane Smith
    jane@domain.com

    Thanks for sharing this. I’ve bookmarked it for later reference.

    Posted on July 22, 2025, 7:45 PM

    FAQs

    How much is the Silver Nitrate Market?

    USD 6.33 Billion is the Silver Nitrate Market in 2024

    Which Application holds the largest market share?

    The Medicine & Healthcare segment by Application holds the largest market share and grows at a CAGR of 5.19 % during the forecast period.

    Which region holds the largest market share in the Silver Nitrate Market?

    North America holds the largest market share in the Silver Nitrate Market.

    Who are the prominent players in the Silver Nitrate Market?

    American Elements, Avantor, Merck, Ames Goldsmith Corporation, Columbus Chemical Industries (CCI), GFS Chemicals, Spectrum Chemical Manufacturing Corp, Rochester Silver Works LLC, Forbes Pharmaceuticals, Thermo Fisher Scientific are prominent players in the Silver Nitrate Market.

    Which Grade Type segment led the Silver Nitrate Market?

    The Photographic Grade segment dominated the market in 2024.

    1. Table of Contents
    2. Executive Summary
    3. Market Introduction
      1. DEFINITION
      2. Scope of the Study
      3. RESEARCH OBJECTIVE
      4. MARKET STRUCTURE
    4. Research Methodology
      1. OVERVIEW
      2. DATA FLOW
        1. DATA MINING PROCESS
      3. PURCHASED DATABASE:
      4. SECONDARY SOURCES:
        1. SECONDARY RESEARCH DATA FLOW:
      5. PRIMARY RESEARCH:
        1. PRIMARY RESEARCH DATA FLOW:
        2. PRIMARY RESEARCH: NUMBER OF INTERVIEWS CONDUCTED
        3. PRIMARY RESEARCH: REGIONAL COVERAGE
      6. APPROACHES FOR MARKET SIZE ESTIMATION:
        1. REVENUE ANALYSIS APPROACH
      7. DATA FORECASTING
        1. DATA FORECASTING TECHNIQUE
      8. DATA MODELING
        1. MICROECONOMIC FACTOR ANALYSIS:
        2. DATA MODELING:
      9. TEAMS AND ANALYST CONTRIBUTION
    5. MARKET DYNAMICS
      1. INTRODUCTION
      2. DRIVERS
        1. RISING DEMAND FOR SILVER-BASED MEDICAL APPLICATIONS (ANTIMICROBIAL, WOUND CARE, CAUTERIZATION)
        2. GROWTH IN INDUSTRIAL APPLICATIONS (MIRRORS, SILVER PLATING, PHOTOGRAPHY)
        3. INCREASED USE IN ELECTRONIC COMPONENTS MANUFACTURING
      3. RESTRAINTS
        1. HIGH COST OF SILVER, MAKING SILVER NITRATE EXPENSIVE
        2. STRINGENT ENVIRONMENTAL REGULATIONS ON SILVER NITRATE GRADE MANUFACTURING AND DISPOSAL
      4. OPPORTUNITY
        1. EXPANSION IN NANOTECHNOLOGY AND ADVANCE MATERIAL APPLICATIONS
      5. IMPACT ANALYSIS OF COVID-19
      6. IMPACT ANALYSIS OF RUSSIA UKRAINE WAR AND OTHER GEOPOLITICAL TENSION
    6. MARKET FACTOR ANALYSIS
      1. SUPPLY CHAIN ANALYSIS
        1. RAW MATERIAL SOURCING
        2. SILVER REFINING AND PROCESSING
        3. SILVER NITRATE MANUFACTURING
        4. LOGISTICS AND DISTRIBUTION
        5. END-USE INDUSTRIES AND APPLICATIONS
      2. PORTER’S FIVE FORCES MODEL
        1. BARGAINING POWER OF SUPPLIERS
        2. BARGAINING POWER OF BUYERS
        3. THREAT OF NEW ENTRANTS
        4. THREAT OF SUBSTITUTE PRODUCTS
        5. INDUSTRY RIVALRY
      3. CASE STUDY ANALYSIS
        1. CASE STUDY 1
        2. CASE STUDY 2
      4. PRICING ANALYSIS, BY REGION
      5. PERFORMANCE CHARACTERISTICS ANALYSIS
      6. TECHNOLOGICAL ADVANCEMENTS
      7. RESEARCH AND DEVELOPMENT UPDATE
        1. CURRENT SCENARIO
        2. FUTURE ROADMAP
        3. NOVEL APPLICATIONS
        4. KEY DEVELOPMENTS
      8. BROAD LEVEL GAP ANALYSIS
      9. TRADE ANALYSIS
        1. NET IMPORTS AND EXPORTS
        2. KEY COUNTRIES
    7. GLOBAL SILVER NITRATE MARKET, BY GRADE TYPE
      1. INTRODUCTION
      2. ANALYTICAL REAGENT GRADE (ARG)
      3. ACTIVE PHARMACEUTICAL INGREDIENT (API) GRADE
      4. PHOTOGRAPHIC GRADE
      5. OTHERS
    8. GLOBAL SILVER NITRATE MARKET, BY APPLICATION
      1. INTRODUCTION
      2. PHOTOGRAPHY & JEWELRY
      3. MEDICINE & HEALTHCARE
      4. GLASS COATING
      5. TEXTILE
      6. OTHERS
    9. GLOBAL SILVER NITRATE MARKET, BY REGION
      1. OVERVIEW
      2. NORTH AMERICA
        1. UNITED STATES
        2. CANADA
        3. MEXICO
      3. EUROPE
        1. GERMANY
        2. U.K.
        3. FRANCE
        4. ITALY
        5. RUSSIA
        6. SPAIN
        7. REST OF EUROPE
      4. ASIA-PACIFIC
        1. CHINA
        2. INDIA
        3. JAPAN
        4. SOUTH KOREA
        5. MALAYSIA
        6. THAILAND
        7. INDONESIA
        8. REST OF APAC
      5. MIDDLE EAST AND AFRICA
        1. GCC COUNTRIES
        2. SOUTH AFRICA
        3. REST OF MEA
      6. SOUTH AMERICA
        1. BRAZIL
        2. ARGENTINA
        3. REST OF SOUTH AMERICA
    10. Competitive Landscape
      1. INTRODUCTION
      2. MARKET SHARE ANALYSIS, 2024-24
      3. COMPETITOR DASHBOARD
    11. COMPANY PROFILES
      1. AMERICAN ELEMENTS
        1. COMPANY OVERVIEW
        2. FINANCIAL OVERVIEW
        3. PRODUCTS OFFERED
        4. KEY DEVELOPMENTS
        5. SWOT ANALYSIS
        6. KEY STRATEGY
      2. AVANTOR
        1. COMPANY OVERVIEW
        2. FINANCIAL OVERVIEW
        3. PRODUCTS OFFERED
        4. KEY DEVELOPMENTS
        5. SWOT ANALYSIS
        6. KEY STRATEGY
      3. MERCK
        1. COMPANY OVERVIEW
        2. FINANCIAL OVERVIEW
        3. PRODUCTS OFFERED
        4. KEY DEVELOPMENTS
        5. SWOT ANALYSIS
        6. KEY STRATEGY
      4. AMES GOLDSMITH CORPORATION
        1. COMPANY OVERVIEW
        2. FINANCIAL OVERVIEW
        3. PRODUCTS OFFERED
        4. KEY DEVELOPMENTS
        5. SWOT ANALYSIS
        6. KEY STRATEGY
      5. COLUMBUS CHEMICAL INDUSTRIES (CCI)
        1. COMPANY OVERVIEW
        2. FINANCIAL OVERVIEW
        3. PRODUCTS OFFERED
        4. KEY DEVELOPMENTS
        5. SWOT ANALYSIS
        6. KEY STRATEGY
      6. GFS CHEMICALS
        1. COMPANY OVERVIEW
        2. FINANCIAL OVERVIEW
        3. PRODUCTS OFFERED
        4. KEY DEVELOPMENTS
        5. SWOT ANALYSIS
        6. KEY STRATEGY
      7. SPECTRUM CHEMICAL MANUFACTURING CORP
        1. COMPANY OVERVIEW
        2. FINANCIAL OVERVIEW
        3. PRODUCTS OFFERED
        4. KEY DEVELOPMENTS
        5. SWOT ANALYSIS
        6. KEY STRATEGY
      8. ROCHESTER SILVER WORKS LLC
        1. COMPANY OVERVIEW
        2. FINANCIAL OVERVIEW
        3. PRODUCTS OFFERED
        4. KEY DEVELOPMENTS
        5. SWOT ANALYSIS
        6. KEY STRATEGY
      9. FORBES PHARMACEUTICALS
        1. COMPANY OVERVIEW
        2. FINANCIAL OVERVIEW
        3. PRODUCTS OFFERED
        4. KEY DEVELOPMENTS
        5. SWOT ANALYSIS
        6. KEY STRATEGY
      10. THERMO FISHER SCIENTIFIC
        1. COMPANY OVERVIEW
        2. FINANCIAL OVERVIEW
        3. PRODUCTS OFFERED
        4. KEY DEVELOPMENTS
        5. SWOT ANALYSIS
        6. KEY STRATEGY
    12. List of Tables and Figures
      1. 10.11 DATA CITATIONS   LIST OF TABLES
      2. TABLE 1 QFD MODELING FOR MARKET SHARE ASSESSMENT
      3. TABLE 2 PRICING OF SILVER NITRATE (USD/TON)
      4. TABLE 3 TRADE DATA
      5. TABLE
      6. TABLE 4 TOP IMPORTERS OF SILVER NITRATE, 2024
      7. TABLE 5 TOP EXPORTERS OF SILVER NITRATE, 2024
      8. TABLE 6 GLOBAL SILVER NITRATE MARKET, BY GRADE TYPE, 2019-2035 (USD BILLION)
      9. TABLE 7 GLOBAL SILVER NITRATE MARKET VOLUME, BY GRADE TYPE, 2019-2035 (TONS)
      10. TABLE 8 GLOBAL SILVER NITRATE MARKET, BY APPLICATION, 2019-2035 (USD BILLION)
      11. TABLE 9 GLOBAL SILVER NITRATE MARKET VOLUME, BY APPLICATION, 2019-2035 (TONS)
      12. TABLE 10 GLOBAL SILVER NITRATE MARKET, BY REGION, 2019-2035 (USD BILLION)
      13. TABLE 11 GLOBAL SILVER NITRATE MARKET, BY REGION, 2019-2035 (USD BILLION)
      14. TABLE 12 NORTH AMERICA: SILVER NITRATE MARKET, BY COUNTRY, 2019-2035 (USD BILLION)
      15. TABLE 13 NORTH AMERICA: SILVER NITRATE MARKET VOLUME, BY COUNTRY, 2019-2035 (TONS)
      16. TABLE 14 NORTH AMERICA: SILVER NITRATE MARKET, BY GRADE, 2019-2035 (USD BILLION)
      17. TABLE 15 NORTH AMERICA: SILVER NITRATE MARKET VOLUME, BY GRADE, 2019-2035 (TONS)
      18. TABLE 16 NORTH AMERICA: SILVER NITRATE MARKET, BY APPLICATION, 2019-2035 (USD BILLION)
      19. TABLE 17 NORTH AMERICA: SILVER NITRATE MARKET VOLUME, BY APPLICATION, 2019-2035 (TONS)
      20. TABLE 18 UNITED STATES: SILVER NITRATE MARKET, BY GRADE, 2019-2035 (USD BILLION)
      21. TABLE 19 UNITED STATES: SILVER NITRATE MARKET VOLUME, BY GRADE, 2019-2035 (TONS)
      22. TABLE 20 UNITED STATES: SILVER NITRATE MARKET, BY APPLICATION, 2019-2035 (USD BILLION)
      23. TABLE 21 UNITED STATES: SILVER NITRATE MARKET VOLUME, BY APPLICATION, 2019-2035 (TONS)
      24. TABLE 22 CANADA: SILVER NITRATE MARKET, BY GRADE, 2019-2035 (USD BILLION)
      25. TABLE 23 CANADA: SILVER NITRATE MARKET VOLUME, BY GRADE, 2019-2035 (TONS)
      26. TABLE 24 CANADA: SILVER NITRATE MARKET, BY APPLICATION, 2019-2035 (USD BILLION)
      27. TABLE 25 CANADA: SILVER NITRATE MARKET VOLUME, BY APPLICATION, 2019-2035 (TONS)
      28. TABLE 26 MEXICO: SILVER NITRATE MARKET, BY GRADE, 2019-2035 (USD BILLION)
      29. TABLE 27 MEXICO: SILVER NITRATE MARKET VOLUME, BY GRADE, 2019-2035 (TONS)
      30. TABLE 28 MEXICO: SILVER NITRATE MARKET, BY APPLICATION, 2019-2035 (USD BILLION)
      31. TABLE 29 MEXICO: SILVER NITRATE MARKET VOLUME, BY APPLICATION, 2019-2035 (TONS)
      32. TABLE 30 EUROPE: SILVER NITRATE MARKET, BY COUNTRY, 2019-2035 (USD BILLION)
      33. TABLE 31 EUROPE: SILVER NITRATE MARKET VOLUME, BY COUNTRY, 2019-2035 (TONS)
      34. TABLE 32 EUROPE: SILVER NITRATE MARKET, BY GRADE, 2019-2035 (USD BILLION)
      35. TABLE 33 EUROPE: SILVER NITRATE MARKET VOLUME, BY GRADE, 2019-2035 (TONS)
      36. TABLE 34 EUROPE: SILVER NITRATE MARKET, BY APPLICATION, 2019-2035 (USD BILLION)
      37. TABLE 35 EUROPE: SILVER NITRATE MARKET VOLUME, BY APPLICATION, 2019-2035 (TONS)
      38. TABLE 36 GERMANY: SILVER NITRATE MARKET, BY GRADE, 2019-2035 (USD BILLION)
      39. TABLE 37 GERMANY: SILVER NITRATE MARKET VOLUME, BY GRADE, 2019-2035 (TONS)
      40. TABLE 38 GERMANY: SILVER NITRATE MARKET, BY APPLICATION, 2019-2035 (USD BILLION)
      41. TABLE 39 GERMANY: SILVER NITRATE MARKET VOLUME, BY APPLICATION, 2019-2035 (TONS)
      42. TABLE 40 U.K.: SILVER NITRATE MARKET, BY GRADE, 2019-2035 (USD BILLION)
      43. TABLE 41 U.K.: SILVER NITRATE MARKET VOLUME, BY GRADE, 2019-2035 (TONS)
      44. TABLE 42 U.K.: SILVER NITRATE MARKET, BY APPLICATION, 2019-2035 (USD BILLION)
      45. TABLE 43 U.K.: SILVER NITRATE MARKET VOLUME, BY APPLICATION, 2019-2035 (TONS)
      46. TABLE 44 FRANCE: SILVER NITRATE MARKET, BY GRADE, 2019-2035 (USD BILLION)
      47. TABLE 45 FRANCE: SILVER NITRATE MARKET VOLUME, BY GRADE, 2019-2035 (TONS)
      48. TABLE 46 FRANCE: SILVER NITRATE MARKET, BY APPLICATION, 2019-2035 (USD BILLION)
      49. TABLE 47 FRANCE: SILVER NITRATE MARKET VOLUME, BY APPLICATION, 2019-2035 (TONS)
      50. TABLE 48 ITALY: SILVER NITRATE MARKET, BY GRADE, 2019-2035 (USD BILLION)
      51. TABLE 49 ITALY: SILVER NITRATE MARKET VOLUME, BY GRADE, 2019-2035 (TONS)
      52. TABLE 50 ITALY: SILVER NITRATE MARKET, BY APPLICATION, 2019-2035 (USD BILLION)
      53. TABLE 51 ITALY: SILVER NITRATE MARKET VOLUME, BY APPLICATION, 2019-2035 (TONS)
      54. TABLE 52 RUSSIA: SILVER NITRATE MARKET, BY GRADE, 2019-2035 (USD BILLION)
      55. TABLE 53 RUSSIA: SILVER NITRATE MARKET VOLUME, BY GRADE, 2019-2035 (TONS)
      56. TABLE 54 RUSSIA: SILVER NITRATE MARKET, BY APPLICATION, 2019-2035 (USD BILLION)
      57. TABLE 55 RUSSIA: SILVER NITRATE MARKET VOLUME, BY APPLICATION, 2019-2035 (TONS)
      58. TABLE 56 SPAIN: SILVER NITRATE MARKET, BY GRADE, 2019-2035 (USD BILLION)
      59. TABLE 57 SPAIN: SILVER NITRATE MARKET VOLUME, BY GRADE, 2019-2035 (TONS)
      60. TABLE 58 SPAIN: SILVER NITRATE MARKET, BY APPLICATION, 2019-2035 (USD BILLION)
      61. TABLE 59 SPAIN: SILVER NITRATE MARKET VOLUME, BY APPLICATION, 2019-2035 (TONS)
      62. TABLE 60 REST OF EUROPE: SILVER NITRATE MARKET, BY GRADE, 2019-2035 (USD BILLION)
      63. TABLE 61 REST OF EUROPE: SILVER NITRATE MARKET VOLUME, BY GRADE, 2019-2035 (TONS)
      64. TABLE 62 REST OF EUROPE: SILVER NITRATE MARKET, BY APPLICATION, 2019-2035 (USD BILLION)
      65. TABLE 63 REST OF EUROPE: SILVER NITRATE MARKET VOLUME, BY APPLICATION, 2019-2035 (TONS)
      66. TABLE 64 ASIA-PACIFIC: SILVER NITRATE MARKET, BY COUNTRY, 2019-2035 (USD BILLION)
      67. TABLE 65 ASIA-PACIFIC: SILVER NITRATE MARKET VOLUME, BY COUNTRY, 2019-2035 (TONS)
      68. TABLE 66 ASIA-PACIFIC: SILVER NITRATE MARKET, BY GRADE, 2019-2035 (USD BILLION)
      69. TABLE 67 ASIA-PACIFIC: SILVER NITRATE MARKET VOLUME, BY GRADE, 2019-2035 (TONS)
      70. TABLE 68 ASIA-PACIFIC: SILVER NITRATE MARKET, BY APPLICATION, 2019-2035 (USD BILLION)
      71. TABLE 69 ASIA-PACIFIC: SILVER NITRATE MARKET VOLUME, BY APPLICATION, 2019-2035 (TONS)
      72. TABLE 70 CHINA: SILVER NITRATE MARKET, BY GRADE, 2019-2035 (USD BILLION)
      73. TABLE 71 CHINA: SILVER NITRATE MARKET VOLUME, BY GRADE, 2019-2035 (TONS)
      74. TABLE 72 CHINA: SILVER NITRATE MARKET, BY APPLICATION, 2019-2035 (USD BILLION)
      75. TABLE 73 CHINA: SILVER NITRATE MARKET VOLUME, BY APPLICATION, 2019-2035 (TONS)
      76. TABLE 74 INDIA: SILVER NITRATE MARKET, BY GRADE, 2019-2035 (USD BILLION)
      77. TABLE 75 INDIA: SILVER NITRATE MARKET VOLUME, BY GRADE, 2019-2035 (TONS)
      78. TABLE 76 INDIA: SILVER NITRATE MARKET, BY APPLICATION, 2019-2035 (USD BILLION)
      79. TABLE 77 INDIA: SILVER NITRATE MARKET VOLUME, BY APPLICATION, 2019-2035 (TONS)
      80. TABLE 78 JAPAN: SILVER NITRATE MARKET, BY GRADE, 2019-2035 (USD BILLION)
      81. TABLE 79 JAPAN: SILVER NITRATE MARKET VOLUME, BY GRADE, 2019-2035 (TONS)
      82. TABLE 80 JAPAN: SILVER NITRATE MARKET, BY APPLICATION, 2019-2035 (USD BILLION)
      83. TABLE 81 JAPAN: SILVER NITRATE MARKET VOLUME, BY APPLICATION, 2019-2035 (TONS)
      84. TABLE 82 SOUTH KOREA: SILVER NITRATE MARKET, BY GRADE, 2019-2035 (USD BILLION)
      85. TABLE 83 SOUTH KOREA: SILVER NITRATE MARKET VOLUME, BY GRADE, 2019-2035 (TONS)
      86. TABLE 84 SOUTH KOREA: SILVER NITRATE MARKET, BY APPLICATION, 2019-2035 (USD BILLION)
      87. TABLE 85 SOUTH KOREA: SILVER NITRATE MARKET VOLUME, BY APPLICATION, 2019-2035 (TONS)
      88. TABLE 86 MALAYSIA: SILVER NITRATE MARKET, BY GRADE, 2019-2035 (USD BILLION)
      89. TABLE 87 MALAYSIA: SILVER NITRATE MARKET VOLUME, BY GRADE, 2019-2035 (TONS)
      90. TABLE 88 MALAYSIA: SILVER NITRATE MARKET, BY APPLICATION, 2019-2035 (USD BILLION)
      91. TABLE 89 MALAYSIA: SILVER NITRATE MARKET VOLUME, BY APPLICATION, 2019-2035 (TONS)
      92. TABLE 90 THAILAND: SILVER NITRATE MARKET, BY GRADE, 2019-2035 (USD BILLION)
      93. TABLE 91 THAILAND: SILVER NITRATE MARKET VOLUME, BY GRADE, 2019-2035 (TONS)
      94. TABLE 92 THAILAND: SILVER NITRATE MARKET, BY APPLICATION, 2019-2035 (USD BILLION)
      95. TABLE 93 THAILAND: SILVER NITRATE MARKET VOLUME, BY APPLICATION, 2019-2035 (TONS)
      96. TABLE 94 INDONESIA: SILVER NITRATE MARKET, BY GRADE, 2019-2035 (USD BILLION)
      97. TABLE 95 INDONESIA: SILVER NITRATE MARKET VOLUME, BY GRADE, 2019-2035 (TONS)
      98. TABLE 96 INDONESIA: SILVER NITRATE MARKET, BY APPLICATION, 2019-2035 (USD BILLION)
      99. TABLE 97 INDONESIA: SILVER NITRATE MARKET VOLUME, BY APPLICATION, 2019-2035 (TONS)
      100. TABLE 98 REST OF APAC: SILVER NITRATE MARKET, BY GRADE, 2019-2035 (USD BILLION)
      101. TABLE 99 REST OF APAC: SILVER NITRATE MARKET VOLUME, BY GRADE, 2019-2035 (TONS)
      102. TABLE 100 REST OF APAC: SILVER NITRATE MARKET, BY APPLICATION, 2019-2035 (USD BILLION)
      103. TABLE 101 REST OF APAC: SILVER NITRATE MARKET VOLUME, BY APPLICATION, 2019-2035 (TONS)
      104. TABLE 102 MIDDLE EAST AND AFRICA: SILVER NITRATE MARKET, BY COUNTRY, 2019-2035 (USD BILLION)
      105. TABLE 103 MIDDLE EAST AND AFRICA: SILVER NITRATE MARKET VOLUME, BY COUNTRY, 2019-2035 (TONS)
      106. TABLE 104 MIDDLE EAST AND AFRICA: SILVER NITRATE MARKET, BY GRADE, 2019-2035 (USD BILLION)
      107. TABLE 105 MIDDLE EAST AND AFRICA: SILVER NITRATE MARKET VOLUME, BY GRADE, 2019-2035 (TONS)
      108. TABLE 106 MIDDLE EAST AND AFRICA: SILVER NITRATE MARKET, BY APPLICATION, 2019-2035 (USD BILLION)
      109. TABLE 107 MIDDLE EAST AND AFRICA: SILVER NITRATE MARKET VOLUME, BY APPLICATION, 2019-2035 (TONS)
      110. TABLE 108 GCC COUNTRIES: SILVER NITRATE MARKET, BY GRADE, 2019-2035 (USD BILLION)
      111. TABLE 109 GCC COUNTRIES: SILVER NITRATE MARKET VOLUME, BY GRADE, 2019-2035 (TONS)
      112. TABLE 110 GCC COUNTRIES: SILVER NITRATE MARKET, BY APPLICATION, 2019-2035 (USD BILLION)
      113. TABLE 111 GCC COUNTRIES: SILVER NITRATE MARKET VOLUME, BY APPLICATION, 2019-2035 (TONS)
      114. TABLE 112 SOUTH AFRICA: SILVER NITRATE MARKET, BY GRADE, 2019-2035 (USD BILLION)
      115. TABLE 113 SOUTH AFRICA: SILVER NITRATE MARKET VOLUME, BY GRADE, 2019-2035 (TONS)
      116. TABLE 114 SOUTH AFRICA: SILVER NITRATE MARKET, BY APPLICATION, 2019-2035 (USD BILLION)
      117. TABLE 115 SOUTH AFRICA: SILVER NITRATE MARKET VOLUME, BY APPLICATION, 2019-2035 (TONS)
      118. TABLE 116 REST OF MEA: SILVER NITRATE MARKET, BY GRADE, 2019-2035 (USD BILLION)
      119. TABLE 117 REST OF MEA: SILVER NITRATE MARKET VOLUME, BY GRADE, 2019-2035 (TONS)
      120. TABLE 118 REST OF MEA: SILVER NITRATE MARKET, BY APPLICATION, 2019-2035 (USD BILLION)
      121. TABLE 119 REST OF MEA: SILVER NITRATE MARKET VOLUME, BY APPLICATION, 2019-2035 (TONS)
      122. TABLE 120 SOUTH AMERICA: SILVER NITRATE MARKET, BY COUNTRY, 2019-2035 (USD BILLION)
      123. TABLE 121 SOUTH AMERICA: SILVER NITRATE MARKET VOLUME, BY COUNTRY, 2019-2035 (TONS)
      124. TABLE 122 SOUTH AMERICA: SILVER NITRATE MARKET, BY GRADE, 2019-2035 (USD BILLION)
      125. TABLE 123 SOUTH AMERICA: SILVER NITRATE MARKET VOLUME, BY GRADE, 2019-2035 (TONS)
      126. TABLE 124 SOUTH AMERICA: SILVER NITRATE MARKET, BY APPLICATION, 2019-2035 (USD BILLION)
      127. TABLE 125 SOUTH AMERICA: SILVER NITRATE MARKET VOLUME, BY APPLICATION, 2019-2035 (TONS)
      128. TABLE 126 BRAZIL: SILVER NITRATE MARKET, BY GRADE, 2019-2035 (USD BILLION)
      129. TABLE 127 BRAZIL: SILVER NITRATE MARKET VOLUME, BY GRADE, 2019-2035 (TONS)
      130. TABLE 128 BRAZIL: SILVER NITRATE MARKET, BY APPLICATION, 2019-2035 (USD BILLION)
      131. TABLE 129 BRAZIL: SILVER NITRATE MARKET VOLUME, BY APPLICATION, 2019-2035 (TONS)
      132. TABLE 130 ARGENTINA: SILVER NITRATE MARKET, BY GRADE, 2019-2035 (USD BILLION)
      133. TABLE 131 ARGENTINA: SILVER NITRATE MARKET VOLUME, BY GRADE, 2019-2035 (TONS)
      134. TABLE 132 ARGENTINA: SILVER NITRATE MARKET, BY APPLICATION, 2019-2035 (USD BILLION)
      135. TABLE 133 ARGENTINA: SILVER NITRATE MARKET VOLUME, BY APPLICATION, 2019-2035 (TONS)
      136. TABLE 134 REST OF SOUTH AMERICA: SILVER NITRATE MARKET, BY GRADE, 2019-2035 (USD BILLION)
      137. TABLE 135 REST OF SOUTH AMERICA: SILVER NITRATE MARKET VOLUME, BY GRADE, 2019-2035 (TONS)
      138. TABLE 136 REST OF SOUTH AMERICA: SILVER NITRATE MARKET, BY APPLICATION, 2019-2035 (USD BILLION)
      139. TABLE 137 REST OF SOUTH AMERICA: SILVER NITRATE MARKET VOLUME, BY APPLICATION, 2019-2035 (TONS)
      140. TABLE 138 AMERICAN ELEMENTS: PRODUCTS OFFERED
      141. TABLE 139 AVANTOR: PRODUCTS OFFERED
      142. TABLE 140 MERCK: PRODUCTS OFFERED
      143. TABLE 141 AMES GOLDSMITH CORPORATION: PRODUCTS OFFERED
      144. TABLE 142 COLUMBUS CHEMICAL INDUSTRIES (CCI): PRODUCTS OFFERED
      145. TABLE 143 GFS CHEMICALS: PRODUCTS OFFERED
      146. TABLE 144 SPECTRUM CHEMICAL MANUFACTURING CORP: PRODUCTS OFFERED
      147. TABLE 145 ROCHESTER SILVER WORKS LLC: PRODUCTS OFFERED
      148. TABLE 146 FORBES PHARMACEUTICALS: PRODUCTS OFFERED
      149. TABLE 147 THERMO FISHER SCIENTIFIC: PRODUCTS OFFERED   LIST OF FIGURES
      150. FIGURE 1 GLOBAL SILVER NITRATE MARKET: STRUCTURE
      151. FIGURE 2 GLOBAL SILVER NITRATE MARKET: MARKET GROWTH FACTOR ANALYSIS (2022-2030)
      152. FIGURE 3 SUPPLY CHAIN ANALYSIS: GLOBAL SILVER NITRATE MARKET
      153. FIGURE 4 PORTER’S FIVE FORCES MODEL: GLOBAL SILVER NITRATE MARKET
      154. FIGURE 5 GLOBAL SILVER NITRATE MARKET, BY GRADE TYPE, 2024 (% SHARE)
      155. FIGURE 6 GLOBAL SILVER NITRATE MARKET, BY GRADE TYPE, 2024 (% SHARE)
      156. FIGURE 7 GLOBAL SILVER NITRATE MARKET, BY APPLICATION, 2024 (% SHARE)
      157. FIGURE 8 GLOBAL SILVER NITRATE MARKET VOLUME, BY APPLICATION, 2024 (% SHARE)
      158. FIGURE 9 GLOBAL SILVER NITRATE MARKET, BY REGION, 2024 (% SHARE)
      159. FIGURE 10 GLOBAL SILVER NITRATE MARKET, BY REGION, 2024 (% SHARE)
      160. FIGURE 11 NORTH AMERICA MARKET: SWOT ANALYSIS
      161. FIGURE 12 NORTH AMERICA: SILVER NITRATE MARKET SHARE, BY COUNTRY, 2024 (% SHARE)
      162. FIGURE 13 NORTH AMERICA: SILVER NITRATE MARKET VOLUME SHARE, BY COUNTRY, 2024 (% SHARE)
      163. FIGURE 14 EUROPE MARKET: SWOT ANALYSIS
      164. FIGURE 15 EUROPE: SILVER NITRATE MARKET SHARE, BY COUNTRY, 2024 (% SHARE)
      165. FIGURE 16 EUROPE: SILVER NITRATE MARKET VOLUME SHARE, BY COUNTRY, 2024 (% SHARE)
      166. FIGURE 17 ASIA-PACIFIC MARKET: SWOT ANALYSIS
      167. FIGURE 18 ASIA-PACIFIC: SILVER NITRATE MARKET SHARE, BY COUNTRY, 2024 (% SHARE)
      168. FIGURE 19 ASIA-PACIFIC: SILVER NITRATE MARKET VOLUME SHARE, BY COUNTRY, 2024 (% SHARE)
      169. FIGURE 20 MIDDLE EAST AND AFRICA MARKET: SWOT ANALYSIS
      170. FIGURE 21 MIDDLE EAST AND AFRICA: SILVER NITRATE MARKET SHARE, BY COUNTRY, 2024 (% SHARE)
      171. FIGURE 22 MIDDLE EAST AND AFRICA: SILVER NITRATE MARKET VOLUME SHARE, BY COUNTRY, 2024 (% SHARE)
      172. FIGURE 23 SOUTH AMERICA MARKET: SWOT ANALYSIS
      173. FIGURE 24 SOUTH AMERICA: SILVER NITRATE MARKET SHARE, BY COUNTRY, 2024 (% SHARE)
      174. FIGURE 25 SOUTH AMERICA: SILVER NITRATE MARKET VOLUME SHARE, BY COUNTRY, 2024 (% SHARE)
      175. FIGURE 26 GLOBAL SILVER NITRATE MARKET PLAYERS: COMPETITIVE ANALYSIS, 2024-2024
      176. FIGURE 27 COMPETITOR DASHBOARD: GLOBAL SILVER NITRATE
      177. FIGURE 28 AMERICAN ELEMENTS: SWOT ANALYSIS
      178. FIGURE 29 AVANTOR: FINANCIAL OVERVIEW
      179. FIGURE 30 AVANTOR: SWOT ANALYSIS
      180. FIGURE 31 MERCK: FINANCIAL OVERVIEW
      181. FIGURE 32 MERCK: SWOT ANALYSIS
      182. FIGURE 33 AMES GOLDSMITH CORPORATION: SWOT ANALYSIS
      183. FIGURE 34 COLUMBUS CHEMICAL INDUSTRIES (CCI): SWOT ANALYSIS
      184. FIGURE 35 GFS CHEMICALS: SWOT ANALYSIS
      185. FIGURE 36 SPECTRUM CHEMICAL MANUFACTURING CORP: SWOT ANALYSIS
      186. FIGURE 37 ROCHESTER SILVER WORKS LLC: SWOT ANALYSIS
      187. FIGURE 38 FORBES PHARMACEUTICALS: SWOT ANALYSIS
      188. FIGURE 39 THERMO FISHER SCIENTIFIC: FINANCIAL OVERVIEW
      189. FIGURE 40 THERMO FISHER SCIENTIFIC: SWOT ANALYSIS  

    Global Outlook (USD Billion,Tons,2019-2035)


    Global Silver Nitrate, By Grade Type (USD Billion,Tons,2019-2035)

    • Analytical Reagent Grade (ARG)
    • Active Pharmaceutical Ingredient (API) Grade
    • Photographic Grade
    • Others

    Global Silver Nitrate, By Application (USD Billion,Tons,2019-2035)

    • Photography & Jewellery
    • Medicine & Healthcare
    • Glass Coating
    • Textile
    • Others

    North America Outlook (USD Billion,Tons,2019-2035)


    North America Silver Nitrate, By Grade Type (USD Billion,Tons,2019-2035)

    • Analytical Reagent Grade (ARG)
    • Active Pharmaceutical Ingredient (API) Grade
    • Photographic Grade
    • Others

    North America Silver Nitrate, By Application (USD Billion,Tons,2019-2035)

    • Photography & Jewellery
    • Medicine & Healthcare
    • Glass Coating
    • Textile
    • Others

    United States Outlook (USD Billion,Tons,2019-2035)


    United States Silver Nitrate, By Grade Type (USD Billion,Tons,2019-2035)

    • Analytical Reagent Grade (ARG)
    • Active Pharmaceutical Ingredient (API) Grade
    • Photographic Grade
    • Others

    United States Silver Nitrate, By Application (USD Billion,Tons,2019-2035)

    • Photography & Jewellery
    • Medicine & Healthcare
    • Glass Coating
    • Textile
    • Others

    Canada Outlook (USD Billion,Tons,2019-2035)


    Canada Silver Nitrate, By Grade Type (USD Billion,Tons,2019-2035)

    • Analytical Reagent Grade (ARG)
    • Active Pharmaceutical Ingredient (API) Grade
    • Photographic Grade
    • Others

    Canada Silver Nitrate, By Application (USD Billion,Tons,2019-2035)

    • Photography & Jewellery
    • Medicine & Healthcare
    • Glass Coating
    • Textile
    • Others

    Mexico Outlook (USD Billion,Tons,2019-2035)


    Mexico Silver Nitrate, By Grade Type (USD Billion,Tons,2019-2035)

    • Analytical Reagent Grade (ARG)
    • Active Pharmaceutical Ingredient (API) Grade
    • Photographic Grade
    • Others

    Mexico Silver Nitrate, By Application (USD Billion,Tons,2019-2035)

    • Photography & Jewellery
    • Medicine & Healthcare
    • Glass Coating
    • Textile
    • Others

    Europe Outlook (USD Billion,Tons,2019-2035)


    Europe Silver Nitrate, By Grade Type (USD Billion,Tons,2019-2035)

    • Analytical Reagent Grade (ARG)
    • Active Pharmaceutical Ingredient (API) Grade
    • Photographic Grade
    • Others

    Europe Silver Nitrate, By Application (USD Billion,Tons,2019-2035)

    • Photography & Jewellery
    • Medicine & Healthcare
    • Glass Coating
    • Textile
    • Others

    Germany Outlook (USD Billion,Tons,2019-2035)


    Germany Silver Nitrate, By Grade Type (USD Billion,Tons,2019-2035)

    • Analytical Reagent Grade (ARG)
    • Active Pharmaceutical Ingredient (API) Grade
    • Photographic Grade
    • Others

    Germany Silver Nitrate, By Application (USD Billion,Tons,2019-2035)

    • Photography & Jewellery
    • Medicine & Healthcare
    • Glass Coating
    • Textile
    • Others

    United Kingdom Outlook (USD Billion,Tons,2019-2035)


    United Kingdom Silver Nitrate, By Grade Type (USD Billion,Tons,2019-2035)

    • Analytical Reagent Grade (ARG)
    • Active Pharmaceutical Ingredient (API) Grade
    • Photographic Grade
    • Others

    United Kingdom Silver Nitrate, By Application (USD Billion,Tons,2019-2035)

    • Photography & Jewellery
    • Medicine & Healthcare
    • Glass Coating
    • Textile
    • Others

    France Outlook (USD Billion,Tons,2019-2035)


    France Silver Nitrate, By Grade Type (USD Billion,Tons,2019-2035)

    • Analytical Reagent Grade (ARG)
    • Active Pharmaceutical Ingredient (API) Grade
    • Photographic Grade
    • Others

    France Silver Nitrate, By Application (USD Billion,Tons,2019-2035)

    • Photography & Jewellery
    • Medicine & Healthcare
    • Glass Coating
    • Textile
    • Others

    Italy Outlook (USD Billion,Tons,2019-2035)


    Italy Silver Nitrate, By Grade Type (USD Billion,Tons,2019-2035)

    • Analytical Reagent Grade (ARG)
    • Active Pharmaceutical Ingredient (API) Grade
    • Photographic Grade
    • Others

    Italy Silver Nitrate, By Application (USD Billion,Tons,2019-2035)

    • Photography & Jewellery
    • Medicine & Healthcare
    • Glass Coating
    • Textile
    • Others

    Russia Outlook (USD Billion,Tons,2019-2035)


    Russia Silver Nitrate, By Grade Type (USD Billion,Tons,2019-2035)

    • Analytical Reagent Grade (ARG)
    • Active Pharmaceutical Ingredient (API) Grade
    • Photographic Grade
    • Others

    Russia Silver Nitrate, By Application (USD Billion,Tons,2019-2035)

    • Photography & Jewellery
    • Medicine & Healthcare
    • Glass Coating
    • Textile
    • Others

    Spain Outlook (USD Billion,Tons,2019-2035)


    Spain Silver Nitrate, By Grade Type (USD Billion,Tons,2019-2035)

    • Analytical Reagent Grade (ARG)
    • Active Pharmaceutical Ingredient (API) Grade
    • Photographic Grade
    • Others

    Spain Silver Nitrate, By Application (USD Billion,Tons,2019-2035)

    • Photography & Jewellery
    • Medicine & Healthcare
    • Glass Coating
    • Textile
    • Others


    Rest of Europe Outlook (USD Billion,Tons,2019-2035)


    Rest of Europe Silver Nitrate, By Grade Type (USD Billion,Tons,2019-2035)

    • Analytical Reagent Grade (ARG)
    • Active Pharmaceutical Ingredient (API) Grade
    • Photographic Grade
    • Others

    Rest of Europe Silver Nitrate, By Application (USD Billion,Tons,2019-2035)

    • Photography & Jewellery
    • Medicine & Healthcare
    • Glass Coating
    • Textile
    • Others

    Asia-Pacific Outlook (USD Billion,Tons,2019-2035)


    Asia-Pacific Silver Nitrate, By Grade Type (USD Billion,Tons,2019-2035)

    • Analytical Reagent Grade (ARG)
    • Active Pharmaceutical Ingredient (API) Grade
    • Photographic Grade
    • Others

    Asia-Pacific Silver Nitrate, By Application (USD Billion,Tons,2019-2035)

    • Photography & Jewellery
    • Medicine & Healthcare
    • Glass Coating
    • Textile
    • Others

    China Outlook (USD Billion,Tons,2019-2035)


    China Silver Nitrate, By Grade Type (USD Billion,Tons,2019-2035)

    • Analytical Reagent Grade (ARG)
    • Active Pharmaceutical Ingredient (API) Grade
    • Photographic Grade
    • Others

    China Silver Nitrate, By Application (USD Billion,Tons,2019-2035)

    • Photography & Jewellery
    • Medicine & Healthcare
    • Glass Coating
    • Textile
    • Others

    India Outlook (USD Billion,Tons,2019-2035)


    India Silver Nitrate, By Grade Type (USD Billion,Tons,2019-2035)

    • Analytical Reagent Grade (ARG)
    • Active Pharmaceutical Ingredient (API) Grade
    • Photographic Grade
    • Others

    India Silver Nitrate, By Application (USD Billion,Tons,2019-2035)

    • Photography & Jewellery
    • Medicine & Healthcare
    • Glass Coating
    • Textile
    • Others

    Japan Outlook (USD Billion,Tons,2019-2035)


    Japan Silver Nitrate, By Grade Type (USD Billion,Tons,2019-2035)

    • Analytical Reagent Grade (ARG)
    • Active Pharmaceutical Ingredient (API) Grade
    • Photographic Grade
    • Others

    Japan Silver Nitrate, By Application (USD Billion,Tons,2019-2035)

    • Photography & Jewellery
    • Medicine & Healthcare
    • Glass Coating
    • Textile
    • Others

    South Korea Outlook (USD Billion,Tons,2019-2035)


    South Korea Silver Nitrate, By Grade Type (USD Billion,Tons,2019-2035)

    • Analytical Reagent Grade (ARG)
    • Active Pharmaceutical Ingredient (API) Grade
    • Photographic Grade
    • Others

    South Korea Silver Nitrate, By Application (USD Billion,Tons,2019-2035)

    • Photography & Jewellery
    • Medicine & Healthcare
    • Glass Coating
    • Textile
    • Others

    Malaysia Outlook (USD Billion,Tons,2019-2035)

    Malaysia Silver Nitrate, By Grade Type (USD Billion,Tons,2019-2035)

    • Analytical Reagent Grade (ARG)
    • Active Pharmaceutical Ingredient (API) Grade
    • Photographic Grade
    • Others

    Malaysia Silver Nitrate, By Application (USD Billion,Tons,2019-2035)

    • Photography & Jewellery
    • Medicine & Healthcare
    • Glass Coating
    • Textile
    • Others

    Thailand Outlook (USD Billion,Tons,2019-2035)


    Thailand Silver Nitrate, By Grade Type (USD Billion,Tons,2019-2035)

    • Analytical Reagent Grade (ARG)
    • Active Pharmaceutical Ingredient (API) Grade
    • Photographic Grade
    • Others

    Thailand Silver Nitrate, By Application (USD Billion,Tons,2019-2035)

    • Photography & Jewellery
    • Medicine & Healthcare
    • Glass Coating
    • Textile
    • Others

    Indonesia Outlook (USD Billion,Tons,2019-2035)


    Indonesia Silver Nitrate, By Grade Type (USD Billion,Tons,2019-2035)

    • Analytical Reagent Grade (ARG)
    • Active Pharmaceutical Ingredient (API) Grade
    • Photographic Grade
    • Others

    Indonesia Silver Nitrate, By Application (USD Billion,Tons,2019-2035)

    • Photography & Jewellery
    • Medicine & Healthcare
    • Glass Coating
    • Textile
    • Others

    Rest of Asia-Pacific Outlook (USD Billion,Tons,2019-2035)


    Rest of Asia-Pacific Silver Nitrate, By Grade Type (USD Billion,Tons,2019-2035)

    • Analytical Reagent Grade (ARG)
    • Active Pharmaceutical Ingredient (API) Grade
    • Photographic Grade
    • Others

    Rest of Asia-Pacific Silver Nitrate, By Application (USD Billion,Tons,2019-2035)

    • Photography & Jewellery
    • Medicine & Healthcare
    • Glass Coating
    • Textile
    • Others

    Middle East & Africa Outlook (USD Billion,Tons,2019-2035)


    Middle East & Africa Silver Nitrate, By Grade Type (USD Billion,Tons,2019-2035)

    • Analytical Reagent Grade (ARG)
    • Active Pharmaceutical Ingredient (API) Grade
    • Photographic Grade
    • Others

    Middle East & Africa Silver Nitrate, By Application (USD Billion,Tons,2019-2035)

    • Photography & Jewellery
    • Medicine & Healthcare
    • Glass Coating
    • Textile
    • Others

    GCC Countries Outlook (USD Billion,Tons,2019-2035)

    GCC Countries Silver Nitrate, By Grade Type (USD Billion,Tons,2019-2035)

    • Analytical Reagent Grade (ARG)
    • Active Pharmaceutical Ingredient (API) Grade
    • Photographic Grade
    • Others

    GCC Countries Silver Nitrate, By Application (USD Billion,Tons,2019-2035)

    • Photography & Jewellery
    • Medicine & Healthcare
    • Glass Coating
    • Textile
    • Others

    South Africa Outlook (USD Billion,Tons,2019-2035)


    South Africa Silver Nitrate, By Grade Type (USD Billion,Tons,2019-2035)

    • Analytical Reagent Grade (ARG)
    • Active Pharmaceutical Ingredient (API) Grade
    • Photographic Grade
    • Others

    South Africa Silver Nitrate, By Application (USD Billion,Tons,2019-2035)

    • Photography & Jewellery
    • Medicine & Healthcare
    • Glass Coating
    • Textile
    • Others

    Rest of Middle East & Africa Outlook (USD Billion,Tons,2019-2035)


    Rest of Middle East & Africa Silver Nitrate, By Grade Type (USD Billion,Tons,2019-2035)

    • Analytical Reagent Grade (ARG)
    • Active Pharmaceutical Ingredient (API) Grade
    • Photographic Grade
    • Others

    Rest of Middle East & Africa Silver Nitrate, By Application (USD Billion,Tons,2019-2035)

    • Photography & Jewellery
    • Medicine & Healthcare
    • Glass Coating
    • Textile
    • Others

    South America Outlook (USD Billion,Tons,2019-2035)


    South America Silver Nitrate, By Grade Type (USD Billion,Tons,2019-2035)

    • Analytical Reagent Grade (ARG)
    • Active Pharmaceutical Ingredient (API) Grade
    • Photographic Grade
    • Others

    South America Silver Nitrate, By Application (USD Billion,Tons,2019-2035)

    • Photography & Jewellery
    • Medicine & Healthcare
    • Glass Coating
    • Textile
    • Others

    Argentina Outlook (USD Billion,Tons,2019-2035)


    Argentina Silver Nitrate, By Grade Type (USD Billion,Tons,2019-2035)

    • Analytical Reagent Grade (ARG)
    • Active Pharmaceutical Ingredient (API) Grade
    • Photographic Grade
    • Others

    Argentina Silver Nitrate, By Application (USD Billion,Tons,2019-2035)

    • Photography & Jewellery
    • Medicine & Healthcare
    • Glass Coating
    • Textile
    • Others

    Brazil Outlook (USD Billion,Tons,2019-2035)


    Brazil Silver Nitrate, By Grade Type (USD Billion,Tons,2019-2035)

    • Analytical Reagent Grade (ARG)
    • Active Pharmaceutical Ingredient (API) Grade
    • Photographic Grade
    • Others

    Brazil Silver Nitrate, By Application (USD Billion,Tons,2019-2035)

    • Photography & Jewellery
    • Medicine & Healthcare
    • Glass Coating
    • Textile
    • Others


    Rest of South America Outlook (USD Billion,Tons,2019-2035)


    Rest of South America Silver Nitrate, By Grade Type (USD Billion,Tons,2019-2035)

    • Analytical Reagent Grade (ARG)
    • Active Pharmaceutical Ingredient (API) Grade
    • Photographic Grade
    • Others

    Rest of South America Silver Nitrate, By Application (USD Billion,Tons,2019-2035)

    • Photography & Jewellery
    • Medicine & Healthcare
    • Glass Coating
    • Textile
    • Others
    Infographic

    Free Sample Request

    Kindly complete the form below to receive a free sample of this Report

    Get Free Sample

    Customer Strories

    “I am very pleased with how market segments have been defined in a relevant way for my purposes (such as "Portable Freezers & refrigerators" and "last-mile"). In general the report is well structured. Thanks very much for your efforts.”

    Victoria Milne

    Founder
    Case Study
    Chemicals and Materials