• Cat-intel
  • MedIntelliX
  • Resources
  • About Us
  • Request Free Sample ×

    Kindly complete the form below to receive a free sample of this Report

    Leading companies partner with us for data-driven Insights

    clients tt-cursor

    Semantic Knowledge Graphing Market

    ID: MRFR/ICT/31134-HCR
    100 Pages
    Aarti Dhapte
    September 2025

    Semantic Knowledge Graphing Market Research Report By Application (Data Integration, Artificial Intelligence, Business Intelligence, Search and Navigation), By Deployment Type (On-Premises, Cloud-Based), By End Use (Healthcare, Finance, Retail, Telecommunications), By Technology (Natural Language Processing, Machine Learning, Graph Databases) and By Regional (North America, Europe, South America, Asia Pacific, Middle East and Africa) - Forecast to 2034.

    Share:
    Download PDF ×

    We do not share your information with anyone. However, we may send you emails based on your report interest from time to time. You may contact us at any time to opt-out.

    Semantic Knowledge Graphing Market Research Report - Global Forecast till 2034 Infographic
    Purchase Options
    $ 4,950.0
    $ 5,950.0
    $ 7,250.0
    Table of Contents

    Semantic Knowledge Graphing Market Summary

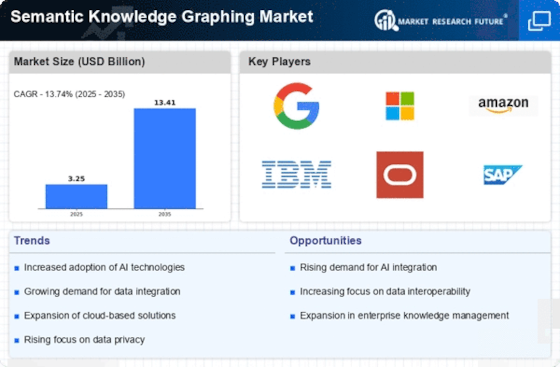
    The Global Semantic Knowledge Graphing Market is projected to experience substantial growth from 2.85 USD Billion in 2024 to 13.4 USD Billion by 2035.

    Key Market Trends & Highlights

    Semantic Knowledge Graphing Key Trends and Highlights

    • The market is expected to grow at a compound annual growth rate (CAGR) of 15.11% from 2025 to 2035.
    • By 2035, the market valuation is anticipated to reach 13.4 USD Billion, indicating a robust expansion.
    • In 2024, the market is valued at 2.85 USD Billion, reflecting the increasing interest in semantic technologies.
    • Growing adoption of semantic knowledge graphing due to the need for enhanced data integration is a major market driver.

    Market Size & Forecast

    2024 Market Size 2.85 (USD Billion)
    2035 Market Size 13.4 (USD Billion)
    CAGR (2025-2035) 15.11%

    Major Players

    Microsoft, Oracle, IBM, TigerGraph, Neo4j, Stardog, C3.ai, Ontotext, Google, Salesforce, Franz Inc., RDF Solutions, SAP, GraphDB, Amazon

    Semantic Knowledge Graphing Market Trends

    The Global Semantic Knowledge Graphing Market is witnessing significant growth due to various key market drivers. The increasing need for organizations to manage vast amounts of data effectively and extract valuable insights is pushing the demand for semantic knowledge graphs. These graphs enable better data integration, improve decision-making processes, and enhance personalization in services, thereby driving adoption across different sectors. Additionally, the rise of artificial intelligence and machine learning technologies is further boosting the market, as semantic knowledge graphs provide the structured data necessary for training these intelligent systems.

    There are numerous opportunities to be explored within this market. Businesses that invest in developing innovative solutions for semantic knowledge graphing can tap into emerging applications like natural language processing, which require robust data structures. As more industries begin to recognize the value of semantic technologies, companies can leverage partnerships and collaborations to expand their offerings and partially enter new markets. Moreover, there is potential for growth in sectors such as healthcare, finance, and retail, where the need for advanced data analysis is becoming increasingly critical.

    In recent times, trends in the Global Semantic Knowledge Graphing Market indicate a shift towards more user-friendly and automated solutions.

    Organizations are looking for ways to implement semantic knowledge graphing without extensive technical expertise, leading to the development of intuitive platforms. The emphasis on real-time data processing and analytics is becoming prominent, allowing organizations to ensure that their insights are not only accurate but also timely. As these trends continue to evolve, businesses will likely continue to seek solutions that improve operational efficiency and enhance customer experiences through advanced data management strategies.

    The increasing complexity of data ecosystems necessitates the adoption of semantic knowledge graphing technologies, which enhance data interoperability and facilitate more informed decision-making across various sectors.

    U.S. Department of Commerce

    Semantic Knowledge Graphing Market Drivers

    Market Growth Projections

    The Global Semantic Knowledge Graphing Market Industry is poised for substantial growth, with projections indicating a rise from 2.85 USD Billion in 2024 to 13.4 USD Billion by 2035. This growth trajectory suggests a compound annual growth rate (CAGR) of 15.11% from 2025 to 2035. Such figures highlight the increasing importance of semantic knowledge graphs in various sectors, as organizations seek to harness the power of data for strategic advantage. The market's expansion reflects a broader trend towards data-driven decision-making and the integration of advanced technologies.

    Increased Focus on Data Governance

    The Global Semantic Knowledge Graphing Market Industry is witnessing an increased focus on data governance as organizations strive to ensure data quality and compliance. With the proliferation of data regulations, companies are compelled to adopt robust governance frameworks that facilitate better data management. Semantic knowledge graphs play a crucial role in this context, as they provide a structured approach to data organization and retrieval. By implementing these frameworks, organizations can enhance their data governance strategies, ultimately leading to improved trust and transparency in data usage.

    Rising Demand for Data Integration

    The Global Semantic Knowledge Graphing Market Industry experiences a surge in demand for data integration solutions. Organizations increasingly recognize the necessity of unifying disparate data sources to derive actionable insights. This trend is particularly evident in sectors such as healthcare and finance, where the ability to connect and analyze vast amounts of data can lead to improved decision-making and operational efficiency. The market is projected to reach 2.85 USD Billion in 2024, reflecting a growing investment in technologies that facilitate seamless data integration and knowledge representation.

    Advancements in Artificial Intelligence

    Advancements in artificial intelligence are propelling the Global Semantic Knowledge Graphing Market Industry forward. AI technologies enhance the capabilities of semantic knowledge graphs by enabling more sophisticated data analysis and natural language processing. These advancements allow organizations to extract deeper insights from their data, thereby improving customer experiences and operational efficiencies. As AI continues to evolve, the market is expected to grow significantly, with projections indicating a value of 13.4 USD Billion by 2035. This growth underscores the potential of AI-driven semantic knowledge graphs in transforming data utilization across various industries.

    Growing Adoption of Cloud-Based Solutions

    The growing adoption of cloud-based solutions is a significant driver for the Global Semantic Knowledge Graphing Market Industry. As businesses migrate to cloud environments, the need for scalable and flexible data management solutions becomes paramount. Semantic knowledge graphs, which can be easily integrated into cloud platforms, offer organizations the ability to manage and analyze data efficiently. This trend is likely to accelerate market growth, as cloud adoption continues to rise, providing organizations with the tools necessary to leverage their data assets effectively.

    Emergence of Knowledge-Driven Applications

    The emergence of knowledge-driven applications is reshaping the Global Semantic Knowledge Graphing Market Industry. These applications leverage semantic knowledge graphs to provide enhanced functionalities, such as personalized recommendations and intelligent search capabilities. Industries like e-commerce and education are increasingly adopting these applications to improve user engagement and satisfaction. As the demand for knowledge-driven solutions grows, the market is expected to expand, with a projected CAGR of 15.11% from 2025 to 2035, indicating a robust future for semantic knowledge graph technologies.

    Market Segment Insights

    Get more detailed insights about Semantic Knowledge Graphing Market Research Report - Global Forecast till 2034

    Regional Insights

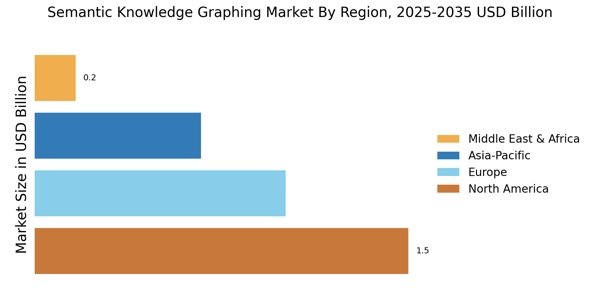
    The Global Semantic Knowledge Graphing Market is experiencing steady growth across various regions, with a total market valuation of 2.51 USD Billion in 2023, set to reach 8.0 USD Billion by 2032. North America currently leads this growth with a significant market value of 0.751 USD Billion in 2023 and is expected to reach 2.393 USD Billion by 2032, indicating its majority holding in the overall market. Europe follows closely with a valuation of 0.572 USD Billion in 2023, expanding to 1.869 USD Billion by 2032, showcasing its significant contribution to the industry.

    The Asia-Pacific (APAC) region, while currently valued at 0.465 USD Billion, exhibits robust potential for growth, reaching 1.495 USD Billion in 2032, driven by rapid technological advancements and increased adoption of semantic technologies. South America shows a growing interest in this market, starting with a valuation of 0.25 USD Billion and anticipated to reach 0.822 USD Billion by 2032, indicating a burgeoning market. The Middle East and Africa (MEA) segment, valued at 0.472 USD Billion in 2023, is projected to grow to 1.421 USD Billion, reflecting emerging opportunities within this region.

    Overall, the Global Semantic Knowledge Graphing Market data indicates a balanced growth across regions, driven by technological innovation and increasing demand for semantic data applications.

    Figure3: Semantic Knowledge Graphing Market, By Regional, 2023 & 2032 Semantic Knowledge Graphing Market Regional Insights

    Source: Primary Research, Secondary Research, Market Research Future Database and Analyst Review

    Key Players and Competitive Insights

    The Global Semantic Knowledge Graphing Market is characterized by rapid growth and innovation, driven by the increasing need for advanced data management and integration solutions. Organizations are recognizing the value of semantic knowledge graphs for enhancing data connectivity, improving information retrieval, and facilitating more meaningful insights from disparate data sources. As the market evolves, it is becoming increasingly competitive, with key players seeking to leverage their technological capabilities and customer relationships to gain a foothold.

    Companies in this field face the challenge of not only developing effective semantic technologies but also ensuring scalability, usability, and adaptability to meet the complex demands of various industries. The integration of artificial intelligence and machine learning within semantic knowledge graphs continues to shape the competitive landscape, enabling businesses to extract deeper insights and foster innovation.

    Microsoft has established a significant presence in the Global Semantic Knowledge Graphing Market, capitalizing on its extensive cloud framework and robust data management tools. The company’s integration of semantic graph capabilities into its Azure platform allows clients to build, manage, and utilize knowledge graphs that are seamlessly connected to other Microsoft services. This integration provides clients with the ability to generate insights from large data sets efficiently and to make data-driven decisions. The flexibility and scalability of Microsoft’s offerings are notable strengths, as they cater to various sectors, enhancing businesses' ability to develop customized solutions that meet specific needs.

    The strong brand recognition and established customer relationships further amplify Microsoft's position in this competitive landscape, making it a formidable player in the market.

    Oracle maintains a prominent position in the Global Semantic Knowledge Graphing Market with its suite of intelligent cloud applications and data management solutions. The company emphasizes the integration of semantic knowledge graphs within its ecosystems to facilitate better data governance, enhance information retrieval, and contribute to effective decision-making processes. Oracle's unique advantage lies in its ability to combine traditional database capabilities with cutting-edge semantic technologies, allowing clients to derive meaningful insights from complex data relationships.

    The organization has invested in developing advanced tools that enable businesses to create and maintain knowledge graphs efficiently, thereby solidifying its reputation for delivering reliable and robust analytics services. Oracle's commitment to innovation and customer satisfaction propels its competitive edge, reinforcing its role as a leader in the semantic knowledge graphing domain.

    Key Companies in the Semantic Knowledge Graphing Market market include

    Industry Developments

    Recent developments in the Global Semantic Knowledge Graphing Market have been largely driven by advancements in artificial intelligence and data management technologies. Companies like Microsoft, Oracle, and IBM are investing heavily in enhancing their semantic knowledge graph capabilities to improve data interoperability and analytics. TigerGraph recently secured funding to boost its cloud-native graph database offerings, aligning with the growing demand for real-time data processing. Neo4j is also expanding its presence through partnerships aimed at integrating more machine-learning functionalities into its graph solutions.

    In terms of mergers and acquisitions, Oracle made headlines by acquiring a leading data integration firm, which is expected to enhance its semantic capabilities significantly.

    Furthermore, Salesforce has been actively looking to augment its AI-driven analytics by exploring strategic acquisitions within the knowledge graph space. The market valuation of key players like Google and Amazon is witnessing a notable rise as they continue to expand their semantic tools for better user-driven insights. Such growth is indicative of the increasing relevance of technology in driving informed business decisions across various industries.

    Future Outlook

    Semantic Knowledge Graphing Market Future Outlook

    The Semantic Knowledge Graphing Market is projected to grow at a 15.11% CAGR from 2024 to 2035, driven by advancements in AI, data integration, and demand for enhanced analytics.

    New opportunities lie in:

    • Develop industry-specific knowledge graphs to enhance data relevance and user engagement.
    • Leverage AI-driven insights for real-time decision-making in enterprise applications.
    • Create partnerships with cloud service providers to expand accessibility and scalability of knowledge graph solutions.

    By 2035, the Semantic Knowledge Graphing Market is expected to be a cornerstone of data-driven strategies globally.

    Market Segmentation

    Semantic Knowledge Graphing Market End Use Outlook

    • Natural Language Processing
    • Machine Learning
    • Graph Databases

    Semantic Knowledge Graphing Market Regional Outlook

    • North America
    • Europe
    • South America
    • Asia Pacific
    • Middle East and Africa

    Semantic Knowledge Graphing Market Technology Outlook

    • North America
    • Europe
    • South America
    • Asia Pacific
    • Middle East and Africa

    Semantic Knowledge Graphing Market Application Outlook

    • On-Premises
    • Cloud-Based

    Semantic Knowledge Graphing Market Deployment Type Outlook

    • Healthcare
    • Finance
    • Retail
    • Telecommunications

    Report Scope

    Report Attribute/Metric Details
    Market Size 2024 3.25 (USD Billion)
    Market Size 2025 3.69 (USD Billion)
    Market Size 2034 11.78 (USD Billion)
    Compound Annual Growth Rate (CAGR) 13.74% (2025 - 2034)
    Report Coverage Revenue Forecast, Competitive Landscape, Growth Factors, and Trends
    Base Year 2024
    Market Forecast Period 2025 - 2034
    Historical Data 2019 - 2023
    Market Forecast Units USD Billion
    Key Companies Profiled Microsoft, Oracle, IBM, TigerGraph, Neo4j, Stardog, C3.ai, Ontotext, Google, Salesforce, Franz Inc., RDF Solutions, SAP, GraphDB, Amazon
    Segments Covered Application, Deployment Type, End Use, Technology, Regional
    Key Market Opportunities Increased demand for data integration, Growth in AI and ML applications, Rising need for enhanced data analytics, Expansion of cloud-based solutions, Emergence of knowledge-driven applications
    Key Market Dynamics Rising demand for data integration, Increased adoption of AI technologies, Growing need for enhanced analytics, Expansion of cloud-based solutions, Surge in connected devices and IoT
    Countries Covered North America, Europe, APAC, South America, MEA

    Market Highlights

    Author
    Aarti Dhapte
    Team Lead - Research

    She holds an experience of about 6+ years in Market Research and Business Consulting, working under the spectrum of Information Communication Technology, Telecommunications and Semiconductor domains. Aarti conceptualizes and implements a scalable business strategy and provides strategic leadership to the clients. Her expertise lies in market estimation, competitive intelligence, pipeline analysis, customer assessment, etc.

    Leave a Comment

    FAQs

    What is the expected market size of the Global Semantic Knowledge Graphing Market by 2034?

    By 2034, the Global Semantic Knowledge Graphing Market is expected to be valued at 11.78 billion USD.

    What was the market size of the Global Semantic Knowledge Graphing Market in 2023?

    In 2023, the market size was valued at 2.85 billion USD.

    What is the expected Compound Annual Growth Rate (CAGR) of the Global Semantic Knowledge Graphing Market from 2025 to 2034?

    The expected CAGR for the Global Semantic Knowledge Graphing Market from 2025 to 2034 is 13.74%.

    Which region is projected to have the largest market value by 2032?

    North America is projected to have the largest market value, reaching approximately 2.393 billion USD by 2032.

    What is the market size for the Data Integration application segment in 2032?

    The Data Integration segment is expected to reach a market value of 3.0 billion USD by 2032.

    Who are the major players in the Global Semantic Knowledge Graphing Market?

    Major players in the market include Microsoft, Oracle, IBM, TigerGraph, and Neo4j.

    What is the expected market size for Artificial Intelligence applications in 2032?

    The market size for Artificial Intelligence applications is expected to reach 2.5 billion USD by 2032.

    How much is the Global Semantic Knowledge Graphing Market expected to grow in the MEA region by 2032?

    In the MEA region, the market is expected to grow to 1.421 billion USD by 2032.

    What challenges does the Global Semantic Knowledge Graphing Market currently face?

    Challenges include evolving technology trends and the need for efficient data management solutions.

    What is the expected market size for Business Intelligence applications in 2032?

    The Business Intelligence application segment is projected to reach a market size of 2.1 billion USD by 2032.

    1. 'Table of Contents
    2. EXECUTIVE SUMMARY
    3. Market Overview
      1. Key Findings
      2. Market Segmentation
    4. Competitive Landscape
      1. Challenges and Opportunities
      2. Future Outlook
    5. MARKET INTRODUCTION
      1. Definition
      2. Scope of the study
        1. Research Objective
        2. Assumption
        3. Limitations
    6. RESEARCH METHODOLOGY
      1. Overview
    7. Data Mining
      1. Secondary Research
      2. Primary Research
    8. Primary Interviews and Information Gathering Process
      1. Breakdown of Primary
    9. Respondents
      1. Forecasting Model
      2. Market Size Estimation
    10. Bottom-Up Approach
      1. Top-Down Approach
      2. Data Triangulation
      3. Validation
    11. MARKET DYNAMICS
      1. Overview
      2. Drivers
      3. Restraints
      4. Opportunities
    12. MARKET FACTOR ANALYSIS
      1. Value chain Analysis
      2. Porter''s Five Forces
    13. Analysis
      1. Bargaining Power of Suppliers
        1. Bargaining Power
    14. of Buyers
      1. Threat of New Entrants
        1. Threat of Substitutes
        2. Intensity of Rivalry
      2. COVID-19 Impact Analysis
    15. Market Impact Analysis
      1. Regional Impact
        1. Opportunity and
    16. Threat Analysis
    17. Semantic Knowledge Graphing Market, BY
    18. Application (USD Billion)
      1. Data Integration
      2. Artificial Intelligence
      3. Business Intelligence
      4. Search and Navigation
    19. Semantic
    20. Knowledge Graphing Market, BY Deployment Type (USD Billion)
      1. On-Premises
      2. Cloud-Based
    21. Semantic Knowledge Graphing Market, BY End Use (USD
    22. Billion)
      1. Healthcare
      2. Finance
      3. Retail
      4. Telecommunications
    23. Semantic Knowledge Graphing Market, BY Technology (USD Billion)
    24. Natural Language Processing
      1. Machine Learning
      2. Graph Databases
    25. Semantic Knowledge Graphing Market, BY Regional (USD Billion)
    26. North America
      1. US
        1. Canada
      2. Europe
    27. Germany
      1. UK
        1. France
        2. Russia
    28. Italy
      1. Spain
        1. Rest of Europe
      2. APAC
    29. China
      1. India
        1. Japan
        2. South Korea
    30. Malaysia
      1. Thailand
        1. Indonesia
        2. Rest of APAC
      2. South America
        1. Brazil
        2. Mexico
    31. Argentina
      1. Rest of South America
      2. MEA
        1. GCC
    32. Countries
      1. South Africa
        1. Rest of MEA
    33. Competitive Landscape
      1. Overview
      2. Competitive Analysis
      3. Market share Analysis
      4. Major Growth Strategy in the Semantic
    34. Knowledge Graphing Market
      1. Competitive Benchmarking
      2. Leading
    35. Players in Terms of Number of Developments in the Semantic Knowledge Graphing Market
      1. Key developments and growth strategies
        1. New Product Launch/Service
    36. Deployment
      1. Merger & Acquisitions
        1. Joint Ventures
      2. Major Players Financial Matrix
        1. Sales and Operating Income
        2. Major Players R&D Expenditure. 2023
    37. Company Profiles
      1. Microsoft
        1. Financial Overview
        2. Products Offered
        3. Key Developments
        4. SWOT Analysis
        5. Key Strategies
      2. Oracle
        1. Financial Overview
        2. Products Offered
        3. Key Developments
        4. SWOT Analysis
        5. Key Strategies
      3. IBM
        1. Financial Overview
        2. Products Offered
        3. Key Developments
        4. SWOT Analysis
        5. Key Strategies
      4. TigerGraph
        1. Financial Overview
        2. Products Offered
        3. Key Developments
        4. SWOT Analysis
        5. Key Strategies
      5. Neo4j
        1. Financial Overview
        2. Products Offered
        3. Key Developments
        4. SWOT Analysis
        5. Key Strategies
      6. Stardog
        1. Financial Overview
        2. Products Offered
        3. Key Developments
        4. SWOT Analysis
        5. Key Strategies
      7. C3.ai
        1. Financial Overview
        2. Products Offered
        3. Key Developments
        4. SWOT Analysis
        5. Key Strategies
      8. Ontotext
        1. Financial Overview
        2. Products Offered
        3. Key Developments
        4. SWOT Analysis
        5. Key Strategies
      9. Google
        1. Financial Overview
        2. Products Offered
        3. Key Developments
        4. SWOT Analysis
        5. Key Strategies
      10. Salesforce
        1. Financial Overview
        2. Products
    38. Offered
      1. Key Developments
        1. SWOT Analysis
    39. Key Strategies
      1. Franz Inc.
        1. Financial Overview
    40. Products Offered
      1. Key Developments
        1. SWOT Analysis
        2. Key Strategies
      2. RDF Solutions
        1. Financial Overview
        2. Products Offered
        3. Key Developments
        4. SWOT
    41. Analysis
      1. Key Strategies
      2. SAP
        1. Financial
    42. Overview
      1. Products Offered
        1. Key Developments
    43. SWOT Analysis
      1. Key Strategies
      2. GraphDB
    44. Financial Overview
      1. Products Offered
        1. Key Developments
        2. SWOT Analysis
        3. Key Strategies
      2. Amazon
        1. Financial Overview
        2. Products Offered
        3. Key
    45. Developments
      1. SWOT Analysis
        1. Key Strategies
      2. References
      3. Related Reports
    46. Graphing Market SIZE ESTIMATES & FORECAST, BY APPLICATION, 2019-2032 (USD Billions)
    47. FORECAST, BY DEPLOYMENT TYPE, 2019-2032 (USD Billions)
    48. Semantic Knowledge Graphing Market SIZE ESTIMATES & FORECAST, BY END USE, 2019-2032
    49. (USD Billions)
    50. ESTIMATES & FORECAST, BY TECHNOLOGY, 2019-2032 (USD Billions)
    51. North America Semantic Knowledge Graphing Market SIZE ESTIMATES & FORECAST,
    52. BY REGIONAL, 2019-2032 (USD Billions)
    53. Market SIZE ESTIMATES & FORECAST, BY APPLICATION, 2019-2032 (USD Billions)
    54. BY DEPLOYMENT TYPE, 2019-2032 (USD Billions)
    55. Graphing Market SIZE ESTIMATES & FORECAST, BY END USE, 2019-2032 (USD Billions)
    56. BY TECHNOLOGY, 2019-2032 (USD Billions)
    57. Market SIZE ESTIMATES & FORECAST, BY REGIONAL, 2019-2032 (USD Billions)
    58. BY APPLICATION, 2019-2032 (USD Billions)
    59. Graphing Market SIZE ESTIMATES & FORECAST, BY DEPLOYMENT TYPE, 2019-2032 (USD
    60. Billions)
    61. & FORECAST, BY END USE, 2019-2032 (USD Billions)
    62. Knowledge Graphing Market SIZE ESTIMATES & FORECAST, BY TECHNOLOGY, 2019-2032
    63. (USD Billions)
    64. & FORECAST, BY REGIONAL, 2019-2032 (USD Billions)
    65. Knowledge Graphing Market SIZE ESTIMATES & FORECAST, BY APPLICATION, 2019-2032
    66. (USD Billions)
    67. & FORECAST, BY DEPLOYMENT TYPE, 2019-2032 (USD Billions)
    68. Semantic Knowledge Graphing Market SIZE ESTIMATES & FORECAST, BY END USE, 2019-2032
    69. (USD Billions)
    70. & FORECAST, BY TECHNOLOGY, 2019-2032 (USD Billions)
    71. Knowledge Graphing Market SIZE ESTIMATES & FORECAST, BY REGIONAL, 2019-2032
    72. (USD Billions)
    73. & FORECAST, BY APPLICATION, 2019-2032 (USD Billions)
    74. Semantic Knowledge Graphing Market SIZE ESTIMATES & FORECAST, BY DEPLOYMENT
    75. TYPE, 2019-2032 (USD Billions)
    76. Market SIZE ESTIMATES & FORECAST, BY END USE, 2019-2032 (USD Billions)
    77. Germany Semantic Knowledge Graphing Market SIZE ESTIMATES & FORECAST, BY
    78. TECHNOLOGY, 2019-2032 (USD Billions)
    79. Graphing Market SIZE ESTIMATES & FORECAST, BY REGIONAL, 2019-2032 (USD Billions)
    80. BY APPLICATION, 2019-2032 (USD Billions)
    81. Market SIZE ESTIMATES & FORECAST, BY DEPLOYMENT TYPE, 2019-2032 (USD Billions)
    82. BY END USE, 2019-2032 (USD Billions)
    83. Market SIZE ESTIMATES & FORECAST, BY TECHNOLOGY, 2019-2032 (USD Billions)
    84. BY REGIONAL, 2019-2032 (USD Billions)
    85. Graphing Market SIZE ESTIMATES & FORECAST, BY APPLICATION, 2019-2032 (USD Billions)
    86. BY DEPLOYMENT TYPE, 2019-2032 (USD Billions)
    87. Graphing Market SIZE ESTIMATES & FORECAST, BY END USE, 2019-2032 (USD Billions)
    88. BY TECHNOLOGY, 2019-2032 (USD Billions)
    89. Graphing Market SIZE ESTIMATES & FORECAST, BY REGIONAL, 2019-2032 (USD Billions)
    90. BY APPLICATION, 2019-2032 (USD Billions)
    91. Graphing Market SIZE ESTIMATES & FORECAST, BY DEPLOYMENT TYPE, 2019-2032 (USD
    92. Billions)
    93. & FORECAST, BY END USE, 2019-2032 (USD Billions)
    94. Knowledge Graphing Market SIZE ESTIMATES & FORECAST, BY TECHNOLOGY, 2019-2032
    95. (USD Billions)
    96. & FORECAST, BY REGIONAL, 2019-2032 (USD Billions)
    97. Knowledge Graphing Market SIZE ESTIMATES & FORECAST, BY APPLICATION, 2019-2032
    98. (USD Billions)
    99. & FORECAST, BY DEPLOYMENT TYPE, 2019-2032 (USD Billions)
    100. Semantic Knowledge Graphing Market SIZE ESTIMATES & FORECAST, BY END USE, 2019-2032
    101. (USD Billions)
    102. & FORECAST, BY TECHNOLOGY, 2019-2032 (USD Billions)
    103. Knowledge Graphing Market SIZE ESTIMATES & FORECAST, BY REGIONAL, 2019-2032
    104. (USD Billions)
    105. & FORECAST, BY APPLICATION, 2019-2032 (USD Billions)
    106. Knowledge Graphing Market SIZE ESTIMATES & FORECAST, BY DEPLOYMENT TYPE, 2019-2032
    107. (USD Billions)
    108. & FORECAST, BY END USE, 2019-2032 (USD Billions)
    109. Knowledge Graphing Market SIZE ESTIMATES & FORECAST, BY TECHNOLOGY, 2019-2032
    110. (USD Billions)
    111. & FORECAST, BY REGIONAL, 2019-2032 (USD Billions)
    112. Semantic Knowledge Graphing Market SIZE ESTIMATES & FORECAST, BY APPLICATION,
    113. 2032 (USD Billions)
    114. Market SIZE ESTIMATES & FORECAST, BY DEPLOYMENT TYPE, 2019-2032 (USD Billions)
    115. & FORECAST, BY END USE, 2019-2032 (USD Billions)
    116. Semantic Knowledge Graphing Market SIZE ESTIMATES & FORECAST, BY TECHNOLOGY,
    117. 2032 (USD Billions)
    118. Market SIZE ESTIMATES & FORECAST, BY REGIONAL, 2019-2032 (USD Billions)
    119. BY APPLICATION, 2019-2032 (USD Billions)
    120. Graphing Market SIZE ESTIMATES & FORECAST, BY DEPLOYMENT TYPE, 2019-2032 (USD
    121. Billions)
    122. & FORECAST, BY END USE, 2019-2032 (USD Billions)
    123. Knowledge Graphing Market SIZE ESTIMATES & FORECAST, BY TECHNOLOGY, 2019-2032
    124. (USD Billions)
    125. & FORECAST, BY REGIONAL, 2019-2032 (USD Billions)
    126. Knowledge Graphing Market SIZE ESTIMATES & FORECAST, BY APPLICATION, 2019-2032
    127. (USD Billions)
    128. & FORECAST, BY DEPLOYMENT TYPE, 2019-2032 (USD Billions)
    129. Semantic Knowledge Graphing Market SIZE ESTIMATES & FORECAST, BY END USE, 2019-2032
    130. (USD Billions)
    131. & FORECAST, BY TECHNOLOGY, 2019-2032 (USD Billions)
    132. Knowledge Graphing Market SIZE ESTIMATES & FORECAST, BY REGIONAL, 2019-2032
    133. (USD Billions)
    134. & FORECAST, BY APPLICATION, 2019-2032 (USD Billions)
    135. Knowledge Graphing Market SIZE ESTIMATES & FORECAST, BY DEPLOYMENT TYPE, 2019-2032
    136. (USD Billions)
    137. & FORECAST, BY END USE, 2019-2032 (USD Billions)
    138. Knowledge Graphing Market SIZE ESTIMATES & FORECAST, BY TECHNOLOGY, 2019-2032
    139. (USD Billions)
    140. & FORECAST, BY REGIONAL, 2019-2032 (USD Billions)
    141. Knowledge Graphing Market SIZE ESTIMATES & FORECAST, BY APPLICATION, 2019-2032
    142. (USD Billions)
    143. & FORECAST, BY DEPLOYMENT TYPE, 2019-2032 (USD Billions)
    144. Semantic Knowledge Graphing Market SIZE ESTIMATES & FORECAST, BY END USE, 2019-2032
    145. (USD Billions)
    146. & FORECAST, BY TECHNOLOGY, 2019-2032 (USD Billions)
    147. Knowledge Graphing Market SIZE ESTIMATES & FORECAST, BY REGIONAL, 2019-2032
    148. (USD Billions)
    149. ESTIMATES & FORECAST, BY APPLICATION, 2019-2032 (USD Billions)
    150. South Korea Semantic Knowledge Graphing Market SIZE ESTIMATES & FORECAST, BY
    151. DEPLOYMENT TYPE, 2019-2032 (USD Billions)
    152. Graphing Market SIZE ESTIMATES & FORECAST, BY END USE, 2019-2032 (USD Billions)
    153. FORECAST, BY TECHNOLOGY, 2019-2032 (USD Billions)
    154. Knowledge Graphing Market SIZE ESTIMATES & FORECAST, BY REGIONAL, 2019-2032
    155. (USD Billions)
    156. ESTIMATES & FORECAST, BY APPLICATION, 2019-2032 (USD Billions)
    157. Malaysia Semantic Knowledge Graphing Market SIZE ESTIMATES & FORECAST, BY DEPLOYMENT
    158. TYPE, 2019-2032 (USD Billions)
    159. Market SIZE ESTIMATES & FORECAST, BY END USE, 2019-2032 (USD Billions)
    160. Malaysia Semantic Knowledge Graphing Market SIZE ESTIMATES & FORECAST, BY
    161. TECHNOLOGY, 2019-2032 (USD Billions)
    162. Graphing Market SIZE ESTIMATES & FORECAST, BY REGIONAL, 2019-2032 (USD Billions)
    163. FORECAST, BY APPLICATION, 2019-2032 (USD Billions)
    164. Knowledge Graphing Market SIZE ESTIMATES & FORECAST, BY DEPLOYMENT TYPE, 2019-2032
    165. (USD Billions)
    166. ESTIMATES & FORECAST, BY END USE, 2019-2032 (USD Billions)
    167. Semantic Knowledge Graphing Market SIZE ESTIMATES & FORECAST, BY TECHNOLOGY,
    168. 2032 (USD Billions)
    169. SIZE ESTIMATES & FORECAST, BY REGIONAL, 2019-2032 (USD Billions)
    170. Indonesia Semantic Knowledge Graphing Market SIZE ESTIMATES & FORECAST,
    171. BY APPLICATION, 2019-2032 (USD Billions)
    172. Graphing Market SIZE ESTIMATES & FORECAST, BY DEPLOYMENT TYPE, 2019-2032 (USD
    173. Billions)
    174. & FORECAST, BY END USE, 2019-2032 (USD Billions)
    175. Knowledge Graphing Market SIZE ESTIMATES & FORECAST, BY TECHNOLOGY, 2019-2032
    176. (USD Billions)
    177. ESTIMATES & FORECAST, BY REGIONAL, 2019-2032 (USD Billions)
    178. Rest of APAC Semantic Knowledge Graphing Market SIZE ESTIMATES & FORECAST, BY
    179. APPLICATION, 2019-2032 (USD Billions)
    180. Graphing Market SIZE ESTIMATES & FORECAST, BY DEPLOYMENT TYPE, 2019-2032 (USD
    181. Billions)
    182. & FORECAST, BY END USE, 2019-2032 (USD Billions)
    183. Semantic Knowledge Graphing Market SIZE ESTIMATES & FORECAST, BY TECHNOLOGY,
    184. 2032 (USD Billions)
    185. Market SIZE ESTIMATES & FORECAST, BY REGIONAL, 2019-2032 (USD Billions)
    186. FORECAST, BY APPLICATION, 2019-2032 (USD Billions)
    187. Semantic Knowledge Graphing Market SIZE ESTIMATES & FORECAST, BY DEPLOYMENT
    188. TYPE, 2019-2032 (USD Billions)
    189. Graphing Market SIZE ESTIMATES & FORECAST, BY END USE, 2019-2032 (USD Billions)
    190. & FORECAST, BY TECHNOLOGY, 2019-2032 (USD Billions)
    191. Semantic Knowledge Graphing Market SIZE ESTIMATES & FORECAST, BY REGIONAL, 2019-2032
    192. (USD Billions)
    193. & FORECAST, BY APPLICATION, 2019-2032 (USD Billions)
    194. Semantic Knowledge Graphing Market SIZE ESTIMATES & FORECAST, BY DEPLOYMENT
    195. TYPE, 2019-2032 (USD Billions)
    196. Market SIZE ESTIMATES & FORECAST, BY END USE, 2019-2032 (USD Billions)
    197. Brazil Semantic Knowledge Graphing Market SIZE ESTIMATES & FORECAST, BY
    198. TECHNOLOGY, 2019-2032 (USD Billions)
    199. Graphing Market SIZE ESTIMATES & FORECAST, BY REGIONAL, 2019-2032 (USD Billions)
    200. FORECAST, BY APPLICATION, 2019-2032 (USD Billions)
    201. Knowledge Graphing Market SIZE ESTIMATES & FORECAST, BY DEPLOYMENT TYPE, 2019-2032
    202. (USD Billions)
    203. & FORECAST, BY END USE, 2019-2032 (USD Billions)
    204. Knowledge Graphing Market SIZE ESTIMATES & FORECAST, BY TECHNOLOGY, 2019-2032
    205. (USD Billions)
    206. & FORECAST, BY REGIONAL, 2019-2032 (USD Billions)
    207. Semantic Knowledge Graphing Market SIZE ESTIMATES & FORECAST, BY APPLICATION,
    208. 2032 (USD Billions)
    209. Market SIZE ESTIMATES & FORECAST, BY DEPLOYMENT TYPE, 2019-2032 (USD Billions)
    210. FORECAST, BY END USE, 2019-2032 (USD Billions)
    211. Knowledge Graphing Market SIZE ESTIMATES & FORECAST, BY TECHNOLOGY, 2019-2032
    212. (USD Billions)
    213. ESTIMATES & FORECAST, BY REGIONAL, 2019-2032 (USD Billions)
    214. Rest of South America Semantic Knowledge Graphing Market SIZE ESTIMATES & FORECAST,
    215. BY APPLICATION, 2019-2032 (USD Billions)
    216. Semantic Knowledge Graphing Market SIZE ESTIMATES & FORECAST, BY DEPLOYMENT
    217. TYPE, 2019-2032 (USD Billions)
    218. Graphing Market SIZE ESTIMATES & FORECAST, BY END USE, 2019-2032 (USD Billions)
    219. & FORECAST, BY TECHNOLOGY, 2019-2032 (USD Billions)
    220. South America Semantic Knowledge Graphing Market SIZE ESTIMATES & FORECAST,
    221. BY REGIONAL, 2019-2032 (USD Billions)
    222. Market SIZE ESTIMATES & FORECAST, BY APPLICATION, 2019-2032 (USD Billions)
    223. BY DEPLOYMENT TYPE, 2019-2032 (USD Billions)
    224. Graphing Market SIZE ESTIMATES & FORECAST, BY END USE, 2019-2032 (USD Billions)
    225. BY TECHNOLOGY, 2019-2032 (USD Billions)
    226. Graphing Market SIZE ESTIMATES & FORECAST, BY REGIONAL, 2019-2032 (USD Billions)
    227. & FORECAST, BY APPLICATION, 2019-2032 (USD Billions)
    228. Semantic Knowledge Graphing Market SIZE ESTIMATES & FORECAST, BY DEPLOYMENT
    229. TYPE, 2019-2032 (USD Billions)
    230. Graphing Market SIZE ESTIMATES & FORECAST, BY END USE, 2019-2032 (USD Billions)
    231. & FORECAST, BY TECHNOLOGY, 2019-2032 (USD Billions)
    232. Semantic Knowledge Graphing Market SIZE ESTIMATES & FORECAST, BY REGIONAL, 2019-2032
    233. (USD Billions)
    234. SIZE ESTIMATES & FORECAST, BY APPLICATION, 2019-2032 (USD Billions)
    235. South Africa Semantic Knowledge Graphing Market SIZE ESTIMATES & FORECAST,
    236. BY DEPLOYMENT TYPE, 2019-2032 (USD Billions)
    237. Knowledge Graphing Market SIZE ESTIMATES & FORECAST, BY END USE, 2019-2032 (USD
    238. Billions)
    239. ESTIMATES & FORECAST, BY TECHNOLOGY, 2019-2032 (USD Billions)
    240. South Africa Semantic Knowledge Graphing Market SIZE ESTIMATES & FORECAST, BY
    241. REGIONAL, 2019-2032 (USD Billions)
    242. Graphing Market SIZE ESTIMATES & FORECAST, BY APPLICATION, 2019-2032 (USD Billions)
    243. FORECAST, BY DEPLOYMENT TYPE, 2019-2032 (USD Billions)
    244. MEA Semantic Knowledge Graphing Market SIZE ESTIMATES & FORECAST, BY END USE,
    245. 2032 (USD Billions)
    246. Market SIZE ESTIMATES & FORECAST, BY TECHNOLOGY, 2019-2032 (USD Billions)
    247. FORECAST, BY REGIONAL, 2019-2032 (USD Billions)
    248. DEVELOPMENT/APPROVAL
    249. KNOWLEDGE GRAPHING MARKET ANALYSIS
    250. MARKET ANALYSIS BY APPLICATION
    251. ANALYSIS BY DEPLOYMENT TYPE
    252. ANALYSIS BY END USE
    253. BY TECHNOLOGY
    254. REGIONAL
    255. TYPE
    256. USE
    257. GERMANY SEMANTIC KNOWLEDGE GRAPHING MARKET ANALYSIS BY APPLICATION
    258. GERMANY SEMANTIC KNOWLEDGE GRAPHING MARKET ANALYSIS BY DEPLOYMENT TYPE
    259. GERMANY SEMANTIC KNOWLEDGE GRAPHING MARKET ANALYSIS BY END USE
    260. GERMANY SEMANTIC KNOWLEDGE GRAPHING MARKET ANALYSIS BY TECHNOLOGY
    261. GERMANY SEMANTIC KNOWLEDGE GRAPHING MARKET ANALYSIS BY REGIONAL
    262. UK SEMANTIC KNOWLEDGE GRAPHING MARKET ANALYSIS BY APPLICATION
    263. UK SEMANTIC KNOWLEDGE GRAPHING MARKET ANALYSIS BY DEPLOYMENT TYPE
    264. UK SEMANTIC KNOWLEDGE GRAPHING MARKET ANALYSIS BY END USE
    265. KNOWLEDGE GRAPHING MARKET ANALYSIS BY TECHNOLOGY
    266. GRAPHING MARKET ANALYSIS BY REGIONAL
    267. GRAPHING MARKET ANALYSIS BY APPLICATION
    268. GRAPHING MARKET ANALYSIS BY DEPLOYMENT TYPE
    269. GRAPHING MARKET ANALYSIS BY END USE
    270. MARKET ANALYSIS BY TECHNOLOGY
    271. MARKET ANALYSIS BY REGIONAL
    272. MARKET ANALYSIS BY APPLICATION
    273. MARKET ANALYSIS BY DEPLOYMENT TYPE
    274. MARKET ANALYSIS BY END USE
    275. ANALYSIS BY TECHNOLOGY
    276. ANALYSIS BY REGIONAL
    277. BY APPLICATION
    278. BY DEPLOYMENT TYPE
    279. BY END USE
    280. TECHNOLOGY
    281. REGIONAL
    282. TYPE
    283. TYPE
    284. BY END USE
    285. BY TECHNOLOGY
    286. ANALYSIS BY REGIONAL
    287. TYPE
    288. JAPAN SEMANTIC KNOWLEDGE GRAPHING MARKET ANALYSIS BY APPLICATION
    289. JAPAN SEMANTIC KNOWLEDGE GRAPHING MARKET ANALYSIS BY DEPLOYMENT TYPE
    290. JAPAN SEMANTIC KNOWLEDGE GRAPHING MARKET ANALYSIS BY END USE
    291. JAPAN SEMANTIC KNOWLEDGE GRAPHING MARKET ANALYSIS BY TECHNOLOGY
    292. JAPAN SEMANTIC KNOWLEDGE GRAPHING MARKET ANALYSIS BY REGIONAL
    293. KOREA SEMANTIC KNOWLEDGE GRAPHING MARKET ANALYSIS BY APPLICATION
    294. SOUTH KOREA SEMANTIC KNOWLEDGE GRAPHING MARKET ANALYSIS BY DEPLOYMENT TYPE
    295. SOUTH KOREA SEMANTIC KNOWLEDGE GRAPHING MARKET ANALYSIS BY END USE
    296. SOUTH KOREA SEMANTIC KNOWLEDGE GRAPHING MARKET ANALYSIS BY TECHNOLOGY
    297. SOUTH KOREA SEMANTIC KNOWLEDGE GRAPHING MARKET ANALYSIS BY REGIONAL
    298. MALAYSIA SEMANTIC KNOWLEDGE GRAPHING MARKET ANALYSIS BY APPLICATION
    299. MALAYSIA SEMANTIC KNOWLEDGE GRAPHING MARKET ANALYSIS BY DEPLOYMENT TYPE
    300. TYPE
    301. USE
    302. TYPE
    303. USE
    304. TYPE
    305. END USE
    306. BY TECHNOLOGY
    307. BY REGIONAL
    308. TYPE
    309. USE
    310. TYPE
    311. USE
    312. TYPE
    313. END USE
    314. BY TECHNOLOGY
    315. BY REGIONAL
    316. MARKET ANALYSIS BY APPLICATION
    317. KNOWLEDGE GRAPHING MARKET ANALYSIS BY DEPLOYMENT TYPE
    318. SOUTH AMERICA SEMANTIC KNOWLEDGE GRAPHING MARKET ANALYSIS BY END USE
    319. REST OF SOUTH AMERICA SEMANTIC KNOWLEDGE GRAPHING MARKET ANALYSIS BY TECHNOLOGY
    320. BY REGIONAL
    321. TYPE
    322. BY END USE
    323. BY TECHNOLOGY
    324. ANALYSIS BY REGIONAL
    325. MARKET ANALYSIS BY APPLICATION
    326. GRAPHING MARKET ANALYSIS BY DEPLOYMENT TYPE
    327. KNOWLEDGE GRAPHING MARKET ANALYSIS BY END USE
    328. KNOWLEDGE GRAPHING MARKET ANALYSIS BY TECHNOLOGY
    329. SEMANTIC KNOWLEDGE GRAPHING MARKET ANALYSIS BY REGIONAL
    330. MEA SEMANTIC KNOWLEDGE GRAPHING MARKET ANALYSIS BY APPLICATION
    331. REST OF MEA SEMANTIC KNOWLEDGE GRAPHING MARKET ANALYSIS BY DEPLOYMENT TYPE
    332. REST OF MEA SEMANTIC KNOWLEDGE GRAPHING MARKET ANALYSIS BY END USE
    333. REST OF MEA SEMANTIC KNOWLEDGE GRAPHING MARKET ANALYSIS BY TECHNOLOGY
    334. REST OF MEA SEMANTIC KNOWLEDGE GRAPHING MARKET ANALYSIS BY REGIONAL
    335. KEY BUYING CRITERIA OF SEMANTIC KNOWLEDGE GRAPHING MARKET
    336. RESEARCH PROCESS OF MRFR
    337. MARKET
    338. SEMANTIC KNOWLEDGE GRAPHING MARKET, BY APPLICATION, 2024 (% SHARE)
    339. SEMANTIC KNOWLEDGE GRAPHING MARKET, BY APPLICATION, 2019 TO 2032 (USD Billions)
    340. SHARE)
    341. TO 2032 (USD Billions)
    342. BY END USE, 2024 (% SHARE)
    343. BY END USE, 2019 TO 2032 (USD Billions)
    344. MARKET, BY TECHNOLOGY, 2024 (% SHARE)
    345. MARKET, BY TECHNOLOGY, 2019 TO 2032 (USD Billions)
    346. GRAPHING MARKET, BY REGIONAL, 2024 (% SHARE)
    347. GRAPHING MARKET, BY REGIONAL, 2019 TO 2032 (USD Billions)
    348. OF MAJOR COMPETITORS'

    Semantic Knowledge Graphing Market Segmentation


    • Semantic Knowledge Graphing Market By Application (USD Billion, 2019-2032)

      • Data Integration
      • Artificial Intelligence
      • Business Intelligence
      • Search and Navigation

    • Semantic Knowledge Graphing Market By Deployment Type (USD Billion, 2019-2032)

      • On-Premises
      • Cloud-Based

    • Semantic Knowledge Graphing Market By End Use (USD Billion, 2019-2032)

      • Healthcare
      • Finance
      • Retail
      • Telecommunications

    • Semantic Knowledge Graphing Market By Technology (USD Billion, 2019-2032)

      • Natural Language Processing
      • Machine Learning
      • Graph Databases

    • Semantic Knowledge Graphing Market By Regional (USD Billion, 2019-2032)

      • North America
      • Europe
      • South America
      • Asia Pacific
      • Middle East and Africa

    Semantic Knowledge Graphing Market Regional Outlook (USD Billion, 2019-2032)


    • North America Outlook (USD Billion, 2019-2032)

      • North America Semantic Knowledge Graphing Market by Application Type

        • Data Integration
        • Artificial Intelligence
        • Business Intelligence
        • Search and Navigation
      • North America Semantic Knowledge Graphing Market by Deployment Type

        • On-Premises
        • Cloud-Based
      • North America Semantic Knowledge Graphing Market by End Use Type

        • Healthcare
        • Finance
        • Retail
        • Telecommunications
      • North America Semantic Knowledge Graphing Market by Technology Type

        • Natural Language Processing
        • Machine Learning
        • Graph Databases
      • North America Semantic Knowledge Graphing Market by Regional Type

        • US
        • Canada
      • US Outlook (USD Billion, 2019-2032)
      • US Semantic Knowledge Graphing Market by Application Type

        • Data Integration
        • Artificial Intelligence
        • Business Intelligence
        • Search and Navigation
      • US Semantic Knowledge Graphing Market by Deployment Type

        • On-Premises
        • Cloud-Based
      • US Semantic Knowledge Graphing Market by End Use Type

        • Healthcare
        • Finance
        • Retail
        • Telecommunications
      • US Semantic Knowledge Graphing Market by Technology Type

        • Natural Language Processing
        • Machine Learning
        • Graph Databases
      • CANADA Outlook (USD Billion, 2019-2032)
      • CANADA Semantic Knowledge Graphing Market by Application Type

        • Data Integration
        • Artificial Intelligence
        • Business Intelligence
        • Search and Navigation
      • CANADA Semantic Knowledge Graphing Market by Deployment Type

        • On-Premises
        • Cloud-Based
      • CANADA Semantic Knowledge Graphing Market by End Use Type

        • Healthcare
        • Finance
        • Retail
        • Telecommunications
      • CANADA Semantic Knowledge Graphing Market by Technology Type

        • Natural Language Processing
        • Machine Learning
        • Graph Databases
    • Europe Outlook (USD Billion, 2019-2032)

      • Europe Semantic Knowledge Graphing Market by Application Type

        • Data Integration
        • Artificial Intelligence
        • Business Intelligence
        • Search and Navigation
      • Europe Semantic Knowledge Graphing Market by Deployment Type

        • On-Premises
        • Cloud-Based
      • Europe Semantic Knowledge Graphing Market by End Use Type

        • Healthcare
        • Finance
        • Retail
        • Telecommunications
      • Europe Semantic Knowledge Graphing Market by Technology Type

        • Natural Language Processing
        • Machine Learning
        • Graph Databases
      • Europe Semantic Knowledge Graphing Market by Regional Type

        • Germany
        • UK
        • France
        • Russia
        • Italy
        • Spain
        • Rest of Europe
      • GERMANY Outlook (USD Billion, 2019-2032)
      • GERMANY Semantic Knowledge Graphing Market by Application Type

        • Data Integration
        • Artificial Intelligence
        • Business Intelligence
        • Search and Navigation
      • GERMANY Semantic Knowledge Graphing Market by Deployment Type

        • On-Premises
        • Cloud-Based
      • GERMANY Semantic Knowledge Graphing Market by End Use Type

        • Healthcare
        • Finance
        • Retail
        • Telecommunications
      • GERMANY Semantic Knowledge Graphing Market by Technology Type

        • Natural Language Processing
        • Machine Learning
        • Graph Databases
      • UK Outlook (USD Billion, 2019-2032)
      • UK Semantic Knowledge Graphing Market by Application Type

        • Data Integration
        • Artificial Intelligence
        • Business Intelligence
        • Search and Navigation
      • UK Semantic Knowledge Graphing Market by Deployment Type

        • On-Premises
        • Cloud-Based
      • UK Semantic Knowledge Graphing Market by End Use Type

        • Healthcare
        • Finance
        • Retail
        • Telecommunications
      • UK Semantic Knowledge Graphing Market by Technology Type

        • Natural Language Processing
        • Machine Learning
        • Graph Databases
      • FRANCE Outlook (USD Billion, 2019-2032)
      • FRANCE Semantic Knowledge Graphing Market by Application Type

        • Data Integration
        • Artificial Intelligence
        • Business Intelligence
        • Search and Navigation
      • FRANCE Semantic Knowledge Graphing Market by Deployment Type

        • On-Premises
        • Cloud-Based
      • FRANCE Semantic Knowledge Graphing Market by End Use Type

        • Healthcare
        • Finance
        • Retail
        • Telecommunications
      • FRANCE Semantic Knowledge Graphing Market by Technology Type

        • Natural Language Processing
        • Machine Learning
        • Graph Databases
      • RUSSIA Outlook (USD Billion, 2019-2032)
      • RUSSIA Semantic Knowledge Graphing Market by Application Type

        • Data Integration
        • Artificial Intelligence
        • Business Intelligence
        • Search and Navigation
      • RUSSIA Semantic Knowledge Graphing Market by Deployment Type

        • On-Premises
        • Cloud-Based
      • RUSSIA Semantic Knowledge Graphing Market by End Use Type

        • Healthcare
        • Finance
        • Retail
        • Telecommunications
      • RUSSIA Semantic Knowledge Graphing Market by Technology Type

        • Natural Language Processing
        • Machine Learning
        • Graph Databases
      • ITALY Outlook (USD Billion, 2019-2032)
      • ITALY Semantic Knowledge Graphing Market by Application Type

        • Data Integration
        • Artificial Intelligence
        • Business Intelligence
        • Search and Navigation
      • ITALY Semantic Knowledge Graphing Market by Deployment Type

        • On-Premises
        • Cloud-Based
      • ITALY Semantic Knowledge Graphing Market by End Use Type

        • Healthcare
        • Finance
        • Retail
        • Telecommunications
      • ITALY Semantic Knowledge Graphing Market by Technology Type

        • Natural Language Processing
        • Machine Learning
        • Graph Databases
      • SPAIN Outlook (USD Billion, 2019-2032)
      • SPAIN Semantic Knowledge Graphing Market by Application Type

        • Data Integration
        • Artificial Intelligence
        • Business Intelligence
        • Search and Navigation
      • SPAIN Semantic Knowledge Graphing Market by Deployment Type

        • On-Premises
        • Cloud-Based
      • SPAIN Semantic Knowledge Graphing Market by End Use Type

        • Healthcare
        • Finance
        • Retail
        • Telecommunications
      • SPAIN Semantic Knowledge Graphing Market by Technology Type

        • Natural Language Processing
        • Machine Learning
        • Graph Databases
      • REST OF EUROPE Outlook (USD Billion, 2019-2032)
      • REST OF EUROPE Semantic Knowledge Graphing Market by Application Type

        • Data Integration
        • Artificial Intelligence
        • Business Intelligence
        • Search and Navigation
      • REST OF EUROPE Semantic Knowledge Graphing Market by Deployment Type

        • On-Premises
        • Cloud-Based
      • REST OF EUROPE Semantic Knowledge Graphing Market by End Use Type

        • Healthcare
        • Finance
        • Retail
        • Telecommunications
      • REST OF EUROPE Semantic Knowledge Graphing Market by Technology Type

        • Natural Language Processing
        • Machine Learning
        • Graph Databases
    • APAC Outlook (USD Billion, 2019-2032)

      • APAC Semantic Knowledge Graphing Market by Application Type

        • Data Integration
        • Artificial Intelligence
        • Business Intelligence
        • Search and Navigation
      • APAC Semantic Knowledge Graphing Market by Deployment Type

        • On-Premises
        • Cloud-Based
      • APAC Semantic Knowledge Graphing Market by End Use Type

        • Healthcare
        • Finance
        • Retail
        • Telecommunications
      • APAC Semantic Knowledge Graphing Market by Technology Type

        • Natural Language Processing
        • Machine Learning
        • Graph Databases
      • APAC Semantic Knowledge Graphing Market by Regional Type

        • China
        • India
        • Japan
        • South Korea
        • Malaysia
        • Thailand
        • Indonesia
        • Rest of APAC
      • CHINA Outlook (USD Billion, 2019-2032)
      • CHINA Semantic Knowledge Graphing Market by Application Type

        • Data Integration
        • Artificial Intelligence
        • Business Intelligence
        • Search and Navigation
      • CHINA Semantic Knowledge Graphing Market by Deployment Type

        • On-Premises
        • Cloud-Based
      • CHINA Semantic Knowledge Graphing Market by End Use Type

        • Healthcare
        • Finance
        • Retail
        • Telecommunications
      • CHINA Semantic Knowledge Graphing Market by Technology Type

        • Natural Language Processing
        • Machine Learning
        • Graph Databases
      • INDIA Outlook (USD Billion, 2019-2032)
      • INDIA Semantic Knowledge Graphing Market by Application Type

        • Data Integration
        • Artificial Intelligence
        • Business Intelligence
        • Search and Navigation
      • INDIA Semantic Knowledge Graphing Market by Deployment Type

        • On-Premises
        • Cloud-Based
      • INDIA Semantic Knowledge Graphing Market by End Use Type

        • Healthcare
        • Finance
        • Retail
        • Telecommunications
      • INDIA Semantic Knowledge Graphing Market by Technology Type

        • Natural Language Processing
        • Machine Learning
        • Graph Databases
      • JAPAN Outlook (USD Billion, 2019-2032)
      • JAPAN Semantic Knowledge Graphing Market by Application Type

        • Data Integration
        • Artificial Intelligence
        • Business Intelligence
        • Search and Navigation
      • JAPAN Semantic Knowledge Graphing Market by Deployment Type

        • On-Premises
        • Cloud-Based
      • JAPAN Semantic Knowledge Graphing Market by End Use Type

        • Healthcare
        • Finance
        • Retail
        • Telecommunications
      • JAPAN Semantic Knowledge Graphing Market by Technology Type

        • Natural Language Processing
        • Machine Learning
        • Graph Databases
      • SOUTH KOREA Outlook (USD Billion, 2019-2032)
      • SOUTH KOREA Semantic Knowledge Graphing Market by Application Type

        • Data Integration
        • Artificial Intelligence
        • Business Intelligence
        • Search and Navigation
      • SOUTH KOREA Semantic Knowledge Graphing Market by Deployment Type

        • On-Premises
        • Cloud-Based
      • SOUTH KOREA Semantic Knowledge Graphing Market by End Use Type

        • Healthcare
        • Finance
        • Retail
        • Telecommunications
      • SOUTH KOREA Semantic Knowledge Graphing Market by Technology Type

        • Natural Language Processing
        • Machine Learning
        • Graph Databases
      • MALAYSIA Outlook (USD Billion, 2019-2032)
      • MALAYSIA Semantic Knowledge Graphing Market by Application Type

        • Data Integration
        • Artificial Intelligence
        • Business Intelligence
        • Search and Navigation
      • MALAYSIA Semantic Knowledge Graphing Market by Deployment Type

        • On-Premises
        • Cloud-Based
      • MALAYSIA Semantic Knowledge Graphing Market by End Use Type

        • Healthcare
        • Finance
        • Retail
        • Telecommunications
      • MALAYSIA Semantic Knowledge Graphing Market by Technology Type

        • Natural Language Processing
        • Machine Learning
        • Graph Databases
      • THAILAND Outlook (USD Billion, 2019-2032)
      • THAILAND Semantic Knowledge Graphing Market by Application Type

        • Data Integration
        • Artificial Intelligence
        • Business Intelligence
        • Search and Navigation
      • THAILAND Semantic Knowledge Graphing Market by Deployment Type

        • On-Premises
        • Cloud-Based
      • THAILAND Semantic Knowledge Graphing Market by End Use Type

        • Healthcare
        • Finance
        • Retail
        • Telecommunications
      • THAILAND Semantic Knowledge Graphing Market by Technology Type

        • Natural Language Processing
        • Machine Learning
        • Graph Databases
      • INDONESIA Outlook (USD Billion, 2019-2032)
      • INDONESIA Semantic Knowledge Graphing Market by Application Type

        • Data Integration
        • Artificial Intelligence
        • Business Intelligence
        • Search and Navigation
      • INDONESIA Semantic Knowledge Graphing Market by Deployment Type

        • On-Premises
        • Cloud-Based
      • INDONESIA Semantic Knowledge Graphing Market by End Use Type

        • Healthcare
        • Finance
        • Retail
        • Telecommunications
      • INDONESIA Semantic Knowledge Graphing Market by Technology Type

        • Natural Language Processing
        • Machine Learning
        • Graph Databases
      • REST OF APAC Outlook (USD Billion, 2019-2032)
      • REST OF APAC Semantic Knowledge Graphing Market by Application Type

        • Data Integration
        • Artificial Intelligence
        • Business Intelligence
        • Search and Navigation
      • REST OF APAC Semantic Knowledge Graphing Market by Deployment Type

        • On-Premises
        • Cloud-Based
      • REST OF APAC Semantic Knowledge Graphing Market by End Use Type

        • Healthcare
        • Finance
        • Retail
        • Telecommunications
      • REST OF APAC Semantic Knowledge Graphing Market by Technology Type

        • Natural Language Processing
        • Machine Learning
        • Graph Databases
    • South America Outlook (USD Billion, 2019-2032)

      • South America Semantic Knowledge Graphing Market by Application Type

        • Data Integration
        • Artificial Intelligence
        • Business Intelligence
        • Search and Navigation
      • South America Semantic Knowledge Graphing Market by Deployment Type

        • On-Premises
        • Cloud-Based
      • South America Semantic Knowledge Graphing Market by End Use Type

        • Healthcare
        • Finance
        • Retail
        • Telecommunications
      • South America Semantic Knowledge Graphing Market by Technology Type

        • Natural Language Processing
        • Machine Learning
        • Graph Databases
      • South America Semantic Knowledge Graphing Market by Regional Type

        • Brazil
        • Mexico
        • Argentina
        • Rest of South America
      • BRAZIL Outlook (USD Billion, 2019-2032)
      • BRAZIL Semantic Knowledge Graphing Market by Application Type

        • Data Integration
        • Artificial Intelligence
        • Business Intelligence
        • Search and Navigation
      • BRAZIL Semantic Knowledge Graphing Market by Deployment Type

        • On-Premises
        • Cloud-Based
      • BRAZIL Semantic Knowledge Graphing Market by End Use Type

        • Healthcare
        • Finance
        • Retail
        • Telecommunications
      • BRAZIL Semantic Knowledge Graphing Market by Technology Type

        • Natural Language Processing
        • Machine Learning
        • Graph Databases
      • MEXICO Outlook (USD Billion, 2019-2032)
      • MEXICO Semantic Knowledge Graphing Market by Application Type

        • Data Integration
        • Artificial Intelligence
        • Business Intelligence
        • Search and Navigation
      • MEXICO Semantic Knowledge Graphing Market by Deployment Type

        • On-Premises
        • Cloud-Based
      • MEXICO Semantic Knowledge Graphing Market by End Use Type

        • Healthcare
        • Finance
        • Retail
        • Telecommunications
      • MEXICO Semantic Knowledge Graphing Market by Technology Type

        • Natural Language Processing
        • Machine Learning
        • Graph Databases
      • ARGENTINA Outlook (USD Billion, 2019-2032)
      • ARGENTINA Semantic Knowledge Graphing Market by Application Type

        • Data Integration
        • Artificial Intelligence
        • Business Intelligence
        • Search and Navigation
      • ARGENTINA Semantic Knowledge Graphing Market by Deployment Type

        • On-Premises
        • Cloud-Based
      • ARGENTINA Semantic Knowledge Graphing Market by End Use Type

        • Healthcare
        • Finance
        • Retail
        • Telecommunications
      • ARGENTINA Semantic Knowledge Graphing Market by Technology Type

        • Natural Language Processing
        • Machine Learning
        • Graph Databases
      • REST OF SOUTH AMERICA Outlook (USD Billion, 2019-2032)
      • REST OF SOUTH AMERICA Semantic Knowledge Graphing Market by Application Type

        • Data Integration
        • Artificial Intelligence
        • Business Intelligence
        • Search and Navigation
      • REST OF SOUTH AMERICA Semantic Knowledge Graphing Market by Deployment Type

        • On-Premises
        • Cloud-Based
      • REST OF SOUTH AMERICA Semantic Knowledge Graphing Market by End Use Type

        • Healthcare
        • Finance
        • Retail
        • Telecommunications
      • REST OF SOUTH AMERICA Semantic Knowledge Graphing Market by Technology Type

        • Natural Language Processing
        • Machine Learning
        • Graph Databases
    • MEA Outlook (USD Billion, 2019-2032)

      • MEA Semantic Knowledge Graphing Market by Application Type

        • Data Integration
        • Artificial Intelligence
        • Business Intelligence
        • Search and Navigation
      • MEA Semantic Knowledge Graphing Market by Deployment Type

        • On-Premises
        • Cloud-Based
      • MEA Semantic Knowledge Graphing Market by End Use Type

        • Healthcare
        • Finance
        • Retail
        • Telecommunications
      • MEA Semantic Knowledge Graphing Market by Technology Type

        • Natural Language Processing
        • Machine Learning
        • Graph Databases
      • MEA Semantic Knowledge Graphing Market by Regional Type

        • GCC Countries
        • South Africa
        • Rest of MEA
      • GCC COUNTRIES Outlook (USD Billion, 2019-2032)
      • GCC COUNTRIES Semantic Knowledge Graphing Market by Application Type

        • Data Integration
        • Artificial Intelligence
        • Business Intelligence
        • Search and Navigation
      • GCC COUNTRIES Semantic Knowledge Graphing Market by Deployment Type

        • On-Premises
        • Cloud-Based
      • GCC COUNTRIES Semantic Knowledge Graphing Market by End Use Type

        • Healthcare
        • Finance
        • Retail
        • Telecommunications
      • GCC COUNTRIES Semantic Knowledge Graphing Market by Technology Type

        • Natural Language Processing
        • Machine Learning
        • Graph Databases
      • SOUTH AFRICA Outlook (USD Billion, 2019-2032)
      • SOUTH AFRICA Semantic Knowledge Graphing Market by Application Type

        • Data Integration
        • Artificial Intelligence
        • Business Intelligence
        • Search and Navigation
      • SOUTH AFRICA Semantic Knowledge Graphing Market by Deployment Type

        • On-Premises
        • Cloud-Based
      • SOUTH AFRICA Semantic Knowledge Graphing Market by End Use Type

        • Healthcare
        • Finance
        • Retail
        • Telecommunications
      • SOUTH AFRICA Semantic Knowledge Graphing Market by Technology Type

        • Natural Language Processing
        • Machine Learning
        • Graph Databases
      • REST OF MEA Outlook (USD Billion, 2019-2032)
      • REST OF MEA Semantic Knowledge Graphing Market by Application Type

        • Data Integration
        • Artificial Intelligence
        • Business Intelligence
        • Search and Navigation
      • REST OF MEA Semantic Knowledge Graphing Market by Deployment Type

        • On-Premises
        • Cloud-Based
      • REST OF MEA Semantic Knowledge Graphing Market by End Use Type

        • Healthcare
        • Finance
        • Retail
        • Telecommunications
      • REST OF MEA Semantic Knowledge Graphing Market by Technology Type

        • Natural Language Processing
        • Machine Learning
        • Graph Databases
    Report Infographic
    Free Sample Request

    Kindly complete the form below to receive a free sample of this Report

    Customer Strories

    “I am very pleased with how market segments have been defined in a relevant way for my purposes (such as "Portable Freezers & refrigerators" and "last-mile"). In general the report is well structured. Thanks very much for your efforts.”

    Victoria Milne Founder
    Case Study

    Chemicals and Materials