• Cat-intel
  • MedIntelliX
  • Resources
  • About Us
  • Hero Background
    English
    Chinese
    French
    Japanese
    Korean
    German
    Spanish

    Reusable Water Bottle Market Analysis

    ID: MRFR/PNT/10335-HCR
    111 Pages
    Snehal Singh
    October 2025

    Reusable Water Bottle Market Research Report By Material (Plastic, Stainless Steel, Glass, Bamboo, Silicone), By Size (500 ml, 750 ml, 1 liter, 1.5 liters, 2 liters), By Distribution Channel (Online Retail, Supermarkets, Specialty Stores, Health Stores, Sporting Goods Stores), By End Use (Sports, Travel, Everyday Use, Business, Fitness) and By Regional (North America, Europe, South America, Asi...

    Share:
    Download PDF ×

    We do not share your information with anyone. However, we may send you emails based on your report interest from time to time. You may contact us at any time to opt-out.

    Reusable Water Bottle Market Infographic
    Purchase Options

    Market Analysis

    In-depth Analysis of Reusable Water Bottle Market Industry Landscape

    The market dynamics of the reusable water bottle industry showcase a compelling narrative of sustainability, convenience, and evolving consumer preferences. With increasing environmental awareness, consumers are gravitating towards eco-friendly alternatives, driving the demand for reusable water bottles. This shift is not merely a trend but a conscious effort towards reducing single-use plastic waste, aligning with global sustainability goals. Consequently, market players are innovating to meet this demand, offering a diverse range of designs, materials, and functionalities.

    The Reusable Water Bottle Market segmentation, based on Distribution Channel, includes specialty stores, convenience stores, supermarkets & hypermarkets, and online.

    One of the primary drivers shaping the market dynamics is the growing concern over plastic pollution. As more individuals become aware of the detrimental impact of single-use plastics on the environment, there's a significant shift towards sustainable solutions like reusable water bottles. This heightened environmental consciousness is prompting consumers to make more informed purchasing decisions, favoring products that minimize ecological harm. Consequently, companies operating in the reusable water bottle market are capitalizing on this sentiment by emphasizing the eco-friendly aspects of their products in their marketing strategies.

    Moreover, the convenience factor plays a crucial role in driving the market forward. Reusable water bottles offer convenience to consumers by allowing them to carry their beverages wherever they go, whether it's to the gym, office, or outdoor activities. The functionality of these bottles, including features like insulation, durability, and portability, enhances their appeal to a broad consumer base. As a result, market players are constantly innovating to improve the usability and practicality of their products, catering to the diverse needs and preferences of consumers.

    Additionally, the market dynamics of the reusable water bottle industry are influenced by changing consumer lifestyles and preferences. As more people embrace active and health-conscious lifestyles, the demand for reusable water bottles as an essential accessory grows. Furthermore, the rise of social media and influencer culture has contributed to the popularity of reusable water bottles as a symbol of sustainability and wellness. Consumers are increasingly seeking products that align with their values and reflect their lifestyle choices, driving the demand for aesthetically pleasing and socially conscious brands.

    Furthermore, the competitive landscape of the reusable water bottle market is characterized by intense rivalry among both established players and new entrants. With the market experiencing rapid growth, companies are vying for market share by differentiating their products through innovation, branding, and pricing strategies. Established brands leverage their reputation and brand loyalty to maintain their market dominance, while newer players focus on niche segments or disruptive technologies to carve out their market space.

    However, amidst the opportunities, challenges also abound in the reusable water bottle market. Pricing remains a significant factor influencing consumer purchasing decisions, with affordability often dictating market success. Additionally, concerns regarding product quality, safety, and hygiene pose challenges for market players, necessitating stringent quality control measures and compliance with regulatory standards.

    Author
    Snehal Singh
    Assistant Manager - Research

    High acumen in analyzing complex macro & micro markets with more than 6 years of work experience in the field of market research. By implementing her analytical skills in forecasting and estimation into market research reports, she has expertise in Packaging, Construction, and Equipment domains. She handles a team size of 20-25 resources and ensures smooth running of the projects, associated marketing activities, and client servicing.

    Leave a Comment

    FAQs

    What is the current valuation of the Reusable Water Bottle Market as of 2024?

    The overall market valuation was 9.728 USD Billion in 2024.

    What is the projected market size for the Reusable Water Bottle Market in 2035?

    The projected valuation for 2035 is 15.96 USD Billion.

    What is the expected CAGR for the Reusable Water Bottle Market during the forecast period 2025 - 2035?

    The expected CAGR for the market during this period is 4.6%.

    Which material segment holds the highest market value in the Reusable Water Bottle Market?

    The Plastic segment held a market value of 3.5 USD Billion in 2024 and is projected to reach 5.5 USD Billion.

    How does the market size for stainless steel reusable water bottles compare to glass bottles?

    In 2024, the stainless steel segment was valued at 2.5 USD Billion, while the glass segment was valued at 1.5 USD Billion.

    What distribution channel is expected to generate the highest revenue in the Reusable Water Bottle Market?

    Supermarkets generated a market value of 3.0 USD Billion in 2024, indicating strong performance.

    Which end-use segment is projected to have the largest market share in 2035?

    The Everyday Use segment is expected to grow from 3.5 USD Billion in 2024 to 5.5 USD Billion by 2035.

    Who are the key players in the Reusable Water Bottle Market?

    Key players include Nalgene, Hydro Flask, CamelBak, Contigo, Klean Kanteen, S'well, Thermos, Brita, and Lifestraw.

    What size of reusable water bottles is projected to see the most growth by 2035?

    The 1 liter size is projected to grow from 2.5 USD Billion in 2024 to 4.0 USD Billion by 2035.

    Market Summary

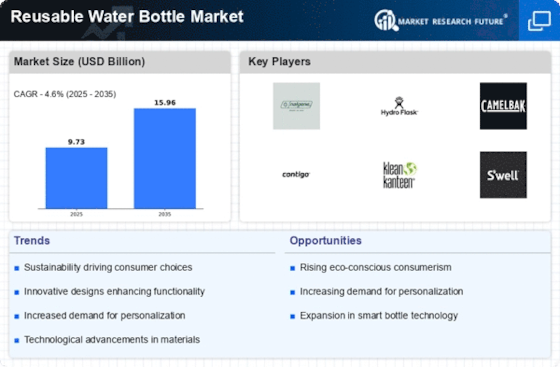
    As per MRFR analysis, the Reusable Water Bottle Market Size was estimated at 9.728 USD Billion in 2024. The Reusable Water Bottle industry is projected to grow from 10.18 USD Billion in 2025 to 15.96 USD Billion by 2035, exhibiting a compound annual growth rate (CAGR) of 4.6 during the forecast period 2025 - 2035.

    Key Market Trends & Highlights

    The Reusable Water Bottle Market is experiencing a robust shift towards sustainability and innovation.

    • The market is increasingly driven by a focus on sustainability, with consumers prioritizing eco-friendly products.
    • Technological integration is enhancing user experience, with features such as smart hydration tracking gaining traction.
    • In North America, the plastic segment remains the largest, while the stainless steel segment is rapidly growing in Asia-Pacific.
    • Key market drivers include environmental awareness and health consciousness, which are shaping consumer preferences.

    Market Size & Forecast

    2024 Market Size 9.728 (USD Billion)
    2035 Market Size 15.96 (USD Billion)
    CAGR (2025 - 2035) 4.6%
    Largest Regional Market Share in 2024 North America

    Major Players

    <p>Nalgene (US), Hydro Flask (US), CamelBak (US), Contigo (US), Klean Kanteen (US), S'well (US), Thermos (JP), Brita (DE), Lifestraw (US)</p>

    Market Trends

    The Reusable Water Bottle Market is currently experiencing a notable transformation, driven by a growing awareness of environmental sustainability and health consciousness among consumers. As individuals increasingly seek alternatives to single-use plastics, the demand for reusable water bottles appears to be on the rise. This shift is not merely a trend but rather a reflection of a broader societal movement towards eco-friendly practices. Companies are responding by innovating their product lines, introducing materials that are both durable and safe for everyday use. Furthermore, the integration of technology, such as built-in filtration systems and smart features, seems to enhance the appeal of these products, catering to a more health-oriented consumer base. In addition to environmental considerations, the Reusable Water Bottle Market is also influenced by lifestyle changes. Urbanization and the fast-paced nature of modern life have led to an increased emphasis on convenience and portability. Consumers are looking for products that fit seamlessly into their daily routines, which has prompted manufacturers to design bottles that are lightweight, compact, and aesthetically pleasing. This focus on functionality, combined with a desire for personalization, suggests that the market will continue to evolve, with brands likely to offer customizable options to meet diverse consumer preferences.

    Sustainability Focus

    The emphasis on sustainability is reshaping the Reusable Water Bottle Market. Consumers are increasingly prioritizing eco-friendly products, leading brands to adopt sustainable materials and practices.

    Technological Integration

    The incorporation of technology into reusable bottles is becoming more prevalent. Features such as built-in filters and smart tracking capabilities are appealing to health-conscious consumers.

    Lifestyle Adaptation

    As lifestyles evolve, the demand for portable and convenient solutions grows. Reusable water bottles are being designed to cater to on-the-go consumers, emphasizing functionality and style.

    The increasing awareness of environmental sustainability and the push towards reducing single-use plastics are driving a notable shift in consumer preferences towards reusable water bottles, suggesting a transformative trend in the beverage container market.

    U.S. Environmental Protection Agency (EPA)

    Reusable Water Bottle Market Market Drivers

    Health Consciousness

    Health consciousness among consumers is another notable driver influencing the Reusable Water Bottle Market. As individuals become more aware of the importance of hydration for overall well-being, the demand for reusable water bottles is likely to increase. Many consumers prefer bottles that are BPA-free and made from safe materials, which aligns with their health-oriented lifestyle choices. The market data suggests that the health and wellness trend is expected to propel the reusable water bottle segment, as more people incorporate hydration into their daily routines. This focus on health not only drives sales but also encourages brands to innovate in terms of design and functionality.

    Environmental Awareness

    The increasing awareness regarding environmental issues appears to be a primary driver for the Reusable Water Bottle Market. Consumers are becoming more conscious of the detrimental effects of single-use plastics on ecosystems. This shift in mindset is leading to a growing preference for sustainable alternatives, such as reusable water bottles. According to recent data, the market for reusable water bottles is projected to grow at a compound annual growth rate of approximately 5.5 percent over the next several years. This trend indicates a significant movement towards eco-friendly products, as consumers seek to reduce their carbon footprint and contribute positively to environmental conservation.

    Convenience and Portability

    The convenience and portability offered by reusable water bottles serve as a significant driver for the Reusable Water Bottle Market. As lifestyles become increasingly fast-paced, consumers are seeking products that can easily fit into their daily routines. Reusable water bottles are designed for on-the-go use, making them ideal for various activities such as commuting, exercising, and traveling. Market data indicates that the demand for portable hydration solutions is rising, with many brands focusing on lightweight and compact designs. This trend suggests that convenience is a key factor influencing consumer purchasing decisions, thereby boosting the overall market.

    Innovative Designs and Features

    Innovative designs and features in reusable water bottles are likely to attract consumers, thereby driving the Reusable Water Bottle Market. Manufacturers are increasingly incorporating advanced technologies, such as insulation, filtration systems, and customizable designs, to enhance user experience. These innovations not only improve functionality but also appeal to a broader audience, including outdoor enthusiasts and fitness aficionados. Market analysis indicates that the introduction of smart water bottles, which track hydration levels, is gaining traction. This trend suggests that as brands continue to innovate, they may capture a larger share of the market by meeting diverse consumer needs.

    Regulatory Support and Initiatives

    Regulatory support and initiatives aimed at reducing plastic waste are emerging as a crucial driver for the Reusable Water Bottle Market. Governments and organizations worldwide are implementing policies to discourage single-use plastics, thereby encouraging consumers to adopt reusable alternatives. This regulatory landscape is fostering a favorable environment for the growth of the reusable water bottle segment. Market data indicates that regions with stringent regulations on plastic usage are witnessing a more pronounced shift towards reusable products. This trend suggests that as regulations become more widespread, the demand for reusable water bottles is likely to increase, further solidifying their position in the market.

    Market Segment Insights

    By Material: Plastic (Largest) vs. Stainless Steel (Fastest-Growing)

    <p>In the Reusable Water Bottle Market, the material segment exhibits a diverse range of options, with plastic dominating the market due to its affordability and lightweight nature. Approximately 40% of consumers prefer plastic bottles, drawn to their versatility and wide availability. Stainless steel, on the other hand, is steadily growing in popularity, appealing to eco-conscious consumers seeking durability and insulation properties. Its market share is on the rise, reflecting a shift towards sustainable materials in everyday products. The growth trends within the reusable water bottle market are influenced by increasing health awareness and environmental concerns among consumers. Stainless steel is particularly benefitting from this trend, as it is praised for being BPA-free and infinitely recyclable. As consumers become more informed about the implications of plastic on health and the environment, they are likely to shift preferences towards stainless steel and other sustainable alternatives. This transition is propelling stainless steel to emerge as a significant player within the market, while plastic maintains its status in segment preference.</p>

    <p>Plastic (Dominant) vs. Stainless Steel (Emerging)</p>

    <p>Plastic bottles lead the Reusable Water Bottle Market, characterized by their lightweight design, cost-effectiveness, and colorful aesthetics. Often produced in various sizes and shapes, plastic bottles cater well to diverse consumer needs. However, growing awareness about plastic pollution is prompting market shifts. In contrast, stainless steel bottles are gaining traction as an emerging choice among environmentally-conscious consumers. Recognized for their insulating abilities, stainless steel bottles keep beverages hot or cold for extended periods. They are also durable and resistant to corrosion, aligning with consumer desires for longevity and sustainability. This duality between plastic as the dominant choice and stainless steel as the emerging alternative illustrates a dynamic marketplace that responds swiftly to consumer priorities.</p>

    By Size: 1 Liter (Largest) vs. 750 ml (Fastest-Growing)

    <p>In the Reusable Water Bottle Market, the size segment illustrates a diverse landscape where the 1 liter size stands out as the largest segment, accounting for significant market share. Following closely are the 750 ml and 500 ml sizes, which cater to varying consumer preferences. Interestingly, the 750 ml size is emerging as the fastest-growing segment, appealing to consumers seeking a balance between capacity and portability. This shift suggests changing consumer lifestyles and preferences for adaptable products.</p>

    <p>1 Liter (Dominant) vs. 750 ml (Emerging)</p>

    <p>The 1 liter reusable water bottle segment has established itself as the dominant choice among consumers, favored for its ample capacity that suits both everyday use and outdoor activities. It is characterized by a wide range of designs and features, including insulated options that maintain beverage temperature. Conversely, the 750 ml size is rapidly gaining traction, particularly among younger urban consumers who prioritize convenience and portability. This emerging segment is designed for on-the-go lifestyles, fitting easily into bags while still providing sufficient hydration. Both sizes cater to the growing trend of sustainability, highlighting eco-friendly materials that appeal to environmentally-conscious consumers.</p>

    By Distribution Channel: Online Retail (Largest) vs. Specialty Stores (Fastest-Growing)

    <p>The distribution of reusable water bottles among various channels reveals a competitive landscape, with online retail emerging as the largest segment. It takes a significant share of the market, driven by the convenience of online shopping and the availability of diverse product offerings. Meanwhile, specialty stores have carved out a niche, catering to eco-conscious consumers with personalized service and product knowledge, contributing to their rising popularity.</p>

    <p>Online Retail (Dominant) vs. Specialty Stores (Emerging)</p>

    <p>Online retail stands tall as the dominant channel for reusable water bottles, capitalizing on the increasing trend of e-commerce. The convenience of home delivery and the ability to compare prices easily enhance its attractiveness to consumers. Conversely, specialty stores are considered an emerging force in this market, offering unique products and expert advice. These stores appeal to consumers looking for specialized items and sustainable alternatives, and their growth reflects the broader trend towards sustainability and wellness within consumer purchasing behavior.</p>

    By End Use: Fitness (Largest) vs. Travel (Fastest-Growing)

    <p>In the Reusable Water Bottle Market, the 'End Use' segment is diverse, with Fitness, Travel, Everyday Use, and Business all contributing significantly to the overall market dynamics. Among these, Fitness emerges as the largest segment, driven by the increasing participation of individuals in health-focused activities. This segment attracts a wide demographic, including gym-goers, athletes, and fitness enthusiasts, who prefer specialized bottles that cater to their active lifestyles. On the other hand, the Travel segment is rapidly gaining momentum due to the growing trend of sustainable travel, with consumers increasingly seeking eco-friendly alternatives to single-use plastic bottles.</p>

    <p>Fitness (Dominant) vs. Travel (Emerging)</p>

    <p>The Fitness segment of the Reusable Water Bottle Market is characterized by its focus on durability, portability, and design tailored to active users. Brands within this segment often incorporate features such as insulation, ergonomic design, and easy-to-carry options to attract fitness enthusiasts. This segment's dominance is supported by an ongoing trend towards health and wellness, making these bottles a staple for individuals engaging in physical activities. In contrast, the Travel segment is an emerging force, appealing to environmentally conscious consumers seeking convenient hydration solutions while on the go. This segment benefits from rising tourism and outdoor activities, fostering the demand for stylish, collapsible, and lightweight bottles that fit seamlessly into a traveler’s lifestyle.</p>

    Get more detailed insights about Reusable Water Bottle Market Research Report—Global Forecast till 2035

    Regional Insights

    North America : Sustainable Consumption Leader

    North America is the largest market for reusable water bottles, accounting for approximately 45% of the global market share. The region's growth is driven by increasing environmental awareness, stringent regulations against single-use plastics, and a rising trend towards sustainable living. Consumers are increasingly opting for eco-friendly products, which has led to a surge in demand for reusable bottles. The United States is the primary market, with key players like Nalgene, Hydro Flask, and CamelBak leading the charge. The competitive landscape is characterized by innovation in design and functionality, with brands focusing on durability and aesthetic appeal. Canada also plays a significant role, contributing to the market with a growing preference for sustainable products. Overall, the North American market is poised for continued growth as consumers prioritize eco-conscious choices.

    Europe : Eco-Friendly Initiatives Drive Growth

    Europe is the second-largest market for reusable water bottles, holding around 30% of the global market share. The region's growth is fueled by strong government initiatives promoting sustainability and reducing plastic waste. Countries like Germany and the UK are at the forefront, implementing regulations that encourage the use of reusable products, thus driving demand for water bottles. Germany leads the market, with brands like Brita and Klean Kanteen gaining traction. The competitive landscape is marked by a focus on innovation and eco-friendly materials. The European market is also witnessing a rise in local brands that cater to environmentally conscious consumers. As sustainability becomes a priority, the market is expected to expand further, supported by favorable regulations and consumer trends.

    Asia-Pacific : Emerging Market Potential

    Asia-Pacific is an emerging powerhouse in the reusable water bottle market, accounting for approximately 20% of the global share. The region's growth is driven by increasing urbanization, rising disposable incomes, and a growing awareness of environmental issues. Countries like China and India are witnessing a surge in demand for sustainable products, supported by government initiatives to reduce plastic waste. China is the largest market in the region, with a growing number of local and international brands entering the space. The competitive landscape is evolving, with companies focusing on affordability and functionality. India is also emerging as a significant player, with a rising middle class increasingly opting for reusable options. As the market matures, innovation and sustainability will be key drivers of growth in this region.

    Middle East and Africa : Untapped Market Opportunities

    The Middle East and Africa represent a nascent market for reusable water bottles, holding about 5% of the global market share. The region's growth is driven by increasing awareness of environmental issues and a shift towards sustainable practices. Countries like South Africa and the UAE are leading the charge, with initiatives aimed at reducing plastic waste and promoting eco-friendly products. South Africa is the largest market in the region, with a growing number of local brands emerging to meet consumer demand. The competitive landscape is characterized by a mix of international and local players, focusing on affordability and accessibility. As awareness of sustainability grows, the market is expected to expand, supported by government initiatives and changing consumer preferences.

    Key Players and Competitive Insights

    The Reusable Water Bottle Market is currently characterized by a dynamic competitive landscape, driven by increasing consumer awareness regarding sustainability and health. Major players such as Nalgene (US), Hydro Flask (US), and CamelBak (US) are strategically positioning themselves through innovation and product diversification. Nalgene (US) focuses on creating durable, BPA-free bottles that appeal to outdoor enthusiasts, while Hydro Flask (US) emphasizes premium insulated products that cater to a lifestyle-oriented consumer base. CamelBak (US) leverages its heritage in hydration solutions to expand into new markets, particularly targeting fitness and outdoor activities. Collectively, these strategies foster a competitive environment that prioritizes quality, functionality, and brand loyalty.

    In terms of business tactics, companies are increasingly localizing manufacturing to enhance supply chain efficiency and reduce carbon footprints. The market structure appears moderately fragmented, with a mix of established brands and emerging players vying for market share. This fragmentation allows for diverse consumer choices but also intensifies competition among key players, who must continuously innovate to maintain relevance.

    In August 2025, Hydro Flask (US) launched a new line of eco-friendly water bottles made from recycled materials, reflecting a growing trend towards sustainability. This strategic move not only aligns with consumer preferences for environmentally responsible products but also positions Hydro Flask (US) as a leader in sustainable practices within the industry. The introduction of this product line is likely to enhance brand loyalty and attract environmentally conscious consumers.

    In September 2025, CamelBak (US) announced a partnership with a leading outdoor retailer to expand its distribution channels. This collaboration aims to increase the brand's visibility in retail spaces frequented by outdoor enthusiasts. By enhancing accessibility, CamelBak (US) is poised to capture a larger market share, particularly among consumers who prioritize convenience and brand trust in their purchasing decisions.

    In July 2025, Klean Kanteen (US) unveiled a new digital marketing campaign focused on educating consumers about the benefits of reusable bottles. This initiative not only aims to increase brand awareness but also seeks to position Klean Kanteen (US) as a thought leader in the sustainability conversation. By leveraging digital platforms, the company is likely to engage a broader audience and foster a community around its brand values.

    As of October 2025, the competitive trends in the Reusable Water Bottle Market are increasingly defined by digitalization, sustainability, and technological integration. Strategic alliances among companies are shaping the landscape, allowing for shared resources and enhanced innovation capabilities. Looking ahead, competitive differentiation is expected to evolve from traditional price-based competition to a focus on innovation, technology, and supply chain reliability, as companies strive to meet the growing demands of environmentally conscious consumers.

    Key Companies in the Reusable Water Bottle Market market include

    Industry Developments

    • Q2 2024: Hydro Flask Launches New Lightweight Trail Series Bottles for Outdoor Enthusiasts Hydro Flask announced the release of its Trail Series, a new line of lightweight stainless steel reusable water bottles designed specifically for hikers and outdoor adventurers. The bottles are 25% lighter than the brand’s standard models and feature a redesigned handle for easier carrying.
    • Q2 2024: S’well Appoints New CEO to Drive Global Expansion S’well, a leading reusable water bottle brand, announced the appointment of Jennifer Lee as Chief Executive Officer. Lee will focus on expanding the company’s international presence and accelerating product innovation.
    • Q3 2024: CamelBak Partners with REI Co-op for Exclusive Product Line CamelBak entered into a partnership with REI Co-op to launch an exclusive line of eco-friendly reusable water bottles made from recycled materials. The collection will be available only at REI stores and online.
    • Q3 2024: Nalgene Opens New Manufacturing Facility in Tennessee Nalgene, a major reusable water bottle manufacturer, inaugurated a new production facility in Tennessee to increase capacity and meet growing demand in North America. The facility is expected to create over 100 new jobs.
    • Q4 2024: LARQ Raises $20 Million in Series B Funding to Expand Smart Bottle Technology LARQ, known for its self-cleaning water bottles, secured $20 million in Series B funding led by a consortium of venture capital firms. The funds will be used to accelerate product development and expand into new international markets.
    • Q4 2024: SIGG Switzerland Bottles AG Announces Partnership with Adidas for Co-Branded Bottles SIGG Switzerland Bottles AG entered a strategic partnership with Adidas to produce a co-branded line of reusable water bottles targeting the sports and fitness market. The new products will launch globally in early 2025.
    • Q1 2025: Klean Kanteen Launches First Carbon Neutral Reusable Water Bottle Klean Kanteen introduced its first carbon neutral reusable water bottle, certified by a third-party environmental agency. The launch is part of the company’s broader sustainability initiative.
    • Q1 2025: Brita Acquires Start-Up HydrateMe to Expand Smart Bottle Portfolio Brita completed the acquisition of HydrateMe, a start-up specializing in smart hydration tracking technology. The deal aims to enhance Brita’s product offerings in the connected reusable water bottle segment.
    • Q2 2025: Contigo Unveils Leak-Proof Kids’ Bottle Line with Disney Collaboration Contigo launched a new line of leak-proof reusable water bottles for children, featuring popular Disney characters. The collaboration targets the back-to-school market and will be available in major retail stores.
    • Q2 2025: ThermoFlask Announces Expansion into European Market ThermoFlask, a U.S.-based reusable water bottle brand, announced its official entry into the European market through partnerships with leading retailers in Germany, France, and the UK.
    • Q3 2025: Soma Receives Regulatory Approval for Plant-Based Bottle Material in EU Soma, a reusable water bottle company, received regulatory approval from the European Union for its new plant-based bottle material, allowing the company to begin sales across EU member states.
    • Q3 2025: Takeya USA Announces $10 Million Investment in California Manufacturing Facility Takeya USA announced a $10 million investment to expand its manufacturing facility in California, aiming to increase production capacity and reduce lead times for its reusable water bottles.

    Future Outlook

    Reusable Water Bottle Market Future Outlook

    <p>The Reusable Water Bottle Market is projected to grow at a 4.6% CAGR from 2024 to 2035, driven by sustainability trends, health consciousness, and technological innovations.</p>

    New opportunities lie in:

    • <p>Expansion into smart water bottle technology for health tracking.</p>
    • <p>Partnerships with eco-friendly brands for co-branded products.</p>
    • <p>Development of customizable bottles for corporate gifting solutions.</p>

    <p>By 2035, the market is expected to be robust, reflecting strong consumer demand and innovative product offerings.</p>

    Market Segmentation

    Reusable Water Bottle Market Size Outlook

    • 500 ml
    • 750 ml
    • 1 liter
    • 1.5 liters
    • 2 liters

    Reusable Water Bottle Market End Use Outlook

    • Sports
    • Travel
    • Everyday Use
    • Business
    • Fitness

    Reusable Water Bottle Market Material Outlook

    • Plastic
    • Stainless Steel
    • Glass
    • Bamboo
    • Silicone

    Reusable Water Bottle Market Distribution Channel Outlook

    • Online Retail
    • Supermarkets
    • Specialty Stores
    • Health Stores
    • Sporting Goods Stores

    Report Scope

    MARKET SIZE 20249.728(USD Billion)
    MARKET SIZE 202510.18(USD Billion)
    MARKET SIZE 203515.96(USD Billion)
    COMPOUND ANNUAL GROWTH RATE (CAGR)4.6% (2024 - 2035)
    REPORT COVERAGERevenue Forecast, Competitive Landscape, Growth Factors, and Trends
    BASE YEAR2024
    Market Forecast Period2025 - 2035
    Historical Data2019 - 2024
    Market Forecast UnitsUSD Billion
    Key Companies ProfiledMarket analysis in progress
    Segments CoveredMarket segmentation analysis in progress
    Key Market OpportunitiesGrowing consumer preference for sustainable products drives innovation in the Reusable Water Bottle Market.
    Key Market DynamicsRising consumer preference for sustainable products drives innovation and competition in the reusable water bottle market.
    Countries CoveredNorth America, Europe, APAC, South America, MEA

    FAQs

    What is the current valuation of the Reusable Water Bottle Market as of 2024?

    The overall market valuation was 9.728 USD Billion in 2024.

    What is the projected market size for the Reusable Water Bottle Market in 2035?

    The projected valuation for 2035 is 15.96 USD Billion.

    What is the expected CAGR for the Reusable Water Bottle Market during the forecast period 2025 - 2035?

    The expected CAGR for the market during this period is 4.6%.

    Which material segment holds the highest market value in the Reusable Water Bottle Market?

    The Plastic segment held a market value of 3.5 USD Billion in 2024 and is projected to reach 5.5 USD Billion.

    How does the market size for stainless steel reusable water bottles compare to glass bottles?

    In 2024, the stainless steel segment was valued at 2.5 USD Billion, while the glass segment was valued at 1.5 USD Billion.

    What distribution channel is expected to generate the highest revenue in the Reusable Water Bottle Market?

    Supermarkets generated a market value of 3.0 USD Billion in 2024, indicating strong performance.

    Which end-use segment is projected to have the largest market share in 2035?

    The Everyday Use segment is expected to grow from 3.5 USD Billion in 2024 to 5.5 USD Billion by 2035.

    Who are the key players in the Reusable Water Bottle Market?

    Key players include Nalgene, Hydro Flask, CamelBak, Contigo, Klean Kanteen, S'well, Thermos, Brita, and Lifestraw.

    What size of reusable water bottles is projected to see the most growth by 2035?

    The 1 liter size is projected to grow from 2.5 USD Billion in 2024 to 4.0 USD Billion by 2035.

    1. SECTION I: EXECUTIVE SUMMARY AND KEY HIGHLIGHTS
      1. | 1.1 EXECUTIVE SUMMARY
      2. | | 1.1.1 Market Overview
      3. | | 1.1.2 Key Findings
      4. | | 1.1.3 Market Segmentation
      5. | | 1.1.4 Competitive Landscape
      6. | | 1.1.5 Challenges and Opportunities
      7. | | 1.1.6 Future Outlook
    2. SECTION II: SCOPING, METHODOLOGY AND MARKET STRUCTURE
      1. | 2.1 MARKET INTRODUCTION
      2. | | 2.1.1 Definition
      3. | | 2.1.2 Scope of the study
      4. | | | 2.1.2.1 Research Objective
      5. | | | 2.1.2.2 Assumption
      6. | | | 2.1.2.3 Limitations
      7. | 2.2 RESEARCH METHODOLOGY
      8. | | 2.2.1 Overview
      9. | | 2.2.2 Data Mining
      10. | | 2.2.3 Secondary Research
      11. | | 2.2.4 Primary Research
      12. | | | 2.2.4.1 Primary Interviews and Information Gathering Process
      13. | | | 2.2.4.2 Breakdown of Primary Respondents
      14. | | 2.2.5 Forecasting Model
      15. | | 2.2.6 Market Size Estimation
      16. | | | 2.2.6.1 Bottom-Up Approach
      17. | | | 2.2.6.2 Top-Down Approach
      18. | | 2.2.7 Data Triangulation
      19. | | 2.2.8 Validation
    3. SECTION III: QUALITATIVE ANALYSIS
      1. | 3.1 MARKET DYNAMICS
      2. | | 3.1.1 Overview
      3. | | 3.1.2 Drivers
      4. | | 3.1.3 Restraints
      5. | | 3.1.4 Opportunities
      6. | 3.2 MARKET FACTOR ANALYSIS
      7. | | 3.2.1 Value chain Analysis
      8. | | 3.2.2 Porter's Five Forces Analysis
      9. | | | 3.2.2.1 Bargaining Power of Suppliers
      10. | | | 3.2.2.2 Bargaining Power of Buyers
      11. | | | 3.2.2.3 Threat of New Entrants
      12. | | | 3.2.2.4 Threat of Substitutes
      13. | | | 3.2.2.5 Intensity of Rivalry
      14. | | 3.2.3 COVID-19 Impact Analysis
      15. | | | 3.2.3.1 Market Impact Analysis
      16. | | | 3.2.3.2 Regional Impact
      17. | | | 3.2.3.3 Opportunity and Threat Analysis
    4. SECTION IV: QUANTITATIVE ANALYSIS
      1. | 4.1 Packaging & Transport, BY Material (USD Billion)
      2. | | 4.1.1 Plastic
      3. | | 4.1.2 Stainless Steel
      4. | | 4.1.3 Glass
      5. | | 4.1.4 Bamboo
      6. | | 4.1.5 Silicone
      7. | 4.2 Packaging & Transport, BY Size (USD Billion)
      8. | | 4.2.1 500 ml
      9. | | 4.2.2 750 ml
      10. | | 4.2.3 1 liter
      11. | | 4.2.4 1.5 liters
      12. | | 4.2.5 2 liters
      13. | 4.3 Packaging & Transport, BY Distribution Channel (USD Billion)
      14. | | 4.3.1 Online Retail
      15. | | 4.3.2 Supermarkets
      16. | | 4.3.3 Specialty Stores
      17. | | 4.3.4 Health Stores
      18. | | 4.3.5 Sporting Goods Stores
      19. | 4.4 Packaging & Transport, BY End Use (USD Billion)
      20. | | 4.4.1 Sports
      21. | | 4.4.2 Travel
      22. | | 4.4.3 Everyday Use
      23. | | 4.4.4 Business
      24. | | 4.4.5 Fitness
      25. | 4.5 Packaging & Transport, BY Region (USD Billion)
      26. | | 4.5.1 North America
      27. | | | 4.5.1.1 US
      28. | | | 4.5.1.2 Canada
      29. | | 4.5.2 Europe
      30. | | | 4.5.2.1 Germany
      31. | | | 4.5.2.2 UK
      32. | | | 4.5.2.3 France
      33. | | | 4.5.2.4 Russia
      34. | | | 4.5.2.5 Italy
      35. | | | 4.5.2.6 Spain
      36. | | | 4.5.2.7 Rest of Europe
      37. | | 4.5.3 APAC
      38. | | | 4.5.3.1 China
      39. | | | 4.5.3.2 India
      40. | | | 4.5.3.3 Japan
      41. | | | 4.5.3.4 South Korea
      42. | | | 4.5.3.5 Malaysia
      43. | | | 4.5.3.6 Thailand
      44. | | | 4.5.3.7 Indonesia
      45. | | | 4.5.3.8 Rest of APAC
      46. | | 4.5.4 South America
      47. | | | 4.5.4.1 Brazil
      48. | | | 4.5.4.2 Mexico
      49. | | | 4.5.4.3 Argentina
      50. | | | 4.5.4.4 Rest of South America
      51. | | 4.5.5 MEA
      52. | | | 4.5.5.1 GCC Countries
      53. | | | 4.5.5.2 South Africa
      54. | | | 4.5.5.3 Rest of MEA
    5. SECTION V: COMPETITIVE ANALYSIS
      1. | 5.1 Competitive Landscape
      2. | | 5.1.1 Overview
      3. | | 5.1.2 Competitive Analysis
      4. | | 5.1.3 Market share Analysis
      5. | | 5.1.4 Major Growth Strategy in the Packaging & Transport
      6. | | 5.1.5 Competitive Benchmarking
      7. | | 5.1.6 Leading Players in Terms of Number of Developments in the Packaging & Transport
      8. | | 5.1.7 Key developments and growth strategies
      9. | | | 5.1.7.1 New Product Launch/Service Deployment
      10. | | | 5.1.7.2 Merger & Acquisitions
      11. | | | 5.1.7.3 Joint Ventures
      12. | | 5.1.8 Major Players Financial Matrix
      13. | | | 5.1.8.1 Sales and Operating Income
      14. | | | 5.1.8.2 Major Players R&D Expenditure. 2023
      15. | 5.2 Company Profiles
      16. | | 5.2.1 Nalgene (US)
      17. | | | 5.2.1.1 Financial Overview
      18. | | | 5.2.1.2 Products Offered
      19. | | | 5.2.1.3 Key Developments
      20. | | | 5.2.1.4 SWOT Analysis
      21. | | | 5.2.1.5 Key Strategies
      22. | | 5.2.2 Hydro Flask (US)
      23. | | | 5.2.2.1 Financial Overview
      24. | | | 5.2.2.2 Products Offered
      25. | | | 5.2.2.3 Key Developments
      26. | | | 5.2.2.4 SWOT Analysis
      27. | | | 5.2.2.5 Key Strategies
      28. | | 5.2.3 CamelBak (US)
      29. | | | 5.2.3.1 Financial Overview
      30. | | | 5.2.3.2 Products Offered
      31. | | | 5.2.3.3 Key Developments
      32. | | | 5.2.3.4 SWOT Analysis
      33. | | | 5.2.3.5 Key Strategies
      34. | | 5.2.4 Contigo (US)
      35. | | | 5.2.4.1 Financial Overview
      36. | | | 5.2.4.2 Products Offered
      37. | | | 5.2.4.3 Key Developments
      38. | | | 5.2.4.4 SWOT Analysis
      39. | | | 5.2.4.5 Key Strategies
      40. | | 5.2.5 Klean Kanteen (US)
      41. | | | 5.2.5.1 Financial Overview
      42. | | | 5.2.5.2 Products Offered
      43. | | | 5.2.5.3 Key Developments
      44. | | | 5.2.5.4 SWOT Analysis
      45. | | | 5.2.5.5 Key Strategies
      46. | | 5.2.6 S'well (US)
      47. | | | 5.2.6.1 Financial Overview
      48. | | | 5.2.6.2 Products Offered
      49. | | | 5.2.6.3 Key Developments
      50. | | | 5.2.6.4 SWOT Analysis
      51. | | | 5.2.6.5 Key Strategies
      52. | | 5.2.7 Thermos (JP)
      53. | | | 5.2.7.1 Financial Overview
      54. | | | 5.2.7.2 Products Offered
      55. | | | 5.2.7.3 Key Developments
      56. | | | 5.2.7.4 SWOT Analysis
      57. | | | 5.2.7.5 Key Strategies
      58. | | 5.2.8 Brita (DE)
      59. | | | 5.2.8.1 Financial Overview
      60. | | | 5.2.8.2 Products Offered
      61. | | | 5.2.8.3 Key Developments
      62. | | | 5.2.8.4 SWOT Analysis
      63. | | | 5.2.8.5 Key Strategies
      64. | | 5.2.9 Lifestraw (US)
      65. | | | 5.2.9.1 Financial Overview
      66. | | | 5.2.9.2 Products Offered
      67. | | | 5.2.9.3 Key Developments
      68. | | | 5.2.9.4 SWOT Analysis
      69. | | | 5.2.9.5 Key Strategies
      70. | 5.3 Appendix
      71. | | 5.3.1 References
      72. | | 5.3.2 Related Reports
    6. LIST OF FIGURES
      1. | 6.1 MARKET SYNOPSIS
      2. | 6.2 NORTH AMERICA MARKET ANALYSIS
      3. | 6.3 US MARKET ANALYSIS BY MATERIAL
      4. | 6.4 US MARKET ANALYSIS BY SIZE
      5. | 6.5 US MARKET ANALYSIS BY DISTRIBUTION CHANNEL
      6. | 6.6 US MARKET ANALYSIS BY END USE
      7. | 6.7 CANADA MARKET ANALYSIS BY MATERIAL
      8. | 6.8 CANADA MARKET ANALYSIS BY SIZE
      9. | 6.9 CANADA MARKET ANALYSIS BY DISTRIBUTION CHANNEL
      10. | 6.10 CANADA MARKET ANALYSIS BY END USE
      11. | 6.11 EUROPE MARKET ANALYSIS
      12. | 6.12 GERMANY MARKET ANALYSIS BY MATERIAL
      13. | 6.13 GERMANY MARKET ANALYSIS BY SIZE
      14. | 6.14 GERMANY MARKET ANALYSIS BY DISTRIBUTION CHANNEL
      15. | 6.15 GERMANY MARKET ANALYSIS BY END USE
      16. | 6.16 UK MARKET ANALYSIS BY MATERIAL
      17. | 6.17 UK MARKET ANALYSIS BY SIZE
      18. | 6.18 UK MARKET ANALYSIS BY DISTRIBUTION CHANNEL
      19. | 6.19 UK MARKET ANALYSIS BY END USE
      20. | 6.20 FRANCE MARKET ANALYSIS BY MATERIAL
      21. | 6.21 FRANCE MARKET ANALYSIS BY SIZE
      22. | 6.22 FRANCE MARKET ANALYSIS BY DISTRIBUTION CHANNEL
      23. | 6.23 FRANCE MARKET ANALYSIS BY END USE
      24. | 6.24 RUSSIA MARKET ANALYSIS BY MATERIAL
      25. | 6.25 RUSSIA MARKET ANALYSIS BY SIZE
      26. | 6.26 RUSSIA MARKET ANALYSIS BY DISTRIBUTION CHANNEL
      27. | 6.27 RUSSIA MARKET ANALYSIS BY END USE
      28. | 6.28 ITALY MARKET ANALYSIS BY MATERIAL
      29. | 6.29 ITALY MARKET ANALYSIS BY SIZE
      30. | 6.30 ITALY MARKET ANALYSIS BY DISTRIBUTION CHANNEL
      31. | 6.31 ITALY MARKET ANALYSIS BY END USE
      32. | 6.32 SPAIN MARKET ANALYSIS BY MATERIAL
      33. | 6.33 SPAIN MARKET ANALYSIS BY SIZE
      34. | 6.34 SPAIN MARKET ANALYSIS BY DISTRIBUTION CHANNEL
      35. | 6.35 SPAIN MARKET ANALYSIS BY END USE
      36. | 6.36 REST OF EUROPE MARKET ANALYSIS BY MATERIAL
      37. | 6.37 REST OF EUROPE MARKET ANALYSIS BY SIZE
      38. | 6.38 REST OF EUROPE MARKET ANALYSIS BY DISTRIBUTION CHANNEL
      39. | 6.39 REST OF EUROPE MARKET ANALYSIS BY END USE
      40. | 6.40 APAC MARKET ANALYSIS
      41. | 6.41 CHINA MARKET ANALYSIS BY MATERIAL
      42. | 6.42 CHINA MARKET ANALYSIS BY SIZE
      43. | 6.43 CHINA MARKET ANALYSIS BY DISTRIBUTION CHANNEL
      44. | 6.44 CHINA MARKET ANALYSIS BY END USE
      45. | 6.45 INDIA MARKET ANALYSIS BY MATERIAL
      46. | 6.46 INDIA MARKET ANALYSIS BY SIZE
      47. | 6.47 INDIA MARKET ANALYSIS BY DISTRIBUTION CHANNEL
      48. | 6.48 INDIA MARKET ANALYSIS BY END USE
      49. | 6.49 JAPAN MARKET ANALYSIS BY MATERIAL
      50. | 6.50 JAPAN MARKET ANALYSIS BY SIZE
      51. | 6.51 JAPAN MARKET ANALYSIS BY DISTRIBUTION CHANNEL
      52. | 6.52 JAPAN MARKET ANALYSIS BY END USE
      53. | 6.53 SOUTH KOREA MARKET ANALYSIS BY MATERIAL
      54. | 6.54 SOUTH KOREA MARKET ANALYSIS BY SIZE
      55. | 6.55 SOUTH KOREA MARKET ANALYSIS BY DISTRIBUTION CHANNEL
      56. | 6.56 SOUTH KOREA MARKET ANALYSIS BY END USE
      57. | 6.57 MALAYSIA MARKET ANALYSIS BY MATERIAL
      58. | 6.58 MALAYSIA MARKET ANALYSIS BY SIZE
      59. | 6.59 MALAYSIA MARKET ANALYSIS BY DISTRIBUTION CHANNEL
      60. | 6.60 MALAYSIA MARKET ANALYSIS BY END USE
      61. | 6.61 THAILAND MARKET ANALYSIS BY MATERIAL
      62. | 6.62 THAILAND MARKET ANALYSIS BY SIZE
      63. | 6.63 THAILAND MARKET ANALYSIS BY DISTRIBUTION CHANNEL
      64. | 6.64 THAILAND MARKET ANALYSIS BY END USE
      65. | 6.65 INDONESIA MARKET ANALYSIS BY MATERIAL
      66. | 6.66 INDONESIA MARKET ANALYSIS BY SIZE
      67. | 6.67 INDONESIA MARKET ANALYSIS BY DISTRIBUTION CHANNEL
      68. | 6.68 INDONESIA MARKET ANALYSIS BY END USE
      69. | 6.69 REST OF APAC MARKET ANALYSIS BY MATERIAL
      70. | 6.70 REST OF APAC MARKET ANALYSIS BY SIZE
      71. | 6.71 REST OF APAC MARKET ANALYSIS BY DISTRIBUTION CHANNEL
      72. | 6.72 REST OF APAC MARKET ANALYSIS BY END USE
      73. | 6.73 SOUTH AMERICA MARKET ANALYSIS
      74. | 6.74 BRAZIL MARKET ANALYSIS BY MATERIAL
      75. | 6.75 BRAZIL MARKET ANALYSIS BY SIZE
      76. | 6.76 BRAZIL MARKET ANALYSIS BY DISTRIBUTION CHANNEL
      77. | 6.77 BRAZIL MARKET ANALYSIS BY END USE
      78. | 6.78 MEXICO MARKET ANALYSIS BY MATERIAL
      79. | 6.79 MEXICO MARKET ANALYSIS BY SIZE
      80. | 6.80 MEXICO MARKET ANALYSIS BY DISTRIBUTION CHANNEL
      81. | 6.81 MEXICO MARKET ANALYSIS BY END USE
      82. | 6.82 ARGENTINA MARKET ANALYSIS BY MATERIAL
      83. | 6.83 ARGENTINA MARKET ANALYSIS BY SIZE
      84. | 6.84 ARGENTINA MARKET ANALYSIS BY DISTRIBUTION CHANNEL
      85. | 6.85 ARGENTINA MARKET ANALYSIS BY END USE
      86. | 6.86 REST OF SOUTH AMERICA MARKET ANALYSIS BY MATERIAL
      87. | 6.87 REST OF SOUTH AMERICA MARKET ANALYSIS BY SIZE
      88. | 6.88 REST OF SOUTH AMERICA MARKET ANALYSIS BY DISTRIBUTION CHANNEL
      89. | 6.89 REST OF SOUTH AMERICA MARKET ANALYSIS BY END USE
      90. | 6.90 MEA MARKET ANALYSIS
      91. | 6.91 GCC COUNTRIES MARKET ANALYSIS BY MATERIAL
      92. | 6.92 GCC COUNTRIES MARKET ANALYSIS BY SIZE
      93. | 6.93 GCC COUNTRIES MARKET ANALYSIS BY DISTRIBUTION CHANNEL
      94. | 6.94 GCC COUNTRIES MARKET ANALYSIS BY END USE
      95. | 6.95 SOUTH AFRICA MARKET ANALYSIS BY MATERIAL
      96. | 6.96 SOUTH AFRICA MARKET ANALYSIS BY SIZE
      97. | 6.97 SOUTH AFRICA MARKET ANALYSIS BY DISTRIBUTION CHANNEL
      98. | 6.98 SOUTH AFRICA MARKET ANALYSIS BY END USE
      99. | 6.99 REST OF MEA MARKET ANALYSIS BY MATERIAL
      100. | 6.100 REST OF MEA MARKET ANALYSIS BY SIZE
      101. | 6.101 REST OF MEA MARKET ANALYSIS BY DISTRIBUTION CHANNEL
      102. | 6.102 REST OF MEA MARKET ANALYSIS BY END USE
      103. | 6.103 KEY BUYING CRITERIA OF PACKAGING & TRANSPORT
      104. | 6.104 RESEARCH PROCESS OF MRFR
      105. | 6.105 DRO ANALYSIS OF PACKAGING & TRANSPORT
      106. | 6.106 DRIVERS IMPACT ANALYSIS: PACKAGING & TRANSPORT
      107. | 6.107 RESTRAINTS IMPACT ANALYSIS: PACKAGING & TRANSPORT
      108. | 6.108 SUPPLY / VALUE CHAIN: PACKAGING & TRANSPORT
      109. | 6.109 PACKAGING & TRANSPORT, BY MATERIAL, 2024 (% SHARE)
      110. | 6.110 PACKAGING & TRANSPORT, BY MATERIAL, 2024 TO 2035 (USD Billion)
      111. | 6.111 PACKAGING & TRANSPORT, BY SIZE, 2024 (% SHARE)
      112. | 6.112 PACKAGING & TRANSPORT, BY SIZE, 2024 TO 2035 (USD Billion)
      113. | 6.113 PACKAGING & TRANSPORT, BY DISTRIBUTION CHANNEL, 2024 (% SHARE)
      114. | 6.114 PACKAGING & TRANSPORT, BY DISTRIBUTION CHANNEL, 2024 TO 2035 (USD Billion)
      115. | 6.115 PACKAGING & TRANSPORT, BY END USE, 2024 (% SHARE)
      116. | 6.116 PACKAGING & TRANSPORT, BY END USE, 2024 TO 2035 (USD Billion)
      117. | 6.117 BENCHMARKING OF MAJOR COMPETITORS
    7. LIST OF TABLES
      1. | 7.1 LIST OF ASSUMPTIONS
      2. | | 7.1.1
      3. | 7.2 North America MARKET SIZE ESTIMATES; FORECAST
      4. | | 7.2.1 BY MATERIAL, 2025-2035 (USD Billion)
      5. | | 7.2.2 BY SIZE, 2025-2035 (USD Billion)
      6. | | 7.2.3 BY DISTRIBUTION CHANNEL, 2025-2035 (USD Billion)
      7. | | 7.2.4 BY END USE, 2025-2035 (USD Billion)
      8. | 7.3 US MARKET SIZE ESTIMATES; FORECAST
      9. | | 7.3.1 BY MATERIAL, 2025-2035 (USD Billion)
      10. | | 7.3.2 BY SIZE, 2025-2035 (USD Billion)
      11. | | 7.3.3 BY DISTRIBUTION CHANNEL, 2025-2035 (USD Billion)
      12. | | 7.3.4 BY END USE, 2025-2035 (USD Billion)
      13. | 7.4 Canada MARKET SIZE ESTIMATES; FORECAST
      14. | | 7.4.1 BY MATERIAL, 2025-2035 (USD Billion)
      15. | | 7.4.2 BY SIZE, 2025-2035 (USD Billion)
      16. | | 7.4.3 BY DISTRIBUTION CHANNEL, 2025-2035 (USD Billion)
      17. | | 7.4.4 BY END USE, 2025-2035 (USD Billion)
      18. | 7.5 Europe MARKET SIZE ESTIMATES; FORECAST
      19. | | 7.5.1 BY MATERIAL, 2025-2035 (USD Billion)
      20. | | 7.5.2 BY SIZE, 2025-2035 (USD Billion)
      21. | | 7.5.3 BY DISTRIBUTION CHANNEL, 2025-2035 (USD Billion)
      22. | | 7.5.4 BY END USE, 2025-2035 (USD Billion)
      23. | 7.6 Germany MARKET SIZE ESTIMATES; FORECAST
      24. | | 7.6.1 BY MATERIAL, 2025-2035 (USD Billion)
      25. | | 7.6.2 BY SIZE, 2025-2035 (USD Billion)
      26. | | 7.6.3 BY DISTRIBUTION CHANNEL, 2025-2035 (USD Billion)
      27. | | 7.6.4 BY END USE, 2025-2035 (USD Billion)
      28. | 7.7 UK MARKET SIZE ESTIMATES; FORECAST
      29. | | 7.7.1 BY MATERIAL, 2025-2035 (USD Billion)
      30. | | 7.7.2 BY SIZE, 2025-2035 (USD Billion)
      31. | | 7.7.3 BY DISTRIBUTION CHANNEL, 2025-2035 (USD Billion)
      32. | | 7.7.4 BY END USE, 2025-2035 (USD Billion)
      33. | 7.8 France MARKET SIZE ESTIMATES; FORECAST
      34. | | 7.8.1 BY MATERIAL, 2025-2035 (USD Billion)
      35. | | 7.8.2 BY SIZE, 2025-2035 (USD Billion)
      36. | | 7.8.3 BY DISTRIBUTION CHANNEL, 2025-2035 (USD Billion)
      37. | | 7.8.4 BY END USE, 2025-2035 (USD Billion)
      38. | 7.9 Russia MARKET SIZE ESTIMATES; FORECAST
      39. | | 7.9.1 BY MATERIAL, 2025-2035 (USD Billion)
      40. | | 7.9.2 BY SIZE, 2025-2035 (USD Billion)
      41. | | 7.9.3 BY DISTRIBUTION CHANNEL, 2025-2035 (USD Billion)
      42. | | 7.9.4 BY END USE, 2025-2035 (USD Billion)
      43. | 7.10 Italy MARKET SIZE ESTIMATES; FORECAST
      44. | | 7.10.1 BY MATERIAL, 2025-2035 (USD Billion)
      45. | | 7.10.2 BY SIZE, 2025-2035 (USD Billion)
      46. | | 7.10.3 BY DISTRIBUTION CHANNEL, 2025-2035 (USD Billion)
      47. | | 7.10.4 BY END USE, 2025-2035 (USD Billion)
      48. | 7.11 Spain MARKET SIZE ESTIMATES; FORECAST
      49. | | 7.11.1 BY MATERIAL, 2025-2035 (USD Billion)
      50. | | 7.11.2 BY SIZE, 2025-2035 (USD Billion)
      51. | | 7.11.3 BY DISTRIBUTION CHANNEL, 2025-2035 (USD Billion)
      52. | | 7.11.4 BY END USE, 2025-2035 (USD Billion)
      53. | 7.12 Rest of Europe MARKET SIZE ESTIMATES; FORECAST
      54. | | 7.12.1 BY MATERIAL, 2025-2035 (USD Billion)
      55. | | 7.12.2 BY SIZE, 2025-2035 (USD Billion)
      56. | | 7.12.3 BY DISTRIBUTION CHANNEL, 2025-2035 (USD Billion)
      57. | | 7.12.4 BY END USE, 2025-2035 (USD Billion)
      58. | 7.13 APAC MARKET SIZE ESTIMATES; FORECAST
      59. | | 7.13.1 BY MATERIAL, 2025-2035 (USD Billion)
      60. | | 7.13.2 BY SIZE, 2025-2035 (USD Billion)
      61. | | 7.13.3 BY DISTRIBUTION CHANNEL, 2025-2035 (USD Billion)
      62. | | 7.13.4 BY END USE, 2025-2035 (USD Billion)
      63. | 7.14 China MARKET SIZE ESTIMATES; FORECAST
      64. | | 7.14.1 BY MATERIAL, 2025-2035 (USD Billion)
      65. | | 7.14.2 BY SIZE, 2025-2035 (USD Billion)
      66. | | 7.14.3 BY DISTRIBUTION CHANNEL, 2025-2035 (USD Billion)
      67. | | 7.14.4 BY END USE, 2025-2035 (USD Billion)
      68. | 7.15 India MARKET SIZE ESTIMATES; FORECAST
      69. | | 7.15.1 BY MATERIAL, 2025-2035 (USD Billion)
      70. | | 7.15.2 BY SIZE, 2025-2035 (USD Billion)
      71. | | 7.15.3 BY DISTRIBUTION CHANNEL, 2025-2035 (USD Billion)
      72. | | 7.15.4 BY END USE, 2025-2035 (USD Billion)
      73. | 7.16 Japan MARKET SIZE ESTIMATES; FORECAST
      74. | | 7.16.1 BY MATERIAL, 2025-2035 (USD Billion)
      75. | | 7.16.2 BY SIZE, 2025-2035 (USD Billion)
      76. | | 7.16.3 BY DISTRIBUTION CHANNEL, 2025-2035 (USD Billion)
      77. | | 7.16.4 BY END USE, 2025-2035 (USD Billion)
      78. | 7.17 South Korea MARKET SIZE ESTIMATES; FORECAST
      79. | | 7.17.1 BY MATERIAL, 2025-2035 (USD Billion)
      80. | | 7.17.2 BY SIZE, 2025-2035 (USD Billion)
      81. | | 7.17.3 BY DISTRIBUTION CHANNEL, 2025-2035 (USD Billion)
      82. | | 7.17.4 BY END USE, 2025-2035 (USD Billion)
      83. | 7.18 Malaysia MARKET SIZE ESTIMATES; FORECAST
      84. | | 7.18.1 BY MATERIAL, 2025-2035 (USD Billion)
      85. | | 7.18.2 BY SIZE, 2025-2035 (USD Billion)
      86. | | 7.18.3 BY DISTRIBUTION CHANNEL, 2025-2035 (USD Billion)
      87. | | 7.18.4 BY END USE, 2025-2035 (USD Billion)
      88. | 7.19 Thailand MARKET SIZE ESTIMATES; FORECAST
      89. | | 7.19.1 BY MATERIAL, 2025-2035 (USD Billion)
      90. | | 7.19.2 BY SIZE, 2025-2035 (USD Billion)
      91. | | 7.19.3 BY DISTRIBUTION CHANNEL, 2025-2035 (USD Billion)
      92. | | 7.19.4 BY END USE, 2025-2035 (USD Billion)
      93. | 7.20 Indonesia MARKET SIZE ESTIMATES; FORECAST
      94. | | 7.20.1 BY MATERIAL, 2025-2035 (USD Billion)
      95. | | 7.20.2 BY SIZE, 2025-2035 (USD Billion)
      96. | | 7.20.3 BY DISTRIBUTION CHANNEL, 2025-2035 (USD Billion)
      97. | | 7.20.4 BY END USE, 2025-2035 (USD Billion)
      98. | 7.21 Rest of APAC MARKET SIZE ESTIMATES; FORECAST
      99. | | 7.21.1 BY MATERIAL, 2025-2035 (USD Billion)
      100. | | 7.21.2 BY SIZE, 2025-2035 (USD Billion)
      101. | | 7.21.3 BY DISTRIBUTION CHANNEL, 2025-2035 (USD Billion)
      102. | | 7.21.4 BY END USE, 2025-2035 (USD Billion)
      103. | 7.22 South America MARKET SIZE ESTIMATES; FORECAST
      104. | | 7.22.1 BY MATERIAL, 2025-2035 (USD Billion)
      105. | | 7.22.2 BY SIZE, 2025-2035 (USD Billion)
      106. | | 7.22.3 BY DISTRIBUTION CHANNEL, 2025-2035 (USD Billion)
      107. | | 7.22.4 BY END USE, 2025-2035 (USD Billion)
      108. | 7.23 Brazil MARKET SIZE ESTIMATES; FORECAST
      109. | | 7.23.1 BY MATERIAL, 2025-2035 (USD Billion)
      110. | | 7.23.2 BY SIZE, 2025-2035 (USD Billion)
      111. | | 7.23.3 BY DISTRIBUTION CHANNEL, 2025-2035 (USD Billion)
      112. | | 7.23.4 BY END USE, 2025-2035 (USD Billion)
      113. | 7.24 Mexico MARKET SIZE ESTIMATES; FORECAST
      114. | | 7.24.1 BY MATERIAL, 2025-2035 (USD Billion)
      115. | | 7.24.2 BY SIZE, 2025-2035 (USD Billion)
      116. | | 7.24.3 BY DISTRIBUTION CHANNEL, 2025-2035 (USD Billion)
      117. | | 7.24.4 BY END USE, 2025-2035 (USD Billion)
      118. | 7.25 Argentina MARKET SIZE ESTIMATES; FORECAST
      119. | | 7.25.1 BY MATERIAL, 2025-2035 (USD Billion)
      120. | | 7.25.2 BY SIZE, 2025-2035 (USD Billion)
      121. | | 7.25.3 BY DISTRIBUTION CHANNEL, 2025-2035 (USD Billion)
      122. | | 7.25.4 BY END USE, 2025-2035 (USD Billion)
      123. | 7.26 Rest of South America MARKET SIZE ESTIMATES; FORECAST
      124. | | 7.26.1 BY MATERIAL, 2025-2035 (USD Billion)
      125. | | 7.26.2 BY SIZE, 2025-2035 (USD Billion)
      126. | | 7.26.3 BY DISTRIBUTION CHANNEL, 2025-2035 (USD Billion)
      127. | | 7.26.4 BY END USE, 2025-2035 (USD Billion)
      128. | 7.27 MEA MARKET SIZE ESTIMATES; FORECAST
      129. | | 7.27.1 BY MATERIAL, 2025-2035 (USD Billion)
      130. | | 7.27.2 BY SIZE, 2025-2035 (USD Billion)
      131. | | 7.27.3 BY DISTRIBUTION CHANNEL, 2025-2035 (USD Billion)
      132. | | 7.27.4 BY END USE, 2025-2035 (USD Billion)
      133. | 7.28 GCC Countries MARKET SIZE ESTIMATES; FORECAST
      134. | | 7.28.1 BY MATERIAL, 2025-2035 (USD Billion)
      135. | | 7.28.2 BY SIZE, 2025-2035 (USD Billion)
      136. | | 7.28.3 BY DISTRIBUTION CHANNEL, 2025-2035 (USD Billion)
      137. | | 7.28.4 BY END USE, 2025-2035 (USD Billion)
      138. | 7.29 South Africa MARKET SIZE ESTIMATES; FORECAST
      139. | | 7.29.1 BY MATERIAL, 2025-2035 (USD Billion)
      140. | | 7.29.2 BY SIZE, 2025-2035 (USD Billion)
      141. | | 7.29.3 BY DISTRIBUTION CHANNEL, 2025-2035 (USD Billion)
      142. | | 7.29.4 BY END USE, 2025-2035 (USD Billion)
      143. | 7.30 Rest of MEA MARKET SIZE ESTIMATES; FORECAST
      144. | | 7.30.1 BY MATERIAL, 2025-2035 (USD Billion)
      145. | | 7.30.2 BY SIZE, 2025-2035 (USD Billion)
      146. | | 7.30.3 BY DISTRIBUTION CHANNEL, 2025-2035 (USD Billion)
      147. | | 7.30.4 BY END USE, 2025-2035 (USD Billion)
      148. | 7.31 PRODUCT LAUNCH/PRODUCT DEVELOPMENT/APPROVAL
      149. | | 7.31.1
      150. | 7.32 ACQUISITION/PARTNERSHIP
      151. | | 7.32.1

    Reusable Water Bottle Market Segmentation

    • Reusable Water Bottle Market By Material (USD Billion, 2019-2035)

      • Plastic
      • Stainless Steel
      • Glass
      • Bamboo
      • Silicone


    • Reusable Water Bottle Market By Size (USD Billion, 2019-2035)

      • 500 ml
      • 750 ml
      • 1 liter
      • 1.5 liters
      • 2 liters


    • Reusable Water Bottle Market By Distribution Channel (USD Billion, 2019-2035)

      • Online Retail
      • Supermarkets
      • Specialty Stores
      • Health Stores
      • Sporting Goods Stores


    • Reusable Water Bottle Market By End Use (USD Billion, 2019-2035)

      • Sports
      • Travel
      • Everyday Use
      • Business
      • Fitness


    • Reusable Water Bottle Market By Regional (USD Billion, 2019-2035)

      • North America
      • Europe
      • South America
      • Asia Pacific
      • Middle East and Africa


    Reusable Water Bottle Market Regional Outlook (USD Billion, 2019-2035)


    • North America Outlook (USD Billion, 2019-2035)

      • North America Reusable Water Bottle Market by Material Type

        • Plastic
        • Stainless Steel
        • Glass
        • Bamboo
        • Silicone
      • North America Reusable Water Bottle Market by Size Type

        • 500 ml
        • 750 ml
        • 1 liter
        • 1.5 liters
        • 2 liters
      • North America Reusable Water Bottle Market by Distribution Channel Type

        • Online Retail
        • Supermarkets
        • Specialty Stores
        • Health Stores
        • Sporting Goods Stores
      • North America Reusable Water Bottle Market by End Use Type

        • Sports
        • Travel
        • Everyday Use
        • Business
        • Fitness
      • North America Reusable Water Bottle Market by Regional Type

        • US
        • Canada
      • US Outlook (USD Billion, 2019-2035)
      • US Reusable Water Bottle Market by Material Type

        • Plastic
        • Stainless Steel
        • Glass
        • Bamboo
        • Silicone
      • US Reusable Water Bottle Market by Size Type

        • 500 ml
        • 750 ml
        • 1 liter
        • 1.5 liters
        • 2 liters
      • US Reusable Water Bottle Market by Distribution Channel Type

        • Online Retail
        • Supermarkets
        • Specialty Stores
        • Health Stores
        • Sporting Goods Stores
      • US Reusable Water Bottle Market by End Use Type

        • Sports
        • Travel
        • Everyday Use
        • Business
        • Fitness
      • CANADA Outlook (USD Billion, 2019-2035)
      • CANADA Reusable Water Bottle Market by Material Type

        • Plastic
        • Stainless Steel
        • Glass
        • Bamboo
        • Silicone
      • CANADA Reusable Water Bottle Market by Size Type

        • 500 ml
        • 750 ml
        • 1 liter
        • 1.5 liters
        • 2 liters
      • CANADA Reusable Water Bottle Market by Distribution Channel Type

        • Online Retail
        • Supermarkets
        • Specialty Stores
        • Health Stores
        • Sporting Goods Stores
      • CANADA Reusable Water Bottle Market by End Use Type

        • Sports
        • Travel
        • Everyday Use
        • Business
        • Fitness
    • Europe Outlook (USD Billion, 2019-2035)

      • Europe Reusable Water Bottle Market by Material Type

        • Plastic
        • Stainless Steel
        • Glass
        • Bamboo
        • Silicone
      • Europe Reusable Water Bottle Market by Size Type

        • 500 ml
        • 750 ml
        • 1 liter
        • 1.5 liters
        • 2 liters
      • Europe Reusable Water Bottle Market by Distribution Channel Type

        • Online Retail
        • Supermarkets
        • Specialty Stores
        • Health Stores
        • Sporting Goods Stores
      • Europe Reusable Water Bottle Market by End Use Type

        • Sports
        • Travel
        • Everyday Use
        • Business
        • Fitness
      • Europe Reusable Water Bottle Market by Regional Type

        • Germany
        • UK
        • France
        • Russia
        • Italy
        • Spain
        • Rest of Europe
      • GERMANY Outlook (USD Billion, 2019-2035)
      • GERMANY Reusable Water Bottle Market by Material Type

        • Plastic
        • Stainless Steel
        • Glass
        • Bamboo
        • Silicone
      • GERMANY Reusable Water Bottle Market by Size Type

        • 500 ml
        • 750 ml
        • 1 liter
        • 1.5 liters
        • 2 liters
      • GERMANY Reusable Water Bottle Market by Distribution Channel Type

        • Online Retail
        • Supermarkets
        • Specialty Stores
        • Health Stores
        • Sporting Goods Stores
      • GERMANY Reusable Water Bottle Market by End Use Type

        • Sports
        • Travel
        • Everyday Use
        • Business
        • Fitness
      • UK Outlook (USD Billion, 2019-2035)
      • UK Reusable Water Bottle Market by Material Type

        • Plastic
        • Stainless Steel
        • Glass
        • Bamboo
        • Silicone
      • UK Reusable Water Bottle Market by Size Type

        • 500 ml
        • 750 ml
        • 1 liter
        • 1.5 liters
        • 2 liters
      • UK Reusable Water Bottle Market by Distribution Channel Type

        • Online Retail
        • Supermarkets
        • Specialty Stores
        • Health Stores
        • Sporting Goods Stores
      • UK Reusable Water Bottle Market by End Use Type

        • Sports
        • Travel
        • Everyday Use
        • Business
        • Fitness
      • FRANCE Outlook (USD Billion, 2019-2035)
      • FRANCE Reusable Water Bottle Market by Material Type

        • Plastic
        • Stainless Steel
        • Glass
        • Bamboo
        • Silicone
      • FRANCE Reusable Water Bottle Market by Size Type

        • 500 ml
        • 750 ml
        • 1 liter
        • 1.5 liters
        • 2 liters
      • FRANCE Reusable Water Bottle Market by Distribution Channel Type

        • Online Retail
        • Supermarkets
        • Specialty Stores
        • Health Stores
        • Sporting Goods Stores
      • FRANCE Reusable Water Bottle Market by End Use Type

        • Sports
        • Travel
        • Everyday Use
        • Business
        • Fitness
      • RUSSIA Outlook (USD Billion, 2019-2035)
      • RUSSIA Reusable Water Bottle Market by Material Type

        • Plastic
        • Stainless Steel
        • Glass
        • Bamboo
        • Silicone
      • RUSSIA Reusable Water Bottle Market by Size Type

        • 500 ml
        • 750 ml
        • 1 liter
        • 1.5 liters
        • 2 liters
      • RUSSIA Reusable Water Bottle Market by Distribution Channel Type

        • Online Retail
        • Supermarkets
        • Specialty Stores
        • Health Stores
        • Sporting Goods Stores
      • RUSSIA Reusable Water Bottle Market by End Use Type

        • Sports
        • Travel
        • Everyday Use
        • Business
        • Fitness
      • ITALY Outlook (USD Billion, 2019-2035)
      • ITALY Reusable Water Bottle Market by Material Type

        • Plastic
        • Stainless Steel
        • Glass
        • Bamboo
        • Silicone
      • ITALY Reusable Water Bottle Market by Size Type

        • 500 ml
        • 750 ml
        • 1 liter
        • 1.5 liters
        • 2 liters
      • ITALY Reusable Water Bottle Market by Distribution Channel Type

        • Online Retail
        • Supermarkets
        • Specialty Stores
        • Health Stores
        • Sporting Goods Stores
      • ITALY Reusable Water Bottle Market by End Use Type

        • Sports
        • Travel
        • Everyday Use
        • Business
        • Fitness
      • SPAIN Outlook (USD Billion, 2019-2035)
      • SPAIN Reusable Water Bottle Market by Material Type

        • Plastic
        • Stainless Steel
        • Glass
        • Bamboo
        • Silicone
      • SPAIN Reusable Water Bottle Market by Size Type

        • 500 ml
        • 750 ml
        • 1 liter
        • 1.5 liters
        • 2 liters
      • SPAIN Reusable Water Bottle Market by Distribution Channel Type

        • Online Retail
        • Supermarkets
        • Specialty Stores
        • Health Stores
        • Sporting Goods Stores
      • SPAIN Reusable Water Bottle Market by End Use Type

        • Sports
        • Travel
        • Everyday Use
        • Business
        • Fitness
      • REST OF EUROPE Outlook (USD Billion, 2019-2035)
      • REST OF EUROPE Reusable Water Bottle Market by Material Type

        • Plastic
        • Stainless Steel
        • Glass
        • Bamboo
        • Silicone
      • REST OF EUROPE Reusable Water Bottle Market by Size Type

        • 500 ml
        • 750 ml
        • 1 liter
        • 1.5 liters
        • 2 liters
      • REST OF EUROPE Reusable Water Bottle Market by Distribution Channel Type

        • Online Retail
        • Supermarkets
        • Specialty Stores
        • Health Stores
        • Sporting Goods Stores
      • REST OF EUROPE Reusable Water Bottle Market by End Use Type

        • Sports
        • Travel
        • Everyday Use
        • Business
        • Fitness
    • APAC Outlook (USD Billion, 2019-2035)

      • APAC Reusable Water Bottle Market by Material Type

        • Plastic
        • Stainless Steel
        • Glass
        • Bamboo
        • Silicone
      • APAC Reusable Water Bottle Market by Size Type

        • 500 ml
        • 750 ml
        • 1 liter
        • 1.5 liters
        • 2 liters
      • APAC Reusable Water Bottle Market by Distribution Channel Type

        • Online Retail
        • Supermarkets
        • Specialty Stores
        • Health Stores
        • Sporting Goods Stores
      • APAC Reusable Water Bottle Market by End Use Type

        • Sports
        • Travel
        • Everyday Use
        • Business
        • Fitness
      • APAC Reusable Water Bottle Market by Regional Type

        • China
        • India
        • Japan
        • South Korea
        • Malaysia
        • Thailand
        • Indonesia
        • Rest of APAC
      • CHINA Outlook (USD Billion, 2019-2035)
      • CHINA Reusable Water Bottle Market by Material Type

        • Plastic
        • Stainless Steel
        • Glass
        • Bamboo
        • Silicone
      • CHINA Reusable Water Bottle Market by Size Type

        • 500 ml
        • 750 ml
        • 1 liter
        • 1.5 liters
        • 2 liters
      • CHINA Reusable Water Bottle Market by Distribution Channel Type

        • Online Retail
        • Supermarkets
        • Specialty Stores
        • Health Stores
        • Sporting Goods Stores
      • CHINA Reusable Water Bottle Market by End Use Type

        • Sports
        • Travel
        • Everyday Use
        • Business
        • Fitness
      • INDIA Outlook (USD Billion, 2019-2035)
      • INDIA Reusable Water Bottle Market by Material Type

        • Plastic
        • Stainless Steel
        • Glass
        • Bamboo
        • Silicone
      • INDIA Reusable Water Bottle Market by Size Type

        • 500 ml
        • 750 ml
        • 1 liter
        • 1.5 liters
        • 2 liters
      • INDIA Reusable Water Bottle Market by Distribution Channel Type

        • Online Retail
        • Supermarkets
        • Specialty Stores
        • Health Stores
        • Sporting Goods Stores
      • INDIA Reusable Water Bottle Market by End Use Type

        • Sports
        • Travel
        • Everyday Use
        • Business
        • Fitness
      • JAPAN Outlook (USD Billion, 2019-2035)
      • JAPAN Reusable Water Bottle Market by Material Type

        • Plastic
        • Stainless Steel
        • Glass
        • Bamboo
        • Silicone
      • JAPAN Reusable Water Bottle Market by Size Type

        • 500 ml
        • 750 ml
        • 1 liter
        • 1.5 liters
        • 2 liters
      • JAPAN Reusable Water Bottle Market by Distribution Channel Type

        • Online Retail
        • Supermarkets
        • Specialty Stores
        • Health Stores
        • Sporting Goods Stores
      • JAPAN Reusable Water Bottle Market by End Use Type

        • Sports
        • Travel
        • Everyday Use
        • Business
        • Fitness
      • SOUTH KOREA Outlook (USD Billion, 2019-2035)
      • SOUTH KOREA Reusable Water Bottle Market by Material Type

        • Plastic
        • Stainless Steel
        • Glass
        • Bamboo
        • Silicone
      • SOUTH KOREA Reusable Water Bottle Market by Size Type

        • 500 ml
        • 750 ml
        • 1 liter
        • 1.5 liters
        • 2 liters
      • SOUTH KOREA Reusable Water Bottle Market by Distribution Channel Type

        • Online Retail
        • Supermarkets
        • Specialty Stores
        • Health Stores
        • Sporting Goods Stores
      • SOUTH KOREA Reusable Water Bottle Market by End Use Type

        • Sports
        • Travel
        • Everyday Use
        • Business
        • Fitness
      • MALAYSIA Outlook (USD Billion, 2019-2035)
      • MALAYSIA Reusable Water Bottle Market by Material Type

        • Plastic
        • Stainless Steel
        • Glass
        • Bamboo
        • Silicone
      • MALAYSIA Reusable Water Bottle Market by Size Type

        • 500 ml
        • 750 ml
        • 1 liter
        • 1.5 liters
        • 2 liters
      • MALAYSIA Reusable Water Bottle Market by Distribution Channel Type

        • Online Retail
        • Supermarkets
        • Specialty Stores
        • Health Stores
        • Sporting Goods Stores
      • MALAYSIA Reusable Water Bottle Market by End Use Type

        • Sports
        • Travel
        • Everyday Use
        • Business
        • Fitness
      • THAILAND Outlook (USD Billion, 2019-2035)
      • THAILAND Reusable Water Bottle Market by Material Type

        • Plastic
        • Stainless Steel
        • Glass
        • Bamboo
        • Silicone
      • THAILAND Reusable Water Bottle Market by Size Type

        • 500 ml
        • 750 ml
        • 1 liter
        • 1.5 liters
        • 2 liters
      • THAILAND Reusable Water Bottle Market by Distribution Channel Type

        • Online Retail
        • Supermarkets
        • Specialty Stores
        • Health Stores
        • Sporting Goods Stores
      • THAILAND Reusable Water Bottle Market by End Use Type

        • Sports
        • Travel
        • Everyday Use
        • Business
        • Fitness
      • INDONESIA Outlook (USD Billion, 2019-2035)
      • INDONESIA Reusable Water Bottle Market by Material Type

        • Plastic
        • Stainless Steel
        • Glass
        • Bamboo
        • Silicone
      • INDONESIA Reusable Water Bottle Market by Size Type

        • 500 ml
        • 750 ml
        • 1 liter
        • 1.5 liters
        • 2 liters
      • INDONESIA Reusable Water Bottle Market by Distribution Channel Type

        • Online Retail
        • Supermarkets
        • Specialty Stores
        • Health Stores
        • Sporting Goods Stores
      • INDONESIA Reusable Water Bottle Market by End Use Type

        • Sports
        • Travel
        • Everyday Use
        • Business
        • Fitness
      • REST OF APAC Outlook (USD Billion, 2019-2035)
      • REST OF APAC Reusable Water Bottle Market by Material Type

        • Plastic
        • Stainless Steel
        • Glass
        • Bamboo
        • Silicone
      • REST OF APAC Reusable Water Bottle Market by Size Type

        • 500 ml
        • 750 ml
        • 1 liter
        • 1.5 liters
        • 2 liters
      • REST OF APAC Reusable Water Bottle Market by Distribution Channel Type

        • Online Retail
        • Supermarkets
        • Specialty Stores
        • Health Stores
        • Sporting Goods Stores
      • REST OF APAC Reusable Water Bottle Market by End Use Type

        • Sports
        • Travel
        • Everyday Use
        • Business
        • Fitness
    • South America Outlook (USD Billion, 2019-2035)

      • South America Reusable Water Bottle Market by Material Type

        • Plastic
        • Stainless Steel
        • Glass
        • Bamboo
        • Silicone
      • South America Reusable Water Bottle Market by Size Type

        • 500 ml
        • 750 ml
        • 1 liter
        • 1.5 liters
        • 2 liters
      • South America Reusable Water Bottle Market by Distribution Channel Type

        • Online Retail
        • Supermarkets
        • Specialty Stores
        • Health Stores
        • Sporting Goods Stores
      • South America Reusable Water Bottle Market by End Use Type

        • Sports
        • Travel
        • Everyday Use
        • Business
        • Fitness
      • South America Reusable Water Bottle Market by Regional Type

        • Brazil
        • Mexico
        • Argentina
        • Rest of South America
      • BRAZIL Outlook (USD Billion, 2019-2035)
      • BRAZIL Reusable Water Bottle Market by Material Type

        • Plastic
        • Stainless Steel
        • Glass
        • Bamboo
        • Silicone
      • BRAZIL Reusable Water Bottle Market by Size Type

        • 500 ml
        • 750 ml
        • 1 liter
        • 1.5 liters
        • 2 liters
      • BRAZIL Reusable Water Bottle Market by Distribution Channel Type

        • Online Retail
        • Supermarkets
        • Specialty Stores
        • Health Stores
        • Sporting Goods Stores
      • BRAZIL Reusable Water Bottle Market by End Use Type

        • Sports
        • Travel
        • Everyday Use
        • Business
        • Fitness
      • MEXICO Outlook (USD Billion, 2019-2035)
      • MEXICO Reusable Water Bottle Market by Material Type

        • Plastic
        • Stainless Steel
        • Glass
        • Bamboo
        • Silicone
      • MEXICO Reusable Water Bottle Market by Size Type

        • 500 ml
        • 750 ml
        • 1 liter
        • 1.5 liters
        • 2 liters
      • MEXICO Reusable Water Bottle Market by Distribution Channel Type

        • Online Retail
        • Supermarkets
        • Specialty Stores
        • Health Stores
        • Sporting Goods Stores
      • MEXICO Reusable Water Bottle Market by End Use Type

        • Sports
        • Travel
        • Everyday Use
        • Business
        • Fitness
      • ARGENTINA Outlook (USD Billion, 2019-2035)
      • ARGENTINA Reusable Water Bottle Market by Material Type

        • Plastic
        • Stainless Steel
        • Glass
        • Bamboo
        • Silicone
      • ARGENTINA Reusable Water Bottle Market by Size Type

        • 500 ml
        • 750 ml
        • 1 liter
        • 1.5 liters
        • 2 liters
      • ARGENTINA Reusable Water Bottle Market by Distribution Channel Type

        • Online Retail
        • Supermarkets
        • Specialty Stores
        • Health Stores
        • Sporting Goods Stores
      • ARGENTINA Reusable Water Bottle Market by End Use Type

        • Sports
        • Travel
        • Everyday Use
        • Business
        • Fitness
      • REST OF SOUTH AMERICA Outlook (USD Billion, 2019-2035)
      • REST OF SOUTH AMERICA Reusable Water Bottle Market by Material Type

        • Plastic
        • Stainless Steel
        • Glass
        • Bamboo
        • Silicone
      • REST OF SOUTH AMERICA Reusable Water Bottle Market by Size Type

        • 500 ml
        • 750 ml
        • 1 liter
        • 1.5 liters
        • 2 liters
      • REST OF SOUTH AMERICA Reusable Water Bottle Market by Distribution Channel Type

        • Online Retail
        • Supermarkets
        • Specialty Stores
        • Health Stores
        • Sporting Goods Stores
      • REST OF SOUTH AMERICA Reusable Water Bottle Market by End Use Type

        • Sports
        • Travel
        • Everyday Use
        • Business
        • Fitness
    • MEA Outlook (USD Billion, 2019-2035)

      • MEA Reusable Water Bottle Market by Material Type

        • Plastic
        • Stainless Steel
        • Glass
        • Bamboo
        • Silicone
      • MEA Reusable Water Bottle Market by Size Type

        • 500 ml
        • 750 ml
        • 1 liter
        • 1.5 liters
        • 2 liters
      • MEA Reusable Water Bottle Market by Distribution Channel Type

        • Online Retail
        • Supermarkets
        • Specialty Stores
        • Health Stores
        • Sporting Goods Stores
      • MEA Reusable Water Bottle Market by End Use Type

        • Sports
        • Travel
        • Everyday Use
        • Business
        • Fitness
      • MEA Reusable Water Bottle Market by Regional Type

        • GCC Countries
        • South Africa
        • Rest of MEA
      • GCC COUNTRIES Outlook (USD Billion, 2019-2035)
      • GCC COUNTRIES Reusable Water Bottle Market by Material Type

        • Plastic
        • Stainless Steel
        • Glass
        • Bamboo
        • Silicone
      • GCC COUNTRIES Reusable Water Bottle Market by Size Type

        • 500 ml
        • 750 ml
        • 1 liter
        • 1.5 liters
        • 2 liters
      • GCC COUNTRIES Reusable Water Bottle Market by Distribution Channel Type

        • Online Retail
        • Supermarkets
        • Specialty Stores
        • Health Stores
        • Sporting Goods Stores
      • GCC COUNTRIES Reusable Water Bottle Market by End Use Type

        • Sports
        • Travel
        • Everyday Use
        • Business
        • Fitness
      • SOUTH AFRICA Outlook (USD Billion, 2019-2035)
      • SOUTH AFRICA Reusable Water Bottle Market by Material Type

        • Plastic
        • Stainless Steel
        • Glass
        • Bamboo
        • Silicone
      • SOUTH AFRICA Reusable Water Bottle Market by Size Type

        • 500 ml
        • 750 ml
        • 1 liter
        • 1.5 liters
        • 2 liters
      • SOUTH AFRICA Reusable Water Bottle Market by Distribution Channel Type

        • Online Retail
        • Supermarkets
        • Specialty Stores
        • Health Stores
        • Sporting Goods Stores
      • SOUTH AFRICA Reusable Water Bottle Market by End Use Type

        • Sports
        • Travel
        • Everyday Use
        • Business
        • Fitness
      • REST OF MEA Outlook (USD Billion, 2019-2035)
      • REST OF MEA Reusable Water Bottle Market by Material Type

        • Plastic
        • Stainless Steel
        • Glass
        • Bamboo
        • Silicone
      • REST OF MEA Reusable Water Bottle Market by Size Type

        • 500 ml
        • 750 ml
        • 1 liter
        • 1.5 liters
        • 2 liters
      • REST OF MEA Reusable Water Bottle Market by Distribution Channel Type

        • Online Retail
        • Supermarkets
        • Specialty Stores
        • Health Stores
        • Sporting Goods Stores
      • REST OF MEA Reusable Water Bottle Market by End Use Type

        • Sports
        • Travel
        • Everyday Use
        • Business
        • Fitness
    Infographic

    Free Sample Request

    Kindly complete the form below to receive a free sample of this Report

    Get Free Sample

    Customer Strories

    “I am very pleased with how market segments have been defined in a relevant way for my purposes (such as "Portable Freezers & refrigerators" and "last-mile"). In general the report is well structured. Thanks very much for your efforts.”

    Victoria Milne

    Founder
    Case Study
    Chemicals and Materials

    Compare Licence

    ×
    Features License Type
    Single User Multiuser License Enterprise User
    Price $4,950 $5,950 $7,250
    Maximum User Access Limit 1 User Upto 10 Users Unrestricted Access Throughout the Organization
    Free Customization
    Direct Access to Analyst
    Deliverable Format
    Platform Access
    Discount on Next Purchase 10% 15% 15%
    Printable Versions