• Cat-intel
  • MedIntelliX
  • Resources
  • About Us
  • Hero Background
    English
    Chinese
    French
    Japanese
    Korean
    German
    Spanish

    Reservoir Analysis Market Share

    ID: MRFR/E&P/6288-CR
    138 Pages
    Chitranshi Jaiswal
    October 2020

    Reservoir Analysis Market Research Report Information by Reservoir Type (Conventional and Unconventional), by Service (Geo Modelling& Reservoir Simulation, Data Acquisition & Monitoring and Reservoir Sampling), By Application (Onshore and Offshore) and by Region (North America, Europe, Asia-Pacific, Middle East & Africa and South America) - Industry Size, Share, Trends & Forecas...

    Share:
    Download PDF ×

    We do not share your information with anyone. However, we may send you emails based on your report interest from time to time. You may contact us at any time to opt-out.

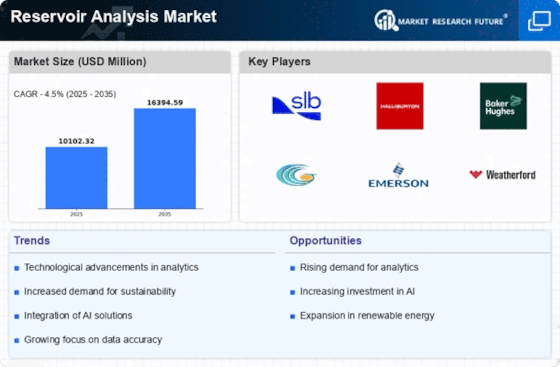
    Reservoir Analysis Market Infographic
    $ 4,950.0
    $ 5,950.0
    $ 7,250.0

    Market Share

    Reservoir Analysis Market Share Analysis

    Companies use various market share positioning methods to compete in the reservoir analysis market and meet oil and gas sector demands. Technology distinction is key, with firms creating superior reservoir analysis techniques and technologies. New seismic imaging, reservoir modeling, and data analytics innovations distinguish the product offering. Companies endeavor to deliver precise subsurface insights and efficient reservoir management to boost oil and gas recovery.

    Reservoir analysis market cost leadership is also important. Optimizing software development, data processing, and analysis processes helps companies provide competitive reservoir analysis services. The oil and gas sector is capital-intensive, thus exploration and production businesses seeking accurate reservoir research without sacrificing financial viability want cost-effective solutions. Cost-leadership companies might gain market share by offering reservoir analysis at low pricing.

    Reservoir analysis market positioning techniques depend on market segmentation. Companies assess oil and gas operators' demands for conventional reservoirs, shale, and tight formations. Companies may meet segment-specific needs by customizing reservoir analysis tools to solve geology and operational issues. The parameters of offshore reservoir tools may vary from those of onshore unconventional plays. This tailored strategy helps organizations maximize their market presence and guarantee reservoir analysis solutions are application-specific.

    Strategic partnerships and collaborations are growing in reservoir analysis. Companies develop collaborations to improve their products as complicated reservoir features and integrated solutions challenge the sector. Reservoir analysis providers may construct complete solutions with geophysical survey businesses, well logging service providers, and data analytics professionals. Such agreements allow organizations to provide end-to-end reservoir management services, placing them as leaders in a field where data integration is crucial for proper analysis.

    Reservoir analysis firms use geographic expansion. To serve multiple markets, corporations deliberately extend their presence across locations with different reservoir characteristics, regulatory conditions, and exploration and production processes. Oil and gas producers worldwide have diverse issues, thus this strategy lets organizations tailor their reservoir research services to local needs. Geographic expansion also helps organizations reduce market reliance concerns and capitalize on possibilities in places with expanding exploration and production.

    Brand placement is crucial to reservoir analysis market share and consumer perception. Reliable, inventive, and customer-focused enterprises may gain exploration and production company confidence. An industry where reservoir analysis accuracy and dependability affect drilling, production optimization, and reservoir management requires a strong brand reputation. Quality, customer support, and ongoing progress in reservoir analysis services may help companies gain market share.

    Companies in the reservoir analysis industry use different market share positioning methods. To acquire a competitive advantage in subsurface reservoir evaluation, organizations use technology differentiation, cost leadership, market segmentation, collaborations, geographical growth, or brand positioning. As the oil and gas sector seeks efficient and sustainable reservoir management solutions, firms that adapt to client demands will succeed in this dynamic and crucial market.

    Market Summary

    As per Market Research Future Analysis, the Reservoir Analysis Market was valued at USD 9,251 million in 2022 and is projected to reach USD 13,761 million by 2032, growing at a CAGR of 4.5% from 2023 to 2032. The market is driven by advancements in technology, including IoT and data analysis tools, which enhance reservoir performance and hydrocarbon recovery. The demand for reservoir analysis services is increasing, particularly in North America and Europe, due to higher energy expenditures and oil production rates. However, the COVID-19 pandemic has posed challenges, disrupting supply chains and reducing workforce availability, impacting market growth.

    Key Market Trends & Highlights

    The Reservoir Analysis Market is witnessing significant growth driven by technological advancements and increasing demand for hydrocarbon recovery.

    • Market Size in 2022: USD 9,251 million; Projected Size by 2032: USD 13,761 million.
    • CAGR during 2023-2032: 4.5%; Major growth observed in North America and Europe.
    • COVID-19 impacted supply chains and workforce availability, affecting market dynamics.
    • Emerging markets in India, China, and Brazil are expected to grow rapidly.

    Market Size & Forecast

    2022 Market Size USD 9,251 million
    2032 Market Size USD 13,761 million
    CAGR 4.5%
    Major growth regions North America, Europe
    Emerging markets India, China, Brazil

    Major Players

    Intertek Group Plc (UK), Expro Group (UK), Halliburton (US), Core Laboratories (US), Emerson Electric Co. (US), ALS Limited (Australia), General Electric (US), CGG (France), SGS SA (Switzerland), Schlumberger Limited (US), Weatherford International PLC (US)

    Market Trends

    The ongoing advancements in data analytics and modeling techniques are poised to enhance the efficiency and accuracy of reservoir management, thereby driving growth in the reservoir analysis sector.

    U.S. Department of Energy

    Reservoir Analysis Market Market Drivers

    Market Growth Projections

    The Global Reservoir Analysis Market Industry is projected to experience substantial growth over the coming years. With a market value of 10.4 USD Billion in 2024, it is anticipated to reach 15.7 USD Billion by 2035. This growth trajectory indicates a CAGR of 3.78% from 2025 to 2035, reflecting the increasing importance of effective reservoir management in addressing global water challenges. The market's expansion is likely driven by technological advancements, regulatory frameworks, and the pressing need for sustainable water resource management.

    Climate Change and Water Scarcity

    Climate change poses significant challenges to water resources, influencing the Global Reservoir Analysis Market Industry. Altered precipitation patterns and increased evaporation rates lead to water scarcity in various regions. This situation necessitates effective reservoir management to ensure water availability during droughts and floods. The market's growth is likely to be fueled by the need for adaptive strategies that incorporate climate resilience into reservoir planning and operations. As stakeholders seek to mitigate the impacts of climate change, investments in reservoir analysis technologies are expected to rise, further driving market expansion.

    Increasing Demand for Water Resources

    The Global Reservoir Analysis Market Industry experiences heightened demand for water resources due to population growth and urbanization. As the global population is projected to reach approximately 9.7 billion by 2050, the need for effective water management becomes paramount. Reservoirs play a crucial role in ensuring water supply for domestic, agricultural, and industrial uses. In 2024, the market is valued at 10.4 USD Billion, reflecting the urgency for sustainable water resource management. This demand is likely to drive innovations in reservoir analysis technologies, enhancing efficiency and sustainability in water resource allocation.

    Government Initiatives and Regulations

    Government initiatives and regulations play a pivotal role in shaping the Global Reservoir Analysis Market Industry. Many governments are implementing policies aimed at improving water resource management and sustainability. For instance, regulations mandating the assessment of reservoir capacities and environmental impacts are becoming more common. These initiatives not only promote responsible water usage but also stimulate investments in reservoir analysis technologies. As a result, the market is likely to witness steady growth, with a projected CAGR of 3.78% from 2025 to 2035, driven by regulatory compliance and funding for water infrastructure projects.

    Growing Interest in Sustainable Practices

    The Global Reservoir Analysis Market Industry is increasingly influenced by the growing interest in sustainable practices. Stakeholders are recognizing the importance of sustainable water management to preserve ecosystems and ensure long-term water availability. This trend is reflected in the adoption of environmentally friendly reservoir designs and management practices. As organizations strive to balance water needs with ecological considerations, the demand for advanced reservoir analysis tools is likely to increase. This shift towards sustainability not only enhances the market's growth potential but also aligns with global efforts to achieve water security and environmental stewardship.

    Technological Advancements in Reservoir Management

    Technological advancements significantly influence the Global Reservoir Analysis Market Industry. Innovations such as remote sensing, GIS, and advanced modeling techniques enhance the accuracy and efficiency of reservoir management. These technologies allow for real-time monitoring and predictive analysis, which are essential for optimizing water storage and distribution. As organizations increasingly adopt these technologies, the market is expected to grow, with projections indicating a value of 15.7 USD Billion by 2035. The integration of artificial intelligence and machine learning into reservoir analysis further suggests a transformative impact on operational efficiency and decision-making processes.

    Market Segment Insights

    Regional Insights

    Key Companies in the Reservoir Analysis Market market include

    Industry Developments

      • Market has been primarily divided into several segments, and each segment has profitable trends.
      • The segment is growing day by day; there is a new trend that is responsible for the growth
      • North America and Europe have more market share, but Asia Pacific is growing at a very fast pace.

    Future Outlook

    Reservoir Analysis Market Future Outlook

    The Global Reservoir Analysis Market is projected to grow at a 3.78% CAGR from 2024 to 2035, driven by technological advancements and increasing demand for resource management.

    New opportunities lie in:

    • Invest in AI-driven analytics to enhance predictive modeling capabilities.
    • Develop integrated software solutions for real-time reservoir monitoring.
    • Expand services in emerging markets with untapped reservoir potential.

    By 2035, the market is expected to demonstrate robust growth, reflecting evolving industry needs and technological integration.

    Market Segmentation

    Report Overview

    • Competitive landscape analysis
    • The regional analysis 
    • Market segmentation overview
    • Value chain analysis 
    • Explanation upon the Market Dynamics
    • Analysis based upon COVID 19
    • Market overview highlights 

    Reservoir Analysis Market Dynamics

    • Drivers 
    • Opportunities 
    • Restraints
    • Challenges
    • Cumulative Growth Analysis

    On the basis of Geographic Segmentation:

    • MEA
    • South America
    • APAC
    • Europe
    • North America

    Reservoir Analysis Market Competitive Landscape

    • Weatherford International PLC (US)
    • Schlumberger Limited (US)
    • SGS SA (Switzerland)
    • CGG (France)
    • General Electric (US)
    • ALS Limited (Australia)
    • Emerson Electric Co. (US)
    • Tristan Canada Core Laboratories (US)
    • Halliburton (US)
    • Expro Group (UK)
    • Intertek Group Plc (UK)

    Recent Developments in Reservoir Analysis Market

    • North America and Europe have more market share, but Asia Pacific is growing at a very fast pace.
    • The segment is growing day by day; there is a new trend that is responsible for the growth
    • Market has been primarily divided into several segments, and each segment has profitable trends.

    Report Scope

    Report Attribute/Metric Details
      Market Size 2022   USD 9251 Million
      Market Size 2032   USD 13761 Million
      CAGR   4.5% CAGR (2022-2032)
      Base Year   2021
      Forecast Period   2022-2032
      Historical Data   2019 & 2020
      Forecast Units   Value (USD Billion)
      Report Coverage   Revenue Forecast, Competitive Landscape, Growth Factors, and Trends
      Segments Covered   Reservoir Type, Service and Application
      Geographies Covered   North America, Europe, Asia-Pacific, and Rest of the World (RoW)
      Key Vendors   Intertek Group Plc (UK), Expro Group (UK), Halliburton (US), Tristan Canada Core Laboratories (US), Emerson Electric Co. (US), ALS Limited (Australia), General Electric (US), CGG (France), SGS SA (Switzerland), Schlumberger Limited (US), and Weatherford International PLC (US)
      Key Market Opportunities Exploration of unconventional reservoirs New product launches and R&D amongst major key players
      Key Market Drivers Need for maximizing hydrocarbon recovery Technological advancements in reservoir analysis

    Market Highlights

    Author

    Chitranshi Jaiswal
    Research Analyst Level I

    She holds an experience of about 6+ years in market research and business consulting, working under the spectrum of information communication technology, telecommunications and semiconductor domains. aarti conceptualizes and implements a scalable business strategy and provides strategic leadership to the clients. her expertise lies in market estimation, competitive intelligence, pipeline analysis, customer assessment, etc.

    Leave a Comment

    Latest Comments

    John Doe
    john@example.com

    This is a great article! Really helped me understand the topic better.

    Posted on July 23, 2025, 10:15 AM
    Jane Smith
    jane@domain.com

    Thanks for sharing this. I’ve bookmarked it for later reference.

    Posted on July 22, 2025, 7:45 PM

    FAQs

    What is the projected market value of the global reservoir analysis market?

    The global reservoir analysis market is expected to record a substantial market valuation of 12.43 billion by 2023.

    What is the estimated growth rate of the global reservoir analysis market?

    The global reservoir analysis market is projected to register a moderate 4.5% CAGR in the forecast period.

    Who are the key players operative in the global reservoir analysis market?

    A few major market players operating in the global reservoir analysis market are General Electric (US), CGG (France), ALS Limited (Australia), Emerson Electric Co. (US), among others.

    What factor poses as a challenge for the players of the global reservoir analysis market?

    the lack of investment and industrial awareness in underdeveloped regions is likely to hamper the growth of the public safety LTE market over the review period.

    What is the reservoir type segment of the global reservoir analysis market expected to witness the highest growth?

    The conventional segment is slated to expand as the fastest-growing segment.

    What is the application segment of the global reservoir analysis market expected to witness the highest growth?

    The onshore segment is slated to expand as the fastest-growing segment.

    What is the primary driving factor of the global reservoir analysis market?

    Technological advancements, rapid urbanization are increasing the adoption of IOT and data analytic tools in the E&P industry.

    1. Executive Summary
      1. MARKET ATTRACTIVENESS ANALYSIS 16
      2. 1.1.1
    2. GLOBAL RESERVOIR ANALYSIS MARKET, BY RESERVOIR TYPE 17
    3. GLOBAL RESERVOIR
    4. ANALYSIS MARKET, BY SERVICE 18
      1. 19
    5. GLOBAL RESERVOIR ANALYSIS MARKET, BY APPLICATION
    6. GLOBAL RESERVOIR ANALYSIS MARKET, BY REGION 20
    7. Market Introduction
      1. DEFINITION 21
      2. SCOPE OF THE STUDY 21
      3. Research Objective 21
      4. MARKET STRUCTURE 22
    8. Research Methodology
      1. RESEARCH PROCESS
      2. 23
      3. PRIMARY RESEARCH 24
      4. SECONDARY RESEARCH 25
      5. MARKET SIZE
      6. ESTIMATION 25
      7. FORECAST MODEL 27
      8. List of Assumptions 28
      9. 4
      10. Market Insights
    9. Market Dynamics
      1. INTRODUCTION 32
      2. DRIVERS
        1. Need for Maximizing Hydrocarbon Recovery 33
        2. Technological
      3. 33
      4. Advancements in Reservoir Analysis 33
      5. RESTRAINTS 34
        1. High Cost
      6. of Reservoir Analysis 34
      7. OPPORTUNITIES 36
        1. Exploration of Unconventional
      8. Reservoirs 36
    10. Market Factor Analysis
      1. VALUE CHAIN ANALYSIS 37
        1. hardware & Software proviDers 38
        2. Service providers 38
        3. End users 38
      2. PORTER’S FIVE FORCES MODEL 39
        1. THREAT
        2. BARGAINING POWER OF SUPPLIERS 40
        3. BARGAINING
        4. THREAT OF SUBSTITUTES 40
        5. INTENSITY OF RIVALRY
      3. OF NEW ENTRANTS 40
      4. POWER OF BUYERS 40
      5. 40
    11. GLOBAL RESERVOIR ANALYSIS MARKET, BY RESERVOIR TYPE
      1. OVERVIEW
      2. 41
      3. Conventional 42
      4. UNConventional 43
    12. GLOBAL RESERVOIR ANALYSIS
    13. MARKET, BY SERVICE
      1. OVERVIEW 44
      2. Geo Modelling& Reservoir Simulation
      3. 45
      4. Data Acquisition & Monitoring 46
      5. Reservoir Sampling 46
    14. GLOBAL RESERVOIR ANALYSIS MARKET, BY Application
      1. OVERVIEW 47
      2. 9.2
      3. Onshore 48
      4. Offshore 49
    15. GLOBAL RESERVOIR ANALYSIS MARKET, BY REGION
      1. OVERVIEW 50
      2. NORTH AMERICA 52
        1. US 54
        2. CANADA
        3. MEXICO 57
      3. 55
      4. EUROPE 59
        1. RUSSIA 61
        2. NORWAY
        3. UK 63
        4. GERMANY 65
        5. italy 66
        6. rest
      5. 62
      6. of Europe 68
      7. ASIA-PACIFIC 70
        1. China 72
        2. INDIA 73
        3. AUSTRALIA 74
        4. INDONEsia 76
        5. rest of ASIA-pacific
      8. 77
      9. MIDDLE EAST & AFRICA 79
        1. Saudi Arabia 80
        2. egypt 83
        3. rest of Middle East & Africa 84
        4. brazil 87
        5. Argentina 89
        6. rest
      10. 10.5.2
      11. uae 82
      12. 10.6
      13. South AMERICA 86
      14. of South America 90
    16. COMPETITIVE LANDSCAPE
      1. COMPETITIVE OVERVIEW
      2. 92
      3. COMPETITIVE BENCHMARKING 93
      4. MARKET SHARE ANALYSIS 94
        1. PRODUCT LAUNCHes/SERVICE
        2. MERGERs & ACQUISITIONs 96
        3. Contract and
      5. 11.4
      6. KEY DEVELOPMENTS & GROWTH STRATEGIES 94
      7. DEPLOYMENTs 94
      8. Agreement 96
    17. COMPANY PROFILES
      1. Schlumberger Limited 98
        1. FINANCIAL OVERVIEW 99
        2. PRODUCTS OFFERed
        3. KEY DEVELOPMENTS 100
        4. SWOT ANALYSIS 101
        5. KEY
      2. 12.1.1
      3. COMPANY OVERVIEW 98
      4. 99
      5. STRATEGIES 101
      6. Halliburton 102
        1. COMPANY OVERVIEW 102
        2. PRODUCTS OFFERed 104
        3. KEY DEVELOPMENTS
        4. SWOT ANALYSIS 105
        5. KEY STRATEGIES 105
      7. 12.2.2
      8. FINANCIAL OVERVIEW 103
      9. 104
      10. Weatherford
        1. COMPANY OVERVIEW 106
        2. FINANCIAL OVERVIEW
        3. PRODUCTS OFFERed 108
        4. KEY DEVELOPMENTS 108
        5. KEY STRATEGIES 109
      11. International PLC 106
      12. 107
      13. 12.3.5
      14. SWOT ANALYSIS 109
      15. SGS SA 110
        1. FINANCIAL OVERVIEW 111
        2. PRODUCTS OFFERed
        3. KEY DEVELOPMENTS 112
        4. SWOT ANALYSIS 113
        5. KEY
      16. 12.4.1
      17. COMPANY OVERVIEW 110
      18. 112
      19. STRATEGIES 113
      20. GENERAL ELECTRIC 114
        1. COMPANY OVERVIEW 114
        2. FINANCIAL OVERVIEW 115
        3. PRODUCTS OFFERed 116
        4. KEY
        5. SWOT ANALYSIS 117
        6. KEY STRATEGIES 117
      21. DEVELOPMENTS 116
      22. ALS Limited 118
        1. COMPANY OVERVIEW 118
        2. FINANCIAL OVERVIEW
        3. PRODUCTS OFFERed 120
        4. KEY DEVELOPMENTS 120
        5. COMPANY OVERVIEW 121
        6. FINANCIAL OVERVIEW 122
        7. KEY DEVELOPMENTS 123
      23. 119
      24. 12.7
      25. CGG 121
      26. 12.7.3
      27. PRODUCTS OFFERed 122
      28. Emerson Electric
        1. COMPANY OVERVIEW 125
        2. FINANCIAL OVERVIEW 126
        3. KEY DEVELOPMENTS 127
      29. Co 125
      30. 12.8.3
      31. PRODUCTS OFFERed 127
      32. trican 128
        1. FINANCIAL OVERVIEW 128
        2. PRODUCTS OFFERed
        3. KEY DEVELOPMENTS 129
      33. 12.9.1
      34. COMPANY OVERVIEW 128
      35. 129
      36. Core Laboratories 130
        1. FINANCIAL OVERVIEW 131
        2. PRODUCTS OFFERed
        3. KEY DEVELOPMENTS 131
      37. 12.10.1
      38. COMPANY OVERVIEW 130
      39. 131
      40. Expro Group 132
        1. COMPANY
        2. FINANCIAL OVERVIEW 133
        3. PRODUCTS/Services
        4. KEY DEVELOPMENTS 134
      41. OVERVIEW 132
      42. OFFERed 134
      43. Intertek Group plc 135
        1. COMPANY OVERVIEW 135
        2. FINANCIAL OVERVIEW 136
        3. KEY DEVELOPMENTS 137
      44. 12.12.3
      45. PRODUCTS/ Services OFFERed 137
    18. List of
      1. Tables
    19. PRIMARY INTERVIEWS 24
    20. LIST OF ASSUMPTIONS 28
    21. GLOBAL RESERVOIR ANALYSIS: MARKET ESTIMATES & FORECAST, BY RESERVOIR
      1. TYPE, 2017–2025 (USD MILLION) 42
    22. GLOBAL RESERVOIR ANALYSIS: MARKET
      1. ESTIMATES & FORECAST, BY SERVICE, 2017–2025 (USD MILLION) 45
      2. TABLE
    23. GLOBAL RESERVOIR ANALYSIS: MARKET ESTIMATES & FORECAST, BY APPLICATION, 2017–2025
      1. (USD MILLION) 48
    24. GLOBAL RESERVOIR ANALYSIS MARKET, BY REGION, 2017–2025
      1. (USD MILLION) 51
    25. NORTH AMERICA: RESERVOIR ANALYSIS MARKET, BY COUNTRY,
    26. NORTH AMERICA: GLOBAL RESERVOIR ANALYSIS:
    27. MARKET ESTIMATES & FORECAST, BY RESERVOIR TYPE, 2017–2025 (USD MILLION)
      1. 53
    28. NORTH AMERICA: GLOBAL RESERVOIR ANALYSIS: MARKET ESTIMATES &
      1. FORECAST, BY SERVICE, 2017–2025 (USD MILLION) 53
    29. NORTH AMERICA:
    30. GLOBAL RESERVOIR ANALYSIS: MARKET ESTIMATES & FORECAST, BY APPLICATION, 2017–2025
      1. (USD MILLION) 53
    31. US: RESERVOIR ANALYSIS: MARKET ESTIMATES & FORECAST,
      1. BY RESERVOIR TYPE, 2017–2025 (USD MILLION) 54
    32. US: RESERVOIR
    33. ANALYSIS: MARKET ESTIMATES & FORECAST, BY SERVICE, 2017–2025 (USD MILLION)
      1. 54
    34. US: RESERVOIR ANALYSIS: MARKET ESTIMATES & FORECAST, BY APPLICATION,
    35. CANADA: RESERVOIR ANALYSIS: MARKET
      1. ESTIMATES & FORECAST, BY RESERVOIR TYPE, 2017–2025 (USD MILLION) 55
    36. CANADA: RESERVOIR ANALYSIS: MARKET ESTIMATES & FORECAST, BY SERVICE,
    37. CANADA: RESERVOIR ANALYSIS: MARKET
      1. ESTIMATES & FORECAST, BY APPLICATION, 2017–2025 (USD MILLION) 56
      2. TABLE
    38. MEXICO: RESERVOIR ANALYSIS: MARKET ESTIMATES & FORECAST, BY RESERVOIR TYPE,
    39. MEXICO: RESERVOIR ANALYSIS: MARKET
      1. ESTIMATES & FORECAST, BY SERVICE, 2017–2025 (USD MILLION) 57
      2. TABLE
    40. MEXICO: RESERVOIR ANALYSIS: MARKET ESTIMATES & FORECAST, BY APPLICATION,
    41. EUROPE: RESERVOIR ANALYSIS MARKET,
      1. BY COUNTRY, 2017–2025 (USD MILLION) 59
    42. EUROPE: RESERVOIR ANALYSIS:
    43. MARKET ESTIMATES & FORECAST, BY RESERVOIR TYPE, 2017–2025 (USD MILLION)
      1. 60
    44. EUROPE: RESERVOIR ANALYSIS: MARKET ESTIMATES & FORECAST, BY
      1. SERVICE, 2017–2025 (USD MILLION) 60
    45. EUROPE: RESERVOIR ANALYSIS:
    46. MARKET ESTIMATES & FORECAST, BY APPLICATION, 2017–2025 (USD MILLION) 60
    47. RUSSIA: RESERVOIR ANALYSIS: MARKET ESTIMATES & FORECAST, BY RESERVOIR
      1. TYPE, 2017–2025 (USD MILLION) 61
    48. RUSSIA: RESERVOIR ANALYSIS:
    49. MARKET ESTIMATES & FORECAST, BY SERVICE, 2017–2025 (USD MILLION) 61
    50. RUSSIA: RESERVOIR ANALYSIS: MARKET ESTIMATES & FORECAST, BY APPLICATION,
    51. NORWAY: RESERVOIR ANALYSIS: MARKET
      1. ESTIMATES & FORECAST, BY RESERVOIR TYPE, 2017–2025 (USD MILLION) 62
    52. NORWAY: RESERVOIR ANALYSIS: MARKET ESTIMATES & FORECAST, BY SERVICE,
    53. NORWAY: RESERVOIR ANALYSIS: MARKET
      1. ESTIMATES & FORECAST, BY APPLICATION, 2017–2025 (USD MILLION) 63
      2. TABLE
    54. UK: RESERVOIR ANALYSIS: MARKET ESTIMATES & FORECAST, BY RESERVOIR TYPE, 2017–2025
      1. (USD MILLION) 64
    55. UK: RESERVOIR ANALYSIS: MARKET ESTIMATES & FORECAST,
      1. BY SERVICE, 2017–2025 (USD MILLION) 64
    56. UK: RESERVOIR ANALYSIS:
    57. MARKET ESTIMATES & FORECAST, BY APPLICATION, 2017–2025 (USD MILLION) 64
    58. GERMANY: RESERVOIR ANALYSIS: MARKET ESTIMATES & FORECAST, BY RESERVOIR
      1. TYPE, 2017–2025 (USD MILLION) 65
    59. GERMANY: RESERVOIR ANALYSIS:
    60. MARKET ESTIMATES & FORECAST, BY SERVICE, 2017–2025 (USD MILLION) 65
    61. GERMANY: RESERVOIR ANALYSIS: MARKET ESTIMATES & FORECAST, BY APPLICATION,
    62. ITALY: RESERVOIR ANALYSIS: MARKET
      1. ESTIMATES & FORECAST, BY RESERVOIR TYPE, 2017–2025 (USD MILLION) 66
    63. ITALY: RESERVOIR ANALYSIS: MARKET ESTIMATES & FORECAST, BY SERVICE,
    64. ITALY: RESERVOIR ANALYSIS: MARKET
      1. ESTIMATES & FORECAST, BY APPLICATION, 2017–2025 (USD MILLION) 67
      2. TABLE
    65. REST OF EUROPE: RESERVOIR ANALYSIS: MARKET ESTIMATES & FORECAST, BY RESERVOIR
      1. TYPE, 2017–2025 (USD MILLION) 68
    66. REST OF EUROPE: RESERVOIR ANALYSIS:
    67. MARKET ESTIMATES & FORECAST, BY SERVICE, 2017–2025 (USD MILLION) 68
    68. REST OF EUROPE: RESERVOIR ANALYSIS: MARKET ESTIMATES & FORECAST,
      1. BY APPLICATION, 2017–2025 (USD MILLION) 69
    69. ASIA-PACIFIC: RESERVOIR
    70. ANALYSIS MARKET, BY COUNTRY, 2017–2025 (USD MILLION) 70
    71. ASIA-PACIFIC:
    72. RESERVOIR ANALYSIS: MARKET ESTIMATES & FORECAST, BY RESERVOIR TYPE, 2017 –
    73. ASIA-PACIFIC: RESERVOIR ANALYSIS: MARKET ESTIMATES
      1. & FORECAST, BY SERVICE, 2017–2025 (USD MILLION) 71
    74. ASIA-PACIFIC:
    75. RESERVOIR ANALYSIS: MARKET ESTIMATES & FORECAST, BY APPLICATION, 2017–2025
      1. (USD MILLION) 71
    76. CHINA: RESERVOIR ANALYSIS: MARKET ESTIMATES &
      1. FORECAST, BY RESERVOIR TYPE, 2017–2025 (USD MILLION) 72
    77. CHINA:
    78. RESERVOIR ANALYSIS: MARKET ESTIMATES & FORECAST, BY SERVICE, 2017–2025
      1. (USD MILLION) 72
    79. CHINA: RESERVOIR ANALYSIS: MARKET ESTIMATES &
      1. FORECAST, BY APPLICATION, 2017–2025 (USD MILLION) 73
    80. INDIA:
    81. RESERVOIR ANALYSIS: MARKET ESTIMATES & FORECAST, BY RESERVOIR TYPE, 2017–2025
      1. (USD MILLION) 73
    82. INDIA: RESERVOIR ANALYSIS: MARKET ESTIMATES &
      1. FORECAST, BY SERVICE, 2017–2025 (USD MILLION) 74
    83. INDIA: RESERVOIR
    84. ANALYSIS: MARKET ESTIMATES & FORECAST, BY APPLICATION, 2017–2025 (USD
      1. MILLION) 74
    85. AUSTRALIA: RESERVOIR ANALYSIS: MARKET ESTIMATES &
      1. FORECAST, BY RESERVOIR TYPE, 2017–2025 (USD MILLION) 75
    86. AUSTRALIA:
    87. RESERVOIR ANALYSIS: MARKET ESTIMATES & FORECAST, BY SERVICE, 2017–2025
      1. (USD MILLION) 75
    88. AUSTRALIA: RESERVOIR ANALYSIS: MARKET ESTIMATES &
      1. FORECAST, BY APPLICATION, 2017–2025 (USD MILLION) 75
    89. INDONESIA:
    90. RESERVOIR ANALYSIS: MARKET ESTIMATES & FORECAST, BY RESERVOIR TYPE, 2017–2025
      1. (USD MILLION) 76
    91. INDONESIA: RESERVOIR ANALYSIS: MARKET ESTIMATES &
      1. FORECAST, BY SERVICE, 2017–2025 (USD MILLION) 76
    92. INDONESIA:
    93. RESERVOIR ANALYSIS: MARKET ESTIMATES & FORECAST, BY APPLICATION, 2017–2025
      1. (USD MILLION) 77
    94. REST OF ASIA-PACIFIC: RESERVOIR ANALYSIS: MARKET
      1. ESTIMATES & FORECAST, BY RESERVOIR TYPE, 2017–2025 (USD MILLION) 77
    95. REST OF ASIA-PACIFIC: RESERVOIR ANALYSIS: MARKET ESTIMATES & FORECAST,
      1. BY SERVICE 2017–2025 (USD MILLION) 78
    96. REST OF ASIA-PACIFIC:
    97. RESERVOIR ANALYSIS: MARKET ESTIMATES & FORECAST, BY APPLICATION, 2017–2025
      1. (USD MILLION) 78
    98. MIDDLE EAST & AFRICA: RESERVOIR ANALYSIS MARKET,
      1. BY REGION, 2017–2025 (USD MILLION) 79
    99. MIDDLE EAST & AFRICA:
    100. RESERVOIR ANALYSIS: MARKET ESTIMATES & FORECAST, BY RESERVOIR TYPE, 2017–2025
      1. (USD MILLION) 79
    101. MIDDLE EAST & AFRICA: RESERVOIR ANALYSIS: MARKET
      1. ESTIMATES & FORECAST, BY SERVICE, 2017– 2025 (USD MILLION) 80
      2. TABLE
    102. MIDDLE EAST & AFRICA: RESERVOIR ANALYSIS: MARKET ESTIMATES & FORECAST,
      1. BY APPLICATION, 2017–2025 (USD MILLION) 80
    103. SAUDI ARABIA: RESERVOIR
    104. ANALYSIS: MARKET ESTIMATES & FORECAST, BY RESERVOIR TYPE, 2017–2025 (USD
      1. MILLION) 81
    105. SAUDI ARABIA: RESERVOIR ANALYSIS: MARKET ESTIMATES &
      1. FORECAST, BY SERVICE, 2017–2025 (USD MILLION) 81
    106. SAUDI ARABIA:
    107. RESERVOIR ANALYSIS: MARKET ESTIMATES & FORECAST, BY APPLICATION, 2017–2025
      1. (USD MILLION) 81
    108. UAE: RESERVOIR ANALYSIS: MARKET ESTIMATES & FORECAST,
      1. BY RESERVOIR TYPE, 2017–2025 (USD MILLION) 82
    109. UAE: RESERVOIR
    110. ANALYSIS: MARKET ESTIMATES & FORECAST, BY SERVICE, 2017–2025 (USD MILLION)
      1. 82
    111. UAE: RESERVOIR ANALYSIS: MARKET ESTIMATES & FORECAST, BY APPLICATION,
    112. EGYPT: RESERVOIR ANALYSIS: MARKET
      1. ESTIMATES & FORECAST, BY RESERVOIR TYPE, 2017–2025 (USD MILLION) 83
    113. EGYPT: RESERVOIR ANALYSIS: MARKET ESTIMATES & FORECAST, BY SERVICE,
    114. EGYPT: RESERVOIR ANALYSIS: MARKET
      1. ESTIMATES & FORECAST, BY APPLICATION, 2017–2025 (USD MILLION) 84
      2. TABLE
    115. REST OF MIDDLE EAST & AFRICA: RESERVOIR ANALYSIS: MARKET ESTIMATES &
      1. FORECAST, BY RESERVOIR TYPE, 2017–2025 (USD MILLION) 85
    116. REST
      1. OF MIDDLE EAST & AFRICA: RESERVOIR ANALYSIS: MARKET ESTIMATES & FORECAST,
      2. BY SERVICE, 2017–2025 (USD MILLION) 85
    117. REST OF MIDDLE EAST &
    118. AFRICA: RESERVOIR ANALYSIS: MARKET ESTIMATES & FORECAST, BY APPLICATION, 2017–2025
      1. (USD MILLION) 85
    119. SOUTH AMERICA: RESERVOIR ANALYSIS MARKET, BY REGION,
    120. SOUTH AMERICA: RESERVOIR ANALYSIS:
    121. MARKET ESTIMATES & FORECAST, BY RESERVOIR TYPE, 2017–2025 (USD MILLION)
      1. 86
    122. SOUTH AMERICA: RESERVOIR ANALYSIS: MARKET ESTIMATES & FORECAST,
      1. BY SERVICE, 2017–2025 (USD MILLION) 87
    123. SOUTH AMERICA: RESERVOIR
    124. ANALYSIS: MARKET ESTIMATES & FORECAST, BY APPLICATION, 2017–2025 (USD
      1. MILLION) 87
    125. BRAZIL: RESERVOIR ANALYSIS: MARKET ESTIMATES & FORECAST,
      1. BY RESERVOIR TYPE, 2017–2025 (USD MILLION) 88
    126. BRAZIL: RESERVOIR
    127. ANALYSIS: MARKET ESTIMATES & FORECAST, BY SERVICE, 2017–2025 (USD MILLION)
      1. 88
    128. BRAZIL: RESERVOIR ANALYSIS: MARKET ESTIMATES & FORECAST, BY
      1. APPLICATION, 2017–2025 (USD MILLION) 88
    129. ARGENTINA: RESERVOIR
    130. ANALYSIS: MARKET ESTIMATES & FORECAST, BY RESERVOIR TYPE, 2017–2025 (USD
      1. MILLION) 89
    131. ARGENTINA: RESERVOIR ANALYSIS: MARKET ESTIMATES &
      1. FORECAST, BY SERVICE, 2017–2025 (USD MILLION) 89
    132. ARGENTINA:
    133. RESERVOIR ANALYSIS: MARKET ESTIMATES & FORECAST, BY APPLICATION, 2017–2025
      1. (USD MILLION) 90
    134. REST OF SOUTH AMERICA: RESERVOIR ANALYSIS: MARKET
      1. ESTIMATES & FORECAST, BY RESERVOIR TYPE, 2017–2025 (USD MILLION) 90
    135. REST OF SOUTH AMERICA: RESERVOIR ANALYSIS: MARKET ESTIMATES & FORECAST,
      1. BY SERVICE, 2017–2025 (USD MILLION) 91
    136. REST OF SOUTH AMERICA:
    137. RESERVOIR ANALYSIS: MARKET ESTIMATES & FORECAST, BY APPLICATION, 2017–2025
      1. (USD MILLION) 91
    138. PRODUCT LAUNCHES/SERVICE DEPLOYMENTS 94
      1. TABLE
    139. MERGERS & ACQUISITIONS 96
    140. CONTRACT AND AGREEMENT 96
      1. TABLE
    141. SCHLUMBERGER LIMITED: SERVICES OFFERED 99
    142. SCHLUMBERGER LIMITED:
      1. KEY DEVELOPMENTS 100
    143. HALLIBURTON: SERVICES OFFERED 104
      1. TABLE
    144. HALLIBURTON: KEY DEVELOPMENTS 104
    145. WEATHERFORD INTERNATIONAL PLC:
      1. PRODUCTS OFFERED 108
    146. SGS SA: PRODUCTS OFFERED 112
    147. SGS
      1. SA: KEY DEVELOPMENTS 112
    148. GENERAL ELECTRIC: SERVICES OFFERED 116
    149. GENERAL ELECTRIC: KEY DEVELOPMENTS 116
    150. ALS LIMITED: PRODUCTS
      1. OFFERED 120
    151. CGG: SERVICES OFFERED 122
    152. CGG: KEY DEVELOPMENTS
      1. 123
    153. EMERSON ELECTRIC CO: PRODUCTS OFFERED 127
    154. EMERSON
      1. ELECTRIC CO: KEY DEVELOPMENTS 127
    155. TRICAN: SERVICES OFFERED 129
    156. TRICAN: KEY DEVELOPMENTS 129
    157. CORE LABORATORIES: SERVICES
      1. OFFERED 131
    158. EXPRO GROUP: PRODUCTS OFFERED 134
    159. EXPRO
      1. GROUP: KEY DEVELOPMENTS 134
    160. INTERTEK GROUP PLC: PRODUCTS OFFERED
      1. 137
    161. List of Figures
    162. MARKET SYNOPSIS 15
    163. MARKET
      1. ATTRACTIVENESS ANALYSIS: GLOBAL RESERVOIR ANALYSIS MARKET 16
    164. GLOBAL
    165. RESERVOIR ANALYSIS MARKET ANALYSIS, BY RESERVOIR TYPE 17
    166. GLOBAL RESERVOIR
    167. ANALYSIS MARKET ANALYSIS, BY SERVICE 18
    168. GLOBAL RESERVOIR ANALYSIS
    169. MARKET ANALYSIS, BY APPLICATION 19
    170. GLOBAL RESERVOIR ANALYSIS MARKET
      1. ANALYSIS, BY REGION 20
    171. GLOBAL RESERVOIR ANALYSIS MARKET: STRUCTURE
      1. 22
    172. RESEARCH PROCESS 23
    173. TOP-DOWN & BOTTOM-UP APPROACHES
      1. 26
    174. NORTH AMERICA: RESERVOIR ANALYSIS MARKET SIZE & MARKET SHARE,
      1. BY COUNTRY (2018 VS 2025) 29
    175. EUROPE: RESERVOIR ANALYSIS MARKET SIZE
    176. & MARKET SHARE, BY COUNTRY (2018 VS 2025) 29
    177. ASIA-PACIFIC: RESERVOIR
    178. ANALYSIS MARKET SIZE & MARKET SHARE, BY COUNTRY (2018 VS 2025) 30
      1. FIGURE
    179. MIDDLE EAST & AFRICA: RESERVOIR ANALYSIS MARKET SIZE & MARKET SHARE,
      1. BY COUNTRY (2018 VS 2025) 30
    180. SOUTH AMERICA: RESERVOIR ANALYSIS MARKET
    181. SIZE & MARKET SHARE, BY COUNTRY (2018 VS 2025) 31
    182. MARKET DYNAMICS
      1. OVERVIEW 32
    183. DRIVERS IMPACT ANALYSIS: RESERVOIR ANALYSIS MARKET 34
    184. RESTRAINTS IMPACT ANALYSIS: RESERVOIR ANALYSIS MARKET 35
      1. FIGURE
    185. VALUE CHAIN: GLOBAL RESERVOIR ANALYSIS MARKET 37
    186. PORTER'S FIVE
      1. FORCES ANALYSIS OF THE GLOBAL RESERVOIR ANALYSIS MARKET MARKET 39
      2. FIGURE 20
    187. GLOBAL RESERVOIR ANALYSIS MARKET, BY RESERVOIR TYPE, 2018 (% SHARE) 41
      1. FIGURE
    188. GLOBAL RESERVOIR ANALYSIS MARKET, BY TYPE, 2017 TO 2025 (USD MILLION) 42
      1. FIGURE
    189. GLOBAL RESERVOIR ANALYSIS MARKET, BY SERVICE, 2018 (% SHARE) 44
      1. FIGURE 23
    190. GLOBAL RESERVOIR ANALYSIS MARKET, BY SERVICE, 2017 TO 2025 (USD MILLION) 45
      1. FIGURE
    191. GLOBAL RESERVOIR ANALYSIS MARKET, BY APPLICATION, 2018 (% SHARE) 47
      1. FIGURE
    192. GLOBAL RESERVOIR ANALYSIS MARKET, BY APPLICATION, 2017 TO 2025 (USD MILLION)
      1. 48
    193. GLOBAL RESERVOIR ANALYSIS MARKET, BY REGION, 2017 TO 2025 (USD
      1. MILLION) 50
    194. GLOBAL RESERVOIR ANALYSIS MARKET, BY REGION, 2018 (%
      1. SHARE) 51
    195. BENCHMARKING OF MAJOR COMPETITORS 93
    196. MARKET
      1. SHARE ANALYSIS, 2018 94
    197. SCHLUMBERGER LIMITED: FINANCIAL OVERVIEW
      1. SNAPSHOT 99
    198. SCHLUMBERGER LIMITED: SWOT ANALYSIS 101
      1. FIGURE 32
      2. HALLIBURTON: FINANCIAL OVERVIEW SNAPSHOT 103
    199. HALLIBURTON: SWOT ANALYSIS
      1. 105
    200. WEATHERFORD INTERNATIONAL PLC: FINANCIAL OVERVIEW SNAPSHOT 107
    201. WEATHERFORD INTERNATIONAL PLC: SWOT ANALYSIS 109
    202. SGS
      1. SA: FINANCIAL OVERVIEW SNAPSHOT 111
    203. SGS SA: SWOT ANALYSIS 113
    204. GENERAL ELECTRIC: FINANCIAL OVERVIEW SNAPSHOT 115
    205. GENERAL
      1. ELECTRIC: SWOT ANALYSIS 117
    206. ALS LIMITED: FINANCIAL OVERVIEW SNAPSHOT
      1. 119
    207. CGG: FINANCIAL OVERVIEW SNAPSHOT 122
    208. EMERSON ELECTRIC
      1. CO: FINANCIAL OVERVIEW SNAPSHOT 126
    209. TRICAN: FINANCIAL OVERVIEW SNAPSHOT
      1. 128
    210. CORE LABORATORIES: FINANCIAL OVERVIEW SNAPSHOT 131
      1. FIGURE
    211. EXPRO GROUP: FINANCIAL OVERVIEW SNAPSHOT 133
    212. INTERTEK GROUP PLC:
      1. FINANCIAL OVERVIEW SNAPSHOT 136

    Reservoir Analysis Market Segmentation

    Market Segmentation Overview

    • Detailed segmentation data will be available in the full report
    • Comprehensive analysis by multiple parameters
    • Regional and country-level breakdowns
    • Market size forecasts by segment
    Infographic

    Free Sample Request

    Kindly complete the form below to receive a free sample of this Report

    Get Free Sample

    Customer Strories

    “I am very pleased with how market segments have been defined in a relevant way for my purposes (such as "Portable Freezers & refrigerators" and "last-mile"). In general the report is well structured. Thanks very much for your efforts.”

    Victoria Milne

    Founder
    Case Study
    Chemicals and Materials