• Cat-intel
  • MedIntelliX
  • Resources
  • About Us
  • Hero Background
    English
    Chinese
    French
    Japanese
    Korean
    German
    Spanish

    Refractory Material Market Trends

    ID: MRFR/CnM/10049-HCR
    200 Pages
    Chitranshi Jaiswal
    October 2025

    Refractory Material Market Research Report By Chemistry (Acidic, Basic, Neutral), By Form (Shaped, Unshaped), By End Use (Metal & Metallurgy, Cement, Glass & Ceramics, Power Generation, Others) and By Regional (North America, Europe, South America, Asia Pacific, Middle East and Africa) - Forecast to 2035

    Share:
    Download PDF ×

    We do not share your information with anyone. However, we may send you emails based on your report interest from time to time. You may contact us at any time to opt-out.

    Refractory Material Market Infographic
    $ 4,950.0
    $ 5,950.0
    $ 7,250.0

    Market Trends

    Key Emerging Trends in the Refractory Material Market

    The Refractory Material Market is currently undergoing dynamic trends driven by the demand from various industries such as steel, cement, glass, and non-ferrous metals, coupled with advancements in technology, sustainability considerations, and evolving global economic landscapes. One significant trend is the increasing demand for high-performance refractory materials in the steel industry. As steel production processes continue to evolve, with an emphasis on efficiency and sustainability, the need for refractories capable of withstanding extreme temperatures and aggressive chemical environments is growing. This trend aligns with the steel industry's quest for innovative solutions that enhance the lifespan and performance of refractory linings in furnaces and other high-temperature applications.

    Moreover, the cement industry is a major contributor to the momentum in the Refractory Material Market. Refractories play a crucial role in cement kilns, where they are subjected to high temperatures and abrasive conditions. The trend in the cement sector is towards the development of refractory materials that offer longer service life, reduced maintenance costs, and improved energy efficiency. This aligns with the industry's focus on sustainability and cost-effective solutions, as refractories significantly impact the overall efficiency and environmental performance of cement manufacturing processes.

    Technological advancements in refractory materials are shaping market trends in the Refractory Material Market. Innovations in raw material formulations, manufacturing processes, and the incorporation of nanotechnology are optimizing the properties and performance of refractories. The market is witnessing the development of advanced monolithic refractories, which offer flexibility in design, ease of installation, and enhanced thermal shock resistance. This trend is crucial for meeting the evolving needs of industries where refractory materials are applied, ensuring durability, efficiency, and cost-effectiveness.

    Sustainability considerations are becoming increasingly important in shaping market dynamics in the Refractory Material Market. Manufacturers are exploring sustainable sourcing of raw materials, eco-friendly production processes, and recyclable options for refractory products. This trend aligns with the broader industry movement towards environmentally responsible practices, reflecting the commitment to reducing the environmental impact of refractory materials and meeting the growing demand for sustainable solutions.

    E-commerce is playing a role in reshaping the distribution channels of refractory materials. The convenience of online platforms for product discovery, comparison, and purchase is influencing buyer behavior in the industrial materials sector. Manufacturers and distributors are adapting to this trend by enhancing their online presence, providing detailed product information, and offering efficient delivery services. The accessibility of refractory materials through e-commerce platforms contributes to increased market reach and customer engagement.

    The mining and metal industry's influence on refractory material trends is significant, with refractories being essential in the production of non-ferrous metals such as aluminum, copper, and nickel. As the demand for these metals continues to grow, there is an increased need for refractories that can withstand the harsh conditions of metal extraction and refining processes. This trend aligns with the mining and metal industry's focus on efficiency, cost-effectiveness, and the reduction of downtime in high-temperature applications.

    Regulatory considerations and adherence to industry standards are pivotal factors shaping market dynamics in the Refractory Material Market. Given the critical role of refractories in industries such as steel, cement, and non-ferrous metals, compliance with regulations related to product quality, safety, and environmental impact is paramount. Companies are investing in research and development to ensure that their refractory products meet or exceed regulatory requirements, providing assurances to industries that rely on these materials.

    Strategic collaborations and partnerships are emerging as trends in the Refractory Material Market. Companies are exploring synergies through joint ventures, alliances, and collaborations to enhance research, development, and commercialization efforts. The collaborative approach allows for the exchange of expertise, resources, and market insights, fostering innovation and ensuring the continuous growth of the refractory material industry.

    Market Summary

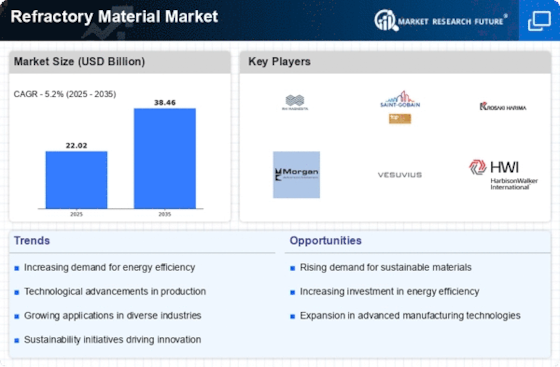
    As per Market Research Future Analysis, the Global Refractory Material Market was valued at USD 22.02 Billion in 2024 and is projected to reach USD 38.46 Billion by 2035, growing at a CAGR of 5.20% from 2025 to 2035. The growth is primarily driven by the increasing demand from the iron and steel industry, which relies heavily on refractories for high-temperature processes. Refractories are essential for maintaining the efficiency and durability of equipment such as blast furnaces and steel ladles, which are critical in metal production. The market is also supported by rising steel demand across various sectors, including construction and automotive, particularly in emerging economies experiencing rapid industrialization.

    Key Market Trends & Highlights

    Key trends influencing the refractory material market include:

    • Market Size in 2024: USD 22.02 Billion
    • Projected Market Size by 2035: USD 38.46 Billion
    • CAGR from 2025 to 2035: 5.20%
    • Dominant Segment: Metal and metallurgy, driven by high demand for refractories in steel production

    Market Size & Forecast

    2024 Market Size USD 22.02 Billion
    2035 Market Size USD 38.46 Billion
    CAGR (2025-2035) 5.20%
    Largest Regional Market Share in 2024 North America

    Major Players

    Key players in the market include Calderys, Dalmia Bharat Refractory, IFGL Refractories Ltd., Krosaki Harima Corporation, Morgan Advanced Materials, RHI Magnesita GmbH, Saint Gobain, and others.

    Market Trends

    The  Refractory Material Market is seeing big changes, mostly because of the rising demand from businesses that utilize it, such as making steel and cement. The growing production of steel is one of the main factors driving the market, as refractory materials are needed to line furnaces, kilns, and other high-temperature processing equipment. Also, the expansion in building homes and businesses throughout the world increases the need for cement, which is another important use of refractory materials.

    There has been a clear move in the last few years toward employing innovative and eco-friendly refractory materials that improve energy efficiency and lower emissions.

    Recently, the industry has also seen a trend toward consolidation among major players. Companies are doing this to improve their operational efficiency and market reach via strategic alliances and mergers. These changes show that the  Refractory Material Market is always changing, with new products and changing customer tastes affecting its future.

    The global refractory materials market is poised for growth, driven by increasing demand from industries such as steel and cement, which require high-performance materials to withstand extreme temperatures and corrosive environments.

    U.S. Geological Survey (USGS)

    Refractory Material Market Market Drivers

    Market Growth Projections

    The Global Refractory Material Market Industry is projected to experience substantial growth over the coming years. With a market valuation of 22.0 USD Billion in 2024, it is anticipated to reach 36.6 USD Billion by 2035. This growth trajectory indicates a compound annual growth rate (CAGR) of 4.72% from 2025 to 2035. Such projections reflect the increasing demand for refractory materials across various industries, driven by technological advancements, regulatory compliance, and the expansion of emerging economies. The market's growth potential presents opportunities for stakeholders to invest and innovate within this dynamic sector.

    Growth of Emerging Economies

    Emerging economies are playing a crucial role in the expansion of the Global Refractory Material Market Industry. Countries such as India, Brazil, and China are witnessing rapid industrialization, which is driving the demand for refractory materials across various sectors. The increasing investments in infrastructure and manufacturing capabilities in these regions are expected to bolster market growth. As these economies continue to develop, the need for high-quality refractory materials to support their industrial activities will likely rise. This trend presents significant opportunities for manufacturers to penetrate these markets and cater to the growing demand.

    Increasing Demand from End-Use Industries

    The Global Refractory Material Market Industry experiences heightened demand driven by various end-use sectors, particularly steel, cement, and glass manufacturing. The steel industry, which is a significant consumer of refractory materials, is projected to maintain robust growth, contributing to the overall market expansion. As of 2024, the market is valued at approximately 22.0 USD Billion, with expectations of reaching 36.6 USD Billion by 2035. This growth trajectory suggests a compound annual growth rate (CAGR) of 4.72% from 2025 to 2035, indicating a sustained need for high-performance refractory materials to withstand extreme temperatures and corrosive environments.

    Market Diversification and Product Innovation

    The Global Refractory Material Market Industry is characterized by ongoing diversification and product innovation. Manufacturers are increasingly focusing on developing a wide range of refractory materials tailored to specific applications, such as monolithic refractories, bricks, and precast shapes. This diversification allows companies to cater to a broader spectrum of industries, including petrochemicals and power generation. Additionally, innovations in refractory formulations, such as the incorporation of advanced materials, enhance performance characteristics. As industries seek customized solutions to meet their unique operational challenges, the demand for innovative refractory products is expected to grow, further driving market expansion.

    Regulatory Compliance and Environmental Standards

    The Global Refractory Material Market Industry is significantly influenced by stringent regulatory frameworks and environmental standards. Governments worldwide are increasingly enforcing regulations aimed at reducing emissions and promoting sustainable practices within manufacturing sectors. This regulatory landscape compels industries to adopt refractory materials that comply with environmental standards, thereby driving demand for eco-friendly alternatives. Manufacturers are responding by developing low-emission refractory products, which not only meet compliance requirements but also enhance operational efficiency. As a result, the market is likely to witness a shift towards sustainable refractory solutions, aligning with global sustainability goals.

    Technological Advancements in Refractory Production

    Technological innovations in the production of refractory materials are pivotal for the Global Refractory Material Market Industry. Advances in manufacturing processes, such as the development of ultra-refractory materials and improved bonding techniques, enhance the performance and longevity of these products. For instance, the introduction of nanotechnology in refractory formulations may lead to materials that exhibit superior thermal stability and resistance to thermal shock. Such advancements not only improve product efficiency but also cater to the evolving requirements of industries, thereby driving market growth. As industries seek to optimize their operations, the demand for technologically advanced refractory materials is likely to increase.

    Market Segment Insights

    Refractory Material Market Segment Insights

    Refractory Material Market Segment Insights

    Refractory Material Market Chemistry Insights

    Refractory Material Market Chemistry Insights

    The  Refractory Material Market is poised for considerable growth within the Chemistry segment, with expected valuations of 22.02 USD Billion in 2024 and elevating to 36.56 USD Billion by 2035. This segment is categorized into Acidic, Basic, and Neutral, with each exhibiting unique characteristics and applications that contribute to overall market dynamics.

    The Acidic category holds a prominent position, being valued at 8.54 USD Billion in 2024 and projected to reach 14.31 USD Billion by 2035, indicating a significant demand for materials that can withstand acidic environments found in industries such as metallurgy and glass manufacturing.Such growth in the Acidic segment can be attributed to an increasing emphasis on high-performance applications where durability in harsh chemical settings is crucial.

    The Basic segment, starting at a valuation of 6.18 USD Billion in 2024 and expected to grow to 10.27 USD Billion by 2035, reflects the need for refractories that can provide resilience in basic environments, commonly required in steel production and nonferrous metals industries.

    This segment is gaining momentum as manufacturers seek to enhance the performance and longevity of their materials under extreme conditions.The Neutral category, valued at 7.30 USD Billion in 2024 and projected to reach 12.98 USD Billion by 2035, serves as a versatile option for various applications and is expected to be favored in sectors where neither acidic nor basic properties dominate. Overall, the  Refractory Material Market segmentation illustrates the diverse requirements across different industries, with each category playing a strategic role in fulfilling the rigorous demands of modern manufacturing and chemical processes.

    Refractory Material Market Form Insights

    Refractory Material Market Form Insights

    The  Refractory Material Market, particularly influenced by the Form segment, is expected to achieve a valuation of 22.02 USD Billion by 2024, showcasing steady growth. This segment is primarily divided into two categories: Shaped and Unshaped refractory materials. Shaped refractories, known for their molded designs to withstand high temperatures, play a crucial role in industries such as steel and cement where durability is paramount.

    Meanwhile, Unshaped refractories, which include castables and plastic refractories, offer versatility and adaptability for various applications, often preferred for their ease of installation and maintenance.Both forms are pivotal in applications where heat resistance and structural integrity are vital. The  Refractory Material Market revenue reflects increasing industrial activities and the rising demand from sectors like metallurgy and ceramics, suggesting robust market growth. Market trends reveal that innovations in material formulations and enhanced thermal properties are driving advancements in both Shaped and Unshaped categories.

    Opportunities lie in the expansion of emerging markets, where infrastructure development and industrialization are on the rise, fostering a favorable environment for the growth of the  Refractory Material Market industry.

    Refractory Material Market End Use Insights

    Refractory Material Market End Use Insights

    The  Refractory Material Market is significantly shaped by its End Use, which includes key sectors such as Metal and Metallurgy, Cement, Glass and Ceramics, Power Generation, and Others. In 2024, the overall market is expected to reach a value of 22.02 billion USD, reflecting robust growth driven by increasing industrial activities. The Metal and Metallurgy sector is crucial as it requires high-performance refractory materials for processes like steel and aluminum production, emphasizing durability and thermal shock resistance.

    The Cement industry also plays a vital role, as refractories are needed for kilns operating at extreme temperatures.Likewise, the Glass and Ceramics sector demands high-quality refractories to secure product integrity during melting and forming. In terms of market growth opportunities, increasing investments in the power generation sector, particularly in renewable energy, is likely to drive demand for specialized refractory materials. Despite the growth drivers, challenges such as price volatility and the impact of environmental regulations may hinder market progression.

    Overall, the  Refractory Material Market segmentation reveals a diverse landscape, with each sector contributing uniquely to the overall market dynamics and growth potential.

    Get more detailed insights about Refractory Material Market Research Report - Global Forecast to 2035

    Regional Insights

    The  Refractory Material Market displays significant regional growth, with North America projected to hold a value of 6.0 USD Billion in 2024, expected to rise to 9.8 USD Billion in 2035, highlighting its major role in the industry. Europe follows closely, with values of 5.3 USD Billion in 2024 and 8.8 USD Billion in 2035, driven largely by stringent regulations promoting energy-efficient materials and innovation in manufacturing processes.

    The Asia Pacific region leads with a substantial valuation of 8.0 USD Billion in 2024, growing to 13.0 USD Billion in 2035, driven by booming industries such as steel and cement that require superior refractory materials.Meanwhile, South America, valued at 1.5 USD Billion in 2024 and 2.5 USD Billion in 2035, presents a smaller segment yet showcases growth potential through increasing investments in infrastructure. The Middle East and Africa hold a valuation of 1.22 USD Billion in 2024, advancing to 2.46 USD Billion in 2035, fueled by increasing energy demands and industrialization.

    Overall, the regional distribution of the  Refractory Material Market clearly illustrates varying degrees of demand and growth potential across different jurisdictions, influenced by industrial activities and regulatory frameworks designed to enhance efficiency and sustainability.

    Refractory Material Market Regional Insights

    Source: Primary Research, Secondary Research, Market Research Future Database and Analyst Review

    Key Companies in the Refractory Material Market market include

    Industry Developments

    • Q1 2025: China's Refractories Exports Reach Record Highs In March 2025, the Association of China Refractories Industry reported that China's total refractory exports increased 12% year-on-year to a record high, driven by breakthroughs in high-end products and strong demand from India, Southeast Asia, and Europe.
    • Q1 2025: U.S. launches new standard for refractory industry On March 10, 2025, the American Society for Testing and Materials (ASTM) announced a new test standard for refractory materials, aimed at improving stability and safety in high-temperature environments for industries such as steel, cement, and glass manufacturing.
    • Q1 2025: Indian refractories market demand surge In March 2025, the Indian Refractory Manufacturers Association reported a significant increase in market demand due to rapid growth in India's steel and building materials sectors, with several international refractory companies announcing new or expanded production bases in India.

    Future Outlook

    Refractory Material Market Future Outlook

    The Global Refractory Material Market is projected to grow at a 5.20% CAGR from 2025 to 2035, driven by industrial demand, technological advancements, and sustainability initiatives.

    New opportunities lie in:

    • Invest in advanced ceramic materials for high-temperature applications.
    • Develop eco-friendly refractory solutions to meet regulatory standards.
    • Leverage digital technologies for predictive maintenance in refractory installations.

    By 2035, the market is expected to achieve robust growth, positioning itself as a cornerstone of industrial innovation.

    Market Segmentation

    Refractory Material Market Form Outlook

    • Shaped
    • Unshaped

    Refractory Material Market End Use Outlook

    • Metal & Metallurgy
    • Cement
    • Glass & Ceramics
    • Power Generation
    • Others

    Refractory Material Market Regional Outlook

    • North America
    • Europe
    • South America
    • Asia Pacific
    • Middle East and Africa

    Refractory Material Market Chemistry Outlook

    • Acidic
    • Basic
    • Neutral

    Report Scope

    Report Attribute/Metric Details
    Market Size 2024 22.02(USD Billion)
    Market Size 2035 38.46 (USD Billion)
    Compound Annual Growth Rate (CAGR) 5.20% (2025 - 2035)
    Report Coverage Revenue Forecast, Competitive Landscape, Growth Factors, and Trends
    Base Year 2024
    Market Forecast Period 2025 - 2035
    Historical Data 2019 - 2024
    Market Forecast Units USD Billion
    Key Companies Profiled SaintGobain, RHI Magnesita GmbH, Nippon Steel Corporation, China National Building Material Group, Magnezit Group, The Calderys Group, HarbisonWalker International, Morgan Advanced Materials, Vesuvius, Krosaki Harima Corporation, Alsey Refractories,
    Segments Covered Chemistry, Form, End Use, Regional
    Key Market Opportunities Growing demand in construction sector, Increasing energy efficiency regulations, Advancements in manufacturing technologies, Rising steel and cement production, Expansion in emerging markets
    Key Market Dynamics temperature resistance, industry growth, demand from steel industry, technological advancements, recycling initiatives
    Countries Covered North America, Europe, APAC, South America, MEA
    Market Size 2025 23.16 (USD Billion)

    Market Highlights

    Author

    Chitranshi Jaiswal
    Research Analyst Level I

    She holds an experience of about 6+ years in market research and business consulting, working under the spectrum of information communication technology, telecommunications and semiconductor domains. aarti conceptualizes and implements a scalable business strategy and provides strategic leadership to the clients. her expertise lies in market estimation, competitive intelligence, pipeline analysis, customer assessment, etc.

    Leave a Comment

    Latest Comments

    John Doe
    john@example.com

    This is a great article! Really helped me understand the topic better.

    Posted on July 23, 2025, 10:15 AM
    Jane Smith
    jane@domain.com

    Thanks for sharing this. I’ve bookmarked it for later reference.

    Posted on July 22, 2025, 7:45 PM

    FAQs

    What is the projected market size of the Refractory Material Market by 2035?

    The Refractory Material Market is expected to be valued at 36.56 USD Billion by the year 2035.

    What is the expected CAGR for the Refractory Material Market from 2025 to 2035?

    Refractory Material Market is projected to register a CAGR of 5.2% from 2025-2035

    Which region is expected to have the largest market share in the Refractory Material Market by 2035?

    The Asia Pacific region is anticipated to maintain the largest market share, projected to be valued at 13.0 USD Billion by 2035.

    What will be the market value of acidic refractory materials in 2035?

    The market value for acidic refractory materials is expected to reach 14.31 USD Billion in 2035.

    Who are the key players in the Refractory Material Market?

    Major players include SaintGobain, RHI Magnesita GmbH, Nippon Steel Corporation, and Vesuvius, among others.

    What will the market size for neutral refractory materials be in 2024?

    The market size for neutral refractory materials is projected to be 7.3 USD Billion in 2024.

    What is the expected value of the North American market for refractory materials in 2035?

    The North American market is anticipated to reach a value of 9.8 USD Billion by 2035.

    What are the market opportunities driving growth in the Refractory Material Market?

    Increased demand from industries such as steel and glass manufacturing are key growth drivers for the market.

    How much is the South American refractory materials market expected to be valued at in 2035?

    The South American refractory materials market is expected to be valued at 2.5 USD Billion in 2035.

    What is the projected value of the basic refractory materials segment by 2035?

    The basic refractory materials segment is expected to reach a valuation of 10.27 USD Billion by 2035.

    1. Table of Contents
    2. Executive Summary
      1. Market Overview
      2. Key Findings
      3. Market Segmentation
      4. Competitive Landscape
      5. Challenges and Opportunities
      6. Future Outlook
    3. Market Introduction
      1. Definition
      2. Scope of the Study
        1. Research Objective
        2. Assumption
        3. Limitations
    4. Research Methodology
      1. Overview
      2. Data Mining
      3. Secondary Research
      4. Primary Research
        1. Primary Interviews and Information Gathering Process
        2. Breakdown of Primary Respondents
      5. Forecasting Model
      6. Market Size Estimation
        1. Bottom-up Approach
        2. Top-Down Approach
      7. Data Triangulation
      8. Validation
    5. MARKET DYNAMICS
      1. Overview
      2. Drivers
      3. Restraints
      4. Opportunities
    6. MARKET FACTOR ANALYSIS
      1. Value chain Analysis
      2. Porter's Five Forces Analysis
        1. Bargaining Power of Suppliers
        2. Bargaining Power of Buyers
        3. Threat of New Entrants
        4. Threat of Substitutes
        5. Intensity of Rivalry
      3. COVID-19 Impact Analysis
        1. Market Impact Analysis
        2. Regional Impact
        3. Opportunity and Threat Analysis
    7. REFRACTORY MATERIAL MARKET, BY CHEMISTRY (USD BILLION)
      1. Acidic
      2. Basic
      3. Neutral
    8. REFRACTORY MATERIAL MARKET, BY FORM (USD BILLION)
      1. Shaped
      2. Unshaped
    9. REFRACTORY MATERIAL MARKET, BY END USE (USD BILLION)
      1. Metal & Metallurgy
      2. Cement
      3. Glass & Ceramics
      4. Power Generation
      5. Others
    10. REFRACTORY MATERIAL MARKET, BY REGIONAL (USD BILLION)
      1. North America
        1. US
        2. Canada
      2. Europe
        1. Germany
        2. UK
        3. France
        4. Russia
        5. Italy
        6. Spain
        7. Rest of Europe
      3. APAC
        1. China
        2. India
        3. Japan
        4. South Korea
        5. Malaysia
        6. Thailand
        7. Indonesia
        8. Rest of APAC
      4. South America
        1. Brazil
        2. Mexico
        3. Argentina
        4. Rest of South America
      5. MEA
        1. GCC Countries
        2. South Africa
        3. Rest of MEA
    11. Competitive Landscape
      1. Overview
      2. Competitive Analysis
      3. Market share Analysis
      4. Major Growth Strategy in the Refractory Material Market
      5. Competitive Benchmarking
      6. Leading Players in Terms of Number of Developments in the Refractory Material Market
      7. Key developments and growth strategies
        1. New Product Launch/Service Deployment
        2. Merger & Acquisitions
        3. Joint Ventures
      8. Major Players Financial Matrix
        1. Sales and Operating Income
        2. Major Players R&D Expenditure. 2023
    12. COMPANY PROFILES
      1. SaintGobain
        1. Financial Overview
        2. Products Offered
        3. Key Developments
        4. SWOT Analysis
        5. Key Strategies
      2. Shree Ram Minerals
        1. Financial Overview
        2. Products Offered
        3. Key Developments
        4. SWOT Analysis
        5. Key Strategies
      3. RHI Magnesita GmbH
        1. Financial Overview
        2. Products Offered
        3. Key Developments
        4. SWOT Analysis
        5. Key Strategies
      4. Nippon Steel Corporation
        1. Financial Overview
        2. Products Offered
        3. Key Developments
        4. SWOT Analysis
        5. Key Strategies
      5. China National Building Material Group
        1. Financial Overview
        2. Products Offered
        3. Key Developments
        4. SWOT Analysis
        5. Key Strategies
      6. Corning
        1. Financial Overview
        2. Products Offered
        3. Key Developments
        4. SWOT Analysis
        5. Key Strategies
      7. Bharat Mines and Minerals
        1. Financial Overview
        2. Products Offered
        3. Key Developments
        4. SWOT Analysis
        5. Key Strategies
      8. Magnezit Group
        1. Financial Overview
        2. Products Offered
        3. Key Developments
        4. SWOT Analysis
        5. Key Strategies
      9. The Calderys Group
        1. Financial Overview
        2. Products Offered
        3. Key Developments
        4. SWOT Analysis
        5. Key Strategies
      10. HarbisonWalker International
        1. Financial Overview
        2. Products Offered
        3. Key Developments
        4. SWOT Analysis
        5. Key Strategies
      11. Morgan Advanced Materials
        1. Financial Overview
        2. Products Offered
        3. Key Developments
        4. SWOT Analysis
        5. Key Strategies
      12. Vesuvius
        1. Financial Overview
        2. Products Offered
        3. Key Developments
        4. SWOT Analysis
        5. Key Strategies
      13. Krosaki Harima Corporation
        1. Financial Overview
        2. Products Offered
        3. Key Developments
        4. SWOT Analysis
        5. Key Strategies
      14. Alsey Refractories
        1. Financial Overview
        2. Products Offered
        3. Key Developments
        4. SWOT Analysis
        5. Key Strategies
      15. RHI Magnesita
        1. Financial Overview
        2. Products Offered
        3. Key Developments
        4. SWOT Analysis
        5. Key Strategies
    13. APPENDIX
      1. References
      2. Related Reports
    14. List of Tables and Figures
      1. LIST OF TABLES
      2. TABLE 1. LIST OF ASSUMPTIONS
      3. TABLE 2. NORTH AMERICA REFRACTORY MATERIAL MARKET SIZE ESTIMATES & FORECAST, BY CHEMISTRY, 2019-2035 (USD BILLIONS)
      4. TABLE 3. NORTH AMERICA REFRACTORY MATERIAL MARKET SIZE ESTIMATES & FORECAST, BY FORM, 2019-2035 (USD BILLIONS)
      5. TABLE 4. NORTH AMERICA REFRACTORY MATERIAL MARKET SIZE ESTIMATES & FORECAST, BY END USE, 2019-2035 (USD BILLIONS)
      6. TABLE 5. NORTH AMERICA REFRACTORY MATERIAL MARKET SIZE ESTIMATES & FORECAST, BY REGIONAL, 2019-2035 (USD BILLIONS)
      7. TABLE 6. US REFRACTORY MATERIAL MARKET SIZE ESTIMATES & FORECAST, BY CHEMISTRY, 2019-2035 (USD BILLIONS)
      8. TABLE 7. US REFRACTORY MATERIAL MARKET SIZE ESTIMATES & FORECAST, BY FORM, 2019-2035 (USD BILLIONS)
      9. TABLE 8. US REFRACTORY MATERIAL MARKET SIZE ESTIMATES & FORECAST, BY END USE, 2019-2035 (USD BILLIONS)
      10. TABLE 9. US REFRACTORY MATERIAL MARKET SIZE ESTIMATES & FORECAST, BY REGIONAL, 2019-2035 (USD BILLIONS)
      11. TABLE 10. CANADA REFRACTORY MATERIAL MARKET SIZE ESTIMATES & FORECAST, BY CHEMISTRY, 2019-2035 (USD BILLIONS)
      12. TABLE 11. CANADA REFRACTORY MATERIAL MARKET SIZE ESTIMATES & FORECAST, BY FORM, 2019-2035 (USD BILLIONS)
      13. TABLE 12. CANADA REFRACTORY MATERIAL MARKET SIZE ESTIMATES & FORECAST, BY END USE, 2019-2035 (USD BILLIONS)
      14. TABLE 13. CANADA REFRACTORY MATERIAL MARKET SIZE ESTIMATES & FORECAST, BY REGIONAL, 2019-2035 (USD BILLIONS)
      15. TABLE 14. EUROPE REFRACTORY MATERIAL MARKET SIZE ESTIMATES & FORECAST, BY CHEMISTRY, 2019-2035 (USD BILLIONS)
      16. TABLE 15. EUROPE REFRACTORY MATERIAL MARKET SIZE ESTIMATES & FORECAST, BY FORM, 2019-2035 (USD BILLIONS)
      17. TABLE 16. EUROPE REFRACTORY MATERIAL MARKET SIZE ESTIMATES & FORECAST, BY END USE, 2019-2035 (USD BILLIONS)
      18. TABLE 17. EUROPE REFRACTORY MATERIAL MARKET SIZE ESTIMATES & FORECAST, BY REGIONAL, 2019-2035 (USD BILLIONS)
      19. TABLE 18. GERMANY REFRACTORY MATERIAL MARKET SIZE ESTIMATES & FORECAST, BY CHEMISTRY, 2019-2035 (USD BILLIONS)
      20. TABLE 19. GERMANY REFRACTORY MATERIAL MARKET SIZE ESTIMATES & FORECAST, BY FORM, 2019-2035 (USD BILLIONS)
      21. TABLE 20. GERMANY REFRACTORY MATERIAL MARKET SIZE ESTIMATES & FORECAST, BY END USE, 2019-2035 (USD BILLIONS)
      22. TABLE 21. GERMANY REFRACTORY MATERIAL MARKET SIZE ESTIMATES & FORECAST, BY REGIONAL, 2019-2035 (USD BILLIONS)
      23. TABLE 22. UK REFRACTORY MATERIAL MARKET SIZE ESTIMATES & FORECAST, BY CHEMISTRY, 2019-2035 (USD BILLIONS)
      24. TABLE 23. UK REFRACTORY MATERIAL MARKET SIZE ESTIMATES & FORECAST, BY FORM, 2019-2035 (USD BILLIONS)
      25. TABLE 24. UK REFRACTORY MATERIAL MARKET SIZE ESTIMATES & FORECAST, BY END USE, 2019-2035 (USD BILLIONS)
      26. TABLE 25. UK REFRACTORY MATERIAL MARKET SIZE ESTIMATES & FORECAST, BY REGIONAL, 2019-2035 (USD BILLIONS)
      27. TABLE 26. FRANCE REFRACTORY MATERIAL MARKET SIZE ESTIMATES & FORECAST, BY CHEMISTRY, 2019-2035 (USD BILLIONS)
      28. TABLE 27. FRANCE REFRACTORY MATERIAL MARKET SIZE ESTIMATES & FORECAST, BY FORM, 2019-2035 (USD BILLIONS)
      29. TABLE 28. FRANCE REFRACTORY MATERIAL MARKET SIZE ESTIMATES & FORECAST, BY END USE, 2019-2035 (USD BILLIONS)
      30. TABLE 29. FRANCE REFRACTORY MATERIAL MARKET SIZE ESTIMATES & FORECAST, BY REGIONAL, 2019-2035 (USD BILLIONS)
      31. TABLE 30. RUSSIA REFRACTORY MATERIAL MARKET SIZE ESTIMATES & FORECAST, BY CHEMISTRY, 2019-2035 (USD BILLIONS)
      32. TABLE 31. RUSSIA REFRACTORY MATERIAL MARKET SIZE ESTIMATES & FORECAST, BY FORM, 2019-2035 (USD BILLIONS)
      33. TABLE 32. RUSSIA REFRACTORY MATERIAL MARKET SIZE ESTIMATES & FORECAST, BY END USE, 2019-2035 (USD BILLIONS)
      34. TABLE 33. RUSSIA REFRACTORY MATERIAL MARKET SIZE ESTIMATES & FORECAST, BY REGIONAL, 2019-2035 (USD BILLIONS)
      35. TABLE 34. ITALY REFRACTORY MATERIAL MARKET SIZE ESTIMATES & FORECAST, BY CHEMISTRY, 2019-2035 (USD BILLIONS)
      36. TABLE 35. ITALY REFRACTORY MATERIAL MARKET SIZE ESTIMATES & FORECAST, BY FORM, 2019-2035 (USD BILLIONS)
      37. TABLE 36. ITALY REFRACTORY MATERIAL MARKET SIZE ESTIMATES & FORECAST, BY END USE, 2019-2035 (USD BILLIONS)
      38. TABLE 37. ITALY REFRACTORY MATERIAL MARKET SIZE ESTIMATES & FORECAST, BY REGIONAL, 2019-2035 (USD BILLIONS)
      39. TABLE 38. SPAIN REFRACTORY MATERIAL MARKET SIZE ESTIMATES & FORECAST, BY CHEMISTRY, 2019-2035 (USD BILLIONS)
      40. TABLE 39. SPAIN REFRACTORY MATERIAL MARKET SIZE ESTIMATES & FORECAST, BY FORM, 2019-2035 (USD BILLIONS)
      41. TABLE 40. SPAIN REFRACTORY MATERIAL MARKET SIZE ESTIMATES & FORECAST, BY END USE, 2019-2035 (USD BILLIONS)
      42. TABLE 41. SPAIN REFRACTORY MATERIAL MARKET SIZE ESTIMATES & FORECAST, BY REGIONAL, 2019-2035 (USD BILLIONS)
      43. TABLE 42. REST OF EUROPE REFRACTORY MATERIAL MARKET SIZE ESTIMATES & FORECAST, BY CHEMISTRY, 2019-2035 (USD BILLIONS)
      44. TABLE 43. REST OF EUROPE REFRACTORY MATERIAL MARKET SIZE ESTIMATES & FORECAST, BY FORM, 2019-2035 (USD BILLIONS)
      45. TABLE 44. REST OF EUROPE REFRACTORY MATERIAL MARKET SIZE ESTIMATES & FORECAST, BY END USE, 2019-2035 (USD BILLIONS)
      46. TABLE 45. REST OF EUROPE REFRACTORY MATERIAL MARKET SIZE ESTIMATES & FORECAST, BY REGIONAL, 2019-2035 (USD BILLIONS)
      47. TABLE 46. APAC REFRACTORY MATERIAL MARKET SIZE ESTIMATES & FORECAST, BY CHEMISTRY, 2019-2035 (USD BILLIONS)
      48. TABLE 47. APAC REFRACTORY MATERIAL MARKET SIZE ESTIMATES & FORECAST, BY FORM, 2019-2035 (USD BILLIONS)
      49. TABLE 48. APAC REFRACTORY MATERIAL MARKET SIZE ESTIMATES & FORECAST, BY END USE, 2019-2035 (USD BILLIONS)
      50. TABLE 49. APAC REFRACTORY MATERIAL MARKET SIZE ESTIMATES & FORECAST, BY REGIONAL, 2019-2035 (USD BILLIONS)
      51. TABLE 50. CHINA REFRACTORY MATERIAL MARKET SIZE ESTIMATES & FORECAST, BY CHEMISTRY, 2019-2035 (USD BILLIONS)
      52. TABLE 51. CHINA REFRACTORY MATERIAL MARKET SIZE ESTIMATES & FORECAST, BY FORM, 2019-2035 (USD BILLIONS)
      53. TABLE 52. CHINA REFRACTORY MATERIAL MARKET SIZE ESTIMATES & FORECAST, BY END USE, 2019-2035 (USD BILLIONS)
      54. TABLE 53. CHINA REFRACTORY MATERIAL MARKET SIZE ESTIMATES & FORECAST, BY REGIONAL, 2019-2035 (USD BILLIONS)
      55. TABLE 54. INDIA REFRACTORY MATERIAL MARKET SIZE ESTIMATES & FORECAST, BY CHEMISTRY, 2019-2035 (USD BILLIONS)
      56. TABLE 55. INDIA REFRACTORY MATERIAL MARKET SIZE ESTIMATES & FORECAST, BY FORM, 2019-2035 (USD BILLIONS)
      57. TABLE 56. INDIA REFRACTORY MATERIAL MARKET SIZE ESTIMATES & FORECAST, BY END USE, 2019-2035 (USD BILLIONS)
      58. TABLE 57. INDIA REFRACTORY MATERIAL MARKET SIZE ESTIMATES & FORECAST, BY REGIONAL, 2019-2035 (USD BILLIONS)
      59. TABLE 58. JAPAN REFRACTORY MATERIAL MARKET SIZE ESTIMATES & FORECAST, BY CHEMISTRY, 2019-2035 (USD BILLIONS)
      60. TABLE 59. JAPAN REFRACTORY MATERIAL MARKET SIZE ESTIMATES & FORECAST, BY FORM, 2019-2035 (USD BILLIONS)
      61. TABLE 60. JAPAN REFRACTORY MATERIAL MARKET SIZE ESTIMATES & FORECAST, BY END USE, 2019-2035 (USD BILLIONS)
      62. TABLE 61. JAPAN REFRACTORY MATERIAL MARKET SIZE ESTIMATES & FORECAST, BY REGIONAL, 2019-2035 (USD BILLIONS)
      63. TABLE 62. SOUTH KOREA REFRACTORY MATERIAL MARKET SIZE ESTIMATES & FORECAST, BY CHEMISTRY, 2019-2035 (USD BILLIONS)
      64. TABLE 63. SOUTH KOREA REFRACTORY MATERIAL MARKET SIZE ESTIMATES & FORECAST, BY FORM, 2019-2035 (USD BILLIONS)
      65. TABLE 64. SOUTH KOREA REFRACTORY MATERIAL MARKET SIZE ESTIMATES & FORECAST, BY END USE, 2019-2035 (USD BILLIONS)
      66. TABLE 65. SOUTH KOREA REFRACTORY MATERIAL MARKET SIZE ESTIMATES & FORECAST, BY REGIONAL, 2019-2035 (USD BILLIONS)
      67. TABLE 66. MALAYSIA REFRACTORY MATERIAL MARKET SIZE ESTIMATES & FORECAST, BY CHEMISTRY, 2019-2035 (USD BILLIONS)
      68. TABLE 67. MALAYSIA REFRACTORY MATERIAL MARKET SIZE ESTIMATES & FORECAST, BY FORM, 2019-2035 (USD BILLIONS)
      69. TABLE 68. MALAYSIA REFRACTORY MATERIAL MARKET SIZE ESTIMATES & FORECAST, BY END USE, 2019-2035 (USD BILLIONS)
      70. TABLE 69. MALAYSIA REFRACTORY MATERIAL MARKET SIZE ESTIMATES & FORECAST, BY REGIONAL, 2019-2035 (USD BILLIONS)
      71. TABLE 70. THAILAND REFRACTORY MATERIAL MARKET SIZE ESTIMATES & FORECAST, BY CHEMISTRY, 2019-2035 (USD BILLIONS)
      72. TABLE 71. THAILAND REFRACTORY MATERIAL MARKET SIZE ESTIMATES & FORECAST, BY FORM, 2019-2035 (USD BILLIONS)
      73. TABLE 72. THAILAND REFRACTORY MATERIAL MARKET SIZE ESTIMATES & FORECAST, BY END USE, 2019-2035 (USD BILLIONS)
      74. TABLE 73. THAILAND REFRACTORY MATERIAL MARKET SIZE ESTIMATES & FORECAST, BY REGIONAL, 2019-2035 (USD BILLIONS)
      75. TABLE 74. INDONESIA REFRACTORY MATERIAL MARKET SIZE ESTIMATES & FORECAST, BY CHEMISTRY, 2019-2035 (USD BILLIONS)
      76. TABLE 75. INDONESIA REFRACTORY MATERIAL MARKET SIZE ESTIMATES & FORECAST, BY FORM, 2019-2035 (USD BILLIONS)
      77. TABLE 76. INDONESIA REFRACTORY MATERIAL MARKET SIZE ESTIMATES & FORECAST, BY END USE, 2019-2035 (USD BILLIONS)
      78. TABLE 77. INDONESIA REFRACTORY MATERIAL MARKET SIZE ESTIMATES & FORECAST, BY REGIONAL, 2019-2035 (USD BILLIONS)
      79. TABLE 78. REST OF APAC REFRACTORY MATERIAL MARKET SIZE ESTIMATES & FORECAST, BY CHEMISTRY, 2019-2035 (USD BILLIONS)
      80. TABLE 79. REST OF APAC REFRACTORY MATERIAL MARKET SIZE ESTIMATES & FORECAST, BY FORM, 2019-2035 (USD BILLIONS)
      81. TABLE 80. REST OF APAC REFRACTORY MATERIAL MARKET SIZE ESTIMATES & FORECAST, BY END USE, 2019-2035 (USD BILLIONS)
      82. TABLE 81. REST OF APAC REFRACTORY MATERIAL MARKET SIZE ESTIMATES & FORECAST, BY REGIONAL, 2019-2035 (USD BILLIONS)
      83. TABLE 82. SOUTH AMERICA REFRACTORY MATERIAL MARKET SIZE ESTIMATES & FORECAST, BY CHEMISTRY, 2019-2035 (USD BILLIONS)
      84. TABLE 83. SOUTH AMERICA REFRACTORY MATERIAL MARKET SIZE ESTIMATES & FORECAST, BY FORM, 2019-2035 (USD BILLIONS)
      85. TABLE 84. SOUTH AMERICA REFRACTORY MATERIAL MARKET SIZE ESTIMATES & FORECAST, BY END USE, 2019-2035 (USD BILLIONS)
      86. TABLE 85. SOUTH AMERICA REFRACTORY MATERIAL MARKET SIZE ESTIMATES & FORECAST, BY REGIONAL, 2019-2035 (USD BILLIONS)
      87. TABLE 86. BRAZIL REFRACTORY MATERIAL MARKET SIZE ESTIMATES & FORECAST, BY CHEMISTRY, 2019-2035 (USD BILLIONS)
      88. TABLE 87. BRAZIL REFRACTORY MATERIAL MARKET SIZE ESTIMATES & FORECAST, BY FORM, 2019-2035 (USD BILLIONS)
      89. TABLE 88. BRAZIL REFRACTORY MATERIAL MARKET SIZE ESTIMATES & FORECAST, BY END USE, 2019-2035 (USD BILLIONS)
      90. TABLE 89. BRAZIL REFRACTORY MATERIAL MARKET SIZE ESTIMATES & FORECAST, BY REGIONAL, 2019-2035 (USD BILLIONS)
      91. TABLE 90. MEXICO REFRACTORY MATERIAL MARKET SIZE ESTIMATES & FORECAST, BY CHEMISTRY, 2019-2035 (USD BILLIONS)
      92. TABLE 91. MEXICO REFRACTORY MATERIAL MARKET SIZE ESTIMATES & FORECAST, BY FORM, 2019-2035 (USD BILLIONS)
      93. TABLE 92. MEXICO REFRACTORY MATERIAL MARKET SIZE ESTIMATES & FORECAST, BY END USE, 2019-2035 (USD BILLIONS)
      94. TABLE 93. MEXICO REFRACTORY MATERIAL MARKET SIZE ESTIMATES & FORECAST, BY REGIONAL, 2019-2035 (USD BILLIONS)
      95. TABLE 94. ARGENTINA REFRACTORY MATERIAL MARKET SIZE ESTIMATES & FORECAST, BY CHEMISTRY, 2019-2035 (USD BILLIONS)
      96. TABLE 95. ARGENTINA REFRACTORY MATERIAL MARKET SIZE ESTIMATES & FORECAST, BY FORM, 2019-2035 (USD BILLIONS)
      97. TABLE 96. ARGENTINA REFRACTORY MATERIAL MARKET SIZE ESTIMATES & FORECAST, BY END USE, 2019-2035 (USD BILLIONS)
      98. TABLE 97. ARGENTINA REFRACTORY MATERIAL MARKET SIZE ESTIMATES & FORECAST, BY REGIONAL, 2019-2035 (USD BILLIONS)
      99. TABLE 98. REST OF SOUTH AMERICA REFRACTORY MATERIAL MARKET SIZE ESTIMATES & FORECAST, BY CHEMISTRY, 2019-2035 (USD BILLIONS)
      100. TABLE 99. REST OF SOUTH AMERICA REFRACTORY MATERIAL MARKET SIZE ESTIMATES & FORECAST, BY FORM, 2019-2035 (USD BILLIONS)
      101. TABLE 100. REST OF SOUTH AMERICA REFRACTORY MATERIAL MARKET SIZE ESTIMATES & FORECAST, BY END USE, 2019-2035 (USD BILLIONS)
      102. TABLE 101. REST OF SOUTH AMERICA REFRACTORY MATERIAL MARKET SIZE ESTIMATES & FORECAST, BY REGIONAL, 2019-2035 (USD BILLIONS)
      103. TABLE 102. MEA REFRACTORY MATERIAL MARKET SIZE ESTIMATES & FORECAST, BY CHEMISTRY, 2019-2035 (USD BILLIONS)
      104. TABLE 103. MEA REFRACTORY MATERIAL MARKET SIZE ESTIMATES & FORECAST, BY FORM, 2019-2035 (USD BILLIONS)
      105. TABLE 104. MEA REFRACTORY MATERIAL MARKET SIZE ESTIMATES & FORECAST, BY END USE, 2019-2035 (USD BILLIONS)
      106. TABLE 105. MEA REFRACTORY MATERIAL MARKET SIZE ESTIMATES & FORECAST, BY REGIONAL, 2019-2035 (USD BILLIONS)
      107. TABLE 106. GCC COUNTRIES REFRACTORY MATERIAL MARKET SIZE ESTIMATES & FORECAST, BY CHEMISTRY, 2019-2035 (USD BILLIONS)
      108. TABLE 107. GCC COUNTRIES REFRACTORY MATERIAL MARKET SIZE ESTIMATES & FORECAST, BY FORM, 2019-2035 (USD BILLIONS)
      109. TABLE 108. GCC COUNTRIES REFRACTORY MATERIAL MARKET SIZE ESTIMATES & FORECAST, BY END USE, 2019-2035 (USD BILLIONS)
      110. TABLE 109. GCC COUNTRIES REFRACTORY MATERIAL MARKET SIZE ESTIMATES & FORECAST, BY REGIONAL, 2019-2035 (USD BILLIONS)
      111. TABLE 110. SOUTH AFRICA REFRACTORY MATERIAL MARKET SIZE ESTIMATES & FORECAST, BY CHEMISTRY, 2019-2035 (USD BILLIONS)
      112. TABLE 111. SOUTH AFRICA REFRACTORY MATERIAL MARKET SIZE ESTIMATES & FORECAST, BY FORM, 2019-2035 (USD BILLIONS)
      113. TABLE 112. SOUTH AFRICA REFRACTORY MATERIAL MARKET SIZE ESTIMATES & FORECAST, BY END USE, 2019-2035 (USD BILLIONS)
      114. TABLE 113. SOUTH AFRICA REFRACTORY MATERIAL MARKET SIZE ESTIMATES & FORECAST, BY REGIONAL, 2019-2035 (USD BILLIONS)
      115. TABLE 114. REST OF MEA REFRACTORY MATERIAL MARKET SIZE ESTIMATES & FORECAST, BY CHEMISTRY, 2019-2035 (USD BILLIONS)
      116. TABLE 115. REST OF MEA REFRACTORY MATERIAL MARKET SIZE ESTIMATES & FORECAST, BY FORM, 2019-2035 (USD BILLIONS)
      117. TABLE 116. REST OF MEA REFRACTORY MATERIAL MARKET SIZE ESTIMATES & FORECAST, BY END USE, 2019-2035 (USD BILLIONS)
      118. TABLE 117. REST OF MEA REFRACTORY MATERIAL MARKET SIZE ESTIMATES & FORECAST, BY REGIONAL, 2019-2035 (USD BILLIONS)
      119. TABLE 118. PRODUCT LAUNCH/PRODUCT DEVELOPMENT/APPROVAL
      120. TABLE 119. ACQUISITION/PARTNERSHIP LIST OF FIGURES
      121. FIGURE 1. MARKET SYNOPSIS
      122. FIGURE 2. NORTH AMERICA REFRACTORY MATERIAL MARKET ANALYSIS
      123. FIGURE 3. US REFRACTORY MATERIAL MARKET ANALYSIS BY CHEMISTRY
      124. FIGURE 4. US REFRACTORY MATERIAL MARKET ANALYSIS BY FORM
      125. FIGURE 5. US REFRACTORY MATERIAL MARKET ANALYSIS BY END USE
      126. FIGURE 6. US REFRACTORY MATERIAL MARKET ANALYSIS BY REGIONAL
      127. FIGURE 7. CANADA REFRACTORY MATERIAL MARKET ANALYSIS BY CHEMISTRY
      128. FIGURE 8. CANADA REFRACTORY MATERIAL MARKET ANALYSIS BY FORM
      129. FIGURE 9. CANADA REFRACTORY MATERIAL MARKET ANALYSIS BY END USE
      130. FIGURE 10. CANADA REFRACTORY MATERIAL MARKET ANALYSIS BY REGIONAL
      131. FIGURE 11. EUROPE REFRACTORY MATERIAL MARKET ANALYSIS
      132. FIGURE 12. GERMANY REFRACTORY MATERIAL MARKET ANALYSIS BY CHEMISTRY
      133. FIGURE 13. GERMANY REFRACTORY MATERIAL MARKET ANALYSIS BY FORM
      134. FIGURE 14. GERMANY REFRACTORY MATERIAL MARKET ANALYSIS BY END USE
      135. FIGURE 15. GERMANY REFRACTORY MATERIAL MARKET ANALYSIS BY REGIONAL
      136. FIGURE 16. UK REFRACTORY MATERIAL MARKET ANALYSIS BY CHEMISTRY
      137. FIGURE 17. UK REFRACTORY MATERIAL MARKET ANALYSIS BY FORM
      138. FIGURE 18. UK REFRACTORY MATERIAL MARKET ANALYSIS BY END USE
      139. FIGURE 19. UK REFRACTORY MATERIAL MARKET ANALYSIS BY REGIONAL
      140. FIGURE 20. FRANCE REFRACTORY MATERIAL MARKET ANALYSIS BY CHEMISTRY
      141. FIGURE 21. FRANCE REFRACTORY MATERIAL MARKET ANALYSIS BY FORM
      142. FIGURE 22. FRANCE REFRACTORY MATERIAL MARKET ANALYSIS BY END USE
      143. FIGURE 23. FRANCE REFRACTORY MATERIAL MARKET ANALYSIS BY REGIONAL
      144. FIGURE 24. RUSSIA REFRACTORY MATERIAL MARKET ANALYSIS BY CHEMISTRY
      145. FIGURE 25. RUSSIA REFRACTORY MATERIAL MARKET ANALYSIS BY FORM
      146. FIGURE 26. RUSSIA REFRACTORY MATERIAL MARKET ANALYSIS BY END USE
      147. FIGURE 27. RUSSIA REFRACTORY MATERIAL MARKET ANALYSIS BY REGIONAL
      148. FIGURE 28. ITALY REFRACTORY MATERIAL MARKET ANALYSIS BY CHEMISTRY
      149. FIGURE 29. ITALY REFRACTORY MATERIAL MARKET ANALYSIS BY FORM
      150. FIGURE 30. ITALY REFRACTORY MATERIAL MARKET ANALYSIS BY END USE
      151. FIGURE 31. ITALY REFRACTORY MATERIAL MARKET ANALYSIS BY REGIONAL
      152. FIGURE 32. SPAIN REFRACTORY MATERIAL MARKET ANALYSIS BY CHEMISTRY
      153. FIGURE 33. SPAIN REFRACTORY MATERIAL MARKET ANALYSIS BY FORM
      154. FIGURE 34. SPAIN REFRACTORY MATERIAL MARKET ANALYSIS BY END USE
      155. FIGURE 35. SPAIN REFRACTORY MATERIAL MARKET ANALYSIS BY REGIONAL
      156. FIGURE 36. REST OF EUROPE REFRACTORY MATERIAL MARKET ANALYSIS BY CHEMISTRY
      157. FIGURE 37. REST OF EUROPE REFRACTORY MATERIAL MARKET ANALYSIS BY FORM
      158. FIGURE 38. REST OF EUROPE REFRACTORY MATERIAL MARKET ANALYSIS BY END USE
      159. FIGURE 39. REST OF EUROPE REFRACTORY MATERIAL MARKET ANALYSIS BY REGIONAL
      160. FIGURE 40. APAC REFRACTORY MATERIAL MARKET ANALYSIS
      161. FIGURE 41. CHINA REFRACTORY MATERIAL MARKET ANALYSIS BY CHEMISTRY
      162. FIGURE 42. CHINA REFRACTORY MATERIAL MARKET ANALYSIS BY FORM
      163. FIGURE 43. CHINA REFRACTORY MATERIAL MARKET ANALYSIS BY END USE
      164. FIGURE 44. CHINA REFRACTORY MATERIAL MARKET ANALYSIS BY REGIONAL
      165. FIGURE 45. INDIA REFRACTORY MATERIAL MARKET ANALYSIS BY CHEMISTRY
      166. FIGURE 46. INDIA REFRACTORY MATERIAL MARKET ANALYSIS BY FORM
      167. FIGURE 47. INDIA REFRACTORY MATERIAL MARKET ANALYSIS BY END USE
      168. FIGURE 48. INDIA REFRACTORY MATERIAL MARKET ANALYSIS BY REGIONAL
      169. FIGURE 49. JAPAN REFRACTORY MATERIAL MARKET ANALYSIS BY CHEMISTRY
      170. FIGURE 50. JAPAN REFRACTORY MATERIAL MARKET ANALYSIS BY FORM
      171. FIGURE 51. JAPAN REFRACTORY MATERIAL MARKET ANALYSIS BY END USE
      172. FIGURE 52. JAPAN REFRACTORY MATERIAL MARKET ANALYSIS BY REGIONAL
      173. FIGURE 53. SOUTH KOREA REFRACTORY MATERIAL MARKET ANALYSIS BY CHEMISTRY
      174. FIGURE 54. SOUTH KOREA REFRACTORY MATERIAL MARKET ANALYSIS BY FORM
      175. FIGURE 55. SOUTH KOREA REFRACTORY MATERIAL MARKET ANALYSIS BY END USE
      176. FIGURE 56. SOUTH KOREA REFRACTORY MATERIAL MARKET ANALYSIS BY REGIONAL
      177. FIGURE 57. MALAYSIA REFRACTORY MATERIAL MARKET ANALYSIS BY CHEMISTRY
      178. FIGURE 58. MALAYSIA REFRACTORY MATERIAL MARKET ANALYSIS BY FORM
      179. FIGURE 59. MALAYSIA REFRACTORY MATERIAL MARKET ANALYSIS BY END USE
      180. FIGURE 60. MALAYSIA REFRACTORY MATERIAL MARKET ANALYSIS BY REGIONAL
      181. FIGURE 61. THAILAND REFRACTORY MATERIAL MARKET ANALYSIS BY CHEMISTRY
      182. FIGURE 62. THAILAND REFRACTORY MATERIAL MARKET ANALYSIS BY FORM
      183. FIGURE 63. THAILAND REFRACTORY MATERIAL MARKET ANALYSIS BY END USE
      184. FIGURE 64. THAILAND REFRACTORY MATERIAL MARKET ANALYSIS BY REGIONAL
      185. FIGURE 65. INDONESIA REFRACTORY MATERIAL MARKET ANALYSIS BY CHEMISTRY
      186. FIGURE 66. INDONESIA REFRACTORY MATERIAL MARKET ANALYSIS BY FORM
      187. FIGURE 67. INDONESIA REFRACTORY MATERIAL MARKET ANALYSIS BY END USE
      188. FIGURE 68. INDONESIA REFRACTORY MATERIAL MARKET ANALYSIS BY REGIONAL
      189. FIGURE 69. REST OF APAC REFRACTORY MATERIAL MARKET ANALYSIS BY CHEMISTRY
      190. FIGURE 70. REST OF APAC REFRACTORY MATERIAL MARKET ANALYSIS BY FORM
      191. FIGURE 71. REST OF APAC REFRACTORY MATERIAL MARKET ANALYSIS BY END USE
      192. FIGURE 72. REST OF APAC REFRACTORY MATERIAL MARKET ANALYSIS BY REGIONAL
      193. FIGURE 73. SOUTH AMERICA REFRACTORY MATERIAL MARKET ANALYSIS
      194. FIGURE 74. BRAZIL REFRACTORY MATERIAL MARKET ANALYSIS BY CHEMISTRY
      195. FIGURE 75. BRAZIL REFRACTORY MATERIAL MARKET ANALYSIS BY FORM
      196. FIGURE 76. BRAZIL REFRACTORY MATERIAL MARKET ANALYSIS BY END USE
      197. FIGURE 77. BRAZIL REFRACTORY MATERIAL MARKET ANALYSIS BY REGIONAL
      198. FIGURE 78. MEXICO REFRACTORY MATERIAL MARKET ANALYSIS BY CHEMISTRY
      199. FIGURE 79. MEXICO REFRACTORY MATERIAL MARKET ANALYSIS BY FORM
      200. FIGURE 80. MEXICO REFRACTORY MATERIAL MARKET ANALYSIS BY END USE
      201. FIGURE 81. MEXICO REFRACTORY MATERIAL MARKET ANALYSIS BY REGIONAL
      202. FIGURE 82. ARGENTINA REFRACTORY MATERIAL MARKET ANALYSIS BY CHEMISTRY
      203. FIGURE 83. ARGENTINA REFRACTORY MATERIAL MARKET ANALYSIS BY FORM
      204. FIGURE 84. ARGENTINA REFRACTORY MATERIAL MARKET ANALYSIS BY END USE
      205. FIGURE 85. ARGENTINA REFRACTORY MATERIAL MARKET ANALYSIS BY REGIONAL
      206. FIGURE 86. REST OF SOUTH AMERICA REFRACTORY MATERIAL MARKET ANALYSIS BY CHEMISTRY
      207. FIGURE 87. REST OF SOUTH AMERICA REFRACTORY MATERIAL MARKET ANALYSIS BY FORM
      208. FIGURE 88. REST OF SOUTH AMERICA REFRACTORY MATERIAL MARKET ANALYSIS BY END USE
      209. FIGURE 89. REST OF SOUTH AMERICA REFRACTORY MATERIAL MARKET ANALYSIS BY REGIONAL
      210. FIGURE 90. MEA REFRACTORY MATERIAL MARKET ANALYSIS
      211. FIGURE 91. GCC COUNTRIES REFRACTORY MATERIAL MARKET ANALYSIS BY CHEMISTRY
      212. FIGURE 92. GCC COUNTRIES REFRACTORY MATERIAL MARKET ANALYSIS BY FORM
      213. FIGURE 93. GCC COUNTRIES REFRACTORY MATERIAL MARKET ANALYSIS BY END USE
      214. FIGURE 94. GCC COUNTRIES REFRACTORY MATERIAL MARKET ANALYSIS BY REGIONAL
      215. FIGURE 95. SOUTH AFRICA REFRACTORY MATERIAL MARKET ANALYSIS BY CHEMISTRY
      216. FIGURE 96. SOUTH AFRICA REFRACTORY MATERIAL MARKET ANALYSIS BY FORM
      217. FIGURE 97. SOUTH AFRICA REFRACTORY MATERIAL MARKET ANALYSIS BY END USE
      218. FIGURE 98. SOUTH AFRICA REFRACTORY MATERIAL MARKET ANALYSIS BY REGIONAL
      219. FIGURE 99. REST OF MEA REFRACTORY MATERIAL MARKET ANALYSIS BY CHEMISTRY
      220. FIGURE 100. REST OF MEA REFRACTORY MATERIAL MARKET ANALYSIS BY FORM
      221. FIGURE 101. REST OF MEA REFRACTORY MATERIAL MARKET ANALYSIS BY END USE
      222. FIGURE 102. REST OF MEA REFRACTORY MATERIAL MARKET ANALYSIS BY REGIONAL
      223. FIGURE 103. KEY BUYING CRITERIA OF REFRACTORY MATERIAL MARKET
      224. FIGURE 104. RESEARCH PROCESS OF MRFR
      225. FIGURE 105. DRO ANALYSIS OF REFRACTORY MATERIAL MARKET
      226. FIGURE 106. DRIVERS IMPACT ANALYSIS: REFRACTORY MATERIAL MARKET
      227. FIGURE 107. RESTRAINTS IMPACT ANALYSIS: REFRACTORY MATERIAL MARKET
      228. FIGURE 108. SUPPLY / VALUE CHAIN: REFRACTORY MATERIAL MARKET
      229. FIGURE 109. REFRACTORY MATERIAL MARKET, BY CHEMISTRY, 2025 (% SHARE)
      230. FIGURE 110. REFRACTORY MATERIAL MARKET, BY CHEMISTRY, 2019 TO 2035 (USD Billions)
      231. FIGURE 111. REFRACTORY MATERIAL MARKET, BY FORM, 2025 (% SHARE)
      232. FIGURE 112. REFRACTORY MATERIAL MARKET, BY FORM, 2019 TO 2035 (USD Billions)
      233. FIGURE 113. REFRACTORY MATERIAL MARKET, BY END USE, 2025 (% SHARE)
      234. FIGURE 114. REFRACTORY MATERIAL MARKET, BY END USE, 2019 TO 2035 (USD Billions)
      235. FIGURE 115. REFRACTORY MATERIAL MARKET, BY REGIONAL, 2025 (% SHARE)
      236. FIGURE 116. REFRACTORY MATERIAL MARKET, BY REGIONAL, 2019 TO 2035 (USD Billions)
      237. FIGURE 117. BENCHMARKING OF MAJOR COMPETITORS

    Refractory Material Market Segmentation


    • Refractory Material Market By Chemistry (USD Billion, 2019-2035)

      • Acidic
      • Basic
      • Neutral


    • Refractory Material Market By Form (USD Billion, 2019-2035)

      • Shaped
      • Unshaped


    • Refractory Material Market By End Use (USD Billion, 2019-2035)

      • Metal & Metallurgy
      • Cement
      • Glass & Ceramics
      • Power Generation
      • Others


    • Refractory Material Market By Regional (USD Billion, 2019-2035)

      • North America
      • Europe
      • South America
      • Asia Pacific
      • Middle East and Africa


    Refractory Material Market Regional Outlook (USD Billion, 2019-2035)


    • North America Outlook (USD Billion, 2019-2035)

      • North America Refractory Material Market by Chemistry Type

        • Acidic
        • Basic
        • Neutral
      • North America Refractory Material Market by Form Type

        • Shaped
        • Unshaped
      • North America Refractory Material Market by End Use Type

        • Metal & Metallurgy
        • Cement
        • Glass & Ceramics
        • Power Generation
        • Others
      • North America Refractory Material Market by Regional Type

        • US
        • Canada
      • US Outlook (USD Billion, 2019-2035)
      • US Refractory Material Market by Chemistry Type

        • Acidic
        • Basic
        • Neutral
      • US Refractory Material Market by Form Type

        • Shaped
        • Unshaped
      • US Refractory Material Market by End Use Type

        • Metal & Metallurgy
        • Cement
        • Glass & Ceramics
        • Power Generation
        • Others
      • CANADA Outlook (USD Billion, 2019-2035)
      • CANADA Refractory Material Market by Chemistry Type

        • Acidic
        • Basic
        • Neutral
      • CANADA Refractory Material Market by Form Type

        • Shaped
        • Unshaped
      • CANADA Refractory Material Market by End Use Type

        • Metal & Metallurgy
        • Cement
        • Glass & Ceramics
        • Power Generation
        • Others
    • Europe Outlook (USD Billion, 2019-2035)

      • Europe Refractory Material Market by Chemistry Type

        • Acidic
        • Basic
        • Neutral
      • Europe Refractory Material Market by Form Type

        • Shaped
        • Unshaped
      • Europe Refractory Material Market by End Use Type

        • Metal & Metallurgy
        • Cement
        • Glass & Ceramics
        • Power Generation
        • Others
      • Europe Refractory Material Market by Regional Type

        • Germany
        • UK
        • France
        • Russia
        • Italy
        • Spain
        • Rest of Europe
      • GERMANY Outlook (USD Billion, 2019-2035)
      • GERMANY Refractory Material Market by Chemistry Type

        • Acidic
        • Basic
        • Neutral
      • GERMANY Refractory Material Market by Form Type

        • Shaped
        • Unshaped
      • GERMANY Refractory Material Market by End Use Type

        • Metal & Metallurgy
        • Cement
        • Glass & Ceramics
        • Power Generation
        • Others
      • UK Outlook (USD Billion, 2019-2035)
      • UK Refractory Material Market by Chemistry Type

        • Acidic
        • Basic
        • Neutral
      • UK Refractory Material Market by Form Type

        • Shaped
        • Unshaped
      • UK Refractory Material Market by End Use Type

        • Metal & Metallurgy
        • Cement
        • Glass & Ceramics
        • Power Generation
        • Others
      • FRANCE Outlook (USD Billion, 2019-2035)
      • FRANCE Refractory Material Market by Chemistry Type

        • Acidic
        • Basic
        • Neutral
      • FRANCE Refractory Material Market by Form Type

        • Shaped
        • Unshaped
      • FRANCE Refractory Material Market by End Use Type

        • Metal & Metallurgy
        • Cement
        • Glass & Ceramics
        • Power Generation
        • Others
      • RUSSIA Outlook (USD Billion, 2019-2035)
      • RUSSIA Refractory Material Market by Chemistry Type

        • Acidic
        • Basic
        • Neutral
      • RUSSIA Refractory Material Market by Form Type

        • Shaped
        • Unshaped
      • RUSSIA Refractory Material Market by End Use Type

        • Metal & Metallurgy
        • Cement
        • Glass & Ceramics
        • Power Generation
        • Others
      • ITALY Outlook (USD Billion, 2019-2035)
      • ITALY Refractory Material Market by Chemistry Type

        • Acidic
        • Basic
        • Neutral
      • ITALY Refractory Material Market by Form Type

        • Shaped
        • Unshaped
      • ITALY Refractory Material Market by End Use Type

        • Metal & Metallurgy
        • Cement
        • Glass & Ceramics
        • Power Generation
        • Others
      • SPAIN Outlook (USD Billion, 2019-2035)
      • SPAIN Refractory Material Market by Chemistry Type

        • Acidic
        • Basic
        • Neutral
      • SPAIN Refractory Material Market by Form Type

        • Shaped
        • Unshaped
      • SPAIN Refractory Material Market by End Use Type

        • Metal & Metallurgy
        • Cement
        • Glass & Ceramics
        • Power Generation
        • Others
      • REST OF EUROPE Outlook (USD Billion, 2019-2035)
      • REST OF EUROPE Refractory Material Market by Chemistry Type

        • Acidic
        • Basic
        • Neutral
      • REST OF EUROPE Refractory Material Market by Form Type

        • Shaped
        • Unshaped
      • REST OF EUROPE Refractory Material Market by End Use Type

        • Metal & Metallurgy
        • Cement
        • Glass & Ceramics
        • Power Generation
        • Others
    • APAC Outlook (USD Billion, 2019-2035)

      • APAC Refractory Material Market by Chemistry Type

        • Acidic
        • Basic
        • Neutral
      • APAC Refractory Material Market by Form Type

        • Shaped
        • Unshaped
      • APAC Refractory Material Market by End Use Type

        • Metal & Metallurgy
        • Cement
        • Glass & Ceramics
        • Power Generation
        • Others
      • APAC Refractory Material Market by Regional Type

        • China
        • India
        • Japan
        • South Korea
        • Malaysia
        • Thailand
        • Indonesia
        • Rest of APAC
      • CHINA Outlook (USD Billion, 2019-2035)
      • CHINA Refractory Material Market by Chemistry Type

        • Acidic
        • Basic
        • Neutral
      • CHINA Refractory Material Market by Form Type

        • Shaped
        • Unshaped
      • CHINA Refractory Material Market by End Use Type

        • Metal & Metallurgy
        • Cement
        • Glass & Ceramics
        • Power Generation
        • Others
      • INDIA Outlook (USD Billion, 2019-2035)
      • INDIA Refractory Material Market by Chemistry Type

        • Acidic
        • Basic
        • Neutral
      • INDIA Refractory Material Market by Form Type

        • Shaped
        • Unshaped
      • INDIA Refractory Material Market by End Use Type

        • Metal & Metallurgy
        • Cement
        • Glass & Ceramics
        • Power Generation
        • Others
      • JAPAN Outlook (USD Billion, 2019-2035)
      • JAPAN Refractory Material Market by Chemistry Type

        • Acidic
        • Basic
        • Neutral
      • JAPAN Refractory Material Market by Form Type

        • Shaped
        • Unshaped
      • JAPAN Refractory Material Market by End Use Type

        • Metal & Metallurgy
        • Cement
        • Glass & Ceramics
        • Power Generation
        • Others
      • SOUTH KOREA Outlook (USD Billion, 2019-2035)
      • SOUTH KOREA Refractory Material Market by Chemistry Type

        • Acidic
        • Basic
        • Neutral
      • SOUTH KOREA Refractory Material Market by Form Type

        • Shaped
        • Unshaped
      • SOUTH KOREA Refractory Material Market by End Use Type

        • Metal & Metallurgy
        • Cement
        • Glass & Ceramics
        • Power Generation
        • Others
      • MALAYSIA Outlook (USD Billion, 2019-2035)
      • MALAYSIA Refractory Material Market by Chemistry Type

        • Acidic
        • Basic
        • Neutral
      • MALAYSIA Refractory Material Market by Form Type

        • Shaped
        • Unshaped
      • MALAYSIA Refractory Material Market by End Use Type

        • Metal & Metallurgy
        • Cement
        • Glass & Ceramics
        • Power Generation
        • Others
      • THAILAND Outlook (USD Billion, 2019-2035)
      • THAILAND Refractory Material Market by Chemistry Type

        • Acidic
        • Basic
        • Neutral
      • THAILAND Refractory Material Market by Form Type

        • Shaped
        • Unshaped
      • THAILAND Refractory Material Market by End Use Type

        • Metal & Metallurgy
        • Cement
        • Glass & Ceramics
        • Power Generation
        • Others
      • INDONESIA Outlook (USD Billion, 2019-2035)
      • INDONESIA Refractory Material Market by Chemistry Type

        • Acidic
        • Basic
        • Neutral
      • INDONESIA Refractory Material Market by Form Type

        • Shaped
        • Unshaped
      • INDONESIA Refractory Material Market by End Use Type

        • Metal & Metallurgy
        • Cement
        • Glass & Ceramics
        • Power Generation
        • Others
      • REST OF APAC Outlook (USD Billion, 2019-2035)
      • REST OF APAC Refractory Material Market by Chemistry Type

        • Acidic
        • Basic
        • Neutral
      • REST OF APAC Refractory Material Market by Form Type

        • Shaped
        • Unshaped
      • REST OF APAC Refractory Material Market by End Use Type

        • Metal & Metallurgy
        • Cement
        • Glass & Ceramics
        • Power Generation
        • Others
    • South America Outlook (USD Billion, 2019-2035)

      • South America Refractory Material Market by Chemistry Type

        • Acidic
        • Basic
        • Neutral
      • South America Refractory Material Market by Form Type

        • Shaped
        • Unshaped
      • South America Refractory Material Market by End Use Type

        • Metal & Metallurgy
        • Cement
        • Glass & Ceramics
        • Power Generation
        • Others
      • South America Refractory Material Market by Regional Type

        • Brazil
        • Mexico
        • Argentina
        • Rest of South America
      • BRAZIL Outlook (USD Billion, 2019-2035)
      • BRAZIL Refractory Material Market by Chemistry Type

        • Acidic
        • Basic
        • Neutral
      • BRAZIL Refractory Material Market by Form Type

        • Shaped
        • Unshaped
      • BRAZIL Refractory Material Market by End Use Type

        • Metal & Metallurgy
        • Cement
        • Glass & Ceramics
        • Power Generation
        • Others
      • MEXICO Outlook (USD Billion, 2019-2035)
      • MEXICO Refractory Material Market by Chemistry Type

        • Acidic
        • Basic
        • Neutral
      • MEXICO Refractory Material Market by Form Type

        • Shaped
        • Unshaped
      • MEXICO Refractory Material Market by End Use Type

        • Metal & Metallurgy
        • Cement
        • Glass & Ceramics
        • Power Generation
        • Others
      • ARGENTINA Outlook (USD Billion, 2019-2035)
      • ARGENTINA Refractory Material Market by Chemistry Type

        • Acidic
        • Basic
        • Neutral
      • ARGENTINA Refractory Material Market by Form Type

        • Shaped
        • Unshaped
      • ARGENTINA Refractory Material Market by End Use Type

        • Metal & Metallurgy
        • Cement
        • Glass & Ceramics
        • Power Generation
        • Others
      • REST OF SOUTH AMERICA Outlook (USD Billion, 2019-2035)
      • REST OF SOUTH AMERICA Refractory Material Market by Chemistry Type

        • Acidic
        • Basic
        • Neutral
      • REST OF SOUTH AMERICA Refractory Material Market by Form Type

        • Shaped
        • Unshaped
      • REST OF SOUTH AMERICA Refractory Material Market by End Use Type

        • Metal & Metallurgy
        • Cement
        • Glass & Ceramics
        • Power Generation
        • Others
    • MEA Outlook (USD Billion, 2019-2035)

      • MEA Refractory Material Market by Chemistry Type

        • Acidic
        • Basic
        • Neutral
      • MEA Refractory Material Market by Form Type

        • Shaped
        • Unshaped
      • MEA Refractory Material Market by End Use Type

        • Metal & Metallurgy
        • Cement
        • Glass & Ceramics
        • Power Generation
        • Others
      • MEA Refractory Material Market by Regional Type

        • GCC Countries
        • South Africa
        • Rest of MEA
      • GCC COUNTRIES Outlook (USD Billion, 2019-2035)
      • GCC COUNTRIES Refractory Material Market by Chemistry Type

        • Acidic
        • Basic
        • Neutral
      • GCC COUNTRIES Refractory Material Market by Form Type

        • Shaped
        • Unshaped
      • GCC COUNTRIES Refractory Material Market by End Use Type

        • Metal & Metallurgy
        • Cement
        • Glass & Ceramics
        • Power Generation
        • Others
      • SOUTH AFRICA Outlook (USD Billion, 2019-2035)
      • SOUTH AFRICA Refractory Material Market by Chemistry Type

        • Acidic
        • Basic
        • Neutral
      • SOUTH AFRICA Refractory Material Market by Form Type

        • Shaped
        • Unshaped
      • SOUTH AFRICA Refractory Material Market by End Use Type

        • Metal & Metallurgy
        • Cement
        • Glass & Ceramics
        • Power Generation
        • Others
      • REST OF MEA Outlook (USD Billion, 2019-2035)
      • REST OF MEA Refractory Material Market by Chemistry Type

        • Acidic
        • Basic
        • Neutral
      • REST OF MEA Refractory Material Market by Form Type

        • Shaped
        • Unshaped
      • REST OF MEA Refractory Material Market by End Use Type

        • Metal & Metallurgy
        • Cement
        • Glass & Ceramics
        • Power Generation
        • Others
    Infographic

    Free Sample Request

    Kindly complete the form below to receive a free sample of this Report

    Get Free Sample

    Customer Strories

    “I am very pleased with how market segments have been defined in a relevant way for my purposes (such as "Portable Freezers & refrigerators" and "last-mile"). In general the report is well structured. Thanks very much for your efforts.”

    Victoria Milne

    Founder
    Case Study
    Chemicals and Materials