• Cat-intel
  • MedIntelliX
  • Resources
  • About Us
  • Hero Background
    English
    Chinese
    French
    Japanese
    Korean
    German
    Spanish

    Proppants Market Share

    ID: MRFR/CnM/9075-HCR
    180 Pages
    Anshula Mandaokar
    October 2025

    Proppants Market Research Report Information By Product Type (Freac Sand, Resin-Coated Proppant, Ceramic Proppant) By Application (Shale Gas, Tight Gas, Coal Bed Methane) By Region ( North America, Europe, Asia Pacific, Latin America, Middle East & Africa) Forecast till 2035

    Share:
    Download PDF ×

    We do not share your information with anyone. However, we may send you emails based on your report interest from time to time. You may contact us at any time to opt-out.

    Proppants Market Infographic
    $ 4,950.0
    $ 5,950.0
    $ 7,250.0

    Market Share

    Proppants Market Share Analysis

    Proppants are particles added to fracturing fluids and used in the hydraulic fracturing process to keep open fractures in the ground. There has been increasing demand for proppants because of increased production from oil and natural gas wells done through hydraulic fracturing. As an industry within the oil and gas market, Proppants Market is characterized by the implementation of several market share positioning strategies. One common strategy is differentiation based on product quality and efficiency. Companies operating within this industry devote substantial resources to research and development so that they can come up with high crush strength, conductivity, chemical resistance, etc., which are critical properties for advanced formulations. By doing this, they position themselves at the top when it comes to supplying proppant material to be used in hydraulic fracs in oil wells, where their effectiveness determines whether or not the process would be viable. The other vital strategy in the proppants market is cost leadership. Some firms optimize production processes, source raw materials at minimal costs, and achieve economies of scale for cheaper proppants. Collaboration and strategic partnerships have a significant influence on the market share of the proppants. Such companies normally form alliances with major stakeholders, including drilling service providers, oil and gas operators, and equipment manufacturers. This collaboration helps streamline the supply chain, thereby ensuring a consistent and reliable distribution network. Strategic partnership provides access to new markets, innovative technologies, and potential customers, resulting in an increased share of the market and popularity of one's brand. In the proppant sector, a customer-oriented approach has become more critical than ever before. Recognizing those needs that are peculiar to a client, including higher requirements for proppant specifications that match various reservoir conditions and technical support, shall be necessary for the sustainable development of the market share. Companies allocate their resources to R&D so that they can develop proppant formulations that satisfy changing industry regulations and customer preferences. Environmental sustainability is an increasingly growing concern in the realm of proppants; hence, companies are adopting eco-friendly branding strategies. As customers continue to understand the effects of environmental degradation, they demand environmentally friendly fracking materials. Recycling materials, ecologically friendly procurement procedures, and energy-efficient manufacturing methods are issues that some firms in this industry are considering.

    Market Summary

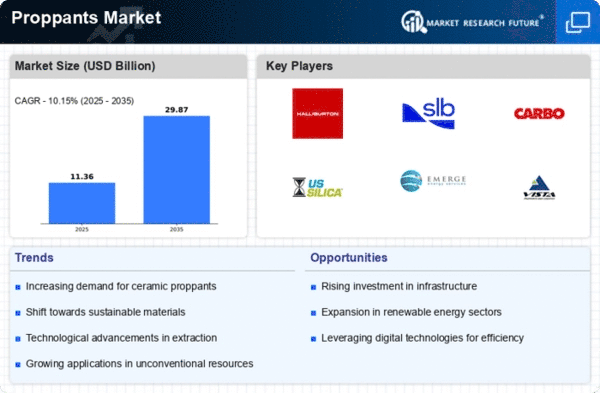
    As per Market Research Future Analysis, the Global Proppants Market was valued at USD 10.31 Billion in 2024 and is projected to grow to USD 29.87 Billion by 2035, with a CAGR of 10.15% from 2025 to 2035. The growth is driven by increased demand in the oil and gas sector, particularly for hydraulic fracturing, and technological advancements in proppant characteristics. The market is witnessing a shift towards unconventional oil and gas reserves, with significant investments in research and development for product innovations such as resin-coated and lightweight proppants. Environmental concerns are also prompting the development of sustainable proppants, including recycled materials.

    Key Market Trends & Highlights

    The proppants market is experiencing significant growth driven by technological advancements and environmental sustainability.

    • Market Size in 2024: USD 10.31 Billion. Projected Market Size by 2035: USD 29.87 Billion. CAGR from 2025 to 2035: 10.15%. Dominant Product Type: Frac Sand due to cost-effectiveness.

    Market Size & Forecast

    2024 Market Size USD 10.31 Billion
    2035 Market Size USD 29.87 Billion
    CAGR (2025-2035) 10.15%
    Largest Regional Market North America.

    Major Players

    <p>Key players include Carbo Ceramics Inc., COVIA, JSC Borovichi Refractories Plant, S. Silica Holdings Inc., Hi-Crush Inc., and Schlumberger Limited.</p>

    Market Trends

    Growing demand for unconventional oil & gas reserves is driving the market growth.

    The proppants market has witnessed notable technological advancements and product innovations, contributing to its growth and evolution. Manufacturers invest in research and development to enhance proppant characteristics, such as crush resistance, conductivity, and durability. These improvements aim to optimize well performance and increase hydrocarbon recovery rates. One key innovation in the proppants market is the development of resin-coated proppants. Coating proppant particles with a thin layer of resin significantly improves their crush resistance and conductivity. This coating acts as a barrier, preventing the flow back of fine particles and reducing the risk of proppant embedment in the formation.

    Resin-coated proppants offer better control over proppant placement and are increasingly preferred in high-stress reservoirs.

    Moreover, advancements in manufacturing processes have resulted in the production of lightweight proppants. These proppants, made from ceramics or sintered bauxite, offer improved conductivity and can be transported more efficiently due to their lower bulk density. Lightweight proppants are gaining traction, especially in deep and ultra-deep reservoirs, where they help mitigate closure stresses and maintain fracture conductivity.

    Furthermore, research is underway to explore alternative materials for proppants, such as ceramics and biodegradable polymers. These materials offer the potential for enhanced fracture conductivity while minimizing environmental impacts. The adoption of sustainable proppants aligns with the industry's increasing focus on corporate social responsibility and regulatory compliance, thus driving market growth.

    As hydraulic fracturing activities expand globally, the demand for proppants continues to rise. Manufacturers respond to market needs by investing in research and development to improve proppant characteristics, leading to innovations such as resin-coated and lightweight proppants. Additionally, environmental concerns have spurred the development of sustainable proppants, including recycled materials and alternative options. By closely monitoring and adapting to these trends, industry stakeholders can position themselves for success in the dynamic proppants market, driving the Proppants market revenue.

    <p>The increasing demand for proppants in hydraulic fracturing operations suggests a robust growth trajectory for the global proppants market, driven by advancements in extraction technologies and the ongoing pursuit of energy independence.</p>

    U.S. Energy Information Administration

    Proppants Market Market Drivers

    Increasing Demand for Oil and Gas

    The Global Proppants Market Industry experiences a robust demand driven by the increasing exploration and production activities in the oil and gas sector. As countries strive to enhance energy security and reduce dependency on imports, investments in hydraulic fracturing technologies have surged. This trend is particularly evident in regions such as North America and the Middle East, where shale gas production is on the rise. The market is projected to reach 10.3 USD Billion in 2024, reflecting the industry's growth trajectory. This demand is expected to continue, with projections indicating a market size of 29.9 USD Billion by 2035, suggesting a compound annual growth rate of 10.15% from 2025 to 2035.

    Market Segment Insights

    Proppants Product Type Insights

    <p>The Proppants market segmentation, based on product type, includes frac sand, resin-coated proppant, and ceramic proppant. The frac sand segment dominated the market due to its cost-effectiveness and abundance. It is composed of silica, providing the strength to withstand high pressure and temperature conditions. Sand proppants find extensive applications in the oil and gas industry, particularly in unconventional shale reservoirs. The growing exploration and production activities in regions such as North America have increased the demand for sand proppants.</p>

    Proppants Application Insights

    <p>The Proppants market segmentation, based on application, includes shale gas, tight gas, and coal bed methane. The shale gas segment category generated the most income. Shale gas extraction involves the hydraulic fracturing shale rock formations to release natural gas trapped within them. Proppants are injected into the fractures to hold them open, allowing the gas to flow to the wellbore. The demand for proppants in the shale gas application segment has been substantial, as hydraulic fracturing requires a large volume of proppants. The industry primarily uses frac sand as proppants due to its cost-effectiveness and compatibility with shale formations.</p>

    <p>Figure 1: Proppants Market, by Application, 2022 &amp; 2032 (USD Billion)Source: Secondary Research, Primary Research, Market Research Future Database, and Analyst Review</p>

    Get more detailed insights about Proppants Market Research Report—Global Forecast till 2034

    Regional Insights

    By region, the study provides market insights into North America, Europe, Asia-Pacific, and the Rest of the World. The North American Proppants market area will dominate due to the extensive development of shale gas resources in the United States and Canada. The advent of advanced drilling techniques, such as horizontal drilling and multi-stage fracking, has significantly increased the demand for proppants in this region. Nevertheless, with abundant shale gas reserves and ongoing technological advancements, North America is expected to remain a key market for proppants.

    Further, the major countries studied in the market report are The US, Canada, German, France, the UK, Italy, Spain, China, Japan, India, Australia, South Korea, and Brazil.

    Figure 2: PROPPANTS MARKET SHARE BY REGION 2022 (USD Billion) PROPPANTS MARKET SHARE BY REGION 2022Source: Secondary Research, Primary Research, Market Research Future Database, and Analyst Review

    Europe's Proppants market accounts for the second-largest market share due to the growing interest in shale gas exploration due to regulatory challenges, environmental concerns, and limited infrastructure. Nonetheless, as the region seeks to reduce its reliance on imported gas and diversify its energy sources, the demand for proppants is anticipated to rise in the coming years. Further, the German Proppants market held the largest market share, and the UK Proppants market was the fastest-growing market in the European region.

    The Asia-Pacific Proppants Market is expected to grow at the fastest CAGR from 2023 to 2032. It is due to increased demand for proppants, primarily driven by the rapid growth of unconventional gas exploration. The increasing energy demand and favorable government policies in the countries are expected to drive the proppants market in the Asia Pacific region. Moreover, China’s Proppants market held the largest market share, and the Indian Proppants market was the fastest-growing market in the Asia-Pacific region.

    Key Players and Competitive Insights

    Leading market players are investing heavily in research and development to expand their product lines, which will help the Proppants market grow even more. Market participants are also undertaking various strategic activities to expand their footprint, with important market developments including new product launches, contractual agreements, mergers and acquisitions, higher investments, and collaboration with other organizations. The proppants industry must offer cost-effective items to expand and survive in a more competitive and rising market climate.

    Manufacturing locally to minimize operational costs is one of the key business tactics manufacturers use in the Proppants industry to benefit clients and increase the market sector. In recent years, the Proppants industry has offered some of the most significant medical advantages. Major players in the Proppants market, including Carbo Ceramics Inc., COVIA, JSC Borovichi Refractories Plant, S. Silica Holdings Inc., Hi-Crush Inc., MineraçãoCurimbaba, XinmiWanli Industry' Development Co. Ltd., Atlas Sand Company, Llc, HEXION, Schlumberger Limited., and others, are attempting to increase market demand by investing in research and development operations.

    Covia, previously known as Unimin, founded in 1970, and located in New Canaan, Connecticut, USA, is a corporation wholly owned subsidiary of the industrial minerals company of SCR, Belgium. It operates in the US, Mexico, and Canada mining and minerals processing facilities. Unimin merged with Santrol to become Covia in the year 2018. It is America's largest producer of non-metallic industrial minerals, quartz proppants, resin-coated proppants, etc. In December 2021, Covia, the leader in the proppants sector, announced that its Industrial Segment would adopt a price rise of up to 15% across all product lines beginning January 1, 2022.

    This step is important to assist in balancing sustained and considerable inflationary pressures in various sectors, including energy, steel, packaging, transportation, labor, resins, and additives. It will enable Covia to retain its service and value to industrial clients.

    Select Sands Corporation, founded in 2006, and located in Vancouver, Canada, is a Canadian company that quarries and produces silica sand. The company sells them to industrial and energy customers. It was previously known as La Ronge Gold Corporation. In December 2019, Select Sands Corporation and Select Sands America Corp. designed a pact to supply proppants. Select sands will provide reliable and high-quality proppant to achieve the production results.

    Key Companies in the Proppants Market market include

    Industry Developments

    Atlas Sand Company

    Llc

    HEXION

    Schlumberger Ltd.

    Proppants Industry Developments

    March 2020: COVIA completed expanding its Canoitas facility in Mexico. The expansion will enable COVIA to add 350 tons of annual silica production capacity to support the growth of customers in Mexico.

    March 2020: COVIA expanded the capabilities of its facility in North America to serve coating & polymers end-markets and create a highly efficient modern facility; the project cost was approximately USD 45 million.

    May 2019: Hi-Crush Inc. acquired Proppant Logistics LLC, which owns Pronghorn Logistics LLC. The company provides end- to end-logistic services for proppants.

    Future Outlook

    Proppants Market Future Outlook

    <p>The Proppants Market is projected to grow at a 10.15% CAGR from 2025 to 2035, driven by increasing hydraulic fracturing activities and technological advancements.</p>

    New opportunities lie in:

    • <p>Invest in advanced ceramic proppants to enhance performance and reduce environmental impact. Develop eco-friendly proppant alternatives to meet regulatory demands and consumer preferences. Leverage digital technologies for supply chain optimization and predictive analytics in proppant distribution.</p>

    <p>By 2035, the Proppants Market is expected to achieve substantial growth, reflecting evolving industry needs and innovations.</p>

    Market Segmentation

    Proppants Regional Outlook

    • {"North America"=>["US"
    • "Canada"]}
    • {"Europe"=>["Germany"
    • "France"
    • "UK"
    • "Italy"
    • "Spain"
    • "Rest of Europe"]}
    • {"Asia-Pacific"=>["China"
    • "Japan"
    • "India"
    • "Australia  and New Zealand"
    • "Rest of Asia-Pacific"]}
    • {"Rest of the World"=>["Middle East"
    • "Africa"
    • "Latin America"]}

    Proppants Product Type Outlook

    • Frac Sand
    • Resin-Coated Proppant
    • Ceramic Proppant

    Proppants Application Outlook

    • Shale Gas
    • Tight Gas
    • Coal Bed Methane

    Report Scope

    Report Attribute/MetricDetails 
    Market Size 2024USD 10.31 Billion
    Market Size 2025USD 11.36 Billion
    Market Size 203529.87 (Value (USD Billion))
    Compound Annual Growth Rate (CAGR)10.15% (2025 - 2035)
    Base Year2024
    Market Forecast Period2025 - 2035
    Historical Data2020- 2024
    Market Forecast UnitsValue (USD Billion)
    Report CoverageRevenue Forecast, Market Competitive Landscape, Growth Factors, and Trends
    Segments CoveredProduct Type, Application, and Region
    Geographies CoveredNorth America, Europe, Asia Pacific, and the Rest of the World
    Countries CoveredThe US, Canada, German, France, UK, Italy, Spain, China, Japan, India, Australia, South Korea, and Brazil
    Key Companies ProfiledCarbo Ceramics Inc., COVIA, JSC Borovichi Refractories Plant, S. Silica Holdings Inc., Hi-Crush Inc., MineraçãoCurimbaba, XinmiWanli Industry' Development Co. Ltd., Atlas Sand Company, Llc, HEXION, Schlumberger Limited
    Key Market OpportunitiesGrowing the use of renewable energy resources. The exploitation of fossil fuel.
    Key Market DynamicsDue to advanced fracking techniques, increased demand for proppants in the oil & gas sector.

    Market Highlights

    Author

    Anshula Mandaokar
    Team Lead - Research

    She holds an experience of about 6+ years in market research and business consulting, working under the spectrum of information communication technology, telecommunications and semiconductor domains. aarti conceptualizes and implements a scalable business strategy and provides strategic leadership to the clients. her expertise lies in market estimation, competitive intelligence, pipeline analysis, customer assessment, etc.

    Leave a Comment

    Latest Comments

    John Doe
    john@example.com

    This is a great article! Really helped me understand the topic better.

    Posted on July 23, 2025, 10:15 AM
    Jane Smith
    jane@domain.com

    Thanks for sharing this. I’ve bookmarked it for later reference.

    Posted on July 22, 2025, 7:45 PM

    FAQs

    How much is the Proppants market?

    The Proppants market size was valued at USD 10.31 Billion in 2024

    What is the growth rate of the Proppants market?

    Proppants Market is projected to register a CAGR of 10.15% from 2025-2035

    Which region held the largest market share in the Proppants market?

    North America had the largest share of the market

    Who are the key players in the Proppants market?

    The key players in the market are Carbo Ceramics Inc., COVIA, JSC Borovichi Refractories Plant, S. Silica Holdings Inc., Hi-Crush Inc., MineraçãoCurimbaba, XinmiWanli Industry' Development Co. Ltd., Atlas Sand Company, Llc, HEXION, Schlumberger Ltd

    Which product type led the Proppants market?

    The freak sand category dominated the market in 2024

    Which application had the largest market share in the Proppants market?

    Shale gas had the largest share of the market

    1. List of Tables and Figures
      1. |-
      2. Table of Contents 1 Executive Summary 2 Market Introduction 2.1 Market Definition 2.2 Scope of the Study 2.3 Assumptions & Limitations 2.4 Market Structure 2.5 Key Takeaways 3 Market Insights 4 Research Methodology 4.1 Research Process 4.2 Primary Research 4.3 Secondary Research 4.4 Market Size Estimation 4.5 Forecast Model 5 Market Dynamics 5.1 Introduction 5.2 Drivers 5.3 Restraints 5.4 Opportunities 5.5 Challenges 5.6 Trends 6 Market Factor Analysis 6.1 Supply Chain Analysis 6.1.1 Raw Material Suppliers 6.1.2 Manufacturers/Producers 6.1.3 Distributors/Retailers/Wholesalers/E-Commerce Merchants 6.1.4 End-users 6.2 Porter’s Five Forces Analysis 6.2.1 Threat of New Entrants 6.2.2 Bargaining Power of Buyers 6.2.3 Bargaining Power of Suppliers 6.2.4 Threat of Substitutes 6.2.5 Intensity of Rivalry 6.3 Pricing Analysis (USD/Ton) 6.4 Impact of COVID-19 in Proppants Market 7. Global Proppants Market,by Product Type 7.1 Introduction 7.2 Frac Sand 7.2.1 Market Estimates & Forecast, 2025 - 2034 7.2.2 Market Estimates & Forecast, by Region, 2025 - 2034 7.3 Resin-Coated Proppant 7.3.1 Market Estimates & Forecast, 2025 - 2034 7.3.2 Market Estimates & Forecast, by Region, 2025 - 2034 7.4 Ceramic Proppant 7.4.1 Market Estimates & Forecast, 2025 - 2034 7.4.2 Market Estimates & Forecast, by Region, 2025 - 2034 8. Global Proppants Market,by Application 8.1 Introduction 8.2 Shale Gas 8.2.1 Market Estimates & Forecast, 2025 - 2034 8.2.2 Market Estimates & Forecast, by Region, 2025 - 2034 8.3 Tight Gas 8.3.1 Market Estimates & Forecast, 2025 - 2034 8.3.2 Market Estimates & Forecast, by Region, 2025 - 2034 8.4 Coal Bed Methane 8.4.1 Market Estimates & Forecast, 2025 - 2034 8.4.2 Market Estimates & Forecast, by Region, 2025 - 2034 8.4 Others 8.4.1 Market Estimates & Forecast, 2025 - 2034 8.4.2 Market Estimates & Forecast, by Region, 2025 - 2034 9. Global Proppants Market, by Region 9.1 Introduction 9.2 North America 9.2.1 Market Estimates & Forecast, 2025 - 2034 9.2.2 Market Estimates & Forecast, by Product Type, 2025 - 2034 9.2.3 + 9.2.4 US 9.2.4.1 Market Estimates & Forecast, 2025 - 2034 9.2.4.2 Market Estimates & Forecast, by Product Type, 2025 - 2034 9.2.4.3 Market Estimates & Forecast, by Application, 2025 - 2034 9.2.5 Canada 9.2.5.1 Market Estimates & Forecast, 2025 - 2034 9.2.5.2 Market Estimates & Forecast, by Product Type, 2025 - 2034 9.2.5.3 Market Estimates & Forecast, by Application, 2025 - 2034 9.3 Europe 9.3.1 Market Estimates & Forecast, 2025 - 2034 9.3.2 Market Estimates & Forecast, by Product Type, 2025 - 2034 9.3.3 Market Estimates & Forecast, by Application, 2025 - 2034 9.3.4 Germany 9.3.4.1 Market Estimates & Forecast, 2025 - 2034 9.3.4.2 Market Estimates & Forecast, by Product Type, 2025 - 2034 9.3.4.3 Market Estimates & Forecast, by Application, 2025 - 2034 9.3.5. France 9.3.5.1 Market Estimates & Forecast, 2025 - 2034 9.3.5.2 Market Estimates & Forecast, by Product Type, 2025 - 2034 9.3.5.3 Market Estimates & Forecast, by Application, 2025 - 2034 9.3.6 Italy 9.3.6.1 Market Estimates & Forecast, 2025 - 2034 9.3.6.2 Market Estimates & Forecast, by Product Type, 2025 - 2034 9.3.6.3 Market Estimates & Forecast, by Application, 2025 - 2034 9.3.7 Spain 9.3.7.1 Market Estimates & Forecast, 2025 - 2034 9.3.7.2 Market Estimates & Forecast, by Product Type, 2025 - 2034 9.3.7.3 Market Estimates & Forecast, by Application, 2025 - 2034 9.3.8 UK 9.3.8.1 Market Estimates & Forecast, 2025 - 2034 9.3.8.2 Market Estimates & Forecast, by Product Type, 2025 - 2034 9.3.8.3 Market Estimates & Forecast, by Application, 2025 - 2034 9.3.9 Russia 9.3.9.1 Market Estimates & Forecast, 2025 - 2034 9.3.9.2 Market Estimates & Forecast, by Product Type, 2025 - 2034 9.3.9.3 Market Estimates & Forecast, by Application, 2025 - 2034 9.3.10 Poland 9.3.10.1 Market Estimates & Forecast, 2025 - 2034 9.3.10.2 Market Estimates & Forecast, by Product Type, 2025 - 2034 9.3.10.3 Market Estimates & Forecast, by Application, 2025 - 2034 9.3.10 Rest of Europe 9.3.10.1 Market Estimates & Forecast, 2025 - 2034 9.3.10.2 Market Estimates & Forecast, by Product Type, 2025 - 2034 9.3.10.3 Market Estimates & Forecast, by Application, 2025 - 2034 9.4 Asia-Pacific 9.4.1 Market Estimates & Forecast, 2025 - 2034 9.4.2 Market Estimates & Forecast, by Product Type, 2025 - 2034 9.4.3 Market Estimates & Forecast, by Application, 2025 - 2034 9.4.4 China 9.4.4.1 Market Estimates & Forecast, 2025 - 2034 9.4.4.2 Market Estimates & Forecast, by Product Type, 2025 - 2034 9.4.4.3 Market Estimates & Forecast, by Application, 2025 - 2034 9.4.5 India 9.4.5.1 Market Estimates & Forecast, 2025 - 2034 9.4.5.2 Market Estimates & Forecast, by Product Type, 2025 - 2034 9.4.4.3 Market Estimates & Forecast, by Application, 2025 - 2034 9.4.6 Japan 9.4.6.1 Market Estimates & Forecast, 2025 - 2034 9.4.6.2 Market Estimates & Forecast, by Product Type, 2025 - 2034 9.4.6.3 Market Estimates & Forecast, by Application, 2025 - 2034 9.4.7 Australia 9.4.7.1 Market Estimates & Forecast, 2025 - 2034 9.4.7.2 Market Estimates & Forecast, by Product Type, 2025 - 2034 9.4.7.3 Market Estimates & Forecast, by Application, 2025 - 2034 9.4.8 New Zealand 9.4.8.1 Market Estimates & Forecast, 2025 - 2034 9.4.8.2 Market Estimates & Forecast, by Product Type, 2025 - 2034 9.4.8.3 Market Estimates & Forecast, by Application, 2025 - 2034 9.4.9 Rest of Asia-Pacific 9.4.9.1 Market Estimates & Forecast, 2025 - 2034 9.4.9.2 Market Estimates & Forecast, by Product Type, 2025 - 2034 9.4.9.3 Market Estimates & Forecast, by Application, 2025 - 2034 9.5 Middle East & Africa 9.5.1 Market Estimates & Forecast, 2025 - 2034 9.5.2 Market Estimates & Forecast, by Product Type, 2025 - 2034 9.5.3 Market Estimates & Forecast, by Application, 2025 - 2034 9.5.4 Turkey 9.5.4.1 Market Estimates & Forecast, 2025 - 2034 9.5.4.2 Market Estimates & Forecast, by Product Type, 2025 - 2034 9.5.4.3 Market Estimates & Forecast, by Application, 2025 - 2034 9.5.5 Israel 9.5.5.1 Market Estimates & Forecast, 2025 - 2034 9.5.5.2 Market Estimates & Forecast, by Product Type, 2025 - 2034 9.5.5.3 Market Estimates & Forecast, by Application, 2025 - 2034 9.5.6South Africa 9.5.6.1 Market Estimates & Forecast, 2025 - 2034 9.5.6.2 Market Estimates & Forecast, by Product Type, 2025 - 2034 9.5.6.3 Market Estimates & Forecast, by Application, 2025 - 2034 9.5.7 GCC 9.5.7.1 Market Estimates & Forecast, 2025 - 2034 9.5.7.2 Market Estimates & Forecast, by Product Type, 2025 - 2034 9.5.7.3 Market Estimates & Forecast, by Application, 2025 - 2034 9.5.8 Rest of the Middle East & Africa 9.5.8.1 Market Estimates & Forecast, 2025 - 2034 9.5.8.2 Market Estimates & Forecast, by Product Type, 2025 - 2034 9.5.8.3 Market Estimates & Forecast, by Application, 2025 - 2034 9.6 Latin America 9.6.1 Market Estimates & Forecast, 2025 - 2034 9.6.2 Market Estimates & Forecast, by Product Type, 2025 - 2034 9.6.3 Market Estimates & Forecast, by Application, 2025 - 2034 9.6.4 Brazil 9.6.4.1 Market Estimates & Forecast, 2025 - 2034 9.6.4.2 Market Estimates & Forecast, by Product Type, 2025 - 2034 9.6.4.3 Market Estimates & Forecast, by Application, 2025 - 2034 9.6.5 Argentina 9.6.5.1 Market Estimates & Forecast, 2025 - 2034 9.6.5.2 Market Estimates & Forecast, by Product Type, 2025 - 2034 9.6.5.3 Market Estimates & Forecast, by Application, 2025 - 2034 9.6.6 Mexico 9.6.6.1 Market Estimates & Forecast, 2025 - 2034 9.6.6.2 Market Estimates & Forecast, by Product Type, 2025 - 2034 9.6.6.3 Market Estimates & Forecast, by Application, 2025 - 2034 9.6.7 Rest of Latin America 9.6.7.1 Market Estimates & Forecast, 2025 - 2034 9.6.7.2 Market Estimates & Forecast, by Product Type, 2025 - 2034 9.6.7.3 Market Estimates & Forecast, by Application, 2025 - 2034 10. Competitive Landscape 10.1 Introduction 10.2 Global Proppants Market Strategy 10.3 Key Development Analysis (Expansions/Mergers& Acquisitions/Joint Ventures/New Product Developments/Agreements/Investments) 11. Company Profiles 11.1 Carbo Ceramics Inc. 11.1.1 Company Overview 11.1.2 Financial Updates 11.1.3 Product Overview 11.1.4 Key Developments 11.1.5 SWOT Analysis 11.1.6 Strategies 11.2COVIA 11.2.1 Company Overview 11.2.2 Financial Updates 11.2.3 Product Overview 11.2.4 Key Developments 11.2.5 SWOT Analysis 11.2.6 Strategies 11.3 JSC Borovichi Refractories Plant 11.3.1 Company Overview 11.3.2 Financial Updates 11.3.3 Product Overview 11.3.4 Key Developments 11.3.5 SWOT Analysis 11.3.6 Strategies 11.4 U.S. Silica Holdings Inc. 11.4.1 Company Overview 11.4.2 Financial Updates 11.4.3 Product Overview 11.4.4 Key Developments 11.4.5 SWOT Analysis 11.4.6 Strategies 11.5 Hi-Crush Inc. 11.5.1 Company Overview 11.5.2 Financial Updates 11.5.3 Product Overview 11.5.4 Key Developments 11.5.5 SWOT Analysis 11.5.6 Strategies 11.6 MineraçãoCurimbaba 11.6.1 Company Overview 11.6.2 Financial Updates 11.6.3 Product Overview 11.6.4 Key Developments 11.6.5 SWOT Analysis 11.6.6 Strategies 11.7 XinmiWanli Industry Development Co., Ltd. 11.7.1 Company Overview 11.7.2 Financial Updates 11.7.3 Product Overview 11.7.4 Key Developments 11.7.5 SWOT Analysis 11.7.6 Strategies 11.8 Atlas Sand Company, Llc 11.8.1 Company Overview 11.8.2 Financial Updates 11.8.3 Product Overview 11.8.4 Key Developments 11.8.5 SWOT Analysis 11.8.6 Strategies 11.9 HEXION 11.9.1 Company Overview 11.9.2 Financial Updates 11.9.3 Product Overview 11.9.4 Key Developments 11.9.5 SWOT Analysis 11.9.6 Strategies 11.10 Schlumberger Limited 11.10.1 Company Overview 11.10.2 Financial Updates 11.10.3 Product Overview 11.10.4 Key Developments 11.10.5 SWOT Analysis 11.10.6 Strategies 11.11 Others 12. Appendix   LIST OF TABLES 
      3. Table 1 Global Proppants Market, by Region, 2025 - 2034 
      4. Table 2 North America: Proppants Market, by Country, 2025 - 2034 
      5. Table 3 Europe: Proppants Market, by Country, 2025 - 2034 
      6. Table 4 Asia-Pacific: Proppants Market, by Country, 2025 - 2034 
      7. Table 5 Middle East & Africa: Proppants Market, by Country, 2025 - 2034 
      8. Table 6 Latin America: Proppants Market, by Country, 2025 - 2034 
      9. Table 7 Global Proppants Market Product Type, by Region, 2025 - 2034 
      10. Table 8 North America: Proppants Market Product Type, by Country, 2025 - 2034 
      11. Table 9 Europe: Proppants Market Product Type, by Country, 2025 - 2034 
      12. Table 10 Asia-Pacific: Proppants Market Product Type, by Country, 2025 - 2034 
      13. Table 11 Middle East & Africa: Proppants Market Product Type, by Country, 2025 - 2034 
      14. Table 12 Latin America: Proppants Market Product Type, by Country, 2025 - 2034 
      15. Table 13 Global Proppants Market Application, by Region, 2025 - 2034 
      16. Table 14 North America: Proppants Market Application, by Country, 2025 - 2034 
      17. Table 15 Europe: Proppants Market Application, by Country, 2025 - 2034 
      18. Table 16 Asia-Pacific: Proppants Market Application, by Country, 2025 - 2034 
      19. Table 17 Middle East & Africa: Proppants Market Application, by Country, 2025 - 2034 
      20. Table 18 Latin America: Proppants Market Application, by Country, 2025 - 2034 
      21. Table 19 Global Product Type Market, by Region, 2025 - 2034 
      22. Table 20 Global Market Application, by Region, 2025 - 2034 
      23. Table 21 North America: Proppants Market, by Country, 2025 - 2034 
      24. Table 22 North America: Proppants Market Product Type, 2025 - 2034 
      25. Table 23 North America: Proppants Market Application, 2025 - 2034 
      26. Table 24 Europe: Proppants Market, by Country, 2025 - 2034 
      27. Table 25 Europe: Proppants Market Product Type, 2025 - 2034 
      28. Table 26 Europe: Proppants Market Application, 2025 - 2034 
      29. Table 27 Asia-Pacific: Proppants Market, by Country, 2025 - 2034 
      30. Table 28 Asia-Pacific: Proppants Market Product Type, 2025 - 2034 
      31. Table 29 Asia-Pacific: Proppants Market Application, 2025 - 2034 
      32. Table 30 Middle East & Africa: Proppants Market, by Country, 2025 - 2034 
      33. Table 31 Middle East & Africa: Proppants Market Product Type, 2025 - 2034 
      34. Table 32 Middle East & Africa: Proppants Market Application, 2025 - 2034 
      35. Table 33 Latin America: Proppants Market, by Country, 2025 - 2034 
      36. Table 34 Latin America: Proppants Market Product Type, 2025 - 2034 
      37. Table 35 Latin America: Proppants Market Application, 2025 - 2034 LIST OF FIGURES 
      38. FIGURE 1 Global Proppants Market Segmentation 
      39. FIGURE 2 Forecast Methodology 
      40. FIGURE 3 Porter’s Five Forces Analysis of the Global Proppants Market 
      41. FIGURE 4 Supply Chain Analysis of the Global Proppants Market 
      42. FIGURE 5 Share of the Global Proppants Market, by Country, 2022 (%) 
      43. FIGURE 6 Global Proppants Market, 2025 - 2034 
      44. FIGURE 7 Sub-Segments of Product Type 
      45. FIGURE 8 Global Proppants Market Size, by Product Type, 2022(%) 
      46. FIGURE 9 Share of the Global Proppants Market, by Product Type, 2025 - 2034 
      47. FIGURE 10 Sub-Segments of Application 
      48. FIGURE 11 GlobalProppants Market Size,by Application, 2022(%) 
      49. FIGURE 12 Share of the Global Proppants Market,by Application, 2025 - 2034

    Proppants Market Segmentation

    Proppants Product Type Outlook (USD Billion, 2018-2032)

    Frac Sand

    Resin-Coated Proppant

    Ceramic Proppant

    Proppants Application Outlook (USD Billion, 2018-2032)

    Shale Gas

    Tight Gas

    Coal Bed Methane

    Proppants Regional Outlook (USD Billion, 2018-2032)

    North America Outlook (USD Billion, 2018-2032)

    North America Proppants by Product Type

    Frac Sand

    Resin-Coated Proppant

    Ceramic Proppant

    North America Proppants by Application

    Shale Gas

    Tight Gas

    Coal Bed Methane

    US Outlook (USD Billion, 2018-2032)

    US Proppants by Product Type

    Frac Sand

    Resin-Coated Proppant

    Ceramic Proppant

    US Proppants by Application

    Shale Gas

    Tight Gas

    Coal Bed Methane

    CANADA Outlook (USD Billion, 2018-2032)

    CANADA Proppants by Product Type

    Frac Sand

    Resin-Coated Proppant

    Ceramic Proppant

    CANADA Proppants by Application

    Shale Gas

    Tight Gas

    Coal Bed Methane

    Europe Outlook (USD Billion, 2018-2032)

    Europe Proppants by Product Type

    Frac Sand

    Resin-Coated Proppant

    Ceramic Proppant

    Europe Proppants by Application

    Shale Gas

    Tight Gas

    Coal Bed Methane

    Germany Outlook (USD Billion, 2018-2032)

    Germany Proppants by Product Type

    Frac Sand

    Resin-Coated Proppant

    Ceramic Proppant

    Germany Proppants by Application

    Shale Gas

    Tight Gas

    Coal Bed Methane

    France Outlook (USD Billion, 2018-2032)

    France Proppants by Product Type

    Frac Sand

    Resin-Coated Proppant

    Ceramic Proppant

    France Proppants by Application

    Shale Gas

    Tight Gas

    Coal Bed Methane

    UK Outlook (USD Billion, 2018-2032)

    UK Proppants by Product Type

    Frac Sand

    Resin-Coated Proppant

    Ceramic Proppant

    UK Proppants by Application

    Shale Gas

    Tight Gas

    Coal Bed Methane

    ITALY Outlook (USD Billion, 2018-2032)

    ITALY Proppants by Product Type

    Frac Sand

    Resin-Coated Proppant

    Ceramic Proppant

    ITALY Proppants by Application

    Shale Gas

    Tight Gas

    Coal Bed Methane

    SPAIN Outlook (USD Billion, 2018-2032)

    Spain Proppants by Product Type

    Frac Sand

    Resin-Coated Proppant

    Ceramic Proppant

    Spain Proppants by Application

    Shale Gas

    Tight Gas

    Coal Bed Methane

    Rest Of Europe Outlook (USD Billion, 2018-2032)

    Rest Of Europe Proppants by Product Type

    Frac Sand

    Resin-Coated Proppant

    Ceramic Proppant

    REST OF EUROPE Proppants by Application

    Shale Gas

    Tight Gas

    Coal Bed Methane

    Asia-Pacific Outlook (USD Billion, 2018-2032)

    Asia-Pacific Proppants by Product Type

    Frac Sand

    Resin-Coated Proppant

    Ceramic Proppant

    Asia-Pacific Proppants by Application

    Shale Gas

    Tight Gas

    Coal Bed Methane

    China Outlook (USD Billion, 2018-2032)

    China Proppants by Product Type

    Frac Sand

    Resin-Coated Proppant

    Ceramic Proppant

    China Proppants by Application

    Shale Gas

    Tight Gas

    Coal Bed Methane

    Japan Outlook (USD Billion, 2018-2032)

    Japan Proppants by Product Type

    Frac Sand

    Resin-Coated Proppant

    Ceramic Proppant

    Japan Proppants by Application

    Shale Gas

    Tight Gas

    Coal Bed Methane

    India Outlook (USD Billion, 2018-2032)

    India Proppants by Product Type

    Frac Sand

    Resin-Coated Proppant

    Ceramic Proppant

    India Proppants by Application

    Shale Gas

    Tight Gas

    Coal Bed Methane

    Australia Outlook (USD Billion, 2018-2032)

    Australia Proppants by Product Type

    Frac Sand

    Resin-Coated Proppant

    Ceramic Proppant

    Australia Proppants by Application

    Shale Gas

    Tight Gas

    Coal Bed Methane

    Rest of Asia-Pacific Outlook (USD Billion, 2018-2032)

    Rest of Asia-Pacific Proppants by Product Type

    Frac Sand

    Resin-Coated Proppant

    Ceramic Proppant

    Rest of Asia-Pacific Proppants by Application

    Shale Gas

    Tight Gas

    Coal Bed Methane

    Rest of the World Outlook (USD Billion, 2018-2032)

    Rest of the World Proppants by Product Type

    Frac Sand

    Resin-Coated Proppant

    Ceramic Proppant

    Rest of the World Proppants by Application

    Shale Gas

    Tight Gas

    Coal Bed Methane

    Middle East Outlook (USD Billion, 2018-2032)

    Middle East Proppants by Product Type

    Frac Sand

    Resin-Coated Proppant

    Ceramic Proppant

    Middle East Proppants by Application

    Shale Gas

    Tight Gas

    Coal Bed Methane

    Africa Outlook (USD Billion, 2018-2032)

    Africa Proppants by Product Type

    Frac Sand

    Resin-Coated Proppant

    Ceramic Proppant

    Africa Proppants by Application

    Shale Gas

    Tight Gas

    Coal Bed Methane

    Latin America Outlook (USD Billion, 2018-2032)

    Latin America Proppants by Product Type

    Frac Sand

    Resin-Coated Proppant

    Ceramic Proppant

    Latin America Proppants by Application

    Shale Gas

    Tight Gas

    Coal Bed Methane

    Infographic

    Free Sample Request

    Kindly complete the form below to receive a free sample of this Report

    Get Free Sample

    Customer Strories

    “I am very pleased with how market segments have been defined in a relevant way for my purposes (such as "Portable Freezers & refrigerators" and "last-mile"). In general the report is well structured. Thanks very much for your efforts.”

    Victoria Milne

    Founder
    Case Study
    Chemicals and Materials