• Cat-intel
  • MedIntelliX
  • Resources
  • About Us
  • Request Free Sample ×

    Kindly complete the form below to receive a free sample of this Report

    Leading companies partner with us for data-driven Insights

    clients tt-cursor

    Pressurized Water Reactor Market

    ID: MRFR/E&P/23463-HCR
    100 Pages
    Snehal Singh
    September 2025

    Pressurized Water Reactor Market Research Report By Reactor Design (Loop-type PWR, Integral PWR), By Fuel Type (Low enriched uranium, Mixed oxide fuel), By Power Output ( 1,000 MWe, 1,000 - 1,400 MWe, > 1,400 MWe), By Moderation Type (Water, Heavy water) and By Regional (North America, Europe, South America, Asia Pacific, Middle East and Africa) - Forecast to 2034

    Share:
    Download PDF ×

    We do not share your information with anyone. However, we may send you emails based on your report interest from time to time. You may contact us at any time to opt-out.

    Pressurized Water Reactor Market Research Report — Global Forecast till 2034 Infographic
    Purchase Options
    $ 4,950.0
    $ 5,950.0
    $ 7,250.0
    Table of Contents

    Pressurized Water Reactor Market Summary

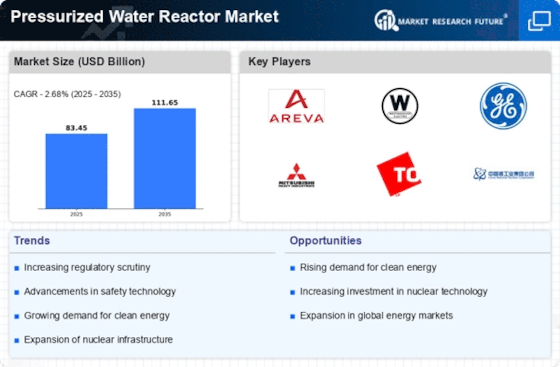
    The Global Pressurized Water Reactor Market is projected to grow from 83.5 USD Billion in 2024 to 111.6 USD Billion by 2035.

    Key Market Trends & Highlights

    Pressurized Water Reactor Key Trends and Highlights

    • The market is expected to witness a compound annual growth rate of 2.68 percent from 2025 to 2035.
    • By 2035, the market valuation is anticipated to reach 111.6 USD Billion, indicating robust growth potential.
    • In 2024, the market is valued at 83.5 USD Billion, laying a strong foundation for future expansion.
    • Growing adoption of advanced reactor technologies due to increasing energy demands is a major market driver.

    Market Size & Forecast

    2024 Market Size 83.5 (USD Billion)
    2035 Market Size 111.6 (USD Billion)
    CAGR (2025-2035) 2.68%

    Major Players

    Westinghouse Electric Company, Korea Hydro Nuclear Power (KHNP), India's Department of Atomic Energy, CGNPC, Rosatom, Japan Atomic Energy Agency, IAEA, China National Nuclear Corporation, Korea Electric Power Corporation, Kairos Power, NuScale Power, Terrestrial Energy, Framatome, General Electric, EdF Group

    Pressurized Water Reactor Market Trends

    Additionally, the increasing awareness of the role of nuclear power in mitigating climate change and ensuring energy security is generating positive market sentiment.In recent years, the PWR market has witnessed a shift towards the deployment of larger reactors, such as the AP1000 and EPR designs. These reactors offer economies of scale, reducing the levelized cost of electricity (LCOE). Collaborations between governments and utilities are also essential in advancing the PWR market, providing financial support and streamlining regulatory processes.

    The global landscape for pressurized water reactors is evolving, with an increasing emphasis on safety, efficiency, and sustainability, reflecting a broader commitment to reducing carbon emissions and enhancing energy security.

    U.S. Department of Energy

    Pressurized Water Reactor Market Drivers

    Global Energy Security

    Energy security remains a critical concern for many nations, influencing the Global Pressurized Water Reactor Market Industry. Countries are increasingly recognizing the importance of diversifying their energy portfolios to mitigate risks associated with reliance on fossil fuels. Nuclear energy, particularly through pressurized water reactors, offers a stable and reliable power source that can enhance energy independence. This strategic shift is evident as nations invest in nuclear infrastructure to ensure long-term energy security. The market's growth is anticipated to reflect this trend, as countries prioritize energy resilience in their energy policies.

    Increasing Energy Demand

    The Global Pressurized Water Reactor Market Industry is experiencing a surge in demand for energy due to population growth and industrialization. As countries strive to meet their energy needs, nuclear power emerges as a reliable source. In 2024, the market is valued at approximately 83.5 USD Billion, reflecting the growing reliance on nuclear energy. Nations are investing in new reactor designs and upgrades to existing facilities to enhance efficiency and output. This trend is expected to continue, with projections indicating a market growth to 111.6 USD Billion by 2035, driven by the need for sustainable and stable energy sources.

    Technological Advancements

    Technological innovations play a pivotal role in shaping the Global Pressurized Water Reactor Market Industry. Advancements in reactor design, safety systems, and operational efficiency are enhancing the appeal of pressurized water reactors. For instance, the development of Generation III and III+ reactors incorporates advanced safety features and improved fuel efficiency. These innovations not only reduce operational costs but also address safety concerns, which are paramount in nuclear energy. As a result, the market is poised for growth, with a projected CAGR of 2.68% from 2025 to 2035, indicating a robust future for technologically advanced nuclear solutions.

    Market Trends and Projections

    The Global Pressurized Water Reactor Market Industry is characterized by various trends and projections that indicate its future trajectory. The market is expected to grow from 83.5 USD Billion in 2024 to 111.6 USD Billion by 2035, reflecting a compound annual growth rate of 2.68% from 2025 to 2035. This growth is driven by increasing energy demands, technological advancements, and supportive government policies. Additionally, the focus on environmental sustainability and energy security further propels the market forward. These trends suggest a robust future for the pressurized water reactor segment within the broader nuclear energy landscape.

    Government Policies and Regulations

    Government policies and regulations significantly influence the Global Pressurized Water Reactor Market Industry. Many countries are implementing supportive frameworks to promote nuclear energy as a clean and reliable power source. This includes financial incentives, streamlined licensing processes, and enhanced safety regulations. For example, nations like France and China are actively expanding their nuclear fleets, supported by government initiatives. Such policies not only facilitate the construction of new reactors but also encourage the modernization of existing facilities. As a result, the market is expected to grow steadily, aligning with global energy transition goals.

    Environmental Concerns and Sustainability

    The Global Pressurized Water Reactor Market Industry is increasingly driven by environmental concerns and the push for sustainable energy solutions. As climate change becomes a pressing issue, nuclear energy is recognized for its low greenhouse gas emissions compared to fossil fuels. This awareness is prompting governments and industries to invest in nuclear technology as part of their strategies to reduce carbon footprints. The transition towards cleaner energy sources is likely to bolster the market, with projections indicating a growth trajectory that aligns with global sustainability goals. The emphasis on reducing reliance on carbon-intensive energy sources is a key factor in this evolving landscape.

    Market Segment Insights

    Pressurized Water Reactor Market Reactor Design Insights

    The Global Pressurized Water Reactor Market is segmented by reactor design, as loop-type PWR and integral PWR. The integral PWR market is expected to grow from USD 10.86 billion in 2023 to USD 16.3 billion by 2032, at a CAGR of 3.51%. Lord-type PWR Loop-type PWRs are the most common type of PWRs in operation today. They consist of a reactor vessel that contains the nuclear fuel and coolant and a steam generator that converts the heat from the coolant into steam. The steam is then used to drive a turbine that generates electricity.

    Integral PWR Integral PWRs are a newer type of PWR that has been developed in recent years.

    They are similar to loop-type PWRs, but they have a more compact design that eliminates the need for a separate steam generator. This makes them more efficient and less expensive to build than loop-type PWRs. Outlook The growth of the global pwr market is being driven by the increasing demand for electricity and the need to reduce greenhouse gas emissions. PWRs are a clean and efficient source of electricity, and they do not produce greenhouse gases. As a result, they are becoming increasingly popular with utilities and governments around the world.

    The loop-type pwr segment is expected to continue to dominate the global pwr market in the coming years. However, the integral PWR segment is expected to grow at a faster rate as more utilities and governments adopt this newer technology.

    Source: Primary Research, Secondary Research, Market Research Future Database and Analyst Review

    Pressurized Water Reactor Market Fuel Type Insights

    Fuel type The Global Pressurized Water Reactor Market is segmented by fuel type into Low Enriched Uranium and Mixed Oxide Fuel. Description and market stance Low enriched uranium is the most common fuel used in pressurized water reactors. It comprises over 90% of the global market. This is because it is a relatively cheap and stable fuel source. In addition, it produces less radiative waste as opposed to other fuel types. Mixed oxide fuel is a mix of uranium and plutonium oxides.

    The fuel type is becoming more popular as it has a higher energy density and a longer fuel cycle. The market size in 2032 will be 100.4 billion USD. The growth can be attributed to the increasing demand for pressurized water reactors as a low-carbon energy source. Another reason is the increased need for reliable and efficient power generation.

    Pressurized Water Reactor Market Power Output Insights

    The Global Pressurized Water Reactor Market is segmented based on Power Output into ' 1,000 MWe', '1,000 - 1,400 MWe', and '> 1,400 MWe'. The '1,000 - 1,400 MWe' segment accounted for the largest revenue share in 2023. The '1,000 - 1,400 MWe' segment is projected to continue dominating the market and grow at a CAGR of 2.68% during the forecast period. This growth is attributed to the increasing demand for electricity from emerging economies and the need for efficient and reliable power generation sources.

    The '> 1,400 MWe' segment is projected to witness the second-largest growth rate during the forecast period due to the growing adoption of large-scale nuclear power plants for baseload power generation. Moreover, the ' Global Pressurized Water Reactor Market ' for '> 1,400 MWe' segment is expected to reach USD 100.4 Billion by 2032.

    Pressurized Water Reactor Market Moderation Type Insights

    The Global Pressurized Water Reactor Market is segmented by Moderation Type into Water and Heavy Water. The Water segment is expected to account for a larger revenue share in the Global Pressurized Water Reactor Market throughout the forecast period. The growth of this segment is attributed to the increasing demand for water-cooled reactors due to their high efficiency and reliability. Water-cooled reactors use ordinary water as a coolant and moderator, which is relatively inexpensive and readily available.

    Furthermore, water-cooled reactors have a proven track record of safe and reliable operation, which makes them a preferred choice for many nuclear power plants.

    The Heavy water segment is expected to account for a smaller revenue share in the Global Pressurized Water Reactor Market. The Heavy water segment is projected to grow at a CAGR of 2.1% during the forecast period. The growth of this segment is attributed to the increasing demand for heavy water reactors in countries such as Canada, India, and China. Heavy water reactors use heavy water as a coolant and moderator, which is more expensive than ordinary water. However, heavy water reactors have certain advantages over water-cooled reactors, such as higher neutron economy and reduced fuel consumption.

    Get more detailed insights about Pressurized Water Reactor Market Research Report — Global Forecast till 2034

    Regional Insights

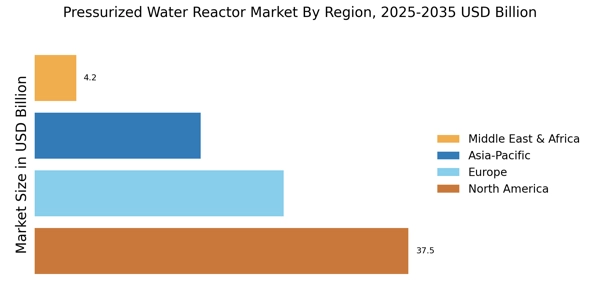
    The Global Pressurized Water Reactor Market is segmented into North America, Europe, APAC, South America, and MEA. North America is the largest regional market, accounting for over 35% of the global revenue in 2023. The region is expected to maintain its dominance throughout the forecast period, with the market expected to reach 38.5 billion USD by 2032. Europe is the second largest market, with a share of over 30% in 2023. The region is expected to grow at a CAGR of 2.5%, reaching 32.7 billion USD by 2032.

    APAC is the third largest market, with a share of over 20% in 2023. The region is expected to grow at a CAGR of 3.1%, reaching 26.4 billion USD by 2032. South America and MEA are the smallest regional markets, with shares of around 5% and 3%, respectively, in 2023.

    Pressurized Water Reactor Market Regional Insights

    Source: Primary Research, Secondary Research, Market Research Future Database and Analyst Review

    Key Players and Competitive Insights

    Major players in the Pressurized Water Reactor Market industry are continuously striving to improve the efficiency and safety of their products. Leading Pressurized Water Reactor Market players are focusing on developing advanced technologies to meet the increasing demand for clean and reliable energy. The Pressurized Water Reactor Market industry is characterized by intense competition, with key players investing heavily in research and development to gain a competitive edge. The competitive landscape is expected to remain dynamic, with new entrants and established players vying for market share.

    Westinghouse Electric Company, a leading player in the Pressurized Water Reactor Market, has been at the forefront of nuclear power plant design and construction for over a century. The company's AP1000 pressurized water reactor is known for its advanced safety features and high efficiency. Westinghouse Electric Company has a strong global presence and has supplied nuclear power plants to countries around the world. Another prominent player in the Pressurized Water Reactor Market is Korea Hydro Nuclear Power (KHNP). The company has played a pivotal role in the development of South Korea's nuclear power industry.

    KHNP's APR1400 pressurized water reactor incorporates advanced safety systems and is designed to meet the highest international standards. The company has successfully exported its reactor technology to several countries, including the United Arab Emirates and Turkey.

    Key Companies in the Pressurized Water Reactor Market market include

    Industry Developments

    The global pressurized water reactor (PWR) market is projected to grow from an estimated USD 79.14 billion in 2023 to USD 100.4 billion by 2032, at a CAGR of 2.68%. This growth is attributed to the rising demand for nuclear power as a clean and reliable energy source, government initiatives to promote nuclear energy, and the increasing adoption of PWRs in emerging economies. Recent developments in the PWR market include the construction of new nuclear power plants in China, India, and Russia, as well as the development of advanced PWR technologies such as the supercritical water-cooled reactor (SCWR).

    Future Outlook

    Pressurized Water Reactor Market Future Outlook

    The Global Pressurized Water Reactor Market is projected to grow at a 2.68% CAGR from 2024 to 2035, driven by technological advancements, regulatory support, and increasing energy demands.

    New opportunities lie in:

    • Invest in advanced reactor designs to enhance safety and efficiency.
    • Develop modular reactors for quicker deployment and reduced costs.
    • Leverage digital technologies for predictive maintenance and operational optimization.

    By 2035, the market is expected to exhibit robust growth, reflecting evolving energy needs and technological innovations.

    Market Segmentation

    Pressurized Water Reactor Market Regional Outlook

    • North America
    • Europe
    • South America
    • Asia Pacific
    • Middle East and Africa

    Pressurized Water Reactor Market Fuel Type Outlook

    • 1,000 MWe
    • 1,000 - 1,400 MWe
    • > 1,400 MWe

    Pressurized Water Reactor Market Power Output Outlook

    • Water
    • Heavy water

    Pressurized Water Reactor Market Reactor Design Outlook

    • Low enriched uranium
    • Mixed oxide fuel

    Pressurized Water Reactor Market Moderation Type Outlook

    • North America
    • Europe
    • South America
    • Asia Pacific
    • Middle East and Africa

    Report Scope

    Report Attribute/Metric Details
    Market Size 2024   83.45 (USD Billion)
    Market Size 2025   85.69 (USD Billion)
    Market Size 2034   108.73 (USD Billion)
    Compound Annual Growth Rate (CAGR)      2.68% (2025 - 2034)
    Report Coverage Revenue Forecast, Competitive Landscape, Growth Factors, and Trends
    Base Year 2024
    Market Forecast Period 2025 - 2034
    Historical Data 2019 - 2023
    Market Forecast Units USD Billion
    Key Companies Profiled KHNP, India's Department of Atomic Energy, CGNPC, Rosatom, Japan Atomic Energy Agency, IAEA, China National Nuclear Corporation, Korea Electric Power Corporation, Kairos Power, NuScale Power, Terrestrial Energy, Framatome, General Electric, Westinghouse Electric Company, EdF Group
    Segments Covered Reactor Design, Fuel Type, Power Output, Moderation Type, Regional
    Key Market Opportunities Nuclear power plant constructions Plant upgrades for extended lifespan Investment in new technologies Small modular reactor development Decommissioning and waste management
    Key Market Dynamics Increasing demand for clean energy Government initiatives for reducing carbon footprint Technological advancements in reactor designs Growing concerns over nuclear waste management Fluctuating fuel prices
    Countries Covered North America, Europe, APAC, South America, MEA

    Market Highlights

    Author
    Snehal Singh
    Assistant Manager - Research

    High acumen in analyzing complex macro & micro markets with more than 6 years of work experience in the field of market research. By implementing her analytical skills in forecasting and estimation into market research reports, she has expertise in Packaging, Construction, and Equipment domains. She handles a team size of 20-25 resources and ensures smooth running of the projects, associated marketing activities, and client servicing.

    Leave a Comment

    FAQs

    What is the current market size of the Global Pressurized Water Reactor Market?

    The Global Pressurized Water Reactor Market is expected to reach USD 83.45 billion in 2024, with a projected valuation of USD 108.73 billion by 2034, exhibiting a CAGR of 2.68% during the forecast period.

    Which region currently holds the largest market share in the Global Pressurized Water Reactor Market?

    North America currently dominates the Global Pressurized Water Reactor Market, owing to the presence of established nuclear power plants and supportive government policies promoting clean energy.

    Which application segment is projected to witness the highest growth in the Global Pressurized Water Reactor Market?

    The electricity generation segment is anticipated to register the highest growth rate in the Global Pressurized Water Reactor Market, driven by the increasing demand for reliable and low-carbon energy sources.

    Who are some of the key competitors in the Global Pressurized Water Reactor Market?

    Prominent players in the Global Pressurized Water Reactor Market include Westinghouse Electric Company, China National Nuclear Corporation, Korea Hydro Nuclear Power, and lectricité de France.

    What are the key growth drivers for the Global Pressurized Water Reactor Market?

    Factors such as rising energy consumption concerns over climate change and government initiatives promoting nuclear power are driving the growth of the Global Pressurized Water Reactor Market.

    What are some of the challenges faced by the Global Pressurized Water Reactor Market?

    Challenges include public perception and safety concerns, high construction costs, and regulatory hurdles, which may hinder the market's growth.

    How is the Global Pressurized Water Reactor Market expected to evolve in the coming years?

    The market is expected to witness advancements in reactor designs, fuel efficiency, and digitalization, leading to improved safety, lower operating costs, and increased efficiency.

    What is the projected market size of the Global Pressurized Water Reactor Market in 2032?

    The Global Pressurized Water Reactor Market is projected to reach approximately USD 108.73 billion by 2032.

    Which emerging economies are expected to contribute to the growth of the Global Pressurized Water Reactor Market?

    Emerging economies such as India, China, and Russia are expected to drive the growth of the Global Pressurized Water Reactor Market due to their increasing energy demands and focus on diversifying their energy mix.

    What are the key trends shaping the Global Pressurized Water Reactor Market?

    Key trends include the adoption of advanced technologies for enhanced safety and efficiency, the development of small modular reactors, and increasing collaboration between industry players and research institutions.

    1. EXECUTIVE SUMMARY
    2. Market Overview
      1. Key Findings
      2. Market Segmentation
    3. Competitive Landscape
      1. Challenges and Opportunities
      2. Future Outlook
    4. MARKET INTRODUCTION
      1. Definition
      2. Scope of the study
        1. Research Objective
        2. Assumption
        3. Limitations
    5. RESEARCH METHODOLOGY
      1. Overview
    6. Data Mining
      1. Secondary Research
      2. Primary Research
    7. Primary Interviews and Information Gathering Process
      1. Breakdown of Primary
    8. Respondents
      1. Forecasting Model
      2. Market Size Estimation
    9. Bottom-Up Approach
      1. Top-Down Approach
      2. Data Triangulation
      3. Validation
    10. MARKET DYNAMICS
      1. Overview
      2. Drivers
      3. Restraints
      4. Opportunities
    11. MARKET FACTOR ANALYSIS
      1. Value chain Analysis
      2. Porter's Five Forces
    12. Analysis
      1. Bargaining Power of Suppliers
        1. Bargaining Power
    13. of Buyers
      1. Threat of New Entrants
        1. Threat of Substitutes
        2. Intensity of Rivalry
      2. COVID-19 Impact Analysis
    14. Market Impact Analysis
      1. Regional Impact
        1. Opportunity and
    15. Threat Analysis
    16. PRESSURIZED WATER REACTOR MARKET, BY
    17. REACTOR DESIGN (USD BILLION)
      1. Loop-type PWR
      2. Integral PWR
    18. PRESSURIZED WATER REACTOR MARKET, BY FUEL TYPE (USD BILLION)
      1. Low
    19. enriched uranium
      1. Mixed oxide fuel
    20. PRESSURIZED WATER REACTOR
    21. MARKET, BY POWER OUTPUT (USD BILLION)
      1. 1,000 MWe
    22. MWe
      1. > 1,400 MWe
    23. PRESSURIZED WATER REACTOR MARKET, BY MODERATION
    24. TYPE (USD BILLION)
      1. Water
      2. Heavy water
    25. PRESSURIZED
    26. WATER REACTOR MARKET, BY REGIONAL (USD BILLION)
      1. North America
    27. US
      1. Canada
      2. Europe
        1. Germany
        2. UK
        3. France
        4. Russia
        5. Italy
        6. Spain
        7. Rest of Europe
      3. APAC
        1. China
    28. India
      1. Japan
        1. South Korea
        2. Malaysia
    29. Thailand
      1. Indonesia
        1. Rest of APAC
      2. South America
        1. Brazil
        2. Mexico
        3. Argentina
    30. Rest of South America
      1. MEA
        1. GCC Countries
    31. South Africa
      1. Rest of MEA
    32. COMPETITIVE LANDSCAPE
      1. Overview
      2. Competitive Analysis
      3. Market share Analysis
      4. Major Growth Strategy in the Pressurized Water Reactor Market
    33. Competitive Benchmarking
      1. Leading Players in Terms of Number of Developments
    34. in the Pressurized Water Reactor Market
      1. Key developments and growth
    35. strategies
      1. New Product Launch/Service Deployment
        1. Merger
    36. Acquisitions
      1. Joint Ventures
      2. Major Players Financial Matrix
        1. Sales and Operating Income
        2. Major Players RD Expenditure.
    37. COMPANY PROFILES
      1. KHNP
        1. Financial Overview
        2. Products Offered
        3. Key Developments
        4. SWOT
    38. Analysis
      1. Key Strategies
      2. India's Department of Atomic Energy
        1. Financial Overview
        2. Products Offered
        3. Key
    39. Developments
      1. SWOT Analysis
        1. Key Strategies
    40. CGNPC
      1. Financial Overview
        1. Products Offered
    41. Key Developments
      1. SWOT Analysis
        1. Key Strategies
    42. Rosatom
      1. Financial Overview
        1. Products Offered
    43. Key Developments
      1. SWOT Analysis
        1. Key Strategies
    44. Japan Atomic Energy Agency
      1. Financial Overview
        1. Products
    45. Offered
      1. Key Developments
        1. SWOT Analysis
    46. Key Strategies
      1. IAEA
        1. Financial Overview
        2. Products
    47. Offered
      1. Key Developments
        1. SWOT Analysis
    48. Key Strategies
      1. China National Nuclear Corporation
        1. Financial
    49. Overview
      1. Products Offered
        1. Key Developments
    50. SWOT Analysis
      1. Key Strategies
      2. Korea Electric Power Corporation
        1. Financial Overview
        2. Products Offered
        3. Key
    51. Developments
      1. SWOT Analysis
        1. Key Strategies
    52. Kairos Power
      1. Financial Overview
        1. Products Offered
        2. Key Developments
        3. SWOT Analysis
        4. Key Strategies
      2. NuScale Power
        1. Financial Overview
        2. Products
    53. Offered
      1. Key Developments
        1. SWOT Analysis
    54. Key Strategies
      1. Terrestrial Energy
        1. Financial Overview
        2. Products Offered
        3. Key Developments
        4. SWOT
    55. Analysis
      1. Key Strategies
      2. Framatome
        1. Financial
    56. Overview
      1. Products Offered
        1. Key Developments
    57. SWOT Analysis
      1. Key Strategies
      2. General Electric
    58. Financial Overview
      1. Products Offered
        1. Key Developments
        2. SWOT Analysis
        3. Key Strategies
      2. Westinghouse
    59. Electric Company
      1. Financial Overview
        1. Products Offered
        2. Key Developments
        3. SWOT Analysis
        4. Key
    60. Strategies
      1. EdF Group
        1. Financial Overview
    61. Products Offered
      1. Key Developments
        1. SWOT Analysis
        2. Key Strategies
    62. APPENDIX
      1. References
    63. Related Reports
    64. BY REACTOR DESIGN, 2019-2032 (USD BILLIONS)
    65. WATER REACTOR MARKET SIZE ESTIMATES & FORECAST, BY FUEL TYPE, 2019-2032 (USD
    66. BILLIONS)
    67. & FORECAST, BY POWER OUTPUT, 2019-2032 (USD BILLIONS)
    68. PRESSURIZED WATER REACTOR MARKET SIZE ESTIMATES & FORECAST, BY MODERATION TYPE,
    69. 2032 (USD BILLIONS)
    70. MARKET SIZE ESTIMATES & FORECAST, BY REGIONAL, 2019-2032 (USD BILLIONS)
    71. REACTOR DESIGN, 2019-2032 (USD BILLIONS)
    72. MARKET SIZE ESTIMATES & FORECAST, BY FUEL TYPE, 2019-2032 (USD BILLIONS)
    73. POWER OUTPUT, 2019-2032 (USD BILLIONS)
    74. MARKET SIZE ESTIMATES & FORECAST, BY MODERATION TYPE, 2019-2032 (USD BILLIONS)
    75. BY REGIONAL, 2019-2032 (USD BILLIONS)
    76. MARKET SIZE ESTIMATES & FORECAST, BY REACTOR DESIGN, 2019-2032 (USD BILLIONS)
    77. BY FUEL TYPE, 2019-2032 (USD BILLIONS)
    78. REACTOR MARKET SIZE ESTIMATES & FORECAST, BY POWER OUTPUT, 2019-2032 (USD BILLIONS)
    79. BY MODERATION TYPE, 2019-2032 (USD BILLIONS)
    80. WATER REACTOR MARKET SIZE ESTIMATES & FORECAST, BY REGIONAL, 2019-2032 (USD
    81. BILLIONS)
    82. & FORECAST, BY REACTOR DESIGN, 2019-2032 (USD BILLIONS)
    83. PRESSURIZED WATER REACTOR MARKET SIZE ESTIMATES & FORECAST, BY FUEL TYPE, 2019-2032
    84. (USD BILLIONS)
    85. & FORECAST, BY POWER OUTPUT, 2019-2032 (USD BILLIONS)
    86. PRESSURIZED WATER REACTOR MARKET SIZE ESTIMATES & FORECAST, BY MODERATION TYPE,
    87. 2032 (USD BILLIONS)
    88. SIZE ESTIMATES & FORECAST, BY REGIONAL, 2019-2032 (USD BILLIONS)
    89. GERMANY PRESSURIZED WATER REACTOR MARKET SIZE ESTIMATES & FORECAST, BY REACTOR
    90. DESIGN, 2019-2032 (USD BILLIONS)
    91. MARKET SIZE ESTIMATES & FORECAST, BY FUEL TYPE, 2019-2032 (USD BILLIONS)
    92. BY POWER OUTPUT, 2019-2032 (USD BILLIONS)
    93. REACTOR MARKET SIZE ESTIMATES & FORECAST, BY MODERATION TYPE, 2019-2032 (USD
    94. BILLIONS)
    95. & FORECAST, BY REGIONAL, 2019-2032 (USD BILLIONS)
    96. WATER REACTOR MARKET SIZE ESTIMATES & FORECAST, BY REACTOR DESIGN, 2019-2032
    97. (USD BILLIONS)
    98. & FORECAST, BY FUEL TYPE, 2019-2032 (USD BILLIONS)
    99. WATER REACTOR MARKET SIZE ESTIMATES & FORECAST, BY POWER OUTPUT, 2019-2032 (USD
    100. BILLIONS)
    101. FORECAST, BY MODERATION TYPE, 2019-2032 (USD BILLIONS)
    102. WATER REACTOR MARKET SIZE ESTIMATES & FORECAST, BY REGIONAL, 2019-2032 (USD
    103. BILLIONS)
    104. & FORECAST, BY REACTOR DESIGN, 2019-2032 (USD BILLIONS)
    105. PRESSURIZED WATER REACTOR MARKET SIZE ESTIMATES & FORECAST, BY FUEL TYPE, 2019-2032
    106. (USD BILLIONS)
    107. & FORECAST, BY POWER OUTPUT, 2019-2032 (USD BILLIONS)
    108. PRESSURIZED WATER REACTOR MARKET SIZE ESTIMATES & FORECAST, BY MODERATION TYPE,
    109. 2032 (USD BILLIONS)
    110. SIZE ESTIMATES & FORECAST, BY REGIONAL, 2019-2032 (USD BILLIONS)
    111. RUSSIA PRESSURIZED WATER REACTOR MARKET SIZE ESTIMATES & FORECAST, BY REACTOR
    112. DESIGN, 2019-2032 (USD BILLIONS)
    113. MARKET SIZE ESTIMATES & FORECAST, BY FUEL TYPE, 2019-2032 (USD BILLIONS)
    114. BY POWER OUTPUT, 2019-2032 (USD BILLIONS)
    115. REACTOR MARKET SIZE ESTIMATES & FORECAST, BY MODERATION TYPE, 2019-2032 (USD
    116. BILLIONS)
    117. & FORECAST, BY REGIONAL, 2019-2032 (USD BILLIONS)
    118. WATER REACTOR MARKET SIZE ESTIMATES & FORECAST, BY REACTOR DESIGN, 2019-2032
    119. (USD BILLIONS)
    120. & FORECAST, BY FUEL TYPE, 2019-2032 (USD BILLIONS)
    121. WATER REACTOR MARKET SIZE ESTIMATES & FORECAST, BY POWER OUTPUT, 2019-2032 (USD
    122. BILLIONS)
    123. & FORECAST, BY MODERATION TYPE, 2019-2032 (USD BILLIONS)
    124. PRESSURIZED WATER REACTOR MARKET SIZE ESTIMATES & FORECAST, BY REGIONAL, 2019-2032
    125. (USD BILLIONS)
    126. & FORECAST, BY REACTOR DESIGN, 2019-2032 (USD BILLIONS)
    127. PRESSURIZED WATER REACTOR MARKET SIZE ESTIMATES & FORECAST, BY FUEL TYPE, 2019-2032
    128. (USD BILLIONS)
    129. & FORECAST, BY POWER OUTPUT, 2019-2032 (USD BILLIONS)
    130. PRESSURIZED WATER REACTOR MARKET SIZE ESTIMATES & FORECAST, BY MODERATION TYPE,
    131. 2032 (USD BILLIONS)
    132. SIZE ESTIMATES & FORECAST, BY REGIONAL, 2019-2032 (USD BILLIONS)
    133. REST OF EUROPE PRESSURIZED WATER REACTOR MARKET SIZE ESTIMATES & FORECAST,
    134. BY REACTOR DESIGN, 2019-2032 (USD BILLIONS)
    135. WATER REACTOR MARKET SIZE ESTIMATES & FORECAST, BY FUEL TYPE, 2019-2032 (USD
    136. BILLIONS)
    137. & FORECAST, BY POWER OUTPUT, 2019-2032 (USD BILLIONS)
    138. EUROPE PRESSURIZED WATER REACTOR MARKET SIZE ESTIMATES & FORECAST, BY MODERATION
    139. TYPE, 2019-2032 (USD BILLIONS)
    140. REACTOR MARKET SIZE ESTIMATES & FORECAST, BY REGIONAL, 2019-2032 (USD BILLIONS)
    141. BY REACTOR DESIGN, 2019-2032 (USD BILLIONS)
    142. REACTOR MARKET SIZE ESTIMATES & FORECAST, BY FUEL TYPE, 2019-2032 (USD BILLIONS)
    143. BY POWER OUTPUT, 2019-2032 (USD BILLIONS)
    144. REACTOR MARKET SIZE ESTIMATES & FORECAST, BY MODERATION TYPE, 2019-2032 (USD
    145. BILLIONS)
    146. FORECAST, BY REGIONAL, 2019-2032 (USD BILLIONS)
    147. WATER REACTOR MARKET SIZE ESTIMATES & FORECAST, BY REACTOR DESIGN, 2019-2032
    148. (USD BILLIONS)
    149. & FORECAST, BY FUEL TYPE, 2019-2032 (USD BILLIONS)
    150. WATER REACTOR MARKET SIZE ESTIMATES & FORECAST, BY POWER OUTPUT, 2019-2032 (USD
    151. BILLIONS)
    152. & FORECAST, BY MODERATION TYPE, 2019-2032 (USD BILLIONS)
    153. PRESSURIZED WATER REACTOR MARKET SIZE ESTIMATES & FORECAST, BY REGIONAL, 2019-2032
    154. (USD BILLIONS)
    155. & FORECAST, BY REACTOR DESIGN, 2019-2032 (USD BILLIONS)
    156. PRESSURIZED WATER REACTOR MARKET SIZE ESTIMATES & FORECAST, BY FUEL TYPE, 2019-2032
    157. (USD BILLIONS)
    158. & FORECAST, BY POWER OUTPUT, 2019-2032 (USD BILLIONS)
    159. PRESSURIZED WATER REACTOR MARKET SIZE ESTIMATES & FORECAST, BY MODERATION TYPE,
    160. 2032 (USD BILLIONS)
    161. SIZE ESTIMATES & FORECAST, BY REGIONAL, 2019-2032 (USD BILLIONS)
    162. JAPAN PRESSURIZED WATER REACTOR MARKET SIZE ESTIMATES & FORECAST, BY REACTOR
    163. DESIGN, 2019-2032 (USD BILLIONS)
    164. MARKET SIZE ESTIMATES & FORECAST, BY FUEL TYPE, 2019-2032 (USD BILLIONS)
    165. BY POWER OUTPUT, 2019-2032 (USD BILLIONS)
    166. REACTOR MARKET SIZE ESTIMATES & FORECAST, BY MODERATION TYPE, 2019-2032 (USD
    167. BILLIONS)
    168. & FORECAST, BY REGIONAL, 2019-2032 (USD BILLIONS)
    169. PRESSURIZED WATER REACTOR MARKET SIZE ESTIMATES & FORECAST, BY REACTOR DESIGN,
    170. 2032 (USD BILLIONS)
    171. SIZE ESTIMATES & FORECAST, BY FUEL TYPE, 2019-2032 (USD BILLIONS)
    172. SOUTH KOREA PRESSURIZED WATER REACTOR MARKET SIZE ESTIMATES & FORECAST,
    173. BY POWER OUTPUT, 2019-2032 (USD BILLIONS)
    174. WATER REACTOR MARKET SIZE ESTIMATES & FORECAST, BY MODERATION TYPE, 2019-2032
    175. (USD BILLIONS)
    176. ESTIMATES & FORECAST, BY REGIONAL, 2019-2032 (USD BILLIONS)
    177. MALAYSIA PRESSURIZED WATER REACTOR MARKET SIZE ESTIMATES & FORECAST, BY REACTOR
    178. DESIGN, 2019-2032 (USD BILLIONS)
    179. MARKET SIZE ESTIMATES & FORECAST, BY FUEL TYPE, 2019-2032 (USD BILLIONS)
    180. BY POWER OUTPUT, 2019-2032 (USD BILLIONS)
    181. REACTOR MARKET SIZE ESTIMATES & FORECAST, BY MODERATION TYPE, 2019-2032 (USD
    182. BILLIONS)
    183. & FORECAST, BY REGIONAL, 2019-2032 (USD BILLIONS)
    184. WATER REACTOR MARKET SIZE ESTIMATES & FORECAST, BY REACTOR DESIGN, 2019-2032
    185. (USD BILLIONS)
    186. & FORECAST, BY FUEL TYPE, 2019-2032 (USD BILLIONS)
    187. PRESSURIZED WATER REACTOR MARKET SIZE ESTIMATES & FORECAST, BY POWER OUTPUT,
    188. 2032 (USD BILLIONS)
    189. SIZE ESTIMATES & FORECAST, BY MODERATION TYPE, 2019-2032 (USD BILLIONS)
    190. BY REGIONAL, 2019-2032 (USD BILLIONS)
    191. REACTOR MARKET SIZE ESTIMATES & FORECAST, BY REACTOR DESIGN, 2019-2032 (USD
    192. BILLIONS)
    193. & FORECAST, BY FUEL TYPE, 2019-2032 (USD BILLIONS)
    194. PRESSURIZED WATER REACTOR MARKET SIZE ESTIMATES & FORECAST, BY POWER OUTPUT,
    195. 2032 (USD BILLIONS)
    196. SIZE ESTIMATES & FORECAST, BY MODERATION TYPE, 2019-2032 (USD BILLIONS)
    197. BY REGIONAL, 2019-2032 (USD BILLIONS)
    198. REACTOR MARKET SIZE ESTIMATES & FORECAST, BY REACTOR DESIGN, 2019-2032 (USD
    199. BILLIONS)
    200. & FORECAST, BY FUEL TYPE, 2019-2032 (USD BILLIONS)
    201. PRESSURIZED WATER REACTOR MARKET SIZE ESTIMATES & FORECAST, BY POWER OUTPUT,
    202. 2032 (USD BILLIONS)
    203. MARKET SIZE ESTIMATES & FORECAST, BY MODERATION TYPE, 2019-2032 (USD BILLIONS)
    204. FORECAST, BY REGIONAL, 2019-2032 (USD BILLIONS)
    205. WATER REACTOR MARKET SIZE ESTIMATES & FORECAST, BY REACTOR DESIGN, 2019-2032
    206. (USD BILLIONS)
    207. ESTIMATES & FORECAST, BY FUEL TYPE, 2019-2032 (USD BILLIONS)
    208. SOUTH AMERICA PRESSURIZED WATER REACTOR MARKET SIZE ESTIMATES & FORECAST, BY
    209. POWER OUTPUT, 2019-2032 (USD BILLIONS)
    210. WATER REACTOR MARKET SIZE ESTIMATES & FORECAST, BY MODERATION TYPE, 2019-2032
    211. (USD BILLIONS)
    212. ESTIMATES & FORECAST, BY REGIONAL, 2019-2032 (USD BILLIONS)
    213. BRAZIL PRESSURIZED WATER REACTOR MARKET SIZE ESTIMATES & FORECAST, BY REACTOR
    214. DESIGN, 2019-2032 (USD BILLIONS)
    215. MARKET SIZE ESTIMATES & FORECAST, BY FUEL TYPE, 2019-2032 (USD BILLIONS)
    216. BY POWER OUTPUT, 2019-2032 (USD BILLIONS)
    217. REACTOR MARKET SIZE ESTIMATES & FORECAST, BY MODERATION TYPE, 2019-2032 (USD
    218. BILLIONS)
    219. & FORECAST, BY REGIONAL, 2019-2032 (USD BILLIONS)
    220. WATER REACTOR MARKET SIZE ESTIMATES & FORECAST, BY REACTOR DESIGN, 2019-2032
    221. (USD BILLIONS)
    222. & FORECAST, BY FUEL TYPE, 2019-2032 (USD BILLIONS)
    223. WATER REACTOR MARKET SIZE ESTIMATES & FORECAST, BY POWER OUTPUT, 2019-2032 (USD
    224. BILLIONS)
    225. & FORECAST, BY MODERATION TYPE, 2019-2032 (USD BILLIONS)
    226. PRESSURIZED WATER REACTOR MARKET SIZE ESTIMATES & FORECAST, BY REGIONAL, 2019-2032
    227. (USD BILLIONS)
    228. ESTIMATES & FORECAST, BY REACTOR DESIGN, 2019-2032 (USD BILLIONS)
    229. ARGENTINA PRESSURIZED WATER REACTOR MARKET SIZE ESTIMATES & FORECAST, BY
    230. FUEL TYPE, 2019-2032 (USD BILLIONS)
    231. REACTOR MARKET SIZE ESTIMATES & FORECAST, BY POWER OUTPUT, 2019-2032 (USD BILLIONS)
    232. FORECAST, BY MODERATION TYPE, 2019-2032 (USD BILLIONS)
    233. PRESSURIZED WATER REACTOR MARKET SIZE ESTIMATES & FORECAST, BY REGIONAL, 2019-2032
    234. (USD BILLIONS)
    235. MARKET SIZE ESTIMATES & FORECAST, BY REACTOR DESIGN, 2019-2032 (USD BILLIONS)
    236. & FORECAST, BY FUEL TYPE, 2019-2032 (USD BILLIONS)
    237. SOUTH AMERICA PRESSURIZED WATER REACTOR MARKET SIZE ESTIMATES & FORECAST, BY
    238. POWER OUTPUT, 2019-2032 (USD BILLIONS)
    239. WATER REACTOR MARKET SIZE ESTIMATES & FORECAST, BY MODERATION TYPE, 2019-2032
    240. (USD BILLIONS)
    241. MARKET SIZE ESTIMATES & FORECAST, BY REGIONAL, 2019-2032 (USD BILLIONS)
    242. BY REACTOR DESIGN, 2019-2032 (USD BILLIONS)
    243. REACTOR MARKET SIZE ESTIMATES & FORECAST, BY FUEL TYPE, 2019-2032 (USD BILLIONS)
    244. BY POWER OUTPUT, 2019-2032 (USD BILLIONS)
    245. REACTOR MARKET SIZE ESTIMATES & FORECAST, BY MODERATION TYPE, 2019-2032 (USD
    246. BILLIONS)
    247. FORECAST, BY REGIONAL, 2019-2032 (USD BILLIONS)
    248. WATER REACTOR MARKET SIZE ESTIMATES & FORECAST, BY REACTOR DESIGN, 2019-2032
    249. (USD BILLIONS)
    250. ESTIMATES & FORECAST, BY FUEL TYPE, 2019-2032 (USD BILLIONS)
    251. GCC COUNTRIES PRESSURIZED WATER REACTOR MARKET SIZE ESTIMATES & FORECAST, BY
    252. POWER OUTPUT, 2019-2032 (USD BILLIONS)
    253. WATER REACTOR MARKET SIZE ESTIMATES & FORECAST, BY MODERATION TYPE, 2019-2032
    254. (USD BILLIONS)
    255. ESTIMATES & FORECAST, BY REGIONAL, 2019-2032 (USD BILLIONS)
    256. SOUTH AFRICA PRESSURIZED WATER REACTOR MARKET SIZE ESTIMATES & FORECAST, BY
    257. REACTOR DESIGN, 2019-2032 (USD BILLIONS)
    258. WATER REACTOR MARKET SIZE ESTIMATES & FORECAST, BY FUEL TYPE, 2019-2032 (USD
    259. BILLIONS)
    260. & FORECAST, BY POWER OUTPUT, 2019-2032 (USD BILLIONS)
    261. AFRICA PRESSURIZED WATER REACTOR MARKET SIZE ESTIMATES & FORECAST, BY MODERATION
    262. TYPE, 2019-2032 (USD BILLIONS)
    263. MARKET SIZE ESTIMATES & FORECAST, BY REGIONAL, 2019-2032 (USD BILLIONS)
    264. BY REACTOR DESIGN, 2019-2032 (USD BILLIONS)
    265. WATER REACTOR MARKET SIZE ESTIMATES & FORECAST, BY FUEL TYPE, 2019-2032 (USD
    266. BILLIONS)
    267. & FORECAST, BY POWER OUTPUT, 2019-2032 (USD BILLIONS)
    268. OF MEA PRESSURIZED WATER REACTOR MARKET SIZE ESTIMATES & FORECAST, BY MODERATION
    269. TYPE, 2019-2032 (USD BILLIONS)
    270. MARKET SIZE ESTIMATES & FORECAST, BY REGIONAL, 2019-2032 (USD BILLIONS)
    271. NORTH AMERICA PRESSURIZED WATER REACTOR MARKET ANALYSIS
    272. WATER REACTOR MARKET ANALYSIS BY REACTOR DESIGN
    273. REACTOR MARKET ANALYSIS BY FUEL TYPE
    274. MARKET ANALYSIS BY POWER OUTPUT
    275. ANALYSIS BY MODERATION TYPE
    276. ANALYSIS BY REGIONAL
    277. BY REACTOR DESIGN
    278. BY FUEL TYPE
    279. POWER OUTPUT
    280. MODERATION TYPE
    281. BY REGIONAL
    282. TYPE
    283. UK PRESSURIZED WATER REACTOR MARKET ANALYSIS BY POWER OUTPUT
    284. UK PRESSURIZED WATER REACTOR MARKET ANALYSIS BY MODERATION TYPE
    285. UK PRESSURIZED WATER REACTOR MARKET ANALYSIS BY REGIONAL
    286. PRESSURIZED WATER REACTOR MARKET ANALYSIS BY REACTOR DESIGN
    287. PRESSURIZED WATER REACTOR MARKET ANALYSIS BY FUEL TYPE
    288. WATER REACTOR MARKET ANALYSIS BY POWER OUTPUT
    289. WATER REACTOR MARKET ANALYSIS BY MODERATION TYPE
    290. WATER REACTOR MARKET ANALYSIS BY REGIONAL
    291. REACTOR MARKET ANALYSIS BY REACTOR DESIGN
    292. REACTOR MARKET ANALYSIS BY FUEL TYPE
    293. MARKET ANALYSIS BY POWER OUTPUT
    294. MARKET ANALYSIS BY MODERATION TYPE
    295. MARKET ANALYSIS BY REGIONAL
    296. ANALYSIS BY REACTOR DESIGN
    297. ANALYSIS BY FUEL TYPE
    298. BY POWER OUTPUT
    299. BY MODERATION TYPE
    300. BY REGIONAL
    301. REACTOR DESIGN
    302. BY FUEL TYPE
    303. POWER OUTPUT
    304. MODERATION TYPE
    305. BY REGIONAL
    306. BY REACTOR DESIGN
    307. ANALYSIS BY FUEL TYPE
    308. MARKET ANALYSIS BY POWER OUTPUT
    309. REACTOR MARKET ANALYSIS BY MODERATION TYPE
    310. WATER REACTOR MARKET ANALYSIS BY REGIONAL
    311. REACTOR MARKET ANALYSIS
    312. ANALYSIS BY REACTOR DESIGN
    313. ANALYSIS BY FUEL TYPE
    314. BY POWER OUTPUT
    315. BY MODERATION TYPE
    316. BY REGIONAL
    317. REACTOR DESIGN
    318. BY FUEL TYPE
    319. POWER OUTPUT
    320. MODERATION TYPE
    321. BY REGIONAL
    322. REACTOR DESIGN
    323. BY FUEL TYPE
    324. POWER OUTPUT
    325. MODERATION TYPE
    326. BY REGIONAL
    327. BY REACTOR DESIGN
    328. ANALYSIS BY FUEL TYPE
    329. ANALYSIS BY POWER OUTPUT
    330. MARKET ANALYSIS BY MODERATION TYPE
    331. REACTOR MARKET ANALYSIS BY REGIONAL
    332. REACTOR MARKET ANALYSIS BY REACTOR DESIGN
    333. WATER REACTOR MARKET ANALYSIS BY FUEL TYPE
    334. WATER REACTOR MARKET ANALYSIS BY POWER OUTPUT
    335. WATER REACTOR MARKET ANALYSIS BY MODERATION TYPE
    336. WATER REACTOR MARKET ANALYSIS BY REGIONAL
    337. WATER REACTOR MARKET ANALYSIS BY REACTOR DESIGN
    338. WATER REACTOR MARKET ANALYSIS BY FUEL TYPE
    339. WATER REACTOR MARKET ANALYSIS BY POWER OUTPUT
    340. WATER REACTOR MARKET ANALYSIS BY MODERATION TYPE
    341. WATER REACTOR MARKET ANALYSIS BY REGIONAL
    342. WATER REACTOR MARKET ANALYSIS BY REACTOR DESIGN
    343. WATER REACTOR MARKET ANALYSIS BY FUEL TYPE
    344. WATER REACTOR MARKET ANALYSIS BY POWER OUTPUT
    345. WATER REACTOR MARKET ANALYSIS BY MODERATION TYPE
    346. WATER REACTOR MARKET ANALYSIS BY REGIONAL
    347. WATER REACTOR MARKET ANALYSIS BY REACTOR DESIGN
    348. WATER REACTOR MARKET ANALYSIS BY FUEL TYPE
    349. WATER REACTOR MARKET ANALYSIS BY POWER OUTPUT
    350. WATER REACTOR MARKET ANALYSIS BY MODERATION TYPE
    351. WATER REACTOR MARKET ANALYSIS BY REGIONAL
    352. WATER REACTOR MARKET ANALYSIS
    353. MARKET ANALYSIS BY REACTOR DESIGN
    354. MARKET ANALYSIS BY FUEL TYPE
    355. ANALYSIS BY POWER OUTPUT
    356. ANALYSIS BY MODERATION TYPE
    357. ANALYSIS BY REGIONAL
    358. BY REACTOR DESIGN
    359. BY FUEL TYPE
    360. POWER OUTPUT
    361. MODERATION TYPE
    362. BY REGIONAL
    363. BY REACTOR DESIGN
    364. BY FUEL TYPE
    365. BY POWER OUTPUT
    366. BY MODERATION TYPE
    367. ANALYSIS BY REGIONAL
    368. MARKET ANALYSIS BY REACTOR DESIGN
    369. WATER REACTOR MARKET ANALYSIS BY FUEL TYPE
    370. PRESSURIZED WATER REACTOR MARKET ANALYSIS BY POWER OUTPUT
    371. OF SOUTH AMERICA PRESSURIZED WATER REACTOR MARKET ANALYSIS BY MODERATION TYPE
    372. REGIONAL
    373. GCC COUNTRIES PRESSURIZED WATER REACTOR MARKET ANALYSIS BY REACTOR DESIGN
    374. OUTPUT
    375. BY MODERATION TYPE
    376. ANALYSIS BY REGIONAL
    377. ANALYSIS BY REACTOR DESIGN
    378. MARKET ANALYSIS BY FUEL TYPE
    379. MARKET ANALYSIS BY POWER OUTPUT
    380. REACTOR MARKET ANALYSIS BY MODERATION TYPE
    381. WATER REACTOR MARKET ANALYSIS BY REGIONAL
    382. WATER REACTOR MARKET ANALYSIS BY REACTOR DESIGN
    383. WATER REACTOR MARKET ANALYSIS BY FUEL TYPE
    384. WATER REACTOR MARKET ANALYSIS BY POWER OUTPUT
    385. WATER REACTOR MARKET ANALYSIS BY MODERATION TYPE
    386. WATER REACTOR MARKET ANALYSIS BY REGIONAL
    387. OF PRESSURIZED WATER REACTOR MARKET
    388. DRIVERS IMPACT ANALYSIS: PRESSURIZED WATER REACTOR MARKET
    389. IMPACT ANALYSIS: PRESSURIZED WATER REACTOR MARKET
    390. CHAIN: PRESSURIZED WATER REACTOR MARKET
    391. MARKET, BY REACTOR DESIGN, 2024 (% SHARE)
    392. MARKET, BY REACTOR DESIGN, 2019 TO 2032 (USD Billions)
    393. WATER REACTOR MARKET, BY FUEL TYPE, 2024 (% SHARE)
    394. WATER REACTOR MARKET, BY FUEL TYPE, 2019 TO 2032 (USD Billions)
    395. PRESSURIZED WATER REACTOR MARKET, BY POWER OUTPUT, 2024 (% SHARE)
    396. PRESSURIZED WATER REACTOR MARKET, BY POWER OUTPUT, 2019 TO 2032 (USD Billions)
    397. (USD Billions)
    398. (% SHARE)
    399. TO 2032 (USD Billions)

    Pressurized Water Reactor Market Segmentation

    • Pressurized Water Reactor Market By Reactor Design (USD Billion, 2019-2032)
      • Loop-type PWR
      • Integral PWR
    • Pressurized Water Reactor Market By Fuel Type (USD Billion, 2019-2032)
      • Low enriched uranium
      • Mixed oxide fuel
    • Pressurized Water Reactor Market By Power Output (USD Billion, 2019-2032)
      • 1,000 MWe
      • 1,000 - 1,400 MWe
      • > 1,400 MWe
    • Pressurized Water Reactor Market By Moderation Type (USD Billion, 2019-2032)
      • Water
      • Heavy water
    • Pressurized Water Reactor Market By Regional (USD Billion, 2019-2032)
      • North America
      • Europe
      • South America
      • Asia Pacific
      • Middle East and Africa

    Pressurized Water Reactor Market Regional Outlook (USD Billion, 2019-2032)

    • North America Outlook (USD Billion, 2019-2032)
      • North America Pressurized Water Reactor Market by Reactor Design Type
        • Loop-type PWR
        • Integral PWR
      • North America Pressurized Water Reactor Market by Fuel Type
        • Low enriched uranium
        • Mixed oxide fuel
      • North America Pressurized Water Reactor Market by Power Output Type
        • 1,000 MWe
        • 1,000 - 1,400 MWe
        • > 1,400 MWe
      • North America Pressurized Water Reactor Market by Moderation Type
        • Water
        • Heavy water
      • North America Pressurized Water Reactor Market by Regional Type
        • US
        • Canada
      • US Outlook (USD Billion, 2019-2032)
      • US Pressurized Water Reactor Market by Reactor Design Type
        • Loop-type PWR
        • Integral PWR
      • US Pressurized Water Reactor Market by Fuel Type
        • Low enriched uranium
        • Mixed oxide fuel
      • US Pressurized Water Reactor Market by Power Output Type
        • 1,000 MWe
        • 1,000 - 1,400 MWe
        • > 1,400 MWe
      • US Pressurized Water Reactor Market by Moderation Type
        • Water
        • Heavy water
      • CANADA Outlook (USD Billion, 2019-2032)
      • CANADA Pressurized Water Reactor Market by Reactor Design Type
        • Loop-type PWR
        • Integral PWR
      • CANADA Pressurized Water Reactor Market by Fuel Type
        • Low enriched uranium
        • Mixed oxide fuel
      • CANADA Pressurized Water Reactor Market by Power Output Type
        • 1,000 MWe
        • 1,000 - 1,400 MWe
        • > 1,400 MWe
      • CANADA Pressurized Water Reactor Market by Moderation Type
        • Water
        • Heavy water
      • Europe Outlook (USD Billion, 2019-2032)
        • Europe Pressurized Water Reactor Market by Reactor Design Type
          • Loop-type PWR
          • Integral PWR
        • Europe Pressurized Water Reactor Market by Fuel Type
          • Low enriched uranium
          • Mixed oxide fuel
        • Europe Pressurized Water Reactor Market by Power Output Type
          • 1,000 MWe
          • 1,000 - 1,400 MWe
          • > 1,400 MWe
        • Europe Pressurized Water Reactor Market by Moderation Type
          • Water
          • Heavy water
        • Europe Pressurized Water Reactor Market by Regional Type
          • Germany
          • UK
          • France
          • Russia
          • Italy
          • Spain
          • Rest of Europe
        • GERMANY Outlook (USD Billion, 2019-2032)
        • GERMANY Pressurized Water Reactor Market by Reactor Design Type
          • Loop-type PWR
          • Integral PWR
        • GERMANY Pressurized Water Reactor Market by Fuel Type
          • Low enriched uranium
          • Mixed oxide fuel
        • GERMANY Pressurized Water Reactor Market by Power Output Type
          • 1,000 MWe
          • 1,000 - 1,400 MWe
          • > 1,400 MWe
        • GERMANY Pressurized Water Reactor Market by Moderation Type
          • Water
          • Heavy water
        • UK Outlook (USD Billion, 2019-2032)
        • UK Pressurized Water Reactor Market by Reactor Design Type
          • Loop-type PWR
          • Integral PWR
        • UK Pressurized Water Reactor Market by Fuel Type
          • Low enriched uranium
          • Mixed oxide fuel
        • UK Pressurized Water Reactor Market by Power Output Type
          • 1,000 MWe
          • 1,000 - 1,400 MWe
          • > 1,400 MWe
        • UK Pressurized Water Reactor Market by Moderation Type
          • Water
          • Heavy water
        • FRANCE Outlook (USD Billion, 2019-2032)
        • FRANCE Pressurized Water Reactor Market by Reactor Design Type
          • Loop-type PWR
          • Integral PWR
        • FRANCE Pressurized Water Reactor Market by Fuel Type
          • Low enriched uranium
          • Mixed oxide fuel
        • FRANCE Pressurized Water Reactor Market by Power Output Type
          • 1,000 MWe
          • 1,000 - 1,400 MWe
          • > 1,400 MWe
        • FRANCE Pressurized Water Reactor Market by Moderation Type
          • Water
          • Heavy water
        • RUSSIA Outlook (USD Billion, 2019-2032)
        • RUSSIA Pressurized Water Reactor Market by Reactor Design Type
          • Loop-type PWR
          • Integral PWR
        • RUSSIA Pressurized Water Reactor Market by Fuel Type
          • Low enriched uranium
          • Mixed oxide fuel
        • RUSSIA Pressurized Water Reactor Market by Power Output Type
          • 1,000 MWe
          • 1,000 - 1,400 MWe
          • > 1,400 MWe
        • RUSSIA Pressurized Water Reactor Market by Moderation Type
          • Water
          • Heavy water
        • ITALY Outlook (USD Billion, 2019-2032)
        • ITALY Pressurized Water Reactor Market by Reactor Design Type
          • Loop-type PWR
          • Integral PWR
        • ITALY Pressurized Water Reactor Market by Fuel Type
          • Low enriched uranium
          • Mixed oxide fuel
        • ITALY Pressurized Water Reactor Market by Power Output Type
          • 1,000 MWe
          • 1,000 - 1,400 MWe
          • > 1,400 MWe
        • ITALY Pressurized Water Reactor Market by Moderation Type
          • Water
          • Heavy water
        • SPAIN Outlook (USD Billion, 2019-2032)
        • SPAIN Pressurized Water Reactor Market by Reactor Design Type
          • Loop-type PWR
          • Integral PWR
        • SPAIN Pressurized Water Reactor Market by Fuel Type
          • Low enriched uranium
          • Mixed oxide fuel
        • SPAIN Pressurized Water Reactor Market by Power Output Type
          • 1,000 MWe
          • 1,000 - 1,400 MWe
          • > 1,400 MWe
        • SPAIN Pressurized Water Reactor Market by Moderation Type
          • Water
          • Heavy water
        • REST OF EUROPE Outlook (USD Billion, 2019-2032)
        • REST OF EUROPE Pressurized Water Reactor Market by Reactor Design Type
          • Loop-type PWR
          • Integral PWR
        • REST OF EUROPE Pressurized Water Reactor Market by Fuel Type
          • Low enriched uranium
          • Mixed oxide fuel
        • REST OF EUROPE Pressurized Water Reactor Market by Power Output Type
          • 1,000 MWe
          • 1,000 - 1,400 MWe
          • > 1,400 MWe
        • REST OF EUROPE Pressurized Water Reactor Market by Moderation Type
          • Water
          • Heavy water
        • APAC Outlook (USD Billion, 2019-2032)
          • APAC Pressurized Water Reactor Market by Reactor Design Type
            • Loop-type PWR
            • Integral PWR
          • APAC Pressurized Water Reactor Market by Fuel Type
            • Low enriched uranium
            • Mixed oxide fuel
          • APAC Pressurized Water Reactor Market by Power Output Type
            • 1,000 MWe
            • 1,000 - 1,400 MWe
            • > 1,400 MWe
          • APAC Pressurized Water Reactor Market by Moderation Type
            • Water
            • Heavy water
          • APAC Pressurized Water Reactor Market by Regional Type
            • China
            • India
            • Japan
            • South Korea
            • Malaysia
            • Thailand
            • Indonesia
            • Rest of APAC
          • CHINA Outlook (USD Billion, 2019-2032)
          • CHINA Pressurized Water Reactor Market by Reactor Design Type
            • Loop-type PWR
            • Integral PWR
          • CHINA Pressurized Water Reactor Market by Fuel Type
            • Low enriched uranium
            • Mixed oxide fuel
          • CHINA Pressurized Water Reactor Market by Power Output Type
            • 1,000 MWe
            • 1,000 - 1,400 MWe
            • > 1,400 MWe
          • CHINA Pressurized Water Reactor Market by Moderation Type
            • Water
            • Heavy water
          • INDIA Outlook (USD Billion, 2019-2032)
          • INDIA Pressurized Water Reactor Market by Reactor Design Type
            • Loop-type PWR
            • Integral PWR
          • INDIA Pressurized Water Reactor Market by Fuel Type
            • Low enriched uranium
            • Mixed oxide fuel
          • INDIA Pressurized Water Reactor Market by Power Output Type
            • 1,000 MWe
            • 1,000 - 1,400 MWe
            • > 1,400 MWe
          • INDIA Pressurized Water Reactor Market by Moderation Type
            • Water
            • Heavy water
          • JAPAN Outlook (USD Billion, 2019-2032)
          • JAPAN Pressurized Water Reactor Market by Reactor Design Type
            • Loop-type PWR
            • Integral PWR
          • JAPAN Pressurized Water Reactor Market by Fuel Type
            • Low enriched uranium
            • Mixed oxide fuel
          • JAPAN Pressurized Water Reactor Market by Power Output Type
            • 1,000 MWe
            • 1,000 - 1,400 MWe
            • > 1,400 MWe
          • JAPAN Pressurized Water Reactor Market by Moderation Type
            • Water
            • Heavy water
          • SOUTH KOREA Outlook (USD Billion, 2019-2032)
          • SOUTH KOREA Pressurized Water Reactor Market by Reactor Design Type
            • Loop-type PWR
            • Integral PWR
          • SOUTH KOREA Pressurized Water Reactor Market by Fuel Type
            • Low enriched uranium
            • Mixed oxide fuel
          • SOUTH KOREA Pressurized Water Reactor Market by Power Output Type
            • 1,000 MWe
            • 1,000 - 1,400 MWe
            • > 1,400 MWe
          • SOUTH KOREA Pressurized Water Reactor Market by Moderation Type
            • Water
            • Heavy water
          • MALAYSIA Outlook (USD Billion, 2019-2032)
          • MALAYSIA Pressurized Water Reactor Market by Reactor Design Type
            • Loop-type PWR
            • Integral PWR
          • MALAYSIA Pressurized Water Reactor Market by Fuel Type
            • Low enriched uranium
            • Mixed oxide fuel
          • MALAYSIA Pressurized Water Reactor Market by Power Output Type
            • 1,000 MWe
            • 1,000 - 1,400 MWe
            • > 1,400 MWe
          • MALAYSIA Pressurized Water Reactor Market by Moderation Type
            • Water
            • Heavy water
          • THAILAND Outlook (USD Billion, 2019-2032)
          • THAILAND Pressurized Water Reactor Market by Reactor Design Type
            • Loop-type PWR
            • Integral PWR
          • THAILAND Pressurized Water Reactor Market by Fuel Type
            • Low enriched uranium
            • Mixed oxide fuel
          • THAILAND Pressurized Water Reactor Market by Power Output Type
            • 1,000 MWe
            • 1,000 - 1,400 MWe
            • > 1,400 MWe
          • THAILAND Pressurized Water Reactor Market by Moderation Type
            • Water
            • Heavy water
          • INDONESIA Outlook (USD Billion, 2019-2032)
          • INDONESIA Pressurized Water Reactor Market by Reactor Design Type
            • Loop-type PWR
            • Integral PWR
          • INDONESIA Pressurized Water Reactor Market by Fuel Type
            • Low enriched uranium
            • Mixed oxide fuel
          • INDONESIA Pressurized Water Reactor Market by Power Output Type
            • 1,000 MWe
            • 1,000 - 1,400 MWe
            • > 1,400 MWe
          • INDONESIA Pressurized Water Reactor Market by Moderation Type
            • Water
            • Heavy water
          • REST OF APAC Outlook (USD Billion, 2019-2032)
          • REST OF APAC Pressurized Water Reactor Market by Reactor Design Type
            • Loop-type PWR
            • Integral PWR
          • REST OF APAC Pressurized Water Reactor Market by Fuel Type
            • Low enriched uranium
            • Mixed oxide fuel
          • REST OF APAC Pressurized Water Reactor Market by Power Output Type
            • 1,000 MWe
            • 1,000 - 1,400 MWe
            • > 1,400 MWe
          • REST OF APAC Pressurized Water Reactor Market by Moderation Type
            • Water
            • Heavy water
          • South America Outlook (USD Billion, 2019-2032)
            • South America Pressurized Water Reactor Market by Reactor Design Type
              • Loop-type PWR
              • Integral PWR
            • South America Pressurized Water Reactor Market by Fuel Type
              • Low enriched uranium
              • Mixed oxide fuel
            • South America Pressurized Water Reactor Market by Power Output Type
              • 1,000 MWe
              • 1,000 - 1,400 MWe
              • > 1,400 MWe
            • South America Pressurized Water Reactor Market by Moderation Type
              • Water
              • Heavy water
            • South America Pressurized Water Reactor Market by Regional Type
              • Brazil
              • Mexico
              • Argentina
              • Rest of South America
            • BRAZIL Outlook (USD Billion, 2019-2032)
            • BRAZIL Pressurized Water Reactor Market by Reactor Design Type
              • Loop-type PWR
              • Integral PWR
            • BRAZIL Pressurized Water Reactor Market by Fuel Type
              • Low enriched uranium
              • Mixed oxide fuel
            • BRAZIL Pressurized Water Reactor Market by Power Output Type
              • 1,000 MWe
              • 1,000 - 1,400 MWe
              • > 1,400 MWe
            • BRAZIL Pressurized Water Reactor Market by Moderation Type
              • Water
              • Heavy water
            • MEXICO Outlook (USD Billion, 2019-2032)
            • MEXICO Pressurized Water Reactor Market by Reactor Design Type
              • Loop-type PWR
              • Integral PWR
            • MEXICO Pressurized Water Reactor Market by Fuel Type
              • Low enriched uranium
              • Mixed oxide fuel
            • MEXICO Pressurized Water Reactor Market by Power Output Type
              • 1,000 MWe
              • 1,000 - 1,400 MWe
              • > 1,400 MWe
            • MEXICO Pressurized Water Reactor Market by Moderation Type
              • Water
              • Heavy water
            • ARGENTINA Outlook (USD Billion, 2019-2032)
            • ARGENTINA Pressurized Water Reactor Market by Reactor Design Type
              • Loop-type PWR
              • Integral PWR
            • ARGENTINA Pressurized Water Reactor Market by Fuel Type
              • Low enriched uranium
              • Mixed oxide fuel
            • ARGENTINA Pressurized Water Reactor Market by Power Output Type
              • 1,000 MWe
              • 1,000 - 1,400 MWe
              • > 1,400 MWe
            • ARGENTINA Pressurized Water Reactor Market by Moderation Type
              • Water
              • Heavy water
            • REST OF SOUTH AMERICA Outlook (USD Billion, 2019-2032)
            • REST OF SOUTH AMERICA Pressurized Water Reactor Market by Reactor Design Type
              • Loop-type PWR
              • Integral PWR
            • REST OF SOUTH AMERICA Pressurized Water Reactor Market by Fuel Type
              • Low enriched uranium
              • Mixed oxide fuel
            • REST OF SOUTH AMERICA Pressurized Water Reactor Market by Power Output Type
              • 1,000 MWe
              • 1,000 - 1,400 MWe
              • > 1,400 MWe
            • REST OF SOUTH AMERICA Pressurized Water Reactor Market by Moderation Type
              • Water
              • Heavy water
            • MEA Outlook (USD Billion, 2019-2032)
              • MEA Pressurized Water Reactor Market by Reactor Design Type
                • Loop-type PWR
                • Integral PWR
              • MEA Pressurized Water Reactor Market by Fuel Type
                • Low enriched uranium
                • Mixed oxide fuel
              • MEA Pressurized Water Reactor Market by Power Output Type
                • 1,000 MWe
                • 1,000 - 1,400 MWe
                • > 1,400 MWe
              • MEA Pressurized Water Reactor Market by Moderation Type
                • Water
                • Heavy water
              • MEA Pressurized Water Reactor Market by Regional Type
                • GCC Countries
                • South Africa
                • Rest of MEA
              • GCC COUNTRIES Outlook (USD Billion, 2019-2032)
              • GCC COUNTRIES Pressurized Water Reactor Market by Reactor Design Type
                • Loop-type PWR
                • Integral PWR
              • GCC COUNTRIES Pressurized Water Reactor Market by Fuel Type
                • Low enriched uranium
                • Mixed oxide fuel
              • GCC COUNTRIES Pressurized Water Reactor Market by Power Output Type
                • 1,000 MWe
                • 1,000 - 1,400 MWe
                • > 1,400 MWe
              • GCC COUNTRIES Pressurized Water Reactor Market by Moderation Type
                • Water
                • Heavy water
              • SOUTH AFRICA Outlook (USD Billion, 2019-2032)
              • SOUTH AFRICA Pressurized Water Reactor Market by Reactor Design Type
                • Loop-type PWR
                • Integral PWR
              • SOUTH AFRICA Pressurized Water Reactor Market by Fuel Type
                • Low enriched uranium
                • Mixed oxide fuel
              • SOUTH AFRICA Pressurized Water Reactor Market by Power Output Type
                • 1,000 MWe
                • 1,000 - 1,400 MWe
                • > 1,400 MWe
              • SOUTH AFRICA Pressurized Water Reactor Market by Moderation Type
                • Water
                • Heavy water
              • REST OF MEA Outlook (USD Billion, 2019-2032)
              • REST OF MEA Pressurized Water Reactor Market by Reactor Design Type
                • Loop-type PWR
                • Integral PWR
              • REST OF MEA Pressurized Water Reactor Market by Fuel Type
                • Low enriched uranium
                • Mixed oxide fuel
              • REST OF MEA Pressurized Water Reactor Market by Power Output Type
                • 1,000 MWe
                • 1,000 - 1,400 MWe
                • > 1,400 MWe
              • REST OF MEA Pressurized Water Reactor Market by Moderation Type
                • Water
                • Heavy water
    Report Infographic
    Free Sample Request

    Kindly complete the form below to receive a free sample of this Report

    Customer Strories

    “I am very pleased with how market segments have been defined in a relevant way for my purposes (such as "Portable Freezers & refrigerators" and "last-mile"). In general the report is well structured. Thanks very much for your efforts.”

    Victoria Milne Founder
    Case Study

    Chemicals and Materials