• Cat-intel
  • MedIntelliX
  • Resources
  • About Us
  • Request Free Sample ×

    Kindly complete the form below to receive a free sample of this Report

    Leading companies partner with us for data-driven Insights

    clients tt-cursor

    Pre-engineered Buildings Market

    ID: MRFR/CO/0796-CR
    100 Pages
    Harshita Gorade
    August 2019

    Pre-engineered Buildings Market Research Report Information, By Technology (Steel, Aluminum, and Others), By Product (Walls, Columns & Beams, Roof & Floors, and Others), By (Residential, Commercial, and Industrial), And, By Region (North America, Europe, Asia-Pacific, And Rest of the World) – Market Forecast Till 2030.

    Share:
    Download PDF ×

    We do not share your information with anyone. However, we may send you emails based on your report interest from time to time. You may contact us at any time to opt-out.

    Pre-Engineered Buildings Market Research Report - Global Forecast 2030 Infographic
    Purchase Options
    $ 4,950.0
    $ 5,950.0
    $ 7,250.0
    Table of Contents

    Pre-engineered Buildings Market Summary

    As per Market Research Future Analysis, the global pre-engineered buildings market was valued at USD 10,597.9 million in 2021 and is projected to reach USD 30,019.93 million by 2030, growing at a CAGR of 13.90% from 2024 to 2030. The market is driven by rising demands for warehousing and advancements in off-site construction technologies. Pre-engineered buildings offer advantages such as reduced construction time, lower costs, and improved durability, making them increasingly popular in the construction industry. The Asia-Pacific region accounted for USD 4,217.96 million in 2021, with a projected CAGR of 39.80%, driven by the growing real estate sector and favorable government policies in countries like China and India.

    Key Market Trends & Highlights

    Key trends driving the pre-engineered buildings market include technological advancements and increasing demand for sustainable construction.

    • Market size in 2021: USD 10,597.9 million; projected to reach USD 30,019.93 million by 2030.
    • CAGR from 2024 to 2030: 13.90%; Asia-Pacific market expected to grow at 39.80% CAGR.
    • Steel segment held the majority share in 2021, driven by benefits like increased building speed and durability.
    • Roof & floors segment contributed significantly to market value, essential for structural integrity and design flexibility.

    Market Size & Forecast

    2021 Market Size USD 10,597.9 million
    2022 Market Size USD 12,071.01 million
    2030 Market Size USD 30,019.93 million
    CAGR (2024-2030) 13.90%

    Major Players

    Key players include Bluescope, Zamil Steel Holding Company, Kirby Building Systems, Nucor Corporation, and Everest Industries.

    Pre-engineered Buildings Market Trends

    Growing demands for warehousing to boost pre-engineered buildings market growth

    The pre-engineered buildings industry is expanding due to rising industrialization worldwide and increased awareness of advanced off-site construction methods and technology. As e-commerce and logistics stores have increased in the retail sector, there has been a surge in demand for industrial storage facilities and warehouses. Pre-engineered buildings, which are more affordable and durable than conventionally built structures, are now more necessary. A longer building material life cycle, limitless design freedom, and lower material and labor costs are some of the significant performance advantages of pre-engineered building systems. The market has grown due to the advent of pre-engineered green buildings.

    These eco-friendly buildings are low-carbon, energy-efficient options that require less during and after construction.

    Additionally, Pre-engineered structures and technology advancements have significantly improved the quality of life. Compared to masonry, pre-engineered buildings construction takes 30 to 40% less time. A tropical nation like India will benefit greatly from PEB buildings' effective insulation. For construction in remote and incline locations, pre-engineered buildings are a great option. Pre-engineered structures make up more than 60% of non-residential low-rise buildings in the United States, according to a recent study by the Metal Building Associations (MBA). Therefore, such a surge in the demands for warehousing and technological advancement has enhanced the pre-engineered buildings market CAGR ly in recent years.

    Furthermore, Pre-engineered buildings market revenue is anticipated to be constrained over the projected period by increased corrosion risk and decreased thermal and fire resistance. A major barrier to adopting pre-engineered buildings in nations like India is the country's persistent reliance on conventional construction techniques. But over the projected period, demand for these goods is anticipated to increase dramatically as more people become aware of the advantages of pre-engineered buildings.

    The Global Pre-engineered Buildings Market is poised for growth as industries increasingly seek sustainable and cost-effective construction solutions, reflecting a broader trend towards efficiency and innovation in building practices.

    U.S. Department of Energy

    Pre-engineered Buildings Market Drivers

    Market Growth Projections

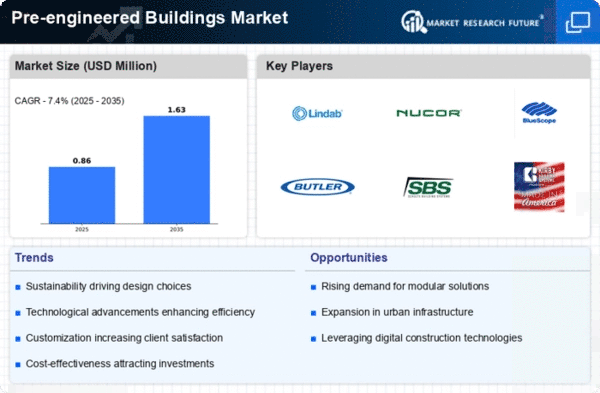
    The Global Pre-engineered Buildings Market Industry is projected to experience robust growth in the coming years. With a market valuation of 15.1 USD Billion in 2024, the industry is anticipated to reach 57.5 USD Billion by 2035. This growth trajectory reflects a compound annual growth rate of 12.96% from 2025 to 2035, indicating strong demand across various sectors. Factors contributing to this expansion include increasing urbanization, technological advancements, and the growing emphasis on sustainable construction practices. The market's potential is underscored by its ability to adapt to evolving industry needs and consumer preferences.

    Cost Efficiency and Time Savings

    Cost efficiency remains a pivotal driver in the Global Pre-engineered Buildings Market Industry. Pre-engineered buildings typically require fewer materials and less labor compared to traditional construction methods, resulting in significant cost savings. Furthermore, the expedited construction timelines associated with these structures enable developers to capitalize on market opportunities more swiftly. This efficiency is particularly appealing in sectors such as commercial real estate, where time-to-market can significantly impact profitability. As a result, the market is poised for substantial growth, with projections indicating a valuation of 15.1 USD Billion in 2024, driven by these economic advantages.

    Diverse Applications Across Industries

    The versatility of pre-engineered buildings is a key driver in the Global Pre-engineered Buildings Market Industry. These structures find applications across various sectors, including agriculture, manufacturing, and retail. For example, agricultural facilities benefit from customizable designs that cater to specific operational needs, while retail spaces leverage the aesthetic flexibility of pre-engineered solutions. This adaptability not only meets diverse client requirements but also enhances market penetration. As industries continue to recognize the benefits of pre-engineered buildings, the market is expected to expand significantly, potentially reaching 57.5 USD Billion by 2035.

    Technological Advancements in Construction

    Technological innovations are reshaping the Global Pre-engineered Buildings Market Industry, enhancing design and construction processes. Advanced software tools and Building Information Modeling (BIM) facilitate precise planning and execution, reducing errors and construction time. Additionally, the integration of smart technologies into pre-engineered buildings allows for improved energy management and occupant comfort. As these technologies evolve, they are likely to attract more investors and developers, further expanding the market. The anticipated compound annual growth rate of 12.96% from 2025 to 2035 underscores the potential for growth driven by technological advancements.

    Growing Demand for Sustainable Construction

    The Global Pre-engineered Buildings Market Industry experiences a surge in demand for sustainable construction solutions. As environmental concerns escalate, builders and developers increasingly favor pre-engineered buildings due to their energy efficiency and reduced waste. For instance, these structures often utilize recyclable materials and can be designed to incorporate renewable energy sources. This trend aligns with global initiatives aimed at reducing carbon footprints, potentially leading to a market valuation of 15.1 USD Billion in 2024. The emphasis on sustainability is likely to drive innovation and adoption in the pre-engineered sector, contributing to a projected growth trajectory.

    Rapid Urbanization and Infrastructure Development

    Urbanization continues to accelerate globally, resulting in heightened infrastructure development needs. The Global Pre-engineered Buildings Market Industry benefits from this trend as pre-engineered solutions offer quick assembly and cost-effectiveness, making them ideal for urban settings. Countries experiencing rapid population growth, such as India and Nigeria, are increasingly adopting these structures for residential and commercial purposes. This demand is expected to propel the market to an estimated 57.5 USD Billion by 2035. The ability to meet urgent housing and infrastructure needs efficiently positions pre-engineered buildings as a viable solution in urban planning.

    Market Segment Insights

    Pre-engineered Buildings Material Insights

    The pre-engineered buildings market segmentation based on material includes steel, aluminum, and others. The steel segment held the majority share in 2021, contributing to the pre-engineered buildings market revenue. Prefabricating steel for construction has several advantages, including a 50% increase in building speed, a high level of quality control, and less waste. Steel is a material that can be fabricated in a factory, making it ideal for roof additions and other building improvements.

    Additionally, qualities like resistance to inclement weather, moisture, termites, and fire, which offer durability, safety, and low-cost maintenance, also fuel demand for steel as a material in the worldwide pre-engineered construction industry.

    Aluminum is the second fastest-growing segment, which accounts for a considerable share of the pre-engineered buildings market. Using a pre-engineered metal building kit has several advantages depending on the size and scope of the aluminum manufacturing enterprise. Both a big, sprawling, multi-layered complicated building or a small, single-layer facility is possible. A metal building kit can satisfy all of their requirements.

    February 2022: The market leader in construction technology, Trimble, recently revealed that Zamil Steel, a renowned engineer, and producer of numerous high-quality steel products, has chosen its software, including Tekla PowerFab, to revolutionize steel fabrication in its factories in Vietnam, Saudi Arabia, and other Middle Eastern countries.

    September 2020: A strategic alliance between Metal Building Software and Tekla Structures, the company's flagship product and a pioneer in construction technology, has been announced by Trimble (MBS). A full Building Information Modeling (BIM) procedure is delivered for all metal buildings under the terms of this collaboration, which was created by the two businesses.

    Pre-engineered Buildings Product Insights

    The pre-engineered buildings market segmentation based on product, includes walls, columns & beams, roof & floors, and others. The roof & floors segment held the majority share in 2021, contributing to the pre-engineered buildings market data. Regarding value, flooring and roofs are important components of pre-engineered structures worldwide. The building's roof serves as its top covering and is exposed to the most solar radiation. It must be safe and stable to carry the burden that human activity has placed on it. Roofs also need to be insulated from sound and heat.

    Additionally, floors are essential components for both architectural flexibility and design. The floors' load-bearing capacity directly impacts a PEB's partition walls and other structural components.

    Walls is the second fastest-growing segment, which accounts for a considerable share of the pre-engineered buildings market. Structures made of pre-engineered components are adaptable. For a civilized finish, they can be customized with various fascia types, canopies, glass partitions, etc., creating a structure with an exquisite appearance. Precast concrete wall panels, curtain walls, block walls, and other wall systems can be installed on other structural elements like curving eaves.

    Get more detailed insights about Pre-Engineered Buildings Market Research Report - Global Forecast 2030

    Regional Insights

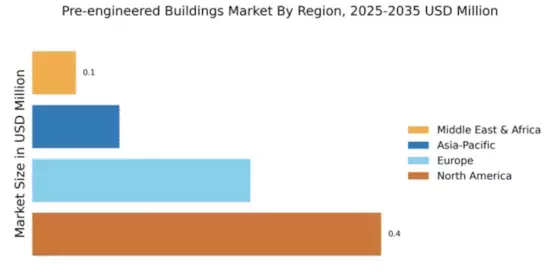
    By Region, the study provides market insights into North America, Europe, Asia-Pacific and Rest of the World. Asia Pacific pre-engineered buildings market accounted for USD 4217.9642 million in 2021 and is expected to exhibit a 39.80% CAGR growth during the study period. This is attributed to the growing real estate industry for pre-engineered buildings and the growing corporate atmosphere across the region.

    During the anticipated time, China pre-engineered buildings market would likewise present a lucrative opportunity for international market players. Due to favorable government policies encouraging investments in the manufacturing sector, the nation is anticipated to see an increase in industrial buildings over the projection period. Additionally, the relocation of production facilities by various businesses, including BMW and Volkswagen, will probably increase demand for industrial building construction, which will help the industry expand.

    Further, the major countries studied in the market report are: The U.S, Canada, Germany, France, UK, Italy, Spain, China, Japan, India, Australia, South Korea, and Brazil.

    Figure 3: PRE-ENGINEERED BUILDINGSMARKET SHARE BY REGION 2021 (%)PRE-ENGINEERED BUILDINGSMARKET SHARE BY REGION 2021 Source: Secondary Research, Primary Research, Market Research Future Database and Analyst Review

    North America pre-engineered buildings market held the second-largest share during the projected period, it is expected to grow sustainably. It is anticipated that real estate and commercial sector repair and refurbishment projects will increase demand for pre-engineered buildings in the area. By the year 2025, 1,018 affordable homes would be built, according to the National Housing Development Corporation Limited (NHDCL) of Bhutan. It would take until the end of 2025 to complete 1,018 (123 buildings) affordable rental housing units, disappointing locals who had hoped for more inexpensive homes sooner.

    Multinational companies can compete for construction contracts in Phuentsholing and Samtse while local businesses supply the necessary knowledge and manpower thanks to contemporary pre-engineered buildings technology. Additionally, the US pre-engineered buildings market was the dominant region and Canada pre-engineered buildings market is the fastest growing market in the North American region.

    Middle Eastern nations are pursuing economic diversification to lessen their reliance on the oil and gas sector. They are developing long-term plans for sustainable economic growth and implementing the pre-engineered buildings idea in the construction sector. Furthermore, the MEA pre-engineered buildings market is predicted to benefit from the tourist sector's strong expansion.

    Key Players and Competitive Insights

    Major market players are investing a lot of capitals on R&D to enhance their product lines, which will aid the Pre-engineered Buildings market expand. Market players are also taking a range of strategic measures to expand their worldwide footprint, with prime market developments such as new product innovations & launches, contracts & agreements, mergers and acquisitions, better investments, and collaboration & strategic partnerships with other organizations in the Pre-engineered Buildings market. Competitors in the pre-engineered buildings industry must offer cost-effective items to extend and survive in an increasingly high competitive and expanding market environment.

    One of the primary business strategies manufacturers adopt in the Pre-engineered Buildings industry to benefit clients and expand the market sector is manufacturing locally to reduce operating costs. In recent years, pre-engineered buildings industry has provided medicine with some of the most significant benefits. The pre-engineered buildings market major player such as Bluescope, Zamil Steel Holding Company, Kirby Building Systems, Nucor Corporation, Everest Industries, and others are working to drive the market growth via investing heavily in research and development activities.

    Nucor Corporation has over three decades of experience designing and producing specialized metal building systems. The business effectively serves clients across North America and beyond with four strategically placed factory locations and a coast-to-coast network of more than 1,200 Authorized Builders. In December 2022, The recently established Nucor Towers & Structures business unit will be expanded by the construction of two brand-new, cutting-edge tower production facilities, according to Nucor Corporation. The Midwest and the Southeast are two regions that Nucor is looking at.

    Also, Zamil Steel Holding Company is a pre-engineered buildings company. Zamil Steel is among the biggest producers and suppliers of pre-engineered buildings in Asia and Africa, with an annual manufacturing capacity of more than 6,000,000 m 2. In November 2021, Since the company's founding in 1999, one million metric tonnes of steel goods have been produced in its plants in Cairo's 6th of October City and Sadat City, according to an announcement from Zamil Steel Buildings Egypt.

    Key Companies in the Pre-engineered Buildings Market market include

    Industry Developments

    • Q2 2024: Tata BlueScope Steel inaugurates new pre-engineered building manufacturing facility in Gujarat Tata BlueScope Steel opened a new state-of-the-art manufacturing plant in Gujarat, India, to expand its capacity for pre-engineered building solutions and meet rising demand in the region.
    • Q1 2024: Butler Manufacturing announces strategic partnership with Canadian construction firm EllisDon Butler Manufacturing entered a partnership with EllisDon to jointly deliver large-scale pre-engineered building projects across North America, aiming to accelerate project timelines and improve cost efficiency.
    • Q2 2024: Lindab acquires Danish pre-engineered building specialist Profilbyg Lindab Group completed the acquisition of Profilbyg, a Denmark-based manufacturer of pre-engineered steel buildings, strengthening its position in the Nordic construction market.
    • Q3 2024: Kingspan Group launches new energy-efficient pre-engineered building product line Kingspan Group unveiled a new range of pre-engineered buildings featuring advanced insulation and energy-saving technologies, targeting commercial and industrial clients seeking sustainable solutions.
    • Q2 2024: PEB Steel secures $50 million contract for logistics park development in Vietnam PEB Steel Buildings Co. won a major contract to design and construct pre-engineered warehouses for a new logistics park in Ho Chi Minh City, marking one of the largest deals in the region this year.
    • Q1 2025: BlueScope Steel appoints new CEO to lead global pre-engineered buildings expansion BlueScope Steel named Jane Smith as its new CEO, tasking her with driving international growth in the pre-engineered buildings sector and overseeing new market entries in Southeast Asia.
    • Q2 2025: Zamil Steel signs joint venture agreement with Saudi construction giant Al Bawani Zamil Steel entered a joint venture with Al Bawani to deliver large-scale pre-engineered building projects for industrial and commercial developments in Saudi Arabia.
    • Q1 2024: Nucor launches new modular pre-engineered building system for U.S. market Nucor Corporation introduced a modular pre-engineered building system designed for rapid deployment in commercial and industrial applications, aiming to reduce construction time and costs.
    • Q3 2024: Kirby Building Systems opens new manufacturing facility in Egypt Kirby Building Systems inaugurated a new plant in Egypt to serve growing demand for pre-engineered buildings in North Africa and the Middle East.
    • Q2 2025: Interarch secures government contract for pre-engineered school buildings in India Interarch Building Products was awarded a government contract to supply and construct pre-engineered school buildings across several states in India, supporting rapid infrastructure development.
    • Q1 2025: PEB Steel announces $30 million investment in new R&D center for advanced building technologies PEB Steel revealed plans to invest $30 million in a research and development center focused on innovative materials and design for pre-engineered buildings.
    • Q2 2024: Butler Manufacturing wins contract for Amazon distribution center in Texas Butler Manufacturing secured a contract to design and construct a large pre-engineered distribution center for Amazon in Texas, highlighting the sector's role in e-commerce infrastructure.

    Future Outlook

    Pre-engineered Buildings Market Future Outlook

    The Global Pre-engineered Buildings Market is projected to grow at a 12.96% CAGR from 2024 to 2035, driven by increasing demand for sustainable construction and rapid urbanization.

    New opportunities lie in:

    • Invest in advanced manufacturing technologies to enhance customization and reduce lead times.
    • Develop eco-friendly materials to meet rising sustainability standards in construction.
    • Expand into emerging markets with tailored solutions for local building regulations.

    By 2035, the market is expected to achieve substantial growth, positioning itself as a leader in innovative construction solutions.

    Market Segmentation

    Pre-engineered Buildings Product Outlook

    • Walls
    • Columns & Beams
    • Roof & Floors
    • Others

    Pre-engineered Buildings Material Outlook

    • Steel
    • Aluminum
    • Others

    Pre-engineered Buildings Regional Outlook

    North America
    • US
    • Canada

    Pre-engineered Buildings Application Outlook

    • Residential
    • Commercial
    • Industrial

    Report Scope

    Attribute/Metric Details
    Market Size 2021 USD 10597.9 million
    Market Size 2022 USD 12071.0081 million
    Market Size 2030 USD 30019.92548 million
    Compound Annual Growth Rate (CAGR) 13.90 % (2024-2030)
    Base Year 2021
    Market Forecast Period 2024-2030
    Historical Data 2018 & 2020
    Market Forecast Units Value (USD million)
    Report Coverage Revenue Forecast, Market Competitive Landscape, Growth Factors, and Trends
    Segments Covered Material, Product, and Application
    Geographies Covered North America, Europe, Asia Pacific, and Rest of the World
    Countries Covered The U.S, Canada, Germany, France, UK, Italy, Spain, China, Japan, India, Australia, South Korea, and Brazil
    Key Companies Profiled Bluescope, Zamil Steel Holding Company, Kirby Building Systems, Nucor Corporation, Everest Industries, NCI Building Systems, PEB Steel, PEBS Pennar, Lindab Group, and ATCO
    Key Market Opportunities Increase in demand from construction industry for Pre-engineered Buildings
    Key Market Dynamics Rising inclination towards off-site construction techniques Increasing demands for commercial buildings

    Market Highlights

    Author
    Harshita Gorade
    Research Analyst

    Harshita Post graduate MBA in Business Administration from Welingkar Institute, Mumbai and 5 years of experience in the field of product market research. As a Research Analyst, I have cross-domain experience in packaging, and industrial Automation & Equipment. I am currently looking after the research process of packaging, logistics & transportation, and industrial automation & equipment at Market Research Future Reports. My responsibilities at the organization involve handling syndicate and custom reports as well as responding to client inquiries, and organize, co-ordinate with a group of 5 to 6 persons to manage all workflows.

    Leave a Comment

    FAQs

    How much is the pre-engineered buildings market?

    The Pre-engineered buildings market size was valued at USD 10597.9 Million in 2021.

    What is the growth rate of the Pre-engineered Buildings market?

    The market is projected to grow at a CAGR of 13.90% during the forecast period, 2024-2030.

    Which region held the largest market share in the pre-engineered buildings market?

    Asia Pacific had the largest share in the pre-engineered buildings market

    Who are the key players in the pre-engineered buildings market?

    The key players in the market are Bluescope, Zamil Steel Holding Company, Kirby Building Systems, and Nucor Corporation.

    Which product led the pre-engineered buildings market?

    The roof & floors category dominated the pre-engineered buildings market in 2021.

    Which material led the pre-engineered buildings market?

    The steel category dominated the pre-engineered buildings market in 2021.

    1. '1 Executive Summary
    2. Scope of the Report
      1. Market Definition
      2. Scope of the Study
        1. Definition
        2. Research Objective
        3. Assumptions
        4. Limitations
      3. Research Process
    3. Primary Research
      1. Secondary Research
      2. Market Size Estimation
      3. Forecast Model
    4. Market Landscape
      1. Porter’s Five Forces
    5. Analysis
      1. Threat of New Entrants
        1. Bargaining Power of Buyers
        2. Threat of Substitutes
        3. Segment Rivalry
        4. Bargaining Power
    6. of Buyers
      1. Value Chain/Supply Chain Analysis
    7. Market Dynamics
    8. Introduction
      1. Market Drivers
      2. Market Restraints
      3. Market
    9. Opportunities
    10. Global Pre-Engineered Buildings Market, by Material
    11. Introduction
      1. Steel
        1. Market Estimates & Forecast, 2022-2030
        2. Market Estimates & Forecast, by Region, 2022-2030
      2. Aluminium
        1. Market Estimates & Forecast, 2022-2030
        2. Market Estimates &
    12. Forecast, by Region, 2022-2030
      1. Others
        1. Market Estimates &
    13. Forecast, 2022-2030
      1. Market Estimates & Forecast, by Region, 2022-2030
    14. Global Pre-Engineered Buildings Market, by Product
      1. Introduction
      2. Walls
        1. Market Estimates & Forecast, 2022-2030
        2. Market
    15. Estimates & Forecast, by Region, 2022-2030
      1. Columns & Beams
    16. Market Estimates & Forecast, 2022-2030
      1. Market Estimates & Forecast,
    17. by Region, 2022-2030
      1. Roof & Floors
        1. Market Estimates &
    18. Forecast, 2022-2030
      1. Market Estimates & Forecast, by Region, 2022-2030
      2. Others
        1. Market Estimates & Forecast, 2022-2030
        2. Market
    19. Estimates & Forecast, by Region, 2022-2030
    20. Global Pre-Engineered Buildings
    21. Market, by End-Use Industry
      1. Introduction
      2. Residential
    22. Market Estimates & Forecast, 2022-2030
      1. Market Estimates & Forecast,
    23. by Region, 2022-2030
      1. Commercial
        1. Market Estimates & Forecast,
        2. Market Estimates & Forecast, by Region, 2022-2030
    24. Industrial
      1. Market Estimates & Forecast, 2022-2030
        1. Market
    25. Estimates & Forecast, by Region, 2022-2030
    26. Global Pre-Engineered Buildings
    27. Market, by Region
      1. Introduction
      2. North America
        1. Market
    28. Estimates & Forecast, 2022-2030
      1. Market Estimates & Forecast,
    29. by Material, 2022-2030
      1. Market Estimates & Forecast, by Product, 2022-2030
        1. Market Estimates & Forecast, by End-Use Industry, 2022-2030
    30. US
      1. Market Estimates & Forecast, 2022-2030
        1. Market Estimates
    31. & Forecast, by Material, 2022-2030
      1. Market Estimates & Forecast,
    32. by Product, 2022-2030
      1. Market Estimates & Forecast, by End-Use Industry,
        1. Canada
    33. Estimates & Forecast, by Product, 2022-2030
      1. Market Estimates &
    34. Forecast, by End-Use Industry, 2022-2030
      1. Mexico
        1. Market Estimates
    35. & Forecast, 2022-2030
      1. Market Estimates & Forecast, by Material,
        1. Market Estimates & Forecast, by Product, 2022-2030
    36. Europe
      1. Market Estimates & Forecast, 2022-2030
        1. Market Estimates
    37. & Forecast, by Material, 2022-2030
      1. Market Estimates & Forecast,
    38. by Product, 2022-2030
      1. Market Estimates & Forecast, by End-Use Industry,
        1. UK
    39. Estimates & Forecast, by Product, 2022-2030
      1. Market Estimates &
    40. Forecast, by End-Use Industry, 2022-2030
      1. Germany
        1. Market
    41. Estimates & Forecast, 2022-2030
      1. Market Estimates & Forecast,
    42. by Material, 2022-2030
      1. Market Estimates & Forecast, by Product,
        1. Market Estimates & Forecast, by End-Use Industry, 2022-2030
        2. France
    43. Market Estimates & Forecast, by Material, 2022-2030
      1. Market Estimates
    44. & Forecast, by Product, 2022-2030
      1. Market Estimates & Forecast,
    45. by End-Use Industry, 2022-2030
      1. Italy
        1. Market Estimates &
    46. Forecast, 2022-2030
      1. Market Estimates & Forecast, by Material, 2022-2030
        1. Market Estimates & Forecast, by Product, 2022-2030
    47. Estimates & Forecast, by End-Use Industry, 2022-2030
      1. Rest of Europe
        1. Market Estimates & Forecast, 2022-2030
    48. & Forecast, by Material, 2022-2030
      1. Market Estimates & Forecast,
    49. by Product, 2022-2030
      1. Market Estimates & Forecast, by End-Use Industry,
      2. Asia-Pacific
        1. Market Estimates & Forecast, 2022-2030
        2. Market Estimates & Forecast, by Material, 2022-2030
        3. Market
    50. Estimates & Forecast, by Product, 2022-2030
      1. Market Estimates &
    51. Forecast, by End-Use Industry, 2022-2030
      1. China
        1. Market Estimates
    52. & Forecast, 2022-2030
      1. Market Estimates & Forecast, by Material,
        1. Market Estimates & Forecast, by Product, 2022-2030
    53. Japan
      1. Market Estimates & Forecast, 2022-2030
        1. Market
    54. Estimates & Forecast, by Material, 2022-2030
      1. Market Estimates &
    55. Forecast, by Product, 2022-2030
      1. Market Estimates & Forecast, by
    56. End-Use Industry, 2022-2030
      1. India
        1. Market Estimates &
    57. Forecast, 2022-2030
      1. Market Estimates & Forecast, by Material, 2022-2030
        1. Market Estimates & Forecast, by Product, 2022-2030
    58. Estimates & Forecast, by End-Use Industry, 2022-2030
      1. Rest of Asia-Pacific
        1. Market Estimates & Forecast, 2022-2030
    59. & Forecast, by Material, 2022-2030
      1. Market Estimates & Forecast,
    60. by Product, 2022-2030
      1. Market Estimates & Forecast, by End-Use Industry,
      2. Rest of the World (RoW)
        1. Market Estimates & Forecast,
        2. Market Estimates & Forecast, by Material, 2022-2030
        3. Market Estimates & Forecast, by Product, 2022-2030
        4. Market
    61. Estimates & Forecast, by End-Use Industry, 2022-2030
      1. South America
        1. Market Estimates & Forecast, 2022-2030
    62. & Forecast, by Material, 2022-2030
      1. Market Estimates & Forecast,
    63. by Product, 2022-2030
      1. Market Estimates & Forecast, by End-Use Industry,
        1. Middle East & Africa
    64. Forecast, 2022-2030
      1. Market Estimates & Forecast, by Material, 2022-2030
        1. Market Estimates & Forecast, by Product, 2022-2030
    65. Estimates & Forecast, by End-Use Industry, 2022-2030
    66. Competitive Landscape
    67. Company Profile
      1. Bluescope
        1. Company Overview
    68. Products/Services Offered
      1. Financial Overview
        1. Key Developments
        2. Key Strategies
        3. SWOT Analysis
      2. Zamil Steel Holding
    69. Company
      1. Company Overview
        1. Products/Services Offered
    70. Financial Overview
      1. Key Developments
        1. Key Strategies
    71. SWOT Analysis
      1. Kirby Building Systems
        1. Company Overview
    72. Products/Services Offered
      1. Financial Overview
        1. Key Developments
        2. Key Strategies
        3. SWOT Analysis
      2. Nucor Corporation
        1. Company Overview
        2. Products/Services Offered
        3. Financial
    73. Overview
      1. Key Developments
        1. Key Strategies
        2. SWOT
    74. Analysis
      1. Everest Industries
        1. Company Overview
        2. Products/Services
    75. Offered
      1. Financial Overview
        1. Key Developments
    76. Key Strategies
      1. SWOT Analysis
      2. NCI Building Systems
    77. Company Overview
      1. Products/Services Offered
        1. Financial Overview
        2. Key Developments
        3. Key Strategies
        4. SWOT Analysis
      2. PEB Steel
        1. Company Overview
        2. Products/Services Offered
        3. Financial Overview
        4. Key Developments
        5. Key Strategies
        6. SWOT Analysis
      3. PEBS Pennar
        1. Company Overview
    78. Products/Services Offered
      1. Financial Overview
        1. Key Developments
        2. Key Strategies
        3. SWOT Analysis
      2. Lindab Group
    79. Company Overview
      1. Products/Services Offered
        1. Financial Overview
        2. Key Developments
        3. Key Strategies
        4. SWOT Analysis
      2. ATCO
        1. Company Overview
        2. Products/Services Offered
        3. Financial Overview
        4. Key Developments
        5. Key Strategies
        6. SWOT Analysis
    80. List of Tables
    81. Buildings Market, by Region, 2022-2030
    82. Buildings Market, by Country, 2022-2030
    83. Market, by Country, 2022-2030
    84. Market, by Country, 2022-2030
    85. by Country, 2022-2030
    86. by Region, 2022-2030
    87. by Material, by Country, 2022-2030
    88. Market, by Material, by Country, 2022-2030
    89. Buildings Market by Material, by Country, 2022-2030
    90. Buildings Market by Material, by Country, 2022-2030
    91. Buildings Market, by Product, by Region, 2022-2030
    92. Buildings Market, by Product, by Country, 2022-2030
    93. Buildings Market, by Product, by Country, 2022-2030
    94. Buildings Market by Product, by Country, 2022-2030
    95. Buildings Market by Product, by Country, 2022-2030
    96. Buildings Market, by End-Use Industry, by Region, 2022-2030
    97. Pre-Engineered Buildings Market, by End-Use Industry, by Country, 2022-2030
    98. Europe: Pre-Engineered Buildings Market, by End-Use Industry, by Country, 2022-2030
    99. Country, 2022-2030
    100. Industry, by Country, 2022-2030
    101. by Region, 2022-2030
    102. North America: Pre-Engineered Buildings Market, by Material
    103. Pre-Engineered Buildings Market, by Product
    104. Buildings Market, by End-Use Industry
    105. Market, by Country
    106. Pre-Engineered Buildings Market, by End-Use Industry
    107. Pre-Engineered Buildings Market, by Country
    108. Buildings Market, by Material
    109. Market, by Product
    110. End-Use Industry
    111. Buildings Market, by Product
    112. by End-Use Industry
    113. List of Figures
    114. of MRFR
    115. Restraints
    116. Chain Analysis
    117. (USD Million)
    118. (USD Million)
    119. Industry, 2020 (%)
    120. Industry, 2022-2030 (USD Million)
    121. Market Share (%), by Region, 2020
    122. Market, by Region, 2022-2030 (USD Million)
    123. Buildings Market Share (%), 2020
    124. Market by Country, 2022-2030 (USD Million)
    125. Buildings Market Share (%), 2020
    126. Market, by Country, 2022-2030 (USD Million)
    127. Buildings Market Share (%), 2020
    128. Market, by Country, 2022-2030 (USD Million)
    129. Buildings Market Share (%), 2020
    130. Buildings Market by Country, 2022-2030 (USD Million)'

    Pre-engineered Buildings Market Segmentation

    Pre-engineered Buildings Material Outlook (USD Million, 2018-2030)

    • Steel
    • Aluminum
    • Others

    Pre-engineered Buildings Product Outlook (USD Million, 2018-2030)

    • Walls
    • Columns & Beams
    • Roof & Floors
    • Others

    Pre-engineered Buildings Application Outlook (USD Million, 2018-2030)

    • Residential
    • Commercial
    • Industrial

    Pre-engineered Buildings Regional Outlook (USD Million, 2018-2030)

    • North America Outlook (USD Million, 2018-2030)

      • North America Pre-engineered Buildings by Material
        • Steel
        • Aluminum
        • Others
      • North America Pre-engineered Buildings by Product
        • Walls
        • Columns & Beams
        • Roof & Floors
        • Others
      • North America Pre-engineered Buildings by Application
        • Residential
        • Commercial
        • Industrial
      • US Outlook (USD Million, 2018-2030)

      • US Pre-engineered Buildings by Material
        • Steel
        • Aluminum
        • Others
      • US Pre-engineered Buildings by Product
        • Walls
        • Columns & Beams
        • Roof & Floors
        • Others
      • US Pre-engineered Buildings by Application
        • Residential
        • Commercial
        • Industrial
      • CANADA Outlook (USD Million, 2018-2030)

      • CANADA Pre-engineered Buildings by Material
        • Steel
        • Aluminum
        • Others
      • CANADA Pre-engineered Buildings by Product
        • Walls
        • Columns & Beams
        • Roof & Floors
        • Others
      • CANADA Pre-engineered Buildings by Application
        • Residential
        • Commercial
        • Industrial
    • Europe Outlook (USD Million, 2018-2030)

      • Europe Pre-engineered Buildings by Material
        • Steel
        • Aluminum
        • Others
      • Europe Pre-engineered Buildings by Product
        • Walls
        • Columns & Beams
        • Roof & Floors
        • Others
      • Europe Pre-engineered Buildings by Application
        • Residential
        • Commercial
        • Industrial
      • Germany Outlook (USD Million, 2018-2030)

      • Germany Pre-engineered Buildings by Material
        • Steel
        • Aluminum
        • Others
      • Germany Pre-engineered Buildings by Product
        • Walls
        • Columns & Beams
        • Roof & Floors
        • Others
      • Germany Pre-engineered Buildings by Application
        • Residential
        • Commercial
        • Industrial
      • France Outlook (USD Million, 2018-2030)

      • France Pre-engineered Buildings by Material
        • Steel
        • Aluminum
        • Others
      • France Pre-engineered Buildings by Product
        • Walls
        • Columns & Beams
        • Roof & Floors
        • Others
      • France Pre-engineered Buildings by Application
        • Residential
        • Commercial
        • Industrial
      • UK Outlook (USD Million, 2018-2030)

      • UK Pre-engineered Buildings by Material
        • Steel
        • Aluminum
        • Others
      • UK Pre-engineered Buildings by Product
        • Walls
        • Columns & Beams
        • Roof & Floors
        • Others
      • UK Pre-engineered Buildings by Application
        • Residential
        • Commercial
        • Industrial
      • ITALY Outlook (USD Million, 2018-2030)

      • ITALY Pre-engineered Buildings by Material
        • Steel
        • Aluminum
        • Others
      • ITALY Pre-engineered Buildings by Product
        • Walls
        • Columns & Beams
        • Roof & Floors
        • Others
      • ITALY Pre-engineered Buildings by Application
        • Residential
        • Commercial
        • Industrial

      • SPAIN Outlook (USD Million, 2018-2030)

      • Spain Pre-engineered Buildings by Material
        • Steel
        • Aluminum
        • Others
      • Spain Pre-engineered Buildings by Product
        • Walls
        • Columns & Beams
        • Roof & Floors
        • Others
      • Spain Pre-engineered Buildings by Application
        • Residential
        • Commercial
        • Industrial
      • Rest OF Europe Outlook (USD Million, 2018-2030)

      • Rest OF Europe Pre-engineered Buildings by Material
        • Steel
        • Aluminum
        • Others
      • REST OF EUROPE Pre-engineered Buildings by Product
        • Walls
        • Columns & Beams
        • Roof & Floors
        • Others
      • REST OF EUROPE Pre-engineered Buildings by Application
        • Residential
        • Commercial
        • Industrial
    • Asia-Pacific Outlook (USD Million, 2018-2030)

      • Asia-Pacific Pre-engineered Buildings by Material
        • Steel
        • Aluminum
        • Others
      • Asia-Pacific Pre-engineered Buildings by Product
        • Walls
        • Columns & Beams
        • Roof & Floors
        • Others
      • Asia-Pacific Pre-engineered Buildings by Application
        • Residential
        • Commercial
        • Industrial
      • China Outlook (USD Million, 2018-2030)

      • China Pre-engineered Buildings by Material
        • Steel
        • Aluminum
        • Others
      • China Pre-engineered Buildings by Product
        • Walls
        • Columns & Beams
        • Roof & Floors
        • Others
      • China Pre-engineered Buildings by Application
        • Residential
        • Commercial
        • Industrial
      • Japan Outlook (USD Million, 2018-2030)

      • Japan Pre-engineered Buildings by Material
        • Steel
        • Aluminum
        • Others
      • Japan Pre-engineered Buildings by Product
        • Walls
        • Columns & Beams
        • Roof & Floors
        • Others
      • Japan Pre-engineered Buildings by Application
        • Residential
        • Commercial
        • Industrial
      • India Outlook (USD Million, 2018-2030)

      • India Pre-engineered Buildings by Material
        • Steel
        • Aluminum
        • Others
      • India Pre-engineered Buildings by Product
        • Walls
        • Columns & Beams
        • Roof & Floors
        • Others
      • India Pre-engineered Buildings by Application
        • Residential
        • Commercial
        • Industrial
      • Australia Outlook (USD Million, 2018-2030)

      • Australia Pre-engineered Buildings by Material
        • Steel
        • Aluminum
        • Others
      • Australia Pre-engineered Buildings by Product
        • Walls
        • Columns & Beams
        • Roof & Floors
        • Others
      • Australia Pre-engineered Buildings by Application
        • Residential
        • Commercial
        • Industrial
      • Rest of Asia-Pacific Outlook (USD Million, 2018-2030)

      • Rest of Asia-Pacific Pre-engineered Buildings by Material
        • Steel
        • Aluminum
        • Others
      • Rest of Asia-Pacific Pre-engineered Buildings by Product
        • Walls
        • Columns & Beams
        • Roof & Floors
        • Others
      • Rest of Asia-Pacific Pre-engineered Buildings by Application
        • Residential
        • Commercial
        • Industrial
    • Rest of the World Outlook (USD Million, 2018-2030)

      • Rest of the World Pre-engineered Buildings by Material
        • Steel
        • Aluminum
        • Others
      • Rest of the World Pre-engineered Buildings by Product
        • Walls
        • Columns & Beams
        • Roof & Floors
        • Others
      • Rest of the World Pre-engineered Buildings by Application
        • Residential
        • Commercial
        • Industrial

      • Middle East Outlook (USD Million, 2018-2030)

      • Middle East Pre-engineered Buildings by Material
        • Steel
        • Aluminum
        • Others
      • Middle East Pre-engineered Buildings by Product
        • Walls
        • Columns & Beams
        • Roof & Floors
        • Others
      • Middle East Pre-engineered Buildings by Application
        • Residential
        • Commercial
        • Industrial
      • Africa Outlook (USD Million, 2018-2030)

      • Africa Pre-engineered Buildings by Material
        • Steel
        • Aluminum
        • Others
      • Africa Pre-engineered Buildings by Product
        • Walls
        • Columns & Beams
        • Roof & Floors
        • Others
      • Africa Pre-engineered Buildings by Application
        • Residential
        • Commercial
        • Industrial
      • Latin America Outlook (USD Million, 2018-2030)

      • Latin America Pre-engineered Buildings by Material
        • Steel
        • Aluminum
        • Others
      • Latin America Pre-engineered Buildings by Product
        • Walls
        • Columns & Beams
        • Roof & Floors
        • Others
      • Latin America Pre-engineered Buildings by Application
        • Residential
        • Commercial
        • Industrial
    Pre-Engineered Buildings Market Research Report - Global Forecast 2030 Infographic
    Free Sample Request

    Kindly complete the form below to receive a free sample of this Report

    Customer Strories

    “I am very pleased with how market segments have been defined in a relevant way for my purposes (such as "Portable Freezers & refrigerators" and "last-mile"). In general the report is well structured. Thanks very much for your efforts.”

    Victoria Milne Founder
    Case Study

    Chemicals and Materials