Focus on Regulatory Compliance
The Portable Spectrometer Market is significantly influenced by the growing emphasis on regulatory compliance across various sectors. Industries such as food and beverage, pharmaceuticals, and environmental monitoring are subject to stringent regulations that necessitate accurate and timely testing of products. Portable spectrometers provide a practical solution for ensuring compliance with these regulations, enabling companies to conduct necessary tests on-site. This trend is particularly evident in the food industry, where portable spectrometers are used to verify the authenticity and safety of products. As regulatory frameworks continue to evolve, the demand for portable spectrometers is likely to increase, contributing to a robust market growth trajectory.
Increased Demand for On-Site Testing
The Portable Spectrometer Market is witnessing a notable increase in demand for on-site testing solutions across various sectors. Industries such as agriculture, pharmaceuticals, and environmental science are increasingly adopting portable spectrometers to conduct immediate analyses without the need for laboratory facilities. This shift is primarily driven by the need for rapid decision-making and quality control. For example, in agriculture, farmers utilize portable spectrometers to assess soil and crop health, leading to improved yield and resource management. The convenience and efficiency of on-site testing are expected to propel market growth, with estimates suggesting a market size expansion to over 1 billion USD by 2026.
Technological Advancements in Spectroscopy
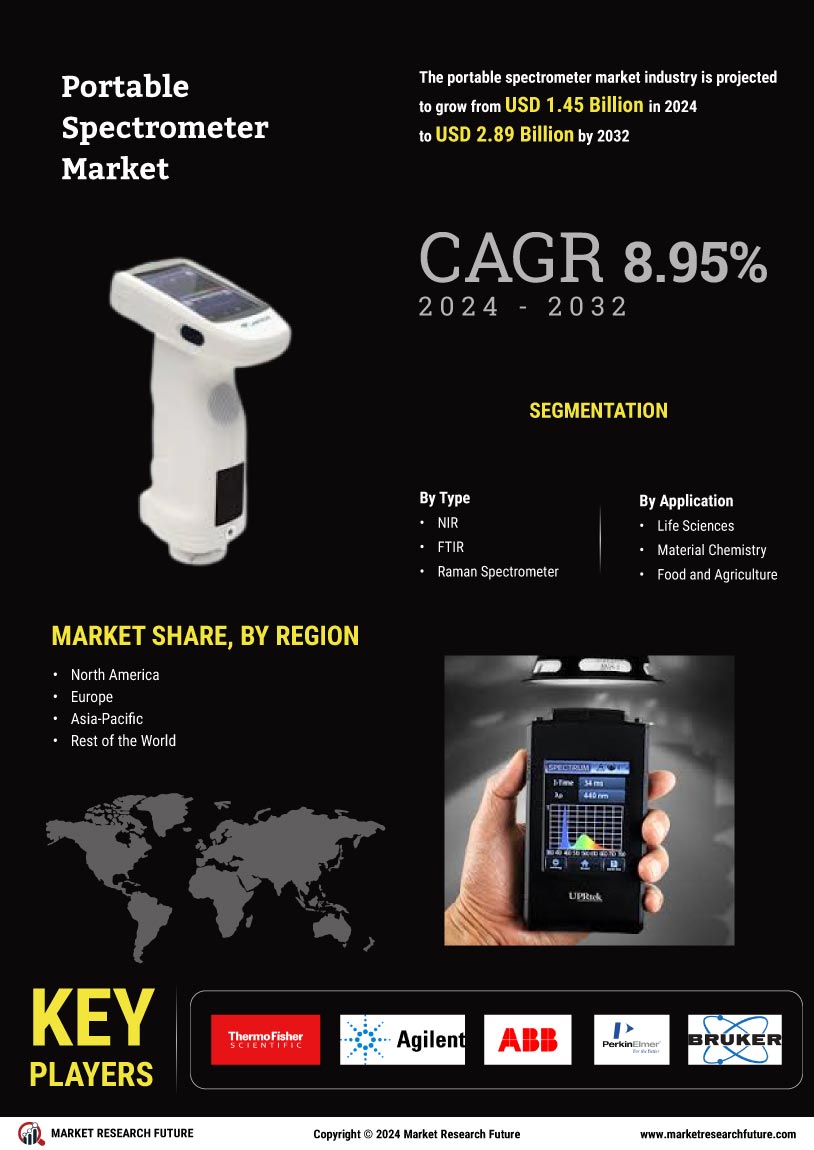
The Portable Spectrometer Market is experiencing a surge in technological advancements that enhance the capabilities and functionalities of portable spectrometers. Innovations such as miniaturization, improved sensor technology, and advanced data processing algorithms are making these devices more efficient and user-friendly. For instance, the integration of smartphone technology with portable spectrometers allows for real-time data analysis and remote monitoring. This trend is likely to attract a broader user base, including industries such as pharmaceuticals, food safety, and environmental monitoring. As a result, the market is projected to grow at a compound annual growth rate of approximately 8% over the next five years, driven by these technological improvements.
Rising Awareness of Environmental Monitoring
The Portable Spectrometer Market is benefiting from a heightened awareness of environmental monitoring and sustainability practices. As concerns regarding pollution and environmental degradation grow, industries are increasingly adopting portable spectrometers to monitor air and water quality. These devices enable real-time analysis of pollutants, facilitating timely interventions and compliance with environmental regulations. The market is expected to see a significant uptick in demand from environmental agencies and organizations focused on sustainability. This trend is likely to drive innovation and investment in portable spectrometer technology, potentially leading to a market valuation exceeding 1.5 billion USD by 2027.
Expansion of Research and Development Activities
The Portable Spectrometer Market is experiencing a boost due to the expansion of research and development activities across various fields. Academic institutions and research organizations are increasingly utilizing portable spectrometers for field studies and experimental research. This trend is particularly prominent in the fields of chemistry, biology, and materials science, where portable spectrometers facilitate in-situ measurements and data collection. The growing emphasis on interdisciplinary research is likely to further fuel the demand for these devices, as researchers seek versatile tools that can adapt to various applications. Consequently, the market is projected to grow steadily, with an anticipated increase in R&D funding and collaborations.