• Cat-intel
  • MedIntelliX
  • Resources
  • About Us
  • Request Free Sample ×

    Kindly complete the form below to receive a free sample of this Report

    Leading companies partner with us for data-driven Insights

    clients tt-cursor

    Pipeline Process Services Market

    ID: MRFR/E&P/7544-HCR
    111 Pages
    Priya Nagrale
    September 2025

    Pipeline and Process Services Market Research Report By Service Type (Pipeline Inspection Services, Pipeline Testing Services, Pipeline Maintenance Services, Pipeline Construction Services, Process Services), By End Use Industry (Oil and Gas, Chemical, Water and Wastewater, Power Generation, Food and Beverage), By Pipeline Material (Steel, Plastic, Copper, Composite, Concrete), By Application (Transport, Storage, Distribution) and By Regional (North America, Europe, South America, Asia Pacific, Middle East and Africa) - Forecast to 2032

    Share:
    Download PDF ×

    We do not share your information with anyone. However, we may send you emails based on your report interest from time to time. You may contact us at any time to opt-out.

    Pipeline & Process Services Market Research Report - Global Forecast till 2032 Infographic
    Purchase Options
    $ 4,950.0
    $ 5,950.0
    $ 7,250.0
    Table of Contents

    Pipeline Process Services Market Summary

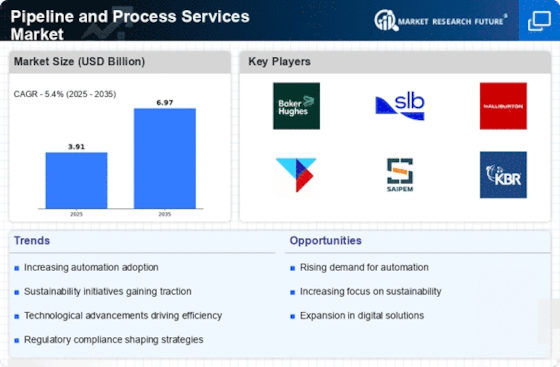
    The Global Pipeline and Process Services Market is projected to grow from 33.6 USD Billion in 2024 to 50.1 USD Billion by 2035, indicating a robust growth trajectory.

    Key Market Trends & Highlights

    Pipeline and Process Services Key Trends and Highlights

    • The market is expected to witness a compound annual growth rate (CAGR) of 3.68% from 2025 to 2035.
    • By 2035, the market valuation is anticipated to reach 50.1 USD Billion, reflecting increasing demand for pipeline and process services.
    • In 2024, the market is valued at 33.6 USD Billion, highlighting its substantial size and potential for growth.
    • Growing adoption of advanced technologies due to the need for enhanced operational efficiency is a major market driver.

    Market Size & Forecast

    2024 Market Size 33.6 (USD Billion)
    2035 Market Size 50.1 (USD Billion)
    CAGR (2025-2035) 3.68%

    Major Players

    KBR, SNCLavalin, Halliburton, Veolia, Baker Hughes, Schneider Electric, McKinsey and Company, Wood Group, Emerson Electric, Jacobs Engineering Group, Aegion Corporation, Honeywell, TechnipFMC, Tetra Tech, Fluor Corporation

    Pipeline Process Services Market Trends

    The Pipeline and Process Services Market is driven by multiple factors that significantly influence its growth. Increased demand for effective infrastructure, for example, is one of the drivers since the industries are looking forward to minimization of the expenditure on pipeline maintenance and process services. In other respects, all of the traditional industries that are supply-side controlled, are required to comply with safety and environmental regulations which force them to utilize higher-grade technologies and services.

    Further, the growth of the energy industry, particularly in emerging markets, creates a need for dense pipeline systems and high-quality maintenance services to support sustained output.

    In recent times, there has been a noticeable shift towards sustainability practices within the pipeline and process services sector.

    Many companies are now prioritizing environmentally friendly methods and materials to align with global sustainability goals. Such trends indicate a movement towards greener operations, with firms looking to reduce their carbon footprints and enhance their corporate social responsibility profiles. The growing awareness of climate change and environmental impact is influencing companies to adopt cleaner technologies, making sustainability a core focus area in the industry's evolution. This shift not only addresses regulatory requirements but also resonates with consumers and stakeholders demanding more responsible business practices.

    The Global Pipeline and Process Services Market is poised for growth as industries increasingly prioritize efficiency and sustainability in their operations, reflecting a broader trend towards modernization and environmental responsibility.

    U.S. Energy Information Administration

    Pipeline Process Services Market Drivers

    Technological Advancements

    Technological innovations play a crucial role in shaping the Global Pipeline and Process Services Market Industry. Advanced technologies such as automation, artificial intelligence, and data analytics enhance operational efficiency and safety in pipeline management. For example, the integration of smart sensors allows for real-time monitoring of pipeline conditions, reducing the risk of leaks and failures. This trend not only improves service delivery but also aligns with sustainability goals by minimizing environmental impacts. As companies adopt these technologies, the market is expected to witness significant growth, contributing to the projected value of 50.1 USD Billion by 2035.

    Increasing Demand for Energy

    The Global Pipeline and Process Services Market Industry experiences a notable surge in demand for energy, driven by the growing global population and industrialization. As countries strive to meet energy needs, investments in pipeline infrastructure are escalating. For instance, the market is projected to reach 33.6 USD Billion in 2024, reflecting a robust response to energy demands. This trend is particularly evident in developing regions where energy consumption is rising rapidly. The need for efficient transportation of oil and gas through pipelines is paramount, thus propelling the growth of the pipeline services sector.

    Market Trends and Projections

    Growing Focus on Sustainability

    Sustainability has become a pivotal concern within the Global Pipeline and Process Services Market Industry. Companies are increasingly adopting environmentally friendly practices to reduce their carbon footprint and comply with global sustainability goals. This shift is evident in the rising demand for services that facilitate the transportation of renewable energy sources, such as biofuels and hydrogen. Furthermore, the implementation of eco-friendly technologies in pipeline construction and maintenance is gaining traction. As organizations prioritize sustainability, the market is expected to evolve, reflecting a growing commitment to environmental stewardship and potentially enhancing its overall value.

    Regulatory Compliance and Safety Standards

    The Global Pipeline and Process Services Market Industry is significantly influenced by stringent regulatory compliance and safety standards imposed by governments worldwide. These regulations aim to ensure safe operations and environmental protection, necessitating regular inspections and maintenance of pipeline systems. Companies are increasingly investing in services that help them adhere to these regulations, thus driving market growth. The emphasis on safety is particularly pronounced in regions with high environmental sensitivity, where non-compliance can lead to severe penalties. As a result, the demand for specialized pipeline services that ensure compliance is likely to rise, further bolstering the market.

    Expansion of Oil and Gas Exploration Activities

    The Global Pipeline and Process Services Market Industry is experiencing growth due to the expansion of oil and gas exploration activities. As energy companies seek to tap into new reserves, the demand for efficient pipeline services becomes increasingly critical. This trend is particularly noticeable in regions with untapped resources, where exploration activities are on the rise. The need for reliable transportation infrastructure to connect these resources to markets is paramount. Consequently, the market is poised for growth, with projections indicating a compound annual growth rate of 3.68% from 2025 to 2035, driven by these exploration initiatives.

    Market Segment Insights

    Pipeline and Process Services Market Service Type Insights

    The Pipeline and Process Services Market is witnessing notable growth across various service types, with the market expected to reach substantial valuations by 2032. In 2023, the Pipeline Inspection Services segment holds a significant value of 6.8 USD Billion and is projected to expand to 9.58 USD Billion by 2032. The importance of this service type cannot be overstated, as it offers crucial insights into the integrity and safety of pipeline operations, ensuring compliance with regulatory standards. Similarly, Pipeline Testing Services demonstrates a strong valuation of 7.2 USD Billion in 2023, expected to grow to 9.55 USD Billion by 2032.

    This service is vital for determining the functionality and reliability of pipelines, thereby preventing leaks and environmental hazards.

    The Pipeline Maintenance Services segment leads with a noteworthy value of 9.0 USD Billion in 2023, anticipated reaching 12.05 USD Billion by 2032, marking it as a dominant force in the market. Its essential role in ensuring the continuous and efficient operation of pipelines directly lies to minimizing downtime, which is a critical factor for companies operating in this sector. In terms of Pipeline Construction Services, the segment is valued at 5.64 USD Billion in 2023, with expectations of growth to 8.43 USD Billion by 2032.

    This service plays a fundamental role in the development of new pipeline infrastructures, addressing the increasing demand for energy and raw materials globally.

    Lastly, the Process Services segment, valued at 4.0 USD Billion in 2023, is forecasted to increase to 7.39 USD Billion by 2032, reflecting its significance in the overall operation efficiency of pipeline systems. The services offered in this segment help optimize processing operations and ensure the seamless flow of materials through the pipelines. The varied service type within the Pipeline and Process Services Market demonstrates a clear segmentation approach that not only highlights growth potential but also addresses different operational needs.

    Pipeline and Process Services Market End Use Industry Insights

    The Pipeline and Process Services Market, with a valuation of 32.64 USD Billion in 2023, exhibits notable dynamics across various end use industries. The oil and gas sector plays a critical role, dominating the market due to its extensive pipeline networks and maintenance requirements. Similarly, the chemical industry significantly contributes to market growth, necessitating efficient process services for safe and effective transportation. Water and wastewater management underscores the importance of reliable pipeline services for environmental sustainability. Power generation, an essential component of the global energy landscape, also leverages pipeline solutions to maintain energy flow and efficiency.

    The food and beverage industry, while comparatively smaller, highlights the necessity for stringent hygiene standards in process services. Together, these industries reflect a structured segmentation of the Pipeline and Process Services Market, contributing to its anticipated revenue increase and ensuring a steady market growth trajectory.

    Pipeline and Process Services Market Pipeline Material Insights

    The Pipeline Material segment of the Pipeline and Process Services Market is expected to play a vital role in the overall market growth, which is projected to reach 32.64 billion USD in 2023. As the demand for efficient and durable piping systems increases, materials like Steel, Plastic, Copper, Composite, and Concrete are seeing significant utilization. Steel remains a dominant choice due to its strength and longevity, making it essential in high-pressure applications. Plastic, known for its lightweight and corrosion-resistant properties, is gaining traction in a variety of industries, particularly in those focused on sustainability.

    Copper serves specialized roles, particularly in plumbing and HVAC systems due to its thermal conductivity. Composites are advancing in the market, offering unique properties that combine strength with reduced weight, ideal for specialized applications. Lastly, Concrete provides a robust option for underground pipeline systems. The diverse characteristics and advantages offered by these materials contribute significantly to the Pipeline and Process Services Market revenue, ensuring a competitive landscape that addresses various sector demands. As industries evolve, staying ahead of market trends will be essential, accompanied by challenges like regulatory compliance and environmental considerations.

    The collective data from these facets estimates a compound annual growth rate (CAGR) of 3.63 from 2024 to 2032.

    Pipeline and Process Services Market Application Insights

    The Pipeline and Process Services Market, valued at 32.64 billion USD in 2023, showcases a robust structure through its Application segment, which encompasses essential areas such as Transport, Storage, and Distribution. These segments are significant contributors to market growth, driven by increasing demand for efficient transportation and storage solutions across various industries, including oil and gas, chemicals, and utilities. The Transport category is crucial, as it deals with the movement of resources over vast distances, ensuring timely supply and reducing operational costs. Storage plays a pivotal role by allowing companies to manage inventory effectively, leading to improved operational efficiency.

    Distribution is critical for optimizing the supply chain, ensuring that products reach their end-users promptly. The growing emphasis on infrastructure development and the need for advanced technologies to monitor and maintain pipelines likely presents numerous opportunities for growth in these applications. Furthermore, the Pipeline and Process Services Market segmentation reflects the evolving industry trends and highlights the importance of these segments in meeting global demand, ultimately supporting the overall revenue and market statistics.

    Get more detailed insights about Pipeline & Process Services Market Research Report - Global Forecast till 2032

    Regional Insights

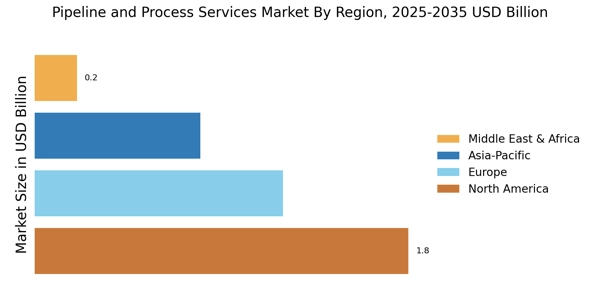
    The Pipeline and Process Services Market has showcased significant regional diversity, with North America leading with a valuation of 12.98 USD Billion in 2023, projected to rise to 18.15 USD Billion by 2032, establishing it as a dominant player in the market. Europe follows closely with a 2023 valuation of 9.87 USD Billion, growing to 13.45 USD Billion, exhibiting its significant role due to stringent regulatory standards and advanced industrial activities. Meanwhile, APAC has grown to 6.6 USD Billion in 2023 and is expected to reach 9.0 USD Billion, highlighting its expanding infrastructure projects and demand for efficient services.

    South America's contribution is smaller, at 1.95 USD Billion in 2023 and expected to grow to 2.85 USD Billion, reflecting developing market characteristics and increasing investments in the energy sector. Lastly, the MEA region, while having the least market share with a valuation of 1.24 USD Billion, is expected to expand to 1.55 USD Billion, driven by oil and gas exploration in volatile regions. This regional segmentation presents varied opportunities and challenges, influenced by local market dynamics and growth drivers, shaping the overall landscape of the Pipeline and Process Services Market revenue.

    Pipeline and Process Services Market Regional Insights

    Source: Primary Research, Secondary Research, Market Research Future Database and Analyst Review

    Key Players and Competitive Insights

    The Pipeline and Process Services Market has experienced significant growth due to increasing demand for efficient and safe pipeline operations, driven by the expansion of various industries such as oil and gas, chemicals, and utilities. This market is characterized by a diverse range of companies offering specialized services that cater to the maintenance, inspection, and optimization of pipeline infrastructure. As the industry evolves, it faces various challenges including technological advancements, regulatory compliance, and the necessity to adopt sustainable practices.

    Competitors within this market are actively investing in innovative technologies and service offerings to maintain their market position and cater to a growing customer base. The competitive landscape reflects a mix of established players and emerging companies, each striving to enhance their service capabilities while responding to changing market dynamics. KBR has established a strong market presence in the Pipeline and Process Services Market through its comprehensive suite of services, which includes pipeline inspection, maintenance, and optimization solutions. The company is well-regarded for its advanced technological solutions that enhance efficiency and ensure reliability in pipeline operations.

    KBR's commitment to safety and sustainability has further solidified its position, allowing it to attract a diverse clientele across various sectors. The organization's extensive experience and expertise in managing complex pipeline projects provide it with a competitive edge. KBR also emphasizes innovation, constantly seeking to integrate cutting-edge technologies that improve service delivery, thereby strengthening its overall brand image and marketability. SNCLavalin, on the other hand, is recognized for its robust capabilities in providing integrated services within the Pipeline and Process Services Market.

    The company excels in offering end-to-end solutions that encompass everything from project planning to execution, ensuring holistic management of pipeline projects. SNCLavalin's strength lies in its project management skills and technical expertise, which allow it to deliver reliable outcomes for large-scale pipeline installations and maintenance operations. The firm is also committed to enhancing operational efficiency and minimizing environmental impacts, aligning with current industry requirements for sustainability. With a strong emphasis on collaboration and strategic partnerships, SNCLavalin has successfully cemented its reputation as a leader in the market, demonstrating growth potential through its ongoing initiatives and commitment to innovation.

    Key Companies in the Pipeline Process Services Market market include

    Industry Developments

    The Pipeline and Process Services Market has seen notable recent developments, particularly with major players expanding their capacities and services. KBR and Halliburton continue to enhance their positions in technology-driven solutions, focusing on sustainable energy initiatives. Meanwhile, Veolia and Baker Hughes are exploring collaborations aimed at improving waste management and efficiency in pipeline operations. Current affairs reveal ongoing trends towards digital transformation, with Schneider Electric and Emerson Electric investing significantly in automation and IoT technologies to optimize pipeline processes. Additionally, Jacobs Engineering Group and Wood Group have been actively engaged in large-scale projects that solidify their market presence.

    Mergers and acquisitions remain a focal point, with Halliburton eyeing growth through strategic partnerships while KBR pursues innovative alliances. Market valuations for companies such as TechnipFMC and Tetra Tech have shown substantial growth, driven by increased demand for energy infrastructure and sustainable practices. Fluor Corporation has also reported advancements in its project pipeline, reflecting a healthy outlook in the industry. These dynamics indicate a robust and evolving landscape in the Pipeline and Process Services Market, with companies adapting to changes and seeking new growth avenues.

    Future Outlook

    Pipeline Process Services Market Future Outlook

    The Pipeline and Process Services Market is projected to grow at a 3.68% CAGR from 2024 to 2035, driven by technological advancements, increased energy demand, and regulatory compliance.

    New opportunities lie in:

    • Invest in digital twin technologies to enhance pipeline monitoring and predictive maintenance.
    • Develop eco-friendly cleaning solutions to meet stringent environmental regulations.
    • Expand service offerings in emerging markets to capitalize on infrastructure development.

    By 2035, the market is expected to demonstrate robust growth, reflecting evolving industry needs and technological integration.

    Market Segmentation

    Pipeline and Process Services Market Regional Outlook

    • North America
    • Europe
    • South America
    • Asia Pacific
    • Middle East and Africa

    Pipeline and Process Services Market Application Outlook

    • Transport
    • Storage
    • Distribution

    Pipeline and Process Services Market Service Type Outlook

    • Pipeline Inspection Services
    • Pipeline Testing Services
    • Pipeline Maintenance Services
    • Pipeline Construction Services
    • Process Services

    Pipeline and Process Services Market End Use Industry Outlook

    • Oil and Gas
    • Chemical
    • Water and Wastewater
    • Power Generation
    • Food and Beverage

    Pipeline and Process Services Market Pipeline Material Outlook

    • Steel
    • Plastic
    • Copper
    • Composite
    • Concrete

    Report Scope

    Report Attribute/Metric Details
    Market Size 2022 31.5 (USD Billion)
    Market Size 2023 32.64 (USD Billion)
    Market Size 2032 45.0 (USD Billion)
    Compound Annual Growth Rate (CAGR) 3.63% (2024 - 2032)
    Report Coverage Revenue Forecast, Competitive Landscape, Growth Factors, and Trends
    Base Year 2023
    Market Forecast Period 2024 - 2032
    Historical Data 2019 - 2023
    Market Forecast Units USD Billion
    Key Companies Profiled KBR, SNCLavalin, Halliburton, Veolia, Baker Hughes, Schneider Electric, McKinsey and Company, Wood Group, Emerson Electric, Jacobs Engineering Group, Aegion Corporation, Honeywell, TechnipFMC, Tetra Tech, Fluor Corporation
    Segments Covered Service Type, End Use Industry, Pipeline Material, Application, Regional
    Key Market Opportunities Increasing investment in infrastructure development, Demand for advanced inspection technologies, Growth in renewable energy projects, Rising focus on environmental regulations, Expanding oil and gas production activities
    Key Market Dynamics Increasing demand for energy efficiency, Technological advancements in pipeline inspection, Rising investment in infrastructure development, Regulatory compliance and safety standards, Growing focus on environmental sustainability
    Countries Covered North America, Europe, APAC, South America, MEA

    Market Highlights

    Author
    Priya Nagrale
    Senior Research Analyst

    With an experience of over five years in market research industry (Chemicals & Materials domain), I gather and analyze market data from diverse sources to produce results, which are then presented back to a client. Also, provide recommendations based on the findings. As a Senior Research Analyst, I perform quality checks (QC) for market estimations, QC for reports, and handle queries and work extensively on client customizations. Also, handle the responsibilities of client proposals, report planning, report finalization, and execution

    Leave a Comment

    FAQs

    What is the estimated market size of the Pipeline and Process Services Market in 2032?

    The Pipeline and Process Services Market is expected to be valued at 45.0 USD Billion in 2032.

    What was the market value of Pipeline Inspection Services in 2023?

    Pipeline Inspection Services was valued at 6.8 USD Billion in 2023.

    What is the expected CAGR for the Pipeline and Process Services Market from 2025 to 2034?

    The expected CAGR for the Pipeline and Process Services Market is 3.63% from 2025 to 2034.

    What are some of the key players in the Pipeline and Process Services Market?

    Major players in the market include Halliburton, Veolia, Baker Hughes, and TechnipFMC.

    Which region holds the largest market share in 2023 for the Pipeline and Process Services Market?

    North America holds the largest market share, valued at 12.98 USD Billion in 2023.

    What is the market value of the Pipeline Maintenance Services segment in 2032?

    The Pipeline Maintenance Services segment is projected to reach 12.05 USD Billion in 2032.

    How has the market for Process Services evolved from 2023 to 2032?

    The market value for Process Services is expected to grow from 4.0 USD Billion in 2023 to 7.39 USD Billion in 2032.

    What is the anticipated market value of the APAC region for the Pipeline and Process Services Market in 2032?

    The APAC region is expected to reach a market value of 9.0 USD Billion in 2032.

    What is the projected market size of Pipeline Construction Services by 2032?

    Pipeline Construction Services is expected to grow to 8.43 USD Billion by 2032.

    What is the market value of Pipeline Testing Services in 2023?

    In 2023, Pipeline Testing Services was valued at 7.2 USD Billion.

    1. EXECUTIVE SUMMARY
    2. Market Overview
      1. Key Findings
      2. Market Segmentation
    3. Competitive Landscape
      1. Challenges and Opportunities
      2. Future Outlook
    4. MARKET INTRODUCTION
      1. Definition
      2. Scope of the study
        1. Research Objective
        2. Assumption
        3. Limitations
    5. RESEARCH METHODOLOGY
      1. Overview
    6. Data Mining
      1. Secondary Research
      2. Primary Research
    7. Primary Interviews and Information Gathering Process
      1. Breakdown of Primary
    8. Respondents
      1. Forecasting Model
      2. Market Size Estimation
    9. Bottom-Up Approach
      1. Top-Down Approach
      2. Data Triangulation
      3. Validation
    10. MARKET DYNAMICS
      1. Overview
      2. Drivers
      3. Restraints
      4. Opportunities
    11. MARKET FACTOR ANALYSIS
      1. Value chain Analysis
      2. Porter's Five Forces
    12. Analysis
      1. Bargaining Power of Suppliers
        1. Bargaining Power
    13. of Buyers
      1. Threat of New Entrants
        1. Threat of Substitutes
        2. Intensity of Rivalry
      2. COVID-19 Impact Analysis
    14. Market Impact Analysis
      1. Regional Impact
        1. Opportunity and
    15. Threat Analysis
    16. PIPELINE AND PROCESS SERVICES MARKET,
    17. BY SERVICE TYPE (USD BILLION)
      1. Pipeline Inspection Services
    18. Pipeline Testing Services
      1. Pipeline Maintenance Services
      2. Pipeline
    19. Construction Services
      1. Process Services
    20. PIPELINE AND PROCESS
    21. SERVICES MARKET, BY END USE INDUSTRY (USD BILLION)
      1. Oil and Gas
    22. Chemical
      1. Water and Wastewater
      2. Power Generation
    23. Food and Beverage
    24. PIPELINE AND PROCESS SERVICES MARKET, BY PIPELINE MATERIAL
    25. (USD BILLION)
      1. Steel
      2. Plastic
      3. Copper
      4. Composite
      5. Concrete
    26. PIPELINE AND PROCESS SERVICES MARKET, BY APPLICATION
    27. (USD BILLION)
      1. Transport
      2. Storage
      3. Distribution
    28. PIPELINE AND PROCESS SERVICES MARKET, BY REGIONAL (USD BILLION)
    29. North America
      1. US
        1. Canada
      2. Europe
    30. Germany
      1. UK
        1. France
        2. Russia
    31. Italy
      1. Spain
        1. Rest of Europe
      2. APAC
    32. China
      1. India
        1. Japan
        2. South Korea
    33. Malaysia
      1. Thailand
        1. Indonesia
        2. Rest of APAC
      2. South America
        1. Brazil
        2. Mexico
    34. Argentina
      1. Rest of South America
      2. MEA
        1. GCC
    35. Countries
      1. South Africa
        1. Rest of MEA
    36. COMPETITIVE LANDSCAPE
      1. Overview
      2. Competitive Analysis
      3. Market share Analysis
      4. Major Growth Strategy in the Pipeline
    37. and Process Services Market
      1. Competitive Benchmarking
      2. Leading
    38. Players in Terms of Number of Developments in the Pipeline and Process Services
    39. Market
      1. Key developments and growth strategies
        1. New Product
    40. Launch/Service Deployment
      1. Merger & Acquisitions
    41. Joint Ventures
      1. Major Players Financial Matrix
        1. Sales and
    42. Operating Income
      1. Major Players R&D Expenditure. 2023
    43. COMPANY PROFILES
      1. KBR
        1. Financial Overview
    44. Products Offered
      1. Key Developments
        1. SWOT Analysis
        2. Key Strategies
      2. SNCLavalin
        1. Financial Overview
        2. Products Offered
        3. Key Developments
        4. SWOT
    45. Analysis
      1. Key Strategies
      2. Halliburton
        1. Financial
    46. Overview
      1. Products Offered
        1. Key Developments
    47. SWOT Analysis
      1. Key Strategies
      2. Veolia
        1. Financial
    48. Overview
      1. Products Offered
        1. Key Developments
    49. SWOT Analysis
      1. Key Strategies
      2. Baker Hughes
    50. Financial Overview
      1. Products Offered
        1. Key Developments
        2. SWOT Analysis
        3. Key Strategies
      2. Schneider Electric
        1. Financial Overview
        2. Products Offered
        3. Key
    51. Developments
      1. SWOT Analysis
        1. Key Strategies
    52. McKinsey and Company
      1. Financial Overview
        1. Products Offered
        2. Key Developments
        3. SWOT Analysis
        4. Key Strategies
      2. Wood Group
        1. Financial Overview
        2. Products Offered
        3. Key Developments
        4. SWOT Analysis
        5. Key Strategies
      3. Emerson Electric
        1. Financial Overview
        2. Products
    53. Offered
      1. Key Developments
        1. SWOT Analysis
    54. Key Strategies
      1. Jacobs Engineering Group
        1. Financial Overview
        2. Products Offered
        3. Key Developments
        4. SWOT
    55. Analysis
      1. Key Strategies
      2. Aegion Corporation
    56. Financial Overview
      1. Products Offered
        1. Key Developments
        2. SWOT Analysis
        3. Key Strategies
      2. Honeywell
        1. Financial Overview
        2. Products Offered
    57. Key Developments
      1. SWOT Analysis
        1. Key Strategies
      2. TechnipFMC
        1. Financial Overview
        2. Products Offered
        3. Key Developments
        4. SWOT Analysis
        5. Key
    58. Strategies
      1. Tetra Tech
        1. Financial Overview
    59. Products Offered
      1. Key Developments
        1. SWOT Analysis
        2. Key Strategies
      2. Fluor Corporation
        1. Financial
    60. Overview
      1. Products Offered
        1. Key Developments
    61. SWOT Analysis
      1. Key Strategies
    62. APPENDIX
      1. References
      2. Related Reports
    63. & FORECAST, BY SERVICE TYPE, 2019-2032 (USD BILLIONS)
    64. PIPELINE AND PROCESS SERVICES MARKET SIZE ESTIMATES & FORECAST, BY END USE INDUSTRY,
    65. 2032 (USD BILLIONS)
    66. MARKET SIZE ESTIMATES & FORECAST, BY PIPELINE MATERIAL, 2019-2032 (USD BILLIONS)
    67. & FORECAST, BY APPLICATION, 2019-2032 (USD BILLIONS)
    68. PIPELINE AND PROCESS SERVICES MARKET SIZE ESTIMATES & FORECAST, BY REGIONAL,
    69. 2032 (USD BILLIONS)
    70. SIZE ESTIMATES & FORECAST, BY SERVICE TYPE, 2019-2032 (USD BILLIONS)
    71. US PIPELINE AND PROCESS SERVICES MARKET SIZE ESTIMATES & FORECAST, BY END
    72. USE INDUSTRY, 2019-2032 (USD BILLIONS)
    73. MARKET SIZE ESTIMATES & FORECAST, BY PIPELINE MATERIAL, 2019-2032 (USD BILLIONS)
    74. BY APPLICATION, 2019-2032 (USD BILLIONS)
    75. SERVICES MARKET SIZE ESTIMATES & FORECAST, BY REGIONAL, 2019-2032 (USD BILLIONS)
    76. FORECAST, BY SERVICE TYPE, 2019-2032 (USD BILLIONS)
    77. AND PROCESS SERVICES MARKET SIZE ESTIMATES & FORECAST, BY END USE INDUSTRY,
    78. 2032 (USD BILLIONS)
    79. SIZE ESTIMATES & FORECAST, BY PIPELINE MATERIAL, 2019-2032 (USD BILLIONS)
    80. BY APPLICATION, 2019-2032 (USD BILLIONS)
    81. SERVICES MARKET SIZE ESTIMATES & FORECAST, BY REGIONAL, 2019-2032 (USD BILLIONS)
    82. FORECAST, BY SERVICE TYPE, 2019-2032 (USD BILLIONS)
    83. AND PROCESS SERVICES MARKET SIZE ESTIMATES & FORECAST, BY END USE INDUSTRY,
    84. 2032 (USD BILLIONS)
    85. SIZE ESTIMATES & FORECAST, BY PIPELINE MATERIAL, 2019-2032 (USD BILLIONS)
    86. BY APPLICATION, 2019-2032 (USD BILLIONS)
    87. SERVICES MARKET SIZE ESTIMATES & FORECAST, BY REGIONAL, 2019-2032 (USD BILLIONS)
    88. FORECAST, BY SERVICE TYPE, 2019-2032 (USD BILLIONS)
    89. AND PROCESS SERVICES MARKET SIZE ESTIMATES & FORECAST, BY END USE INDUSTRY,
    90. 2032 (USD BILLIONS)
    91. SIZE ESTIMATES & FORECAST, BY PIPELINE MATERIAL, 2019-2032 (USD BILLIONS)
    92. BY APPLICATION, 2019-2032 (USD BILLIONS)
    93. SERVICES MARKET SIZE ESTIMATES & FORECAST, BY REGIONAL, 2019-2032 (USD BILLIONS)
    94. BY SERVICE TYPE, 2019-2032 (USD BILLIONS)
    95. SERVICES MARKET SIZE ESTIMATES & FORECAST, BY END USE INDUSTRY, 2019-2032 (USD
    96. BILLIONS)
    97. & FORECAST, BY PIPELINE MATERIAL, 2019-2032 (USD BILLIONS)
    98. PIPELINE AND PROCESS SERVICES MARKET SIZE ESTIMATES & FORECAST, BY APPLICATION,
    99. 2032 (USD BILLIONS)
    100. SIZE ESTIMATES & FORECAST, BY REGIONAL, 2019-2032 (USD BILLIONS)
    101. FRANCE PIPELINE AND PROCESS SERVICES MARKET SIZE ESTIMATES & FORECAST, BY
    102. SERVICE TYPE, 2019-2032 (USD BILLIONS)
    103. SERVICES MARKET SIZE ESTIMATES & FORECAST, BY END USE INDUSTRY, 2019-2032 (USD
    104. BILLIONS)
    105. & FORECAST, BY PIPELINE MATERIAL, 2019-2032 (USD BILLIONS)
    106. PIPELINE AND PROCESS SERVICES MARKET SIZE ESTIMATES & FORECAST, BY APPLICATION,
    107. 2032 (USD BILLIONS)
    108. SIZE ESTIMATES & FORECAST, BY REGIONAL, 2019-2032 (USD BILLIONS)
    109. RUSSIA PIPELINE AND PROCESS SERVICES MARKET SIZE ESTIMATES & FORECAST, BY
    110. SERVICE TYPE, 2019-2032 (USD BILLIONS)
    111. SERVICES MARKET SIZE ESTIMATES & FORECAST, BY END USE INDUSTRY, 2019-2032 (USD
    112. BILLIONS)
    113. & FORECAST, BY PIPELINE MATERIAL, 2019-2032 (USD BILLIONS)
    114. PIPELINE AND PROCESS SERVICES MARKET SIZE ESTIMATES & FORECAST, BY APPLICATION,
    115. 2032 (USD BILLIONS)
    116. SIZE ESTIMATES & FORECAST, BY REGIONAL, 2019-2032 (USD BILLIONS)
    117. ITALY PIPELINE AND PROCESS SERVICES MARKET SIZE ESTIMATES & FORECAST, BY
    118. SERVICE TYPE, 2019-2032 (USD BILLIONS)
    119. SERVICES MARKET SIZE ESTIMATES & FORECAST, BY END USE INDUSTRY, 2019-2032 (USD
    120. BILLIONS)
    121. & FORECAST, BY PIPELINE MATERIAL, 2019-2032 (USD BILLIONS)
    122. PIPELINE AND PROCESS SERVICES MARKET SIZE ESTIMATES & FORECAST, BY APPLICATION,
    123. 2032 (USD BILLIONS)
    124. SIZE ESTIMATES & FORECAST, BY REGIONAL, 2019-2032 (USD BILLIONS)
    125. SPAIN PIPELINE AND PROCESS SERVICES MARKET SIZE ESTIMATES & FORECAST, BY
    126. SERVICE TYPE, 2019-2032 (USD BILLIONS)
    127. SERVICES MARKET SIZE ESTIMATES & FORECAST, BY END USE INDUSTRY, 2019-2032 (USD
    128. BILLIONS)
    129. & FORECAST, BY PIPELINE MATERIAL, 2019-2032 (USD BILLIONS)
    130. PIPELINE AND PROCESS SERVICES MARKET SIZE ESTIMATES & FORECAST, BY APPLICATION,
    131. 2032 (USD BILLIONS)
    132. SIZE ESTIMATES & FORECAST, BY REGIONAL, 2019-2032 (USD BILLIONS)
    133. REST OF EUROPE PIPELINE AND PROCESS SERVICES MARKET SIZE ESTIMATES & FORECAST,
    134. BY SERVICE TYPE, 2019-2032 (USD BILLIONS)
    135. AND PROCESS SERVICES MARKET SIZE ESTIMATES & FORECAST, BY END USE INDUSTRY,
    136. 2032 (USD BILLIONS)
    137. MARKET SIZE ESTIMATES & FORECAST, BY PIPELINE MATERIAL, 2019-2032 (USD BILLIONS)
    138. & FORECAST, BY APPLICATION, 2019-2032 (USD BILLIONS)
    139. EUROPE PIPELINE AND PROCESS SERVICES MARKET SIZE ESTIMATES & FORECAST, BY REGIONAL,
    140. 2032 (USD BILLIONS)
    141. SIZE ESTIMATES & FORECAST, BY SERVICE TYPE, 2019-2032 (USD BILLIONS)
    142. APAC PIPELINE AND PROCESS SERVICES MARKET SIZE ESTIMATES & FORECAST, BY
    143. END USE INDUSTRY, 2019-2032 (USD BILLIONS)
    144. SERVICES MARKET SIZE ESTIMATES & FORECAST, BY PIPELINE MATERIAL, 2019-2032 (USD
    145. BILLIONS)
    146. & FORECAST, BY APPLICATION, 2019-2032 (USD BILLIONS)
    147. AND PROCESS SERVICES MARKET SIZE ESTIMATES & FORECAST, BY REGIONAL, 2019-2032
    148. (USD BILLIONS)
    149. & FORECAST, BY SERVICE TYPE, 2019-2032 (USD BILLIONS)
    150. PIPELINE AND PROCESS SERVICES MARKET SIZE ESTIMATES & FORECAST, BY END USE INDUSTRY,
    151. 2032 (USD BILLIONS)
    152. SIZE ESTIMATES & FORECAST, BY PIPELINE MATERIAL, 2019-2032 (USD BILLIONS)
    153. BY APPLICATION, 2019-2032 (USD BILLIONS)
    154. SERVICES MARKET SIZE ESTIMATES & FORECAST, BY REGIONAL, 2019-2032 (USD BILLIONS)
    155. FORECAST, BY SERVICE TYPE, 2019-2032 (USD BILLIONS)
    156. AND PROCESS SERVICES MARKET SIZE ESTIMATES & FORECAST, BY END USE INDUSTRY,
    157. 2032 (USD BILLIONS)
    158. SIZE ESTIMATES & FORECAST, BY PIPELINE MATERIAL, 2019-2032 (USD BILLIONS)
    159. BY APPLICATION, 2019-2032 (USD BILLIONS)
    160. SERVICES MARKET SIZE ESTIMATES & FORECAST, BY REGIONAL, 2019-2032 (USD BILLIONS)
    161. FORECAST, BY SERVICE TYPE, 2019-2032 (USD BILLIONS)
    162. AND PROCESS SERVICES MARKET SIZE ESTIMATES & FORECAST, BY END USE INDUSTRY,
    163. 2032 (USD BILLIONS)
    164. SIZE ESTIMATES & FORECAST, BY PIPELINE MATERIAL, 2019-2032 (USD BILLIONS)
    165. BY APPLICATION, 2019-2032 (USD BILLIONS)
    166. SERVICES MARKET SIZE ESTIMATES & FORECAST, BY REGIONAL, 2019-2032 (USD BILLIONS)
    167. & FORECAST, BY SERVICE TYPE, 2019-2032 (USD BILLIONS)
    168. KOREA PIPELINE AND PROCESS SERVICES MARKET SIZE ESTIMATES & FORECAST, BY END
    169. USE INDUSTRY, 2019-2032 (USD BILLIONS)
    170. PROCESS SERVICES MARKET SIZE ESTIMATES & FORECAST, BY PIPELINE MATERIAL, 2019-2032
    171. (USD BILLIONS)
    172. SIZE ESTIMATES & FORECAST, BY APPLICATION, 2019-2032 (USD BILLIONS)
    173. SOUTH KOREA PIPELINE AND PROCESS SERVICES MARKET SIZE ESTIMATES & FORECAST,
    174. BY REGIONAL, 2019-2032 (USD BILLIONS)
    175. SERVICES MARKET SIZE ESTIMATES & FORECAST, BY SERVICE TYPE, 2019-2032 (USD BILLIONS)
    176. FORECAST, BY END USE INDUSTRY, 2019-2032 (USD BILLIONS)
    177. PIPELINE AND PROCESS SERVICES MARKET SIZE ESTIMATES & FORECAST, BY PIPELINE
    178. MATERIAL, 2019-2032 (USD BILLIONS)
    179. SERVICES MARKET SIZE ESTIMATES & FORECAST, BY APPLICATION, 2019-2032 (USD BILLIONS)
    180. FORECAST, BY REGIONAL, 2019-2032 (USD BILLIONS)
    181. AND PROCESS SERVICES MARKET SIZE ESTIMATES & FORECAST, BY SERVICE TYPE, 2019-2032
    182. (USD BILLIONS)
    183. ESTIMATES & FORECAST, BY END USE INDUSTRY, 2019-2032 (USD BILLIONS)
    184. THAILAND PIPELINE AND PROCESS SERVICES MARKET SIZE ESTIMATES & FORECAST,
    185. BY PIPELINE MATERIAL, 2019-2032 (USD BILLIONS)
    186. AND PROCESS SERVICES MARKET SIZE ESTIMATES & FORECAST, BY APPLICATION, 2019-2032
    187. (USD BILLIONS)
    188. ESTIMATES & FORECAST, BY REGIONAL, 2019-2032 (USD BILLIONS)
    189. INDONESIA PIPELINE AND PROCESS SERVICES MARKET SIZE ESTIMATES & FORECAST, BY
    190. SERVICE TYPE, 2019-2032 (USD BILLIONS)
    191. SERVICES MARKET SIZE ESTIMATES & FORECAST, BY END USE INDUSTRY, 2019-2032 (USD
    192. BILLIONS)
    193. & FORECAST, BY PIPELINE MATERIAL, 2019-2032 (USD BILLIONS)
    194. PIPELINE AND PROCESS SERVICES MARKET SIZE ESTIMATES & FORECAST, BY APPLICATION,
    195. 2032 (USD BILLIONS)
    196. MARKET SIZE ESTIMATES & FORECAST, BY REGIONAL, 2019-2032 (USD BILLIONS)
    197. FORECAST, BY SERVICE TYPE, 2019-2032 (USD BILLIONS)
    198. PIPELINE AND PROCESS SERVICES MARKET SIZE ESTIMATES & FORECAST, BY END USE INDUSTRY,
    199. 2032 (USD BILLIONS)
    200. MARKET SIZE ESTIMATES & FORECAST, BY PIPELINE MATERIAL, 2019-2032 (USD BILLIONS)
    201. & FORECAST, BY APPLICATION, 2019-2032 (USD BILLIONS)
    202. APAC PIPELINE AND PROCESS SERVICES MARKET SIZE ESTIMATES & FORECAST, BY REGIONAL,
    203. 2032 (USD BILLIONS)
    204. MARKET SIZE ESTIMATES & FORECAST, BY SERVICE TYPE, 2019-2032 (USD BILLIONS)
    205. & FORECAST, BY END USE INDUSTRY, 2019-2032 (USD BILLIONS)
    206. AMERICA PIPELINE AND PROCESS SERVICES MARKET SIZE ESTIMATES & FORECAST, BY PIPELINE
    207. MATERIAL, 2019-2032 (USD BILLIONS)
    208. SERVICES MARKET SIZE ESTIMATES & FORECAST, BY APPLICATION, 2019-2032 (USD BILLIONS)
    209. & FORECAST, BY REGIONAL, 2019-2032 (USD BILLIONS)
    210. AND PROCESS SERVICES MARKET SIZE ESTIMATES & FORECAST, BY SERVICE TYPE, 2019-2032
    211. (USD BILLIONS)
    212. ESTIMATES & FORECAST, BY END USE INDUSTRY, 2019-2032 (USD BILLIONS)
    213. BRAZIL PIPELINE AND PROCESS SERVICES MARKET SIZE ESTIMATES & FORECAST,
    214. BY PIPELINE MATERIAL, 2019-2032 (USD BILLIONS)
    215. AND PROCESS SERVICES MARKET SIZE ESTIMATES & FORECAST, BY APPLICATION, 2019-2032
    216. (USD BILLIONS)
    217. ESTIMATES & FORECAST, BY REGIONAL, 2019-2032 (USD BILLIONS)
    218. MEXICO PIPELINE AND PROCESS SERVICES MARKET SIZE ESTIMATES & FORECAST, BY SERVICE
    219. TYPE, 2019-2032 (USD BILLIONS)
    220. MARKET SIZE ESTIMATES & FORECAST, BY END USE INDUSTRY, 2019-2032 (USD BILLIONS)
    221. FORECAST, BY PIPELINE MATERIAL, 2019-2032 (USD BILLIONS)
    222. PIPELINE AND PROCESS SERVICES MARKET SIZE ESTIMATES & FORECAST, BY APPLICATION,
    223. 2032 (USD BILLIONS)
    224. SIZE ESTIMATES & FORECAST, BY REGIONAL, 2019-2032 (USD BILLIONS)
    225. ARGENTINA PIPELINE AND PROCESS SERVICES MARKET SIZE ESTIMATES & FORECAST,
    226. BY SERVICE TYPE, 2019-2032 (USD BILLIONS)
    227. PROCESS SERVICES MARKET SIZE ESTIMATES & FORECAST, BY END USE INDUSTRY, 2019-2032
    228. (USD BILLIONS)
    229. ESTIMATES & FORECAST, BY PIPELINE MATERIAL, 2019-2032 (USD BILLIONS)
    230. ARGENTINA PIPELINE AND PROCESS SERVICES MARKET SIZE ESTIMATES & FORECAST,
    231. BY APPLICATION, 2019-2032 (USD BILLIONS)
    232. PROCESS SERVICES MARKET SIZE ESTIMATES & FORECAST, BY REGIONAL, 2019-2032 (USD
    233. BILLIONS)
    234. SIZE ESTIMATES & FORECAST, BY SERVICE TYPE, 2019-2032 (USD BILLIONS)
    235. REST OF SOUTH AMERICA PIPELINE AND PROCESS SERVICES MARKET SIZE ESTIMATES &
    236. FORECAST, BY END USE INDUSTRY, 2019-2032 (USD BILLIONS)
    237. SOUTH AMERICA PIPELINE AND PROCESS SERVICES MARKET SIZE ESTIMATES & FORECAST,
    238. BY PIPELINE MATERIAL, 2019-2032 (USD BILLIONS)
    239. PIPELINE AND PROCESS SERVICES MARKET SIZE ESTIMATES & FORECAST, BY APPLICATION,
    240. 2032 (USD BILLIONS)
    241. SERVICES MARKET SIZE ESTIMATES & FORECAST, BY REGIONAL, 2019-2032 (USD BILLIONS)
    242. BY SERVICE TYPE, 2019-2032 (USD BILLIONS)
    243. SERVICES MARKET SIZE ESTIMATES & FORECAST, BY END USE INDUSTRY, 2019-2032 (USD
    244. BILLIONS)
    245. & FORECAST, BY PIPELINE MATERIAL, 2019-2032 (USD BILLIONS)
    246. MEA PIPELINE AND PROCESS SERVICES MARKET SIZE ESTIMATES & FORECAST, BY APPLICATION,
    247. 2032 (USD BILLIONS)
    248. SIZE ESTIMATES & FORECAST, BY REGIONAL, 2019-2032 (USD BILLIONS)
    249. GCC COUNTRIES PIPELINE AND PROCESS SERVICES MARKET SIZE ESTIMATES & FORECAST,
    250. BY SERVICE TYPE, 2019-2032 (USD BILLIONS)
    251. AND PROCESS SERVICES MARKET SIZE ESTIMATES & FORECAST, BY END USE INDUSTRY,
    252. 2032 (USD BILLIONS)
    253. MARKET SIZE ESTIMATES & FORECAST, BY PIPELINE MATERIAL, 2019-2032 (USD BILLIONS)
    254. & FORECAST, BY APPLICATION, 2019-2032 (USD BILLIONS)
    255. PIPELINE AND PROCESS SERVICES MARKET SIZE ESTIMATES & FORECAST, BY REGIONAL,
    256. 2032 (USD BILLIONS)
    257. MARKET SIZE ESTIMATES & FORECAST, BY SERVICE TYPE, 2019-2032 (USD BILLIONS)
    258. & FORECAST, BY END USE INDUSTRY, 2019-2032 (USD BILLIONS)
    259. AFRICA PIPELINE AND PROCESS SERVICES MARKET SIZE ESTIMATES & FORECAST, BY PIPELINE
    260. MATERIAL, 2019-2032 (USD BILLIONS)
    261. SERVICES MARKET SIZE ESTIMATES & FORECAST, BY APPLICATION, 2019-2032 (USD BILLIONS)
    262. & FORECAST, BY REGIONAL, 2019-2032 (USD BILLIONS)
    263. PIPELINE AND PROCESS SERVICES MARKET SIZE ESTIMATES & FORECAST, BY SERVICE TYPE,
    264. 2032 (USD BILLIONS)
    265. MARKET SIZE ESTIMATES & FORECAST, BY END USE INDUSTRY, 2019-2032 (USD BILLIONS)
    266. & FORECAST, BY PIPELINE MATERIAL, 2019-2032 (USD BILLIONS)
    267. REST OF MEA PIPELINE AND PROCESS SERVICES MARKET SIZE ESTIMATES & FORECAST,
    268. BY APPLICATION, 2019-2032 (USD BILLIONS)
    269. PROCESS SERVICES MARKET SIZE ESTIMATES & FORECAST, BY REGIONAL, 2019-2032 (USD
    270. BILLIONS)
    271. ACQUISITION/PARTNERSHIP
    272. MARKET SYNOPSIS
    273. ANALYSIS
    274. TYPE
    275. INDUSTRY
    276. MATERIAL
    277. INDUSTRY
    278. PIPELINE MATERIAL
    279. BY APPLICATION
    280. BY REGIONAL
    281. TYPE
    282. USE INDUSTRY
    283. BY PIPELINE MATERIAL
    284. ANALYSIS BY APPLICATION
    285. ANALYSIS BY REGIONAL
    286. BY SERVICE TYPE
    287. BY END USE INDUSTRY
    288. BY PIPELINE MATERIAL
    289. BY APPLICATION
    290. BY REGIONAL
    291. BY SERVICE TYPE
    292. BY END USE INDUSTRY
    293. ANALYSIS BY PIPELINE MATERIAL
    294. MARKET ANALYSIS BY APPLICATION
    295. MARKET ANALYSIS BY REGIONAL
    296. MARKET ANALYSIS BY SERVICE TYPE
    297. MARKET ANALYSIS BY END USE INDUSTRY
    298. SERVICES MARKET ANALYSIS BY PIPELINE MATERIAL
    299. PROCESS SERVICES MARKET ANALYSIS BY APPLICATION
    300. AND PROCESS SERVICES MARKET ANALYSIS BY REGIONAL
    301. AND PROCESS SERVICES MARKET ANALYSIS BY SERVICE TYPE
    302. AND PROCESS SERVICES MARKET ANALYSIS BY END USE INDUSTRY
    303. PIPELINE AND PROCESS SERVICES MARKET ANALYSIS BY PIPELINE MATERIAL
    304. ITALY PIPELINE AND PROCESS SERVICES MARKET ANALYSIS BY APPLICATION
    305. ITALY PIPELINE AND PROCESS SERVICES MARKET ANALYSIS BY REGIONAL
    306. SPAIN PIPELINE AND PROCESS SERVICES MARKET ANALYSIS BY SERVICE TYPE
    307. SPAIN PIPELINE AND PROCESS SERVICES MARKET ANALYSIS BY END USE INDUSTRY
    308. SERVICE TYPE
    309. ANALYSIS BY END USE INDUSTRY
    310. SERVICES MARKET ANALYSIS BY PIPELINE MATERIAL
    311. AND PROCESS SERVICES MARKET ANALYSIS BY APPLICATION
    312. PIPELINE AND PROCESS SERVICES MARKET ANALYSIS BY REGIONAL
    313. PIPELINE AND PROCESS SERVICES MARKET ANALYSIS
    314. PROCESS SERVICES MARKET ANALYSIS BY SERVICE TYPE
    315. AND PROCESS SERVICES MARKET ANALYSIS BY END USE INDUSTRY
    316. PIPELINE AND PROCESS SERVICES MARKET ANALYSIS BY PIPELINE MATERIAL
    317. CHINA PIPELINE AND PROCESS SERVICES MARKET ANALYSIS BY APPLICATION
    318. CHINA PIPELINE AND PROCESS SERVICES MARKET ANALYSIS BY REGIONAL
    319. INDIA PIPELINE AND PROCESS SERVICES MARKET ANALYSIS BY SERVICE TYPE
    320. INDIA PIPELINE AND PROCESS SERVICES MARKET ANALYSIS BY END USE INDUSTRY
    321. TYPE
    322. USE INDUSTRY
    323. BY PIPELINE MATERIAL
    324. ANALYSIS BY APPLICATION
    325. ANALYSIS BY REGIONAL
    326. MARKET ANALYSIS BY SERVICE TYPE
    327. SERVICES MARKET ANALYSIS BY END USE INDUSTRY
    328. AND PROCESS SERVICES MARKET ANALYSIS BY PIPELINE MATERIAL
    329. KOREA PIPELINE AND PROCESS SERVICES MARKET ANALYSIS BY APPLICATION
    330. SOUTH KOREA PIPELINE AND PROCESS SERVICES MARKET ANALYSIS BY REGIONAL
    331. MALAYSIA PIPELINE AND PROCESS SERVICES MARKET ANALYSIS BY SERVICE TYPE
    332. MALAYSIA PIPELINE AND PROCESS SERVICES MARKET ANALYSIS BY END USE INDUSTRY
    333. MATERIAL
    334. BY APPLICATION
    335. BY REGIONAL
    336. BY SERVICE TYPE
    337. BY END USE INDUSTRY
    338. ANALYSIS BY PIPELINE MATERIAL
    339. MARKET ANALYSIS BY APPLICATION
    340. MARKET ANALYSIS BY REGIONAL
    341. MARKET ANALYSIS BY SERVICE TYPE
    342. SERVICES MARKET ANALYSIS BY END USE INDUSTRY
    343. AND PROCESS SERVICES MARKET ANALYSIS BY PIPELINE MATERIAL
    344. PIPELINE AND PROCESS SERVICES MARKET ANALYSIS BY APPLICATION
    345. PIPELINE AND PROCESS SERVICES MARKET ANALYSIS BY REGIONAL
    346. OF APAC PIPELINE AND PROCESS SERVICES MARKET ANALYSIS BY SERVICE TYPE
    347. REST OF APAC PIPELINE AND PROCESS SERVICES MARKET ANALYSIS BY END USE INDUSTRY
    348. MATERIAL
    349. BY APPLICATION
    350. ANALYSIS BY REGIONAL
    351. MARKET ANALYSIS
    352. BY SERVICE TYPE
    353. BY END USE INDUSTRY
    354. ANALYSIS BY PIPELINE MATERIAL
    355. MARKET ANALYSIS BY APPLICATION
    356. MARKET ANALYSIS BY REGIONAL
    357. MARKET ANALYSIS BY SERVICE TYPE
    358. MARKET ANALYSIS BY END USE INDUSTRY
    359. SERVICES MARKET ANALYSIS BY PIPELINE MATERIAL
    360. PROCESS SERVICES MARKET ANALYSIS BY APPLICATION
    361. AND PROCESS SERVICES MARKET ANALYSIS BY REGIONAL
    362. AND PROCESS SERVICES MARKET ANALYSIS BY SERVICE TYPE
    363. PIPELINE AND PROCESS SERVICES MARKET ANALYSIS BY END USE INDUSTRY
    364. ARGENTINA PIPELINE AND PROCESS SERVICES MARKET ANALYSIS BY PIPELINE MATERIAL
    365. BY SERVICE TYPE
    366. MARKET ANALYSIS BY END USE INDUSTRY
    367. AND PROCESS SERVICES MARKET ANALYSIS BY PIPELINE MATERIAL
    368. OF SOUTH AMERICA PIPELINE AND PROCESS SERVICES MARKET ANALYSIS BY APPLICATION
    369. BY REGIONAL
    370. SERVICE TYPE
    371. ANALYSIS BY END USE INDUSTRY
    372. SERVICES MARKET ANALYSIS BY PIPELINE MATERIAL
    373. AND PROCESS SERVICES MARKET ANALYSIS BY APPLICATION
    374. PIPELINE AND PROCESS SERVICES MARKET ANALYSIS BY REGIONAL
    375. AFRICA PIPELINE AND PROCESS SERVICES MARKET ANALYSIS BY SERVICE TYPE
    376. SOUTH AFRICA PIPELINE AND PROCESS SERVICES MARKET ANALYSIS BY END USE INDUSTRY
    377. PIPELINE MATERIAL
    378. ANALYSIS BY APPLICATION
    379. MARKET ANALYSIS BY REGIONAL
    380. MARKET ANALYSIS BY SERVICE TYPE
    381. SERVICES MARKET ANALYSIS BY END USE INDUSTRY
    382. AND PROCESS SERVICES MARKET ANALYSIS BY PIPELINE MATERIAL
    383. OF MEA PIPELINE AND PROCESS SERVICES MARKET ANALYSIS BY APPLICATION
    384. REST OF MEA PIPELINE AND PROCESS SERVICES MARKET ANALYSIS BY REGIONAL
    385. KEY BUYING CRITERIA OF PIPELINE AND PROCESS SERVICES MARKET
    386. RESEARCH PROCESS OF MRFR
    387. SERVICES MARKET
    388. SERVICES MARKET
    389. SERVICES MARKET
    390. MARKET
    391. (% SHARE)
    392. TYPE, 2019 TO 2032 (USD Billions)
    393. MARKET, BY END USE INDUSTRY, 2024 (% SHARE)
    394. SERVICES MARKET, BY END USE INDUSTRY, 2019 TO 2032 (USD Billions)
    395. PIPELINE AND PROCESS SERVICES MARKET, BY PIPELINE MATERIAL, 2024 (% SHARE)
    396. PIPELINE AND PROCESS SERVICES MARKET, BY PIPELINE MATERIAL, 2019 TO 2032 (USD
    397. Billions)
    398. (% SHARE)
    399. TO 2032 (USD Billions)
    400. BY REGIONAL, 2024 (% SHARE)
    401. BY REGIONAL, 2019 TO 2032 (USD Billions)
    402. COMPETITORS

    Pipeline and Process Services Market Segmentation


    • Pipeline and Process Services Market By Service Type (USD Billion, 2019-2032)
      • Pipeline Inspection Services
      • Pipeline Testing Services
      • Pipeline Maintenance Services
      • Pipeline Construction Services
      • Process Services


    • Pipeline and Process Services Market By End Use Industry (USD Billion, 2019-2032)
      • Oil and Gas
      • Chemical
      • Water and Wastewater
      • Power Generation
      • Food and Beverage


    • Pipeline and Process Services Market By Pipeline Material (USD Billion, 2019-2032)
      • Steel
      • Plastic
      • Copper
      • Composite
      • Concrete


    • Pipeline and Process Services Market By Application (USD Billion, 2019-2032)
      • Transport
      • Storage
      • Distribution


    • Pipeline and Process Services Market By Regional (USD Billion, 2019-2032)
      • North America
      • Europe
      • South America
      • Asia Pacific
      • Middle East and Africa


    Pipeline and Process Services Market Regional Outlook (USD Billion, 2019-2032)


    • North America Outlook (USD Billion, 2019-2032)
      • North America Pipeline and Process Services Market by Service Type
        • Pipeline Inspection Services
        • Pipeline Testing Services
        • Pipeline Maintenance Services
        • Pipeline Construction Services
        • Process Services
      • North America Pipeline and Process Services Market by End Use Industry Type
        • Oil and Gas
        • Chemical
        • Water and Wastewater
        • Power Generation
        • Food and Beverage
      • North America Pipeline and Process Services Market by Pipeline Material Type
        • Steel
        • Plastic
        • Copper
        • Composite
        • Concrete
      • North America Pipeline and Process Services Market by Application Type
        • Transport
        • Storage
        • Distribution
      • North America Pipeline and Process Services Market by Regional Type
        • US
        • Canada
      • US Outlook (USD Billion, 2019-2032)
      • US Pipeline and Process Services Market by Service Type
        • Pipeline Inspection Services
        • Pipeline Testing Services
        • Pipeline Maintenance Services
        • Pipeline Construction Services
        • Process Services
      • US Pipeline and Process Services Market by End Use Industry Type
        • Oil and Gas
        • Chemical
        • Water and Wastewater
        • Power Generation
        • Food and Beverage
      • US Pipeline and Process Services Market by Pipeline Material Type
        • Steel
        • Plastic
        • Copper
        • Composite
        • Concrete
      • US Pipeline and Process Services Market by Application Type
        • Transport
        • Storage
        • Distribution
      • CANADA Outlook (USD Billion, 2019-2032)
      • CANADA Pipeline and Process Services Market by Service Type
        • Pipeline Inspection Services
        • Pipeline Testing Services
        • Pipeline Maintenance Services
        • Pipeline Construction Services
        • Process Services
      • CANADA Pipeline and Process Services Market by End Use Industry Type
        • Oil and Gas
        • Chemical
        • Water and Wastewater
        • Power Generation
        • Food and Beverage
      • CANADA Pipeline and Process Services Market by Pipeline Material Type
        • Steel
        • Plastic
        • Copper
        • Composite
        • Concrete
      • CANADA Pipeline and Process Services Market by Application Type
        • Transport
        • Storage
        • Distribution
      • Europe Outlook (USD Billion, 2019-2032)
        • Europe Pipeline and Process Services Market by Service Type
          • Pipeline Inspection Services
          • Pipeline Testing Services
          • Pipeline Maintenance Services
          • Pipeline Construction Services
          • Process Services
        • Europe Pipeline and Process Services Market by End Use Industry Type
          • Oil and Gas
          • Chemical
          • Water and Wastewater
          • Power Generation
          • Food and Beverage
        • Europe Pipeline and Process Services Market by Pipeline Material Type
          • Steel
          • Plastic
          • Copper
          • Composite
          • Concrete
        • Europe Pipeline and Process Services Market by Application Type
          • Transport
          • Storage
          • Distribution
        • Europe Pipeline and Process Services Market by Regional Type
          • Germany
          • UK
          • France
          • Russia
          • Italy
          • Spain
          • Rest of Europe
        • GERMANY Outlook (USD Billion, 2019-2032)
        • GERMANY Pipeline and Process Services Market by Service Type
          • Pipeline Inspection Services
          • Pipeline Testing Services
          • Pipeline Maintenance Services
          • Pipeline Construction Services
          • Process Services
        • GERMANY Pipeline and Process Services Market by End Use Industry Type
          • Oil and Gas
          • Chemical
          • Water and Wastewater
          • Power Generation
          • Food and Beverage
        • GERMANY Pipeline and Process Services Market by Pipeline Material Type
          • Steel
          • Plastic
          • Copper
          • Composite
          • Concrete
        • GERMANY Pipeline and Process Services Market by Application Type
          • Transport
          • Storage
          • Distribution
        • UK Outlook (USD Billion, 2019-2032)
        • UK Pipeline and Process Services Market by Service Type
          • Pipeline Inspection Services
          • Pipeline Testing Services
          • Pipeline Maintenance Services
          • Pipeline Construction Services
          • Process Services
        • UK Pipeline and Process Services Market by End Use Industry Type
          • Oil and Gas
          • Chemical
          • Water and Wastewater
          • Power Generation
          • Food and Beverage
        • UK Pipeline and Process Services Market by Pipeline Material Type
          • Steel
          • Plastic
          • Copper
          • Composite
          • Concrete
        • UK Pipeline and Process Services Market by Application Type
          • Transport
          • Storage
          • Distribution
        • FRANCE Outlook (USD Billion, 2019-2032)
        • FRANCE Pipeline and Process Services Market by Service Type
          • Pipeline Inspection Services
          • Pipeline Testing Services
          • Pipeline Maintenance Services
          • Pipeline Construction Services
          • Process Services
        • FRANCE Pipeline and Process Services Market by End Use Industry Type
          • Oil and Gas
          • Chemical
          • Water and Wastewater
          • Power Generation
          • Food and Beverage
        • FRANCE Pipeline and Process Services Market by Pipeline Material Type
          • Steel
          • Plastic
          • Copper
          • Composite
          • Concrete
        • FRANCE Pipeline and Process Services Market by Application Type
          • Transport
          • Storage
          • Distribution
        • RUSSIA Outlook (USD Billion, 2019-2032)
        • RUSSIA Pipeline and Process Services Market by Service Type
          • Pipeline Inspection Services
          • Pipeline Testing Services
          • Pipeline Maintenance Services
          • Pipeline Construction Services
          • Process Services
        • RUSSIA Pipeline and Process Services Market by End Use Industry Type
          • Oil and Gas
          • Chemical
          • Water and Wastewater
          • Power Generation
          • Food and Beverage
        • RUSSIA Pipeline and Process Services Market by Pipeline Material Type
          • Steel
          • Plastic
          • Copper
          • Composite
          • Concrete
        • RUSSIA Pipeline and Process Services Market by Application Type
          • Transport
          • Storage
          • Distribution
        • ITALY Outlook (USD Billion, 2019-2032)
        • ITALY Pipeline and Process Services Market by Service Type
          • Pipeline Inspection Services
          • Pipeline Testing Services
          • Pipeline Maintenance Services
          • Pipeline Construction Services
          • Process Services
        • ITALY Pipeline and Process Services Market by End Use Industry Type
          • Oil and Gas
          • Chemical
          • Water and Wastewater
          • Power Generation
          • Food and Beverage
        • ITALY Pipeline and Process Services Market by Pipeline Material Type
          • Steel
          • Plastic
          • Copper
          • Composite
          • Concrete
        • ITALY Pipeline and Process Services Market by Application Type
          • Transport
          • Storage
          • Distribution
        • SPAIN Outlook (USD Billion, 2019-2032)
        • SPAIN Pipeline and Process Services Market by Service Type
          • Pipeline Inspection Services
          • Pipeline Testing Services
          • Pipeline Maintenance Services
          • Pipeline Construction Services
          • Process Services
        • SPAIN Pipeline and Process Services Market by End Use Industry Type
          • Oil and Gas
          • Chemical
          • Water and Wastewater
          • Power Generation
          • Food and Beverage
        • SPAIN Pipeline and Process Services Market by Pipeline Material Type
          • Steel
          • Plastic
          • Copper
          • Composite
          • Concrete
        • SPAIN Pipeline and Process Services Market by Application Type
          • Transport
          • Storage
          • Distribution
        • REST OF EUROPE Outlook (USD Billion, 2019-2032)
        • REST OF EUROPE Pipeline and Process Services Market by Service Type
          • Pipeline Inspection Services
          • Pipeline Testing Services
          • Pipeline Maintenance Services
          • Pipeline Construction Services
          • Process Services
        • REST OF EUROPE Pipeline and Process Services Market by End Use Industry Type
          • Oil and Gas
          • Chemical
          • Water and Wastewater
          • Power Generation
          • Food and Beverage
        • REST OF EUROPE Pipeline and Process Services Market by Pipeline Material Type
          • Steel
          • Plastic
          • Copper
          • Composite
          • Concrete
        • REST OF EUROPE Pipeline and Process Services Market by Application Type
          • Transport
          • Storage
          • Distribution
        • APAC Outlook (USD Billion, 2019-2032)
          • APAC Pipeline and Process Services Market by Service Type
            • Pipeline Inspection Services
            • Pipeline Testing Services
            • Pipeline Maintenance Services
            • Pipeline Construction Services
            • Process Services
          • APAC Pipeline and Process Services Market by End Use Industry Type
            • Oil and Gas
            • Chemical
            • Water and Wastewater
            • Power Generation
            • Food and Beverage
          • APAC Pipeline and Process Services Market by Pipeline Material Type
            • Steel
            • Plastic
            • Copper
            • Composite
            • Concrete
          • APAC Pipeline and Process Services Market by Application Type
            • Transport
            • Storage
            • Distribution
          • APAC Pipeline and Process Services Market by Regional Type
            • China
            • India
            • Japan
            • South Korea
            • Malaysia
            • Thailand
            • Indonesia
            • Rest of APAC
          • CHINA Outlook (USD Billion, 2019-2032)
          • CHINA Pipeline and Process Services Market by Service Type
            • Pipeline Inspection Services
            • Pipeline Testing Services
            • Pipeline Maintenance Services
            • Pipeline Construction Services
            • Process Services
          • CHINA Pipeline and Process Services Market by End Use Industry Type
            • Oil and Gas
            • Chemical
            • Water and Wastewater
            • Power Generation
            • Food and Beverage
          • CHINA Pipeline and Process Services Market by Pipeline Material Type
            • Steel
            • Plastic
            • Copper
            • Composite
            • Concrete
          • CHINA Pipeline and Process Services Market by Application Type
            • Transport
            • Storage
            • Distribution
          • INDIA Outlook (USD Billion, 2019-2032)
          • INDIA Pipeline and Process Services Market by Service Type
            • Pipeline Inspection Services
            • Pipeline Testing Services
            • Pipeline Maintenance Services
            • Pipeline Construction Services
            • Process Services
          • INDIA Pipeline and Process Services Market by End Use Industry Type
            • Oil and Gas
            • Chemical
            • Water and Wastewater
            • Power Generation
            • Food and Beverage
          • INDIA Pipeline and Process Services Market by Pipeline Material Type
            • Steel
            • Plastic
            • Copper
            • Composite
            • Concrete
          • INDIA Pipeline and Process Services Market by Application Type
            • Transport
            • Storage
            • Distribution
          • JAPAN Outlook (USD Billion, 2019-2032)
          • JAPAN Pipeline and Process Services Market by Service Type
            • Pipeline Inspection Services
            • Pipeline Testing Services
            • Pipeline Maintenance Services
            • Pipeline Construction Services
            • Process Services
          • JAPAN Pipeline and Process Services Market by End Use Industry Type
            • Oil and Gas
            • Chemical
            • Water and Wastewater
            • Power Generation
            • Food and Beverage
          • JAPAN Pipeline and Process Services Market by Pipeline Material Type
            • Steel
            • Plastic
            • Copper
            • Composite
            • Concrete
          • JAPAN Pipeline and Process Services Market by Application Type
            • Transport
            • Storage
            • Distribution
          • SOUTH KOREA Outlook (USD Billion, 2019-2032)
          • SOUTH KOREA Pipeline and Process Services Market by Service Type
            • Pipeline Inspection Services
            • Pipeline Testing Services
            • Pipeline Maintenance Services
            • Pipeline Construction Services
            • Process Services
          • SOUTH KOREA Pipeline and Process Services Market by End Use Industry Type
            • Oil and Gas
            • Chemical
            • Water and Wastewater
            • Power Generation
            • Food and Beverage
          • SOUTH KOREA Pipeline and Process Services Market by Pipeline Material Type
            • Steel
            • Plastic
            • Copper
            • Composite
            • Concrete
          • SOUTH KOREA Pipeline and Process Services Market by Application Type
            • Transport
            • Storage
            • Distribution
          • MALAYSIA Outlook (USD Billion, 2019-2032)
          • MALAYSIA Pipeline and Process Services Market by Service Type
            • Pipeline Inspection Services
            • Pipeline Testing Services
            • Pipeline Maintenance Services
            • Pipeline Construction Services
            • Process Services
          • MALAYSIA Pipeline and Process Services Market by End Use Industry Type
            • Oil and Gas
            • Chemical
            • Water and Wastewater
            • Power Generation
            • Food and Beverage
          • MALAYSIA Pipeline and Process Services Market by Pipeline Material Type
            • Steel
            • Plastic
            • Copper
            • Composite
            • Concrete
          • MALAYSIA Pipeline and Process Services Market by Application Type
            • Transport
            • Storage
            • Distribution
          • THAILAND Outlook (USD Billion, 2019-2032)
          • THAILAND Pipeline and Process Services Market by Service Type
            • Pipeline Inspection Services
            • Pipeline Testing Services
            • Pipeline Maintenance Services
            • Pipeline Construction Services
            • Process Services
          • THAILAND Pipeline and Process Services Market by End Use Industry Type
            • Oil and Gas
            • Chemical
            • Water and Wastewater
            • Power Generation
            • Food and Beverage
          • THAILAND Pipeline and Process Services Market by Pipeline Material Type
            • Steel
            • Plastic
            • Copper
            • Composite
            • Concrete
          • THAILAND Pipeline and Process Services Market by Application Type
            • Transport
            • Storage
            • Distribution
          • INDONESIA Outlook (USD Billion, 2019-2032)
          • INDONESIA Pipeline and Process Services Market by Service Type
            • Pipeline Inspection Services
            • Pipeline Testing Services
            • Pipeline Maintenance Services
            • Pipeline Construction Services
            • Process Services
          • INDONESIA Pipeline and Process Services Market by End Use Industry Type
            • Oil and Gas
            • Chemical
            • Water and Wastewater
            • Power Generation
            • Food and Beverage
          • INDONESIA Pipeline and Process Services Market by Pipeline Material Type
            • Steel
            • Plastic
            • Copper
            • Composite
            • Concrete
          • INDONESIA Pipeline and Process Services Market by Application Type
            • Transport
            • Storage
            • Distribution
          • REST OF APAC Outlook (USD Billion, 2019-2032)
          • REST OF APAC Pipeline and Process Services Market by Service Type
            • Pipeline Inspection Services
            • Pipeline Testing Services
            • Pipeline Maintenance Services
            • Pipeline Construction Services
            • Process Services
          • REST OF APAC Pipeline and Process Services Market by End Use Industry Type
            • Oil and Gas
            • Chemical
            • Water and Wastewater
            • Power Generation
            • Food and Beverage
          • REST OF APAC Pipeline and Process Services Market by Pipeline Material Type
            • Steel
            • Plastic
            • Copper
            • Composite
            • Concrete
          • REST OF APAC Pipeline and Process Services Market by Application Type
            • Transport
            • Storage
            • Distribution
          • South America Outlook (USD Billion, 2019-2032)
            • South America Pipeline and Process Services Market by Service Type
              • Pipeline Inspection Services
              • Pipeline Testing Services
              • Pipeline Maintenance Services
              • Pipeline Construction Services
              • Process Services
            • South America Pipeline and Process Services Market by End Use Industry Type
              • Oil and Gas
              • Chemical
              • Water and Wastewater
              • Power Generation
              • Food and Beverage
            • South America Pipeline and Process Services Market by Pipeline Material Type
              • Steel
              • Plastic
              • Copper
              • Composite
              • Concrete
            • South America Pipeline and Process Services Market by Application Type
              • Transport
              • Storage
              • Distribution
            • South America Pipeline and Process Services Market by Regional Type
              • Brazil
              • Mexico
              • Argentina
              • Rest of South America
            • BRAZIL Outlook (USD Billion, 2019-2032)
            • BRAZIL Pipeline and Process Services Market by Service Type
              • Pipeline Inspection Services
              • Pipeline Testing Services
              • Pipeline Maintenance Services
              • Pipeline Construction Services
              • Process Services
            • BRAZIL Pipeline and Process Services Market by End Use Industry Type
              • Oil and Gas
              • Chemical
              • Water and Wastewater
              • Power Generation
              • Food and Beverage
            • BRAZIL Pipeline and Process Services Market by Pipeline Material Type
              • Steel
              • Plastic
              • Copper
              • Composite
              • Concrete
            • BRAZIL Pipeline and Process Services Market by Application Type
              • Transport
              • Storage
              • Distribution
            • MEXICO Outlook (USD Billion, 2019-2032)
            • MEXICO Pipeline and Process Services Market by Service Type
              • Pipeline Inspection Services
              • Pipeline Testing Services
              • Pipeline Maintenance Services
              • Pipeline Construction Services
              • Process Services
            • MEXICO Pipeline and Process Services Market by End Use Industry Type
              • Oil and Gas
              • Chemical
              • Water and Wastewater
              • Power Generation
              • Food and Beverage
            • MEXICO Pipeline and Process Services Market by Pipeline Material Type
              • Steel
              • Plastic
              • Copper
              • Composite
              • Concrete
            • MEXICO Pipeline and Process Services Market by Application Type
              • Transport
              • Storage
              • Distribution
            • ARGENTINA Outlook (USD Billion, 2019-2032)
            • ARGENTINA Pipeline and Process Services Market by Service Type
              • Pipeline Inspection Services
              • Pipeline Testing Services
              • Pipeline Maintenance Services
              • Pipeline Construction Services
              • Process Services
            • ARGENTINA Pipeline and Process Services Market by End Use Industry Type
              • Oil and Gas
              • Chemical
              • Water and Wastewater
              • Power Generation
              • Food and Beverage
            • ARGENTINA Pipeline and Process Services Market by Pipeline Material Type
              • Steel
              • Plastic
              • Copper
              • Composite
              • Concrete
            • ARGENTINA Pipeline and Process Services Market by Application Type
              • Transport
              • Storage
              • Distribution
            • REST OF SOUTH AMERICA Outlook (USD Billion, 2019-2032)
            • REST OF SOUTH AMERICA Pipeline and Process Services Market by Service Type
              • Pipeline Inspection Services
              • Pipeline Testing Services
              • Pipeline Maintenance Services
              • Pipeline Construction Services
              • Process Services
            • REST OF SOUTH AMERICA Pipeline and Process Services Market by End Use Industry Type
              • Oil and Gas
              • Chemical
              • Water and Wastewater
              • Power Generation
              • Food and Beverage
            • REST OF SOUTH AMERICA Pipeline and Process Services Market by Pipeline Material Type
              • Steel
              • Plastic
              • Copper
              • Composite
              • Concrete
            • REST OF SOUTH AMERICA Pipeline and Process Services Market by Application Type
              • Transport
              • Storage
              • Distribution
            • MEA Outlook (USD Billion, 2019-2032)
              • MEA Pipeline and Process Services Market by Service Type
                • Pipeline Inspection Services
                • Pipeline Testing Services
                • Pipeline Maintenance Services
                • Pipeline Construction Services
                • Process Services
              • MEA Pipeline and Process Services Market by End Use Industry Type
                • Oil and Gas
                • Chemical
                • Water and Wastewater
                • Power Generation
                • Food and Beverage
              • MEA Pipeline and Process Services Market by Pipeline Material Type
                • Steel
                • Plastic
                • Copper
                • Composite
                • Concrete
              • MEA Pipeline and Process Services Market by Application Type
                • Transport
                • Storage
                • Distribution
              • MEA Pipeline and Process Services Market by Regional Type
                • GCC Countries
                • South Africa
                • Rest of MEA
              • GCC COUNTRIES Outlook (USD Billion, 2019-2032)
              • GCC COUNTRIES Pipeline and Process Services Market by Service Type
                • Pipeline Inspection Services
                • Pipeline Testing Services
                • Pipeline Maintenance Services
                • Pipeline Construction Services
                • Process Services
              • GCC COUNTRIES Pipeline and Process Services Market by End Use Industry Type
                • Oil and Gas
                • Chemical
                • Water and Wastewater
                • Power Generation
                • Food and Beverage
              • GCC COUNTRIES Pipeline and Process Services Market by Pipeline Material Type
                • Steel
                • Plastic
                • Copper
                • Composite
                • Concrete
              • GCC COUNTRIES Pipeline and Process Services Market by Application Type
                • Transport
                • Storage
                • Distribution
              • SOUTH AFRICA Outlook (USD Billion, 2019-2032)
              • SOUTH AFRICA Pipeline and Process Services Market by Service Type
                • Pipeline Inspection Services
                • Pipeline Testing Services
                • Pipeline Maintenance Services
                • Pipeline Construction Services
                • Process Services
              • SOUTH AFRICA Pipeline and Process Services Market by End Use Industry Type
                • Oil and Gas
                • Chemical
                • Water and Wastewater
                • Power Generation
                • Food and Beverage
              • SOUTH AFRICA Pipeline and Process Services Market by Pipeline Material Type
                • Steel
                • Plastic
                • Copper
                • Composite
                • Concrete
              • SOUTH AFRICA Pipeline and Process Services Market by Application Type
                • Transport
                • Storage
                • Distribution
              • REST OF MEA Outlook (USD Billion, 2019-2032)
              • REST OF MEA Pipeline and Process Services Market by Service Type
                • Pipeline Inspection Services
                • Pipeline Testing Services
                • Pipeline Maintenance Services
                • Pipeline Construction Services
                • Process Services
              • REST OF MEA Pipeline and Process Services Market by End Use Industry Type
                • Oil and Gas
                • Chemical
                • Water and Wastewater
                • Power Generation
                • Food and Beverage
              • REST OF MEA Pipeline and Process Services Market by Pipeline Material Type
                • Steel
                • Plastic
                • Copper
                • Composite
                • Concrete
              • REST OF MEA Pipeline and Process Services Market by Application Type
                • Transport
                • Storage
                • Distribution
    Pipeline & Process Services Market Research Report - Global Forecast till 2032 Infographic
    Free Sample Request

    Kindly complete the form below to receive a free sample of this Report

    Customer Strories

    “I am very pleased with how market segments have been defined in a relevant way for my purposes (such as "Portable Freezers & refrigerators" and "last-mile"). In general the report is well structured. Thanks very much for your efforts.”

    Victoria Milne Founder
    Case Study

    Chemicals and Materials