• Cat-intel
  • MedIntelliX
  • Resources
  • About Us
  • Request Free Sample ×

    Kindly complete the form below to receive a free sample of this Report

    Leading companies partner with us for data-driven Insights

    clients tt-cursor

    Pigging Service Market

    ID: MRFR/E&P/39885-HCR
    128 Pages
    Priya Nagrale
    September 2025

    Pigging Service Market Research Report By Service Type (Utility Pigging, Cleaning Pigging, Inspection Pigging, Sealing Pigging), By Application (Oil and Gas, Water and Wastewater, Chemical Processing, Food and Beverage), By Pig Type (Batched Pigs, Smart Pigs, Cup Pigs, Scraper Pigs), By End Use (Upstream, Midstream, Downstream) and By Regional (North America, Europe, South America, Asia Pacific, Middle East and Africa) - Forecast to 2035

    Share:
    Download PDF ×

    We do not share your information with anyone. However, we may send you emails based on your report interest from time to time. You may contact us at any time to opt-out.

    Pigging Service Market Research Report — Global Forecast till 2035 Infographic
    Purchase Options
    $ 4,950.0
    $ 5,950.0
    $ 7,250.0
    Table of Contents

    Pigging Service Market Summary

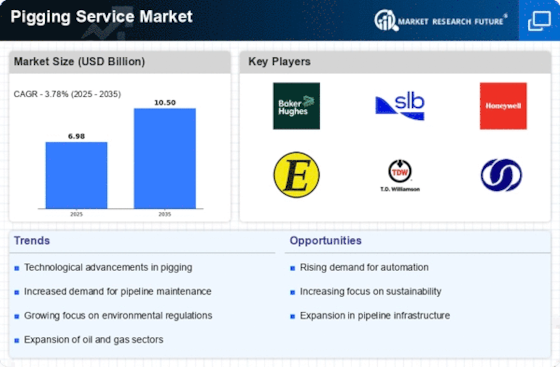
    The Global Pigging Service Market is projected to grow from 6.98 USD Billion in 2024 to 10.5 USD Billion by 2035.

    Key Market Trends & Highlights

    Pigging Service Key Trends and Highlights

    • The market is expected to experience a compound annual growth rate (CAGR) of 3.78 percent from 2025 to 2035.
    • By 2035, the market valuation is anticipated to reach 10.5 USD Billion, reflecting a steady growth trajectory.
    • In 2024, the market is valued at 6.98 USD Billion, indicating a robust starting point for future expansion.
    • Growing adoption of pigging services due to increased pipeline maintenance requirements is a major market driver.

    Market Size & Forecast

    2024 Market Size 6.98 (USD Billion)
    2035 Market Size 10.5 (USD Billion)
    CAGR (2025-2035) 3.78%

    Major Players

    Pure Technologies, Baker Hughes, Cvg Logics, Pipeline Integrity Services, Enduro Pipeline Services, SGS, Propipe, NexTier Oilfield Solutions, Matrix Service Company, Ferguson, TDW, Hak, NDT Global, Cartledge Engineering, Gerard Daniel Worldwide

    Pigging Service Market Trends

    The growth of the Pigging Service Market is driven by the increasing need for infrastructure maintenance and pipeline integrity in various industries, including oil and gas, water treatment, and food and beverage. The rising demand for efficient and effective cleaning of pipelines is motivating operators to adopt pigging services. These services not only enhance operational efficiency but also reduce downtime and minimize the risk of leaks and failures.

    Additionally, regulatory pressure for safety and environmental compliance is encouraging companies to invest in pigging solutions.  There are several opportunities available in the pigging service market that businesses can capture.Innovations such as smart pigging technology can be explored to enhance data collection and pipeline monitoring. The expanding use of pigging in emerging economies, alongside the push for modernization of existing pipelines, presents significant growth potential. Furthermore, the development of more specialized and effective pigs tailored for different media and pipeline configurations can open new avenues for service providers.

    In recent times, the emphasis on sustainability and efficiency has influenced trends within the market. Companies are increasingly focusing on minimizing waste and energy consumption during cleaning processes, aligning their operations with global sustainability goals.The adoption of automated and robotic pigging systems is also on the rise, reflecting the trend towards digital transformation in pipeline maintenance. Overall, the market is adapting to technological advancements while meeting the evolving needs of customers looking for reliable and efficient solutions. The ongoing changes within the global energy landscape are set to shape the future dynamics of the pigging service market.

    The ongoing evolution of pipeline infrastructure and the increasing emphasis on operational efficiency appear to drive the demand for pigging services across various sectors.

    U.S. Department of Energy

    Pigging Service Market Drivers

    Market Growth Projections

    Growing Demand for Pipeline Maintenance

    The Global Pigging Service Market Industry is experiencing a surge in demand for pipeline maintenance solutions. As aging infrastructure becomes more prevalent, operators are increasingly turning to pigging services to ensure the integrity and efficiency of their pipelines. This trend is particularly evident in regions with extensive oil and gas networks, where regular maintenance is crucial to prevent leaks and enhance operational efficiency. The market is projected to reach 6.98 USD Billion in 2024, reflecting a growing recognition of the importance of proactive maintenance strategies. Consequently, the adoption of pigging services is likely to expand as companies seek to mitigate risks associated with pipeline failures.

    Rising Investments in Oil and Gas Sector

    The Global Pigging Service Market Industry is benefiting from rising investments in the oil and gas sector. As exploration and production activities expand, the need for efficient pipeline management becomes paramount. Companies are increasingly recognizing the value of pigging services in optimizing their operations and ensuring the safe transportation of hydrocarbons. This trend is particularly pronounced in emerging markets, where new projects are being initiated to meet growing energy demands. The influx of capital into the oil and gas sector is likely to bolster the demand for pigging services, contributing to the overall market growth and enhancing the industry's resilience.

    Regulatory Compliance and Safety Standards

    Regulatory compliance plays a pivotal role in driving the Global Pigging Service Market Industry. Governments worldwide are implementing stringent safety and environmental regulations that mandate regular inspections and maintenance of pipelines. This regulatory landscape compels operators to adopt pigging services as a means to adhere to these standards. For instance, in regions such as North America and Europe, regulatory bodies are increasingly emphasizing the need for pipeline integrity management. As a result, the demand for pigging services is expected to rise, contributing to the market's growth trajectory, which is anticipated to reach 10.5 USD Billion by 2035.

    Technological Advancements in Pigging Solutions

    Technological advancements are significantly influencing the Global Pigging Service Market Industry. Innovations in pigging technology, such as the development of smart pigs equipped with advanced sensors and data analytics capabilities, are enhancing the efficiency and effectiveness of pipeline inspections. These technological improvements allow for real-time monitoring and precise data collection, enabling operators to make informed decisions regarding maintenance and repairs. As the industry embraces these advancements, the market is likely to witness increased adoption of pigging services, further driving growth. The anticipated CAGR of 3.78% from 2025 to 2035 underscores the potential for continued innovation in this sector.

    Environmental Concerns and Sustainability Initiatives

    Environmental concerns are increasingly shaping the Global Pigging Service Market Industry. With growing awareness of the environmental impact of pipeline leaks and spills, operators are prioritizing sustainability initiatives that include regular maintenance and monitoring. Pigging services play a crucial role in minimizing environmental risks by ensuring the integrity of pipelines and preventing potential leaks. As companies strive to align with sustainability goals and reduce their carbon footprint, the adoption of pigging services is expected to rise. This shift towards environmentally responsible practices is likely to drive market growth, reflecting a broader trend towards sustainability in the energy sector.

    Market Segment Insights

    Pigging Service Market Segment Insights:

    Pigging Service Market Segment Insights:

    Pigging Service Market Service Type Insights   

    Pigging Service Market Service Type Insights   

    The Pigging Service Market has witnessed notable growth, characterized by its diverse service type segment, which comprises Utility Pigging, Cleaning Pigging, Inspection Pigging, and Sealing Pigging. As of 2024, the total market is projected to reach a value of 6.98 USD Billion, reflecting the increasing demand for effective solutions in pipeline maintenance and operations. Among these service types, Utility Pigging holds a significant position, with a market valuation of 2.09 USD Billion, and is expected to grow to 3.12 USD Billion by 2035.

    This segment is crucial as it plays a key role in ensuring the efficient transportation of liquids and gases, serving various sectors, including oil and gas, water, and chemicals, thus demonstrating its majority holding within the market.Cleaning Pigging follows closely, with a valuation of 2.19 USD Billion in 2024, projected to rise to 3.26 USD Billion by 2035. This segment is essential for maintaining pipeline integrity and preventing blockages, which can lead to operational failures and increased maintenance costs.

    The significant growth anticipated in this area highlights the growing recognition of the importance of pipeline cleanliness and efficiency in daily operations.Inspection Pigging shows resilience in the market with a projected valuation of 1.93 USD Billion in 2024, increasing to 2.86 USD Billion by 2035. This segment is vital for ensuring safety and compliance in pipeline operations, allowing operators to detect anomalies or structural integrity issues before they escalate.

    The essential nature of this service contributes to its steady growth and positions it as a key player in enhancing operational reliability and safety.Conversely, Sealing Pigging is forecasted to decline from a value of 1.77 USD Billion in 2024 to 1.26 USD Billion by 2035. This decline may reflect advancements in sealing technology or changing industry requirements, which could be impacting its demand in comparison to the other service types.

    Pigging Service Market Application Insights   

    Pigging Service Market Application Insights   

    The Pigging Service Market is projected to see significant growth in its Application segment, with the overall market valued at approximately 6.98 USD billion in 2024. The market is defined by its diverse applications across various industries, notably in sectors such as Oil and Gas, Water and Wastewater, Chemical Processing, and Food and Beverage. The Oil and Gas segment plays a crucial role, as it involves the maintenance of pipelines essential for transport and production processes.

    Similarly, Water and Wastewater management have become increasingly vital, driven by regulatory standards and the need for effective waste management solutions.Chemical Processing stands out due to the necessity of maintaining system integrity and preventing contamination, while the Food and Beverage sector focuses on cleanliness and hygiene to meet safety regulations. Each segment contributes significantly to the revenue stream of the Pigging Service Market, featuring unique drivers such as technological advancements and rising demand for efficient pipeline management.

    As these industries continue to evolve, the expansion of market opportunities remains fueled by a growing emphasis on sustainability and environmental safety.The Pigging Service Market data reflects these ongoing trends, underlining the sector’s importance in enhancing operational efficiency across applications.

    Pigging Service Market Pig Type Insights   

    Pigging Service Market Pig Type Insights   

    The Pigging Service Market is projected to reach a value of 6.98 USD Billion by 2024, reflecting the growing importance of efficient pipeline maintenance and inspection. Within this market, the Pig Type segment is crucial, comprising various forms of pigs such as Batched Pigs, Smart Pigs, Cup Pigs, and Scraper Pigs. Each type serves distinct functions, with Smart Pigs gaining traction due to their advanced technologies that enable real-time data collection for better pipeline integrity management.

    Batched Pigs are predominantly used for separating different products in pipelines, ensuring quality and efficiency in transfer operations.Scraper Pigs play a significant role in cleaning pipelines to prevent blockages, thereby safeguarding operational continuity. The varying functions of these pigs contribute to the overall market dynamics, stimulating further investment and development in pigging technologies. As awareness of the need for pipeline maintenance grows amidst increasing industrial demand, these types are poised to lead the market's growth.

    The evolving landscape of the Pigging Service Market demonstrates significant opportunities for innovation and expansion within the Pig Type segment, further supported by the projected market growth.

    Pigging Service Market End Use Insights   

    Pigging Service Market End Use Insights   

    The Pigging Service Market is segmented into various end-use categories, primarily focusing on Upstream, Midstream, and Downstream applications. By 2024, the overall market is projected to achieve a valuation of $6.98 billion, reflecting a steady demand in the pigging services sector across these end-use applications.

    The Upstream segment plays a critical role in maintaining operational efficiency, as it often involves the extraction and transportation of crude oil and natural gas, making effective pigging services essential for pipeline integrity and flow assurance.Midstream operations, encompassing the transportation and storage of these resources, rely heavily on pigging services for ensuring pipeline cleanliness and preventing blockages. The Downstream segment, which deals with refining and distribution, also significantly benefits from pigging operations, optimizing product quality and reducing maintenance costs.

    With the market constantly evolving, trends such as technological advancements and increasing operational efficiency will shape the dynamics of the Pigging Service Market, offering both challenges and opportunities in the industry.Keywords like 'Pigging Service Market revenue', 'Pigging Service Market segmentation', 'Pigging Service Market data', 'Pigging Service Market Statistics', and 'Pigging Service Market industry' will enhance the visibility of this information for interested stakeholders.

    Get more detailed insights about Pigging Service Market Research Report — Global Forecast till 2035

    Regional Insights


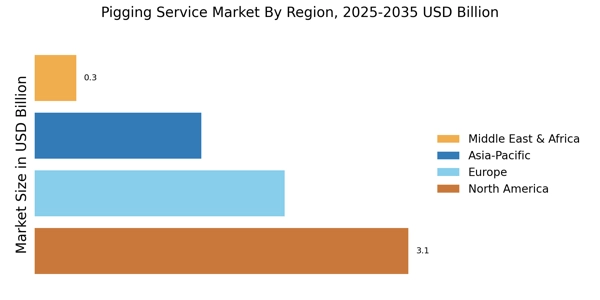
    The Pigging Service Market, particularly within the Regional segment, shows significant growth projections and varying contributions from different areas. By 2024, the North American region marks a prominent valuation of 2.5 USD Billion and is expected to rise to 3.8 USD Billion by 2035, indicating its majority holding and dominance in the industry due to advanced pipeline infrastructure and high maintenance demands.

    Europe follows with a valuation of 1.8 USD Billion in 2024, rising to 2.7 USD Billion by 2035, driven by stringent regulatory standards and the need for operational efficiency.The APAC region, currently valued at 1.5 USD Billion in 2024, is projected to reach 2.3 USD Billion by 2035, showcasing significant growth opportunities stemming from rapid industrialization and increasing energy demands. Meanwhile, South America and MEA represent smaller shares, with valuations of 0.8 USD Billion and 0.4 USD Billion in 2024, respectively, though both regions are essential for expanding market growth potential given their resource-rich environments.

    The diverse Pigging Service Market segmentation maps out a landscape ripe for both challenges and opportunities, influenced by strategic investments and technological advancements across these regions.

    Pigging Service Market Regional Insights   

    Key Players and Competitive Insights

    The Pigging Service Market is characterized by its dynamic nature and competitive landscape, driven by advancements in technology and increasing demand for pipeline integrity management. As industries such as oil and gas, water distribution, and various manufacturing sectors continue to grow, the necessity for efficient and reliable pigging services has become paramount. Companies operating in this market are continually innovating their approaches to offer enhanced operational efficiency, cost-effectiveness, and adherence to safety standards.

    The ongoing emphasis on environmental sustainability and the reduction of operational downtime has further intensified competition among market participants, prompting them to develop strategically focused service offerings that cater to the specific needs of their diverse clientele.Pure Technologies has established a significant presence in the Pigging Service Market by leveraging its advanced technologies and specialized expertise in pipeline assessment. The company is renowned for its comprehensive suite of services that includes the use of smart pigs and non-destructive testing techniques, allowing for accurate and timely inspections of pipelines.

    This capability enhances pipeline integrity and helps in identifying potential issues before they escalate into larger problems, thus mitigating risks associated with pipeline operations. Pure Technologies' strong focus on research and development positions it at the forefront of innovative solutions in pigging services, which appeals to a wide variety of industries.

    Their commitment to customer service and operational excellence has contributed to their strong reputation, enabling them to secure long-term contracts and partnerships that further reinforce their market position.Baker Hughes is another prominent player in the Pigging Service Market, recognized for its extensive range of services tailored to the oil and gas sector. The company's innovative approach incorporates the latest technologies in pigging, including advanced inspection tools and software, which enable operators to monitor pipeline conditions effectively.

    Baker Hughes’ robust presence in the market is bolstered by its global reach and the ability to deliver integrated services that enhance overall operational performance. The company's emphasis on quality assurance and safety standards plays a critical role in building trust with customers as they seek reliable and effective solutions for their pipeline management needs. Additionally, Baker Hughes’ commitment to sustainability, combined with its expertise in handling challenging environments, positions it as a leader in addressing the complexities associated with modern pipeline systems.

    Key Companies in the Pigging Service Market market include

    Industry Developments

    Recent developments in the Pigging Service Market indicate a growing demand for innovative pipeline inspection and maintenance solutions driven by increased regulatory standards and a focus on safety. Companies like Pure Technologies and Baker Hughes are actively advancing their service offerings with enhanced technologies that provide real-time data analytics for pipeline monitoring. The market has also seen notable activities, including mergers and acquisitions, which are reshaping competitive dynamics; for instance, recent consolidations involving Pipeline Integrity Services and Enduro Pipeline Services are noteworthy as they expand service capabilities and geographic reach.

    In terms of market valuation, firms such as SGS and NexTier Oilfield Solutions are experiencing growth attributable to rising investments in infrastructure and the need for effective pipeline management. This surge in market investment is compelling organizations to innovate and collaborate, further enhancing service quality. Meanwhile, market players are focusing on sustainable practices, responding to environmental concerns while ensuring operational efficiency. As the demand for smart pipeline integrity solutions escalates, the competitive landscape is anticipated to evolve, setting the stage for strategic collaborations and technology advancements among key industry players like Matrix Service Company and TDW.

    Future Outlook

    Pigging Service Market Future Outlook

    The Pigging Service Market is projected to grow at a 3.78% CAGR from 2024 to 2035, driven by increasing pipeline infrastructure and demand for maintenance efficiency.

    New opportunities lie in:

    • Invest in advanced pigging technologies to enhance operational efficiency and reduce downtime.
    • Expand service offerings to include smart pigging solutions for real-time monitoring.
    • Develop strategic partnerships with pipeline operators to secure long-term contracts.

    By 2035, the Pigging Service Market is expected to achieve robust growth, reflecting evolving industry needs.

    Market Segmentation

    Pigging Service Market End Use Outlook

    • Upstream
    • Midstream
    • Downstream

    Pigging Service Market Pig Type Outlook

    • Batched Pigs
    • Smart Pigs
    • Cup Pigs
    • Scraper Pigs

    Pigging Service Market Regional Outlook

    • North America
    • Europe
    • South America
    • Asia Pacific
    • Middle East and Africa

    Pigging Service Market Application Outlook

    • Oil and Gas
    • Water and Wastewater
    • Chemical Processing
    • Food and Beverage

    Pigging Service Market Service Type Outlook

    • Utility Pigging
    • Cleaning Pigging
    • Inspection Pigging
    • Sealing Pigging

    Report Scope

    Report Attribute/Metric Details
    Market Size 2023 6.73(USD Billion)
    Market Size 2024 6.98(USD Billion)
    Market Size 2035 10.5(USD Billion)
    Compound Annual Growth Rate (CAGR) 3.78% (2025 - 2035)
    Report Coverage Revenue Forecast, Competitive Landscape, Growth Factors, and Trends
    Base Year 2024
    Market Forecast Period 2025 - 2035
    Historical Data 2019 - 2024
    Market Forecast Units USD Billion
    Key Companies Profiled Pure Technologies, Baker Hughes, Cvg Logics, Pipeline Integrity Services, Enduro Pipeline Services, SGS, Propipe, NexTier Oilfield Solutions, Matrix Service Company, Ferguson, TDW, A.Hak, NDT Global, Cartledge Engineering, Gerard Daniel Worldwide
    Segments Covered Service Type, Application, Pig Type, End Use, Regional
    Key Market Opportunities Increasing pipeline infrastructure investment, Rising demand for efficient maintenance, Growing focus on safety regulations, Expansion in emerging markets, Advancements in pigging technologies
    Key Market Dynamics Growing demand for pipeline maintenance, Increasing adoption of smart pigging technology, Strict regulatory compliance requirements, Rising investments in the oil and gas sector, Expanding infrastructure development projects
    Countries Covered North America, Europe, APAC, South America, MEA

    Market Highlights

    Author
    Priya Nagrale
    Senior Research Analyst

    With an experience of over five years in market research industry (Chemicals & Materials domain), I gather and analyze market data from diverse sources to produce results, which are then presented back to a client. Also, provide recommendations based on the findings. As a Senior Research Analyst, I perform quality checks (QC) for market estimations, QC for reports, and handle queries and work extensively on client customizations. Also, handle the responsibilities of client proposals, report planning, report finalization, and execution

    Leave a Comment

    FAQs

    What is the expected market size of the Pigging Service Market in 2024?

    The Pigging Service Market is expected to be valued at 6.98 billion USD in 2024.

    What is the projected market size for the Pigging Service Market by 2035?

    By 2035, the overall market is projected to be valued at 10.5 billion USD.

    What is the expected CAGR for the Pigging Service Market from 2025 to 2035?

    The expected CAGR for the Pigging Service Market from 2025 to 2035 is 3.78%.

    Which region is expected to dominate the Pigging Service Market by 2035?

    North America is expected to dominate the market with a valuation of 3.8 billion USD by 2035.

    What are the market values for the Utility Pigging service type in 2024 and 2035?

    Utility Pigging is valued at 2.09 billion USD in 2024 and is expected to reach 3.12 billion USD in 2035.

    What is the market value for Inspection Pigging in 2024?

    The market value for Inspection Pigging in 2024 is estimated at 1.93 billion USD.

    Which key players are significant in the Pigging Service Market?

    Major players in the market include Pure Technologies, Baker Hughes, and Pipeline Integrity Services.

    What is the expected market value for Cleaning Pigging in 2035?

    Cleaning Pigging is expected to reach a value of 3.26 billion USD by 2035.

    What is the market size for the APAC region in 2024?

    The APAC region is valued at 1.5 billion USD in 2024.

    What are the expected trends driving the growth of the Pigging Service Market?

    Rising infrastructure investments and technological advancements are key trends driving market growth.

    1. 'TABLE OF CONTENTS
    2. EXECUTIVE SUMMARY
    3. Market Overview
      1. Key Findings
      2. Market Segmentation
    4. Competitive Landscape
      1. Challenges and Opportunities
      2. Future Outlook
    5. MARKET INTRODUCTION
      1. Definition
      2. Scope of the study
        1. Research Objective
        2. Assumption
        3. Limitations
    6. RESEARCH METHODOLOGY
      1. Overview
    7. Data Mining
      1. Secondary Research
      2. Primary Research
    8. Primary Interviews and Information Gathering Process
      1. Breakdown of Primary
    9. Respondents
      1. Forecasting Model
      2. Market Size Estimation
    10. Bottom-Up Approach
      1. Top-Down Approach
      2. Data Triangulation
      3. Validation
    11. MARKET DYNAMICS
      1. Overview
      2. Drivers
      3. Restraints
      4. Opportunities
    12. MARKET FACTOR ANALYSIS
      1. Value chain Analysis
      2. Porter''s Five Forces
    13. Analysis
      1. Bargaining Power of Suppliers
        1. Bargaining Power
    14. of Buyers
      1. Threat of New Entrants
        1. Threat of Substitutes
        2. Intensity of Rivalry
      2. COVID-19 Impact Analysis
    15. Market Impact Analysis
      1. Regional Impact
        1. Opportunity and
    16. Threat Analysis
    17. PIGGING SERVICE MARKET, BY SERVICE TYPE
    18. (USD BILLION)
      1. Utility Pigging
      2. Cleaning Pigging
    19. Inspection Pigging
      1. Sealing Pigging
    20. PIGGING SERVICE MARKET, BY
    21. APPLICATION (USD BILLION)
      1. Oil and Gas
      2. Water and Wastewater
      3. Chemical Processing
      4. Food and Beverage
    22. PIGGING SERVICE
    23. MARKET, BY PIG TYPE (USD BILLION)
      1. Batched Pigs
      2. Smart Pigs
      3. Cup Pigs
      4. Scraper Pigs
    24. PIGGING SERVICE MARKET, BY
    25. END USE (USD BILLION)
      1. Upstream
      2. Midstream
      3. Downstream
    26. PIGGING SERVICE MARKET, BY REGIONAL (USD BILLION)
      1. North America
        1. US
        2. Canada
      2. Europe
        1. Germany
        2. UK
        3. France
        4. Russia
        5. Italy
    27. Spain
      1. Rest of Europe
      2. APAC
        1. China
    28. India
      1. Japan
        1. South Korea
        2. Malaysia
    29. Thailand
      1. Indonesia
        1. Rest of APAC
      2. South America
        1. Brazil
        2. Mexico
        3. Argentina
    30. Rest of South America
      1. MEA
        1. GCC Countries
    31. South Africa
      1. Rest of MEA
    32. COMPETITIVE LANDSCAPE
      1. Overview
      2. Competitive Analysis
      3. Market share Analysis
      4. Major Growth Strategy in the Pigging Service Market
      5. Competitive
    33. Benchmarking
      1. Leading Players in Terms of Number of Developments in the
    34. Pigging Service Market
      1. Key developments and growth strategies
    35. New Product Launch/Service Deployment
      1. Merger & Acquisitions
        1. Joint Ventures
      2. Major Players Financial Matrix
    36. Sales and Operating Income
      1. Major Players R&D Expenditure. 2023
    37. COMPANY PROFILES
      1. Pure Technologies
        1. Financial
    38. Overview
      1. Products Offered
        1. Key Developments
    39. SWOT Analysis
      1. Key Strategies
      2. Baker Hughes
    40. Financial Overview
      1. Products Offered
        1. Key Developments
        2. SWOT Analysis
        3. Key Strategies
      2. Cvg Logics
        1. Financial Overview
        2. Products Offered
        3. Key
    41. Developments
      1. SWOT Analysis
        1. Key Strategies
    42. Pipeline Integrity Services
      1. Financial Overview
        1. Products
    43. Offered
      1. Key Developments
        1. SWOT Analysis
    44. Key Strategies
      1. Enduro Pipeline Services
        1. Financial Overview
        2. Products Offered
        3. Key Developments
        4. SWOT
    45. Analysis
      1. Key Strategies
      2. SGS
        1. Financial Overview
        2. Products Offered
        3. Key Developments
        4. SWOT
    46. Analysis
      1. Key Strategies
      2. Propipe
        1. Financial
    47. Overview
      1. Products Offered
        1. Key Developments
    48. SWOT Analysis
      1. Key Strategies
      2. NexTier Oilfield Solutions
        1. Financial Overview
        2. Products Offered
        3. Key
    49. Developments
      1. SWOT Analysis
        1. Key Strategies
    50. Matrix Service Company
      1. Financial Overview
        1. Products Offered
        2. Key Developments
        3. SWOT Analysis
        4. Key Strategies
      2. Ferguson
        1. Financial Overview
        2. Products
    51. Offered
      1. Key Developments
        1. SWOT Analysis
    52. Key Strategies
      1. TDW
        1. Financial Overview
    53. Products Offered
      1. Key Developments
        1. SWOT Analysis
        2. Key Strategies
      2. A.Hak
        1. Financial Overview
        2. Products Offered
        3. Key Developments
        4. SWOT
    54. Analysis
      1. Key Strategies
      2. NDT Global
        1. Financial
    55. Overview
      1. Products Offered
        1. Key Developments
    56. SWOT Analysis
      1. Key Strategies
      2. Cartledge Engineering
        1. Financial Overview
        2. Products Offered
        3. Key
    57. Developments
      1. SWOT Analysis
        1. Key Strategies
    58. Gerard Daniel Worldwide
      1. Financial Overview
        1. Products
    59. Offered
      1. Key Developments
        1. SWOT Analysis
    60. Key Strategies
    61. APPENDIX
      1. References
      2. Related Reports
    62. AMERICA PIGGING SERVICE MARKET SIZE ESTIMATES & FORECAST, BY SERVICE TYPE, 2019-2035
    63. (USD BILLIONS)
    64. & FORECAST, BY APPLICATION, 2019-2035 (USD BILLIONS)
    65. PIGGING SERVICE MARKET SIZE ESTIMATES & FORECAST, BY PIG TYPE, 2019-2035 (USD
    66. BILLIONS)
    67. FORECAST, BY END USE, 2019-2035 (USD BILLIONS)
    68. SERVICE MARKET SIZE ESTIMATES & FORECAST, BY REGIONAL, 2019-2035 (USD BILLIONS)
    69. TYPE, 2019-2035 (USD BILLIONS)
    70. & FORECAST, BY APPLICATION, 2019-2035 (USD BILLIONS)
    71. SERVICE MARKET SIZE ESTIMATES & FORECAST, BY PIG TYPE, 2019-2035 (USD BILLIONS)
    72. USE, 2019-2035 (USD BILLIONS)
    73. & FORECAST, BY REGIONAL, 2019-2035 (USD BILLIONS)
    74. SERVICE MARKET SIZE ESTIMATES & FORECAST, BY SERVICE TYPE, 2019-2035 (USD BILLIONS)
    75. APPLICATION, 2019-2035 (USD BILLIONS)
    76. SIZE ESTIMATES & FORECAST, BY PIG TYPE, 2019-2035 (USD BILLIONS)
    77. CANADA PIGGING SERVICE MARKET SIZE ESTIMATES & FORECAST, BY END USE, 2019-2035
    78. (USD BILLIONS)
    79. FORECAST, BY REGIONAL, 2019-2035 (USD BILLIONS)
    80. MARKET SIZE ESTIMATES & FORECAST, BY SERVICE TYPE, 2019-2035 (USD BILLIONS)
    81. APPLICATION, 2019-2035 (USD BILLIONS)
    82. SIZE ESTIMATES & FORECAST, BY PIG TYPE, 2019-2035 (USD BILLIONS)
    83. EUROPE PIGGING SERVICE MARKET SIZE ESTIMATES & FORECAST, BY END USE, 2019-2035
    84. (USD BILLIONS)
    85. FORECAST, BY REGIONAL, 2019-2035 (USD BILLIONS)
    86. SERVICE MARKET SIZE ESTIMATES & FORECAST, BY SERVICE TYPE, 2019-2035 (USD BILLIONS)
    87. APPLICATION, 2019-2035 (USD BILLIONS)
    88. SIZE ESTIMATES & FORECAST, BY PIG TYPE, 2019-2035 (USD BILLIONS)
    89. GERMANY PIGGING SERVICE MARKET SIZE ESTIMATES & FORECAST, BY END USE, 2019-2035
    90. (USD BILLIONS)
    91. FORECAST, BY REGIONAL, 2019-2035 (USD BILLIONS)
    92. MARKET SIZE ESTIMATES & FORECAST, BY SERVICE TYPE, 2019-2035 (USD BILLIONS)
    93. 2035 (USD BILLIONS)
    94. & FORECAST, BY PIG TYPE, 2019-2035 (USD BILLIONS)
    95. SERVICE MARKET SIZE ESTIMATES & FORECAST, BY END USE, 2019-2035 (USD BILLIONS)
    96. 2035 (USD BILLIONS)
    97. & FORECAST, BY SERVICE TYPE, 2019-2035 (USD BILLIONS)
    98. PIGGING SERVICE MARKET SIZE ESTIMATES & FORECAST, BY APPLICATION, 2019-2035
    99. (USD BILLIONS)
    100. FORECAST, BY PIG TYPE, 2019-2035 (USD BILLIONS)
    101. MARKET SIZE ESTIMATES & FORECAST, BY END USE, 2019-2035 (USD BILLIONS)
    102. FRANCE PIGGING SERVICE MARKET SIZE ESTIMATES & FORECAST, BY REGIONAL, 2019-2035
    103. (USD BILLIONS)
    104. FORECAST, BY SERVICE TYPE, 2019-2035 (USD BILLIONS)
    105. SERVICE MARKET SIZE ESTIMATES & FORECAST, BY APPLICATION, 2019-2035 (USD BILLIONS)
    106. PIG TYPE, 2019-2035 (USD BILLIONS)
    107. SIZE ESTIMATES & FORECAST, BY END USE, 2019-2035 (USD BILLIONS)
    108. RUSSIA PIGGING SERVICE MARKET SIZE ESTIMATES & FORECAST, BY REGIONAL, 2019-2035
    109. (USD BILLIONS)
    110. FORECAST, BY SERVICE TYPE, 2019-2035 (USD BILLIONS)
    111. SERVICE MARKET SIZE ESTIMATES & FORECAST, BY APPLICATION, 2019-2035 (USD BILLIONS)
    112. TYPE, 2019-2035 (USD BILLIONS)
    113. ESTIMATES & FORECAST, BY END USE, 2019-2035 (USD BILLIONS)
    114. PIGGING SERVICE MARKET SIZE ESTIMATES & FORECAST, BY REGIONAL, 2019-2035 (USD
    115. BILLIONS)
    116. BY SERVICE TYPE, 2019-2035 (USD BILLIONS)
    117. MARKET SIZE ESTIMATES & FORECAST, BY APPLICATION, 2019-2035 (USD BILLIONS)
    118. 2035 (USD BILLIONS)
    119. & FORECAST, BY END USE, 2019-2035 (USD BILLIONS)
    120. SERVICE MARKET SIZE ESTIMATES & FORECAST, BY REGIONAL, 2019-2035 (USD BILLIONS)
    121. BY SERVICE TYPE, 2019-2035 (USD BILLIONS)
    122. SERVICE MARKET SIZE ESTIMATES & FORECAST, BY APPLICATION, 2019-2035 (USD BILLIONS)
    123. BY PIG TYPE, 2019-2035 (USD BILLIONS)
    124. MARKET SIZE ESTIMATES & FORECAST, BY END USE, 2019-2035 (USD BILLIONS)
    125. REST OF EUROPE PIGGING SERVICE MARKET SIZE ESTIMATES & FORECAST, BY REGIONAL,
    126. 2035 (USD BILLIONS)
    127. & FORECAST, BY SERVICE TYPE, 2019-2035 (USD BILLIONS)
    128. SERVICE MARKET SIZE ESTIMATES & FORECAST, BY APPLICATION, 2019-2035 (USD BILLIONS)
    129. TYPE, 2019-2035 (USD BILLIONS)
    130. ESTIMATES & FORECAST, BY END USE, 2019-2035 (USD BILLIONS)
    131. PIGGING SERVICE MARKET SIZE ESTIMATES & FORECAST, BY REGIONAL, 2019-2035 (USD
    132. BILLIONS)
    133. BY SERVICE TYPE, 2019-2035 (USD BILLIONS)
    134. MARKET SIZE ESTIMATES & FORECAST, BY APPLICATION, 2019-2035 (USD BILLIONS)
    135. 2035 (USD BILLIONS)
    136. & FORECAST, BY END USE, 2019-2035 (USD BILLIONS)
    137. SERVICE MARKET SIZE ESTIMATES & FORECAST, BY REGIONAL, 2019-2035 (USD BILLIONS)
    138. TYPE, 2019-2035 (USD BILLIONS)
    139. ESTIMATES & FORECAST, BY APPLICATION, 2019-2035 (USD BILLIONS)
    140. INDIA PIGGING SERVICE MARKET SIZE ESTIMATES & FORECAST, BY PIG TYPE, 2019-2035
    141. (USD BILLIONS)
    142. FORECAST, BY END USE, 2019-2035 (USD BILLIONS)
    143. MARKET SIZE ESTIMATES & FORECAST, BY REGIONAL, 2019-2035 (USD BILLIONS)
    144. TYPE, 2019-2035 (USD BILLIONS)
    145. ESTIMATES & FORECAST, BY APPLICATION, 2019-2035 (USD BILLIONS)
    146. JAPAN PIGGING SERVICE MARKET SIZE ESTIMATES & FORECAST, BY PIG TYPE, 2019-2035
    147. (USD BILLIONS)
    148. FORECAST, BY END USE, 2019-2035 (USD BILLIONS)
    149. MARKET SIZE ESTIMATES & FORECAST, BY REGIONAL, 2019-2035 (USD BILLIONS)
    150. SERVICE TYPE, 2019-2035 (USD BILLIONS)
    151. MARKET SIZE ESTIMATES & FORECAST, BY APPLICATION, 2019-2035 (USD BILLIONS)
    152. PIG TYPE, 2019-2035 (USD BILLIONS)
    153. SIZE ESTIMATES & FORECAST, BY END USE, 2019-2035 (USD BILLIONS)
    154. SOUTH KOREA PIGGING SERVICE MARKET SIZE ESTIMATES & FORECAST, BY REGIONAL,
    155. 2035 (USD BILLIONS)
    156. & FORECAST, BY SERVICE TYPE, 2019-2035 (USD BILLIONS)
    157. PIGGING SERVICE MARKET SIZE ESTIMATES & FORECAST, BY APPLICATION, 2019-2035
    158. (USD BILLIONS)
    159. FORECAST, BY PIG TYPE, 2019-2035 (USD BILLIONS)
    160. SERVICE MARKET SIZE ESTIMATES & FORECAST, BY END USE, 2019-2035 (USD BILLIONS)
    161. REGIONAL, 2019-2035 (USD BILLIONS)
    162. SIZE ESTIMATES & FORECAST, BY SERVICE TYPE, 2019-2035 (USD BILLIONS)
    163. THAILAND PIGGING SERVICE MARKET SIZE ESTIMATES & FORECAST, BY APPLICATION,
    164. 2035 (USD BILLIONS)
    165. & FORECAST, BY PIG TYPE, 2019-2035 (USD BILLIONS)
    166. SERVICE MARKET SIZE ESTIMATES & FORECAST, BY END USE, 2019-2035 (USD BILLIONS)
    167. REGIONAL, 2019-2035 (USD BILLIONS)
    168. SIZE ESTIMATES & FORECAST, BY SERVICE TYPE, 2019-2035 (USD BILLIONS)
    169. INDONESIA PIGGING SERVICE MARKET SIZE ESTIMATES & FORECAST, BY APPLICATION,
    170. 2035 (USD BILLIONS)
    171. & FORECAST, BY PIG TYPE, 2019-2035 (USD BILLIONS)
    172. PIGGING SERVICE MARKET SIZE ESTIMATES & FORECAST, BY END USE, 2019-2035 (USD
    173. BILLIONS)
    174. FORECAST, BY REGIONAL, 2019-2035 (USD BILLIONS)
    175. SERVICE MARKET SIZE ESTIMATES & FORECAST, BY SERVICE TYPE, 2019-2035 (USD BILLIONS)
    176. BY APPLICATION, 2019-2035 (USD BILLIONS)
    177. MARKET SIZE ESTIMATES & FORECAST, BY PIG TYPE, 2019-2035 (USD BILLIONS)
    178. BY END USE, 2019-2035 (USD BILLIONS)
    179. MARKET SIZE ESTIMATES & FORECAST, BY REGIONAL, 2019-2035 (USD BILLIONS)
    180. BY SERVICE TYPE, 2019-2035 (USD BILLIONS)
    181. SERVICE MARKET SIZE ESTIMATES & FORECAST, BY APPLICATION, 2019-2035 (USD BILLIONS)
    182. BY PIG TYPE, 2019-2035 (USD BILLIONS)
    183. MARKET SIZE ESTIMATES & FORECAST, BY END USE, 2019-2035 (USD BILLIONS)
    184. SOUTH AMERICA PIGGING SERVICE MARKET SIZE ESTIMATES & FORECAST, BY REGIONAL,
    185. 2035 (USD BILLIONS)
    186. & FORECAST, BY SERVICE TYPE, 2019-2035 (USD BILLIONS)
    187. PIGGING SERVICE MARKET SIZE ESTIMATES & FORECAST, BY APPLICATION, 2019-2035
    188. (USD BILLIONS)
    189. FORECAST, BY PIG TYPE, 2019-2035 (USD BILLIONS)
    190. SERVICE MARKET SIZE ESTIMATES & FORECAST, BY END USE, 2019-2035 (USD BILLIONS)
    191. REGIONAL, 2019-2035 (USD BILLIONS)
    192. SIZE ESTIMATES & FORECAST, BY SERVICE TYPE, 2019-2035 (USD BILLIONS)
    193. MEXICO PIGGING SERVICE MARKET SIZE ESTIMATES & FORECAST, BY APPLICATION,
    194. 2035 (USD BILLIONS)
    195. & FORECAST, BY PIG TYPE, 2019-2035 (USD BILLIONS)
    196. SERVICE MARKET SIZE ESTIMATES & FORECAST, BY END USE, 2019-2035 (USD BILLIONS)
    197. REGIONAL, 2019-2035 (USD BILLIONS)
    198. SIZE ESTIMATES & FORECAST, BY SERVICE TYPE, 2019-2035 (USD BILLIONS)
    199. ARGENTINA PIGGING SERVICE MARKET SIZE ESTIMATES & FORECAST, BY APPLICATION,
    200. 2035 (USD BILLIONS)
    201. ESTIMATES & FORECAST, BY PIG TYPE, 2019-2035 (USD BILLIONS)
    202. ARGENTINA PIGGING SERVICE MARKET SIZE ESTIMATES & FORECAST, BY END USE, 2019-2035
    203. (USD BILLIONS)
    204. & FORECAST, BY REGIONAL, 2019-2035 (USD BILLIONS)
    205. AMERICA PIGGING SERVICE MARKET SIZE ESTIMATES & FORECAST, BY SERVICE TYPE, 2019-2035
    206. (USD BILLIONS)
    207. ESTIMATES & FORECAST, BY APPLICATION, 2019-2035 (USD BILLIONS)
    208. REST OF SOUTH AMERICA PIGGING SERVICE MARKET SIZE ESTIMATES & FORECAST, BY PIG
    209. TYPE, 2019-2035 (USD BILLIONS)
    210. MARKET SIZE ESTIMATES & FORECAST, BY END USE, 2019-2035 (USD BILLIONS)
    211. REST OF SOUTH AMERICA PIGGING SERVICE MARKET SIZE ESTIMATES & FORECAST,
    212. BY REGIONAL, 2019-2035 (USD BILLIONS)
    213. SIZE ESTIMATES & FORECAST, BY SERVICE TYPE, 2019-2035 (USD BILLIONS)
    214. MEA PIGGING SERVICE MARKET SIZE ESTIMATES & FORECAST, BY APPLICATION, 2019-2035
    215. (USD BILLIONS)
    216. FORECAST, BY PIG TYPE, 2019-2035 (USD BILLIONS)
    217. MARKET SIZE ESTIMATES & FORECAST, BY END USE, 2019-2035 (USD BILLIONS)
    218. MEA PIGGING SERVICE MARKET SIZE ESTIMATES & FORECAST, BY REGIONAL, 2019-2035
    219. (USD BILLIONS)
    220. & FORECAST, BY SERVICE TYPE, 2019-2035 (USD BILLIONS)
    221. PIGGING SERVICE MARKET SIZE ESTIMATES & FORECAST, BY APPLICATION, 2019-2035
    222. (USD BILLIONS)
    223. & FORECAST, BY PIG TYPE, 2019-2035 (USD BILLIONS)
    224. PIGGING SERVICE MARKET SIZE ESTIMATES & FORECAST, BY END USE, 2019-2035 (USD
    225. BILLIONS)
    226. FORECAST, BY REGIONAL, 2019-2035 (USD BILLIONS)
    227. SERVICE MARKET SIZE ESTIMATES & FORECAST, BY SERVICE TYPE, 2019-2035 (USD BILLIONS)
    228. BY APPLICATION, 2019-2035 (USD BILLIONS)
    229. MARKET SIZE ESTIMATES & FORECAST, BY PIG TYPE, 2019-2035 (USD BILLIONS)
    230. BY END USE, 2019-2035 (USD BILLIONS)
    231. MARKET SIZE ESTIMATES & FORECAST, BY REGIONAL, 2019-2035 (USD BILLIONS)
    232. SERVICE TYPE, 2019-2035 (USD BILLIONS)
    233. MARKET SIZE ESTIMATES & FORECAST, BY APPLICATION, 2019-2035 (USD BILLIONS)
    234. PIG TYPE, 2019-2035 (USD BILLIONS)
    235. MARKET SIZE ESTIMATES & FORECAST, BY END USE, 2019-2035 (USD BILLIONS)
    236. REST OF MEA PIGGING SERVICE MARKET SIZE ESTIMATES & FORECAST, BY REGIONAL,
    237. 2035 (USD BILLIONS)
    238. ANALYSIS
    239. PIGGING SERVICE MARKET ANALYSIS BY PIG TYPE
    240. ANALYSIS BY END USE
    241. CANADA PIGGING SERVICE MARKET ANALYSIS BY APPLICATION
    242. PIGGING SERVICE MARKET ANALYSIS BY PIG TYPE
    243. MARKET ANALYSIS BY END USE
    244. BY REGIONAL
    245. GERMANY PIGGING SERVICE MARKET ANALYSIS BY SERVICE TYPE
    246. PIGGING SERVICE MARKET ANALYSIS BY APPLICATION
    247. SERVICE MARKET ANALYSIS BY PIG TYPE
    248. ANALYSIS BY END USE
    249. REGIONAL
    250. UK PIGGING SERVICE MARKET ANALYSIS BY PIG TYPE
    251. MARKET ANALYSIS BY END USE
    252. REGIONAL
    253. FRANCE PIGGING SERVICE MARKET ANALYSIS BY PIG TYPE
    254. SERVICE MARKET ANALYSIS BY END USE
    255. ANALYSIS BY REGIONAL
    256. SERVICE TYPE
    257. RUSSIA PIGGING SERVICE MARKET ANALYSIS BY END USE
    258. SERVICE MARKET ANALYSIS BY REGIONAL
    259. ANALYSIS BY SERVICE TYPE
    260. BY APPLICATION
    261. ITALY PIGGING SERVICE MARKET ANALYSIS BY REGIONAL
    262. SERVICE MARKET ANALYSIS BY SERVICE TYPE
    263. ANALYSIS BY APPLICATION
    264. PIG TYPE
    265. SPAIN PIGGING SERVICE MARKET ANALYSIS BY REGIONAL
    266. PIGGING SERVICE MARKET ANALYSIS BY SERVICE TYPE
    267. PIGGING SERVICE MARKET ANALYSIS BY APPLICATION
    268. SERVICE MARKET ANALYSIS BY PIG TYPE
    269. MARKET ANALYSIS BY END USE
    270. ANALYSIS BY REGIONAL
    271. CHINA PIGGING SERVICE MARKET ANALYSIS BY SERVICE TYPE
    272. PIGGING SERVICE MARKET ANALYSIS BY APPLICATION
    273. MARKET ANALYSIS BY PIG TYPE
    274. BY END USE
    275. INDIA PIGGING SERVICE MARKET ANALYSIS BY APPLICATION
    276. PIGGING SERVICE MARKET ANALYSIS BY PIG TYPE
    277. MARKET ANALYSIS BY END USE
    278. BY REGIONAL
    279. JAPAN PIGGING SERVICE MARKET ANALYSIS BY PIG TYPE
    280. SERVICE MARKET ANALYSIS BY END USE
    281. ANALYSIS BY REGIONAL
    282. BY SERVICE TYPE
    283. APPLICATION
    284. TYPE
    285. MALAYSIA PIGGING SERVICE MARKET ANALYSIS BY SERVICE TYPE
    286. PIGGING SERVICE MARKET ANALYSIS BY APPLICATION
    287. SERVICE MARKET ANALYSIS BY PIG TYPE
    288. ANALYSIS BY END USE
    289. REGIONAL
    290. THAILAND PIGGING SERVICE MARKET ANALYSIS BY PIG TYPE
    291. PIGGING SERVICE MARKET ANALYSIS BY END USE
    292. MARKET ANALYSIS BY REGIONAL
    293. BY SERVICE TYPE
    294. INDONESIA PIGGING SERVICE MARKET ANALYSIS BY END USE
    295. PIGGING SERVICE MARKET ANALYSIS BY REGIONAL
    296. SERVICE MARKET ANALYSIS BY SERVICE TYPE
    297. MARKET ANALYSIS BY APPLICATION
    298. ANALYSIS BY PIG TYPE
    299. BY END USE
    300. BRAZIL PIGGING SERVICE MARKET ANALYSIS BY SERVICE TYPE
    301. SERVICE MARKET ANALYSIS BY APPLICATION
    302. ANALYSIS BY PIG TYPE
    303. END USE
    304. MEXICO PIGGING SERVICE MARKET ANALYSIS BY APPLICATION
    305. PIGGING SERVICE MARKET ANALYSIS BY PIG TYPE
    306. MARKET ANALYSIS BY END USE
    307. BY REGIONAL
    308. TYPE
    309. ARGENTINA PIGGING SERVICE MARKET ANALYSIS BY END USE
    310. PIGGING SERVICE MARKET ANALYSIS BY REGIONAL
    311. PIGGING SERVICE MARKET ANALYSIS BY SERVICE TYPE
    312. AMERICA PIGGING SERVICE MARKET ANALYSIS BY APPLICATION
    313. SOUTH AMERICA PIGGING SERVICE MARKET ANALYSIS BY PIG TYPE
    314. OF SOUTH AMERICA PIGGING SERVICE MARKET ANALYSIS BY END USE
    315. OF SOUTH AMERICA PIGGING SERVICE MARKET ANALYSIS BY REGIONAL
    316. PIGGING SERVICE MARKET ANALYSIS
    317. MARKET ANALYSIS BY SERVICE TYPE
    318. MARKET ANALYSIS BY APPLICATION
    319. ANALYSIS BY PIG TYPE
    320. BY END USE
    321. SOUTH AFRICA PIGGING SERVICE MARKET ANALYSIS BY PIG TYPE
    322. SOUTH AFRICA PIGGING SERVICE MARKET ANALYSIS BY END USE
    323. AFRICA PIGGING SERVICE MARKET ANALYSIS BY REGIONAL
    324. PIGGING SERVICE MARKET ANALYSIS BY SERVICE TYPE
    325. SERVICE MARKET ANALYSIS BY APPLICATION
    326. MARKET ANALYSIS BY PIG TYPE
    327. ANALYSIS BY END USE
    328. BY REGIONAL
    329. SERVICE MARKET
    330. SUPPLY / VALUE CHAIN: PIGGING SERVICE MARKET
    331. MARKET, BY SERVICE TYPE, 2024 (% SHARE)
    332. BY SERVICE TYPE, 2019 TO 2035 (USD Billions)
    333. BY APPLICATION, 2024 (% SHARE)
    334. TO 2035 (USD Billions)
    335. (% SHARE)
    336. (USD Billions)
    337. PIGGING SERVICE MARKET, BY REGIONAL, 2019 TO 2035 (USD Billions)
    338. BENCHMARKING OF MAJOR COMPETITORS'

    Pigging Service Market Segmentation


    • Pigging Service Market By Service Type (USD Billion, 2019-2035)

      • Utility Pigging

      • Cleaning Pigging

      • Inspection Pigging

      • Sealing Pigging

    • Pigging Service Market By Application (USD Billion, 2019-2035)

      • Oil and Gas

      • Water and Wastewater

      • Chemical Processing

      • Food and Beverage

    • Pigging Service Market By Pig Type (USD Billion, 2019-2035)

      • Batched Pigs

      • Smart Pigs

      • Cup Pigs

      • Scraper Pigs

    • Pigging Service Market By End Use (USD Billion, 2019-2035)

      • Upstream

      • Midstream

      • Downstream

    • Pigging Service Market By Regional (USD Billion, 2019-2035)

      • North America

      • Europe

      • South America

      • Asia Pacific

      • Middle East and Africa

    Pigging Service Market Regional Outlook (USD Billion, 2019-2035)


    • North America Outlook (USD Billion, 2019-2035)

      • North America Pigging Service Market by Service Type

        • Utility Pigging
        • Cleaning Pigging
        • Inspection Pigging
        • Sealing Pigging
      • North America Pigging Service Market by Application Type

        • Oil and Gas
        • Water and Wastewater
        • Chemical Processing
        • Food and Beverage
      • North America Pigging Service Market by Pig Type

        • Batched Pigs
        • Smart Pigs
        • Cup Pigs
        • Scraper Pigs
      • North America Pigging Service Market by End Use Type

        • Upstream
        • Midstream
        • Downstream
      • North America Pigging Service Market by Regional Type

        • US
        • Canada
      • US Outlook (USD Billion, 2019-2035)
      • US Pigging Service Market by Service Type

        • Utility Pigging
        • Cleaning Pigging
        • Inspection Pigging
        • Sealing Pigging
      • US Pigging Service Market by Application Type

        • Oil and Gas
        • Water and Wastewater
        • Chemical Processing
        • Food and Beverage
      • US Pigging Service Market by Pig Type

        • Batched Pigs
        • Smart Pigs
        • Cup Pigs
        • Scraper Pigs
      • US Pigging Service Market by End Use Type

        • Upstream
        • Midstream
        • Downstream
      • CANADA Outlook (USD Billion, 2019-2035)
      • CANADA Pigging Service Market by Service Type

        • Utility Pigging
        • Cleaning Pigging
        • Inspection Pigging
        • Sealing Pigging
      • CANADA Pigging Service Market by Application Type

        • Oil and Gas
        • Water and Wastewater
        • Chemical Processing
        • Food and Beverage
      • CANADA Pigging Service Market by Pig Type

        • Batched Pigs
        • Smart Pigs
        • Cup Pigs
        • Scraper Pigs
      • CANADA Pigging Service Market by End Use Type

        • Upstream
        • Midstream
        • Downstream
    • Europe Outlook (USD Billion, 2019-2035)

      • Europe Pigging Service Market by Service Type

        • Utility Pigging
        • Cleaning Pigging
        • Inspection Pigging
        • Sealing Pigging
      • Europe Pigging Service Market by Application Type

        • Oil and Gas
        • Water and Wastewater
        • Chemical Processing
        • Food and Beverage
      • Europe Pigging Service Market by Pig Type

        • Batched Pigs
        • Smart Pigs
        • Cup Pigs
        • Scraper Pigs
      • Europe Pigging Service Market by End Use Type

        • Upstream
        • Midstream
        • Downstream
      • Europe Pigging Service Market by Regional Type

        • Germany
        • UK
        • France
        • Russia
        • Italy
        • Spain
        • Rest of Europe
      • GERMANY Outlook (USD Billion, 2019-2035)
      • GERMANY Pigging Service Market by Service Type

        • Utility Pigging
        • Cleaning Pigging
        • Inspection Pigging
        • Sealing Pigging
      • GERMANY Pigging Service Market by Application Type

        • Oil and Gas
        • Water and Wastewater
        • Chemical Processing
        • Food and Beverage
      • GERMANY Pigging Service Market by Pig Type

        • Batched Pigs
        • Smart Pigs
        • Cup Pigs
        • Scraper Pigs
      • GERMANY Pigging Service Market by End Use Type

        • Upstream
        • Midstream
        • Downstream
      • UK Outlook (USD Billion, 2019-2035)
      • UK Pigging Service Market by Service Type

        • Utility Pigging
        • Cleaning Pigging
        • Inspection Pigging
        • Sealing Pigging
      • UK Pigging Service Market by Application Type

        • Oil and Gas
        • Water and Wastewater
        • Chemical Processing
        • Food and Beverage
      • UK Pigging Service Market by Pig Type

        • Batched Pigs
        • Smart Pigs
        • Cup Pigs
        • Scraper Pigs
      • UK Pigging Service Market by End Use Type

        • Upstream
        • Midstream
        • Downstream
      • FRANCE Outlook (USD Billion, 2019-2035)
      • FRANCE Pigging Service Market by Service Type

        • Utility Pigging
        • Cleaning Pigging
        • Inspection Pigging
        • Sealing Pigging
      • FRANCE Pigging Service Market by Application Type

        • Oil and Gas
        • Water and Wastewater
        • Chemical Processing
        • Food and Beverage
      • FRANCE Pigging Service Market by Pig Type

        • Batched Pigs
        • Smart Pigs
        • Cup Pigs
        • Scraper Pigs
      • FRANCE Pigging Service Market by End Use Type

        • Upstream
        • Midstream
        • Downstream
      • RUSSIA Outlook (USD Billion, 2019-2035)
      • RUSSIA Pigging Service Market by Service Type

        • Utility Pigging
        • Cleaning Pigging
        • Inspection Pigging
        • Sealing Pigging
      • RUSSIA Pigging Service Market by Application Type

        • Oil and Gas
        • Water and Wastewater
        • Chemical Processing
        • Food and Beverage
      • RUSSIA Pigging Service Market by Pig Type

        • Batched Pigs
        • Smart Pigs
        • Cup Pigs
        • Scraper Pigs
      • RUSSIA Pigging Service Market by End Use Type

        • Upstream
        • Midstream
        • Downstream
      • ITALY Outlook (USD Billion, 2019-2035)
      • ITALY Pigging Service Market by Service Type

        • Utility Pigging
        • Cleaning Pigging
        • Inspection Pigging
        • Sealing Pigging
      • ITALY Pigging Service Market by Application Type

        • Oil and Gas
        • Water and Wastewater
        • Chemical Processing
        • Food and Beverage
      • ITALY Pigging Service Market by Pig Type

        • Batched Pigs
        • Smart Pigs
        • Cup Pigs
        • Scraper Pigs
      • ITALY Pigging Service Market by End Use Type

        • Upstream
        • Midstream
        • Downstream
      • SPAIN Outlook (USD Billion, 2019-2035)
      • SPAIN Pigging Service Market by Service Type

        • Utility Pigging
        • Cleaning Pigging
        • Inspection Pigging
        • Sealing Pigging
      • SPAIN Pigging Service Market by Application Type

        • Oil and Gas
        • Water and Wastewater
        • Chemical Processing
        • Food and Beverage
      • SPAIN Pigging Service Market by Pig Type

        • Batched Pigs
        • Smart Pigs
        • Cup Pigs
        • Scraper Pigs
      • SPAIN Pigging Service Market by End Use Type

        • Upstream
        • Midstream
        • Downstream
      • REST OF EUROPE Outlook (USD Billion, 2019-2035)
      • REST OF EUROPE Pigging Service Market by Service Type

        • Utility Pigging
        • Cleaning Pigging
        • Inspection Pigging
        • Sealing Pigging
      • REST OF EUROPE Pigging Service Market by Application Type

        • Oil and Gas
        • Water and Wastewater
        • Chemical Processing
        • Food and Beverage
      • REST OF EUROPE Pigging Service Market by Pig Type

        • Batched Pigs
        • Smart Pigs
        • Cup Pigs
        • Scraper Pigs
      • REST OF EUROPE Pigging Service Market by End Use Type

        • Upstream
        • Midstream
        • Downstream
    • APAC Outlook (USD Billion, 2019-2035)

      • APAC Pigging Service Market by Service Type

        • Utility Pigging
        • Cleaning Pigging
        • Inspection Pigging
        • Sealing Pigging
      • APAC Pigging Service Market by Application Type

        • Oil and Gas
        • Water and Wastewater
        • Chemical Processing
        • Food and Beverage
      • APAC Pigging Service Market by Pig Type

        • Batched Pigs
        • Smart Pigs
        • Cup Pigs
        • Scraper Pigs
      • APAC Pigging Service Market by End Use Type

        • Upstream
        • Midstream
        • Downstream
      • APAC Pigging Service Market by Regional Type

        • China
        • India
        • Japan
        • South Korea
        • Malaysia
        • Thailand
        • Indonesia
        • Rest of APAC
      • CHINA Outlook (USD Billion, 2019-2035)
      • CHINA Pigging Service Market by Service Type

        • Utility Pigging
        • Cleaning Pigging
        • Inspection Pigging
        • Sealing Pigging
      • CHINA Pigging Service Market by Application Type

        • Oil and Gas
        • Water and Wastewater
        • Chemical Processing
        • Food and Beverage
      • CHINA Pigging Service Market by Pig Type

        • Batched Pigs
        • Smart Pigs
        • Cup Pigs
        • Scraper Pigs
      • CHINA Pigging Service Market by End Use Type

        • Upstream
        • Midstream
        • Downstream
      • INDIA Outlook (USD Billion, 2019-2035)
      • INDIA Pigging Service Market by Service Type

        • Utility Pigging
        • Cleaning Pigging
        • Inspection Pigging
        • Sealing Pigging
      • INDIA Pigging Service Market by Application Type

        • Oil and Gas
        • Water and Wastewater
        • Chemical Processing
        • Food and Beverage
      • INDIA Pigging Service Market by Pig Type

        • Batched Pigs
        • Smart Pigs
        • Cup Pigs
        • Scraper Pigs
      • INDIA Pigging Service Market by End Use Type

        • Upstream
        • Midstream
        • Downstream
      • JAPAN Outlook (USD Billion, 2019-2035)
      • JAPAN Pigging Service Market by Service Type

        • Utility Pigging
        • Cleaning Pigging
        • Inspection Pigging
        • Sealing Pigging
      • JAPAN Pigging Service Market by Application Type

        • Oil and Gas
        • Water and Wastewater
        • Chemical Processing
        • Food and Beverage
      • JAPAN Pigging Service Market by Pig Type

        • Batched Pigs
        • Smart Pigs
        • Cup Pigs
        • Scraper Pigs
      • JAPAN Pigging Service Market by End Use Type

        • Upstream
        • Midstream
        • Downstream
      • SOUTH KOREA Outlook (USD Billion, 2019-2035)
      • SOUTH KOREA Pigging Service Market by Service Type

        • Utility Pigging
        • Cleaning Pigging
        • Inspection Pigging
        • Sealing Pigging
      • SOUTH KOREA Pigging Service Market by Application Type

        • Oil and Gas
        • Water and Wastewater
        • Chemical Processing
        • Food and Beverage
      • SOUTH KOREA Pigging Service Market by Pig Type

        • Batched Pigs
        • Smart Pigs
        • Cup Pigs
        • Scraper Pigs
      • SOUTH KOREA Pigging Service Market by End Use Type

        • Upstream
        • Midstream
        • Downstream
      • MALAYSIA Outlook (USD Billion, 2019-2035)
      • MALAYSIA Pigging Service Market by Service Type

        • Utility Pigging
        • Cleaning Pigging
        • Inspection Pigging
        • Sealing Pigging
      • MALAYSIA Pigging Service Market by Application Type

        • Oil and Gas
        • Water and Wastewater
        • Chemical Processing
        • Food and Beverage
      • MALAYSIA Pigging Service Market by Pig Type

        • Batched Pigs
        • Smart Pigs
        • Cup Pigs
        • Scraper Pigs
      • MALAYSIA Pigging Service Market by End Use Type

        • Upstream
        • Midstream
        • Downstream
      • THAILAND Outlook (USD Billion, 2019-2035)
      • THAILAND Pigging Service Market by Service Type

        • Utility Pigging
        • Cleaning Pigging
        • Inspection Pigging
        • Sealing Pigging
      • THAILAND Pigging Service Market by Application Type

        • Oil and Gas
        • Water and Wastewater
        • Chemical Processing
        • Food and Beverage
      • THAILAND Pigging Service Market by Pig Type

        • Batched Pigs
        • Smart Pigs
        • Cup Pigs
        • Scraper Pigs
      • THAILAND Pigging Service Market by End Use Type

        • Upstream
        • Midstream
        • Downstream
      • INDONESIA Outlook (USD Billion, 2019-2035)
      • INDONESIA Pigging Service Market by Service Type

        • Utility Pigging
        • Cleaning Pigging
        • Inspection Pigging
        • Sealing Pigging
      • INDONESIA Pigging Service Market by Application Type

        • Oil and Gas
        • Water and Wastewater
        • Chemical Processing
        • Food and Beverage
      • INDONESIA Pigging Service Market by Pig Type

        • Batched Pigs
        • Smart Pigs
        • Cup Pigs
        • Scraper Pigs
      • INDONESIA Pigging Service Market by End Use Type

        • Upstream
        • Midstream
        • Downstream
      • REST OF APAC Outlook (USD Billion, 2019-2035)
      • REST OF APAC Pigging Service Market by Service Type

        • Utility Pigging
        • Cleaning Pigging
        • Inspection Pigging
        • Sealing Pigging
      • REST OF APAC Pigging Service Market by Application Type

        • Oil and Gas
        • Water and Wastewater
        • Chemical Processing
        • Food and Beverage
      • REST OF APAC Pigging Service Market by Pig Type

        • Batched Pigs
        • Smart Pigs
        • Cup Pigs
        • Scraper Pigs
      • REST OF APAC Pigging Service Market by End Use Type

        • Upstream
        • Midstream
        • Downstream
    • South America Outlook (USD Billion, 2019-2035)

      • South America Pigging Service Market by Service Type

        • Utility Pigging
        • Cleaning Pigging
        • Inspection Pigging
        • Sealing Pigging
      • South America Pigging Service Market by Application Type

        • Oil and Gas
        • Water and Wastewater
        • Chemical Processing
        • Food and Beverage
      • South America Pigging Service Market by Pig Type

        • Batched Pigs
        • Smart Pigs
        • Cup Pigs
        • Scraper Pigs
      • South America Pigging Service Market by End Use Type

        • Upstream
        • Midstream
        • Downstream
      • South America Pigging Service Market by Regional Type

        • Brazil
        • Mexico
        • Argentina
        • Rest of South America
      • BRAZIL Outlook (USD Billion, 2019-2035)
      • BRAZIL Pigging Service Market by Service Type

        • Utility Pigging
        • Cleaning Pigging
        • Inspection Pigging
        • Sealing Pigging
      • BRAZIL Pigging Service Market by Application Type

        • Oil and Gas
        • Water and Wastewater
        • Chemical Processing
        • Food and Beverage
      • BRAZIL Pigging Service Market by Pig Type

        • Batched Pigs
        • Smart Pigs
        • Cup Pigs
        • Scraper Pigs
      • BRAZIL Pigging Service Market by End Use Type

        • Upstream
        • Midstream
        • Downstream
      • MEXICO Outlook (USD Billion, 2019-2035)
      • MEXICO Pigging Service Market by Service Type

        • Utility Pigging
        • Cleaning Pigging
        • Inspection Pigging
        • Sealing Pigging
      • MEXICO Pigging Service Market by Application Type

        • Oil and Gas
        • Water and Wastewater
        • Chemical Processing
        • Food and Beverage
      • MEXICO Pigging Service Market by Pig Type

        • Batched Pigs
        • Smart Pigs
        • Cup Pigs
        • Scraper Pigs
      • MEXICO Pigging Service Market by End Use Type

        • Upstream
        • Midstream
        • Downstream
      • ARGENTINA Outlook (USD Billion, 2019-2035)
      • ARGENTINA Pigging Service Market by Service Type

        • Utility Pigging
        • Cleaning Pigging
        • Inspection Pigging
        • Sealing Pigging
      • ARGENTINA Pigging Service Market by Application Type

        • Oil and Gas
        • Water and Wastewater
        • Chemical Processing
        • Food and Beverage
      • ARGENTINA Pigging Service Market by Pig Type

        • Batched Pigs
        • Smart Pigs
        • Cup Pigs
        • Scraper Pigs
      • ARGENTINA Pigging Service Market by End Use Type

        • Upstream
        • Midstream
        • Downstream
      • REST OF SOUTH AMERICA Outlook (USD Billion, 2019-2035)
      • REST OF SOUTH AMERICA Pigging Service Market by Service Type

        • Utility Pigging
        • Cleaning Pigging
        • Inspection Pigging
        • Sealing Pigging
      • REST OF SOUTH AMERICA Pigging Service Market by Application Type

        • Oil and Gas
        • Water and Wastewater
        • Chemical Processing
        • Food and Beverage
      • REST OF SOUTH AMERICA Pigging Service Market by Pig Type

        • Batched Pigs
        • Smart Pigs
        • Cup Pigs
        • Scraper Pigs
      • REST OF SOUTH AMERICA Pigging Service Market by End Use Type

        • Upstream
        • Midstream
        • Downstream
    • MEA Outlook (USD Billion, 2019-2035)

      • MEA Pigging Service Market by Service Type

        • Utility Pigging
        • Cleaning Pigging
        • Inspection Pigging
        • Sealing Pigging
      • MEA Pigging Service Market by Application Type

        • Oil and Gas
        • Water and Wastewater
        • Chemical Processing
        • Food and Beverage
      • MEA Pigging Service Market by Pig Type

        • Batched Pigs
        • Smart Pigs
        • Cup Pigs
        • Scraper Pigs
      • MEA Pigging Service Market by End Use Type

        • Upstream
        • Midstream
        • Downstream
      • MEA Pigging Service Market by Regional Type

        • GCC Countries
        • South Africa
        • Rest of MEA
      • GCC COUNTRIES Outlook (USD Billion, 2019-2035)
      • GCC COUNTRIES Pigging Service Market by Service Type

        • Utility Pigging
        • Cleaning Pigging
        • Inspection Pigging
        • Sealing Pigging
      • GCC COUNTRIES Pigging Service Market by Application Type

        • Oil and Gas
        • Water and Wastewater
        • Chemical Processing
        • Food and Beverage
      • GCC COUNTRIES Pigging Service Market by Pig Type

        • Batched Pigs
        • Smart Pigs
        • Cup Pigs
        • Scraper Pigs
      • GCC COUNTRIES Pigging Service Market by End Use Type

        • Upstream
        • Midstream
        • Downstream
      • SOUTH AFRICA Outlook (USD Billion, 2019-2035)
      • SOUTH AFRICA Pigging Service Market by Service Type

        • Utility Pigging
        • Cleaning Pigging
        • Inspection Pigging
        • Sealing Pigging
      • SOUTH AFRICA Pigging Service Market by Application Type

        • Oil and Gas
        • Water and Wastewater
        • Chemical Processing
        • Food and Beverage
      • SOUTH AFRICA Pigging Service Market by Pig Type

        • Batched Pigs
        • Smart Pigs
        • Cup Pigs
        • Scraper Pigs
      • SOUTH AFRICA Pigging Service Market by End Use Type

        • Upstream
        • Midstream
        • Downstream
      • REST OF MEA Outlook (USD Billion, 2019-2035)
      • REST OF MEA Pigging Service Market by Service Type

        • Utility Pigging
        • Cleaning Pigging
        • Inspection Pigging
        • Sealing Pigging
      • REST OF MEA Pigging Service Market by Application Type

        • Oil and Gas
        • Water and Wastewater
        • Chemical Processing
        • Food and Beverage
      • REST OF MEA Pigging Service Market by Pig Type

        • Batched Pigs
        • Smart Pigs
        • Cup Pigs
        • Scraper Pigs
      • REST OF MEA Pigging Service Market by End Use Type

        • Upstream
        • Midstream
        • Downstream


    Report Infographic
    Free Sample Request

    Kindly complete the form below to receive a free sample of this Report

    Customer Strories

    “I am very pleased with how market segments have been defined in a relevant way for my purposes (such as "Portable Freezers & refrigerators" and "last-mile"). In general the report is well structured. Thanks very much for your efforts.”

    Victoria Milne Founder
    Case Study

    Chemicals and Materials