• Cat-intel
  • MedIntelliX
  • Resources
  • About Us
  • Request Free Sample ×

    Kindly complete the form below to receive a free sample of this Report

    Leading companies partner with us for data-driven Insights

    clients tt-cursor

    Petrochemical Market

    ID: MRFR/CnM/2286-CR
    100 Pages
    Priya Nagrale
    October 2022

    Petrochemicals Market Research Report Information By Type (Ethylene, Propylene, Butadiene, Benzene, Toluene, Xylene, Methanol), By Application (Polymers, Paints and Coatings, Solvents, Rubber, Adhesives and Sealants, Surfactants, Dyes, Other), And By Region (North America, Europe, Asia-Pacific, And Rest Of The World) – Market Forecast Till 2032

    Share:
    Download PDF ×

    We do not share your information with anyone. However, we may send you emails based on your report interest from time to time. You may contact us at any time to opt-out.

    Petrochemicals Market Research Report—Global Forecast till 2032 Infographic
    Purchase Options
    $ 4,950.0
    $ 5,950.0
    $ 7,250.0
    Table of Contents

    Petrochemical Market Summary

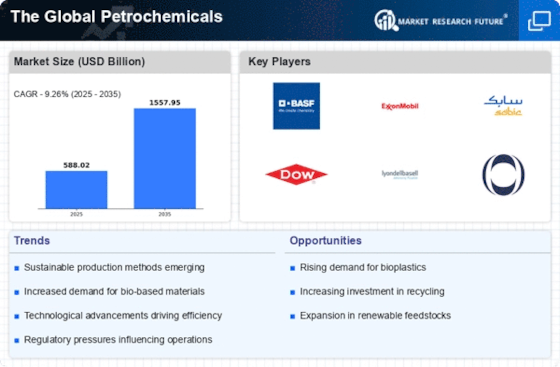
    As per Market Research Future Analysis, the Global Petrochemicals Market was valued at USD 565.55 Billion in 2023 and is projected to grow to USD 1178.20 Billion by 2032, with a CAGR of 9.26% from 2024 to 2032. The market is driven by the increasing demand for petrochemical products in various sectors, including packaging, automotive, and construction. Ethylene is expected to dominate the market due to its wide application in producing polymers, which hold the largest market share. The Asia-Pacific region is anticipated to lead the market growth, supported by rising demand and government investments.

    Key Market Trends & Highlights

    Key trends influencing the petrochemicals market include the rising demand for polymers and strategic expansions by major players.

    • Ethylene segment expected to dominate due to increased demand across building, packaging, and transportation sectors.
    • Polymers application holds the largest market share, driven by their use in plastics and synthetic fibers.
    • Asia-Pacific region projected to have the highest CAGR, fueled by government spending and manufacturing capacity expansion.
    • North America benefits from shale gas discoveries, making it a low-cost production hub.

    Market Size & Forecast

    2023 Market Size USD 565.55 Billion
    2024 Market Size USD 588.02 Billion
    2032 Market Size USD 1178.20 Billion
    CAGR (2024-2032) 9.26%

    Major Players

    Key companies include BASF SE, Sumitomo Chemical Company, Reliance Industries Limited, DowDuPont, Royal Dutch Shell, and others.

    Petrochemical Market Trends

      • Polymers are increasingly being used in the packaging and automobile industries

    Plastics used in the packaging sector are produced using petrochemicals as basic ingredients. Ethylene may be converted into polyethylene, which comes in hard, soft, and pliable forms. Flexible packaging, which is frequently used for packing and storing a broad variety of items, is frequently made using soft and malleable polyethylene as a raw material. However, rigid packaging is made from hard polyethylene. The need for ethylene is anticipated to rise in the next years due to the rise in rigid and flexible packaging requirements, which would subsequently raise demand for petrochemicals.

    The global petrochemicals market is poised for robust growth, driven by increasing demand across various sectors, including automotive and construction, while sustainability initiatives are reshaping production practices.

    U.S. Energy Information Administration

    Petrochemical Market Drivers

    Growing Energy Sector

    The energy sector's expansion is a crucial driver for the Global Global Petrochemicals Market Industry. As countries invest in energy infrastructure and transition towards cleaner energy sources, the demand for petrochemicals, particularly in the production of fuels and lubricants, remains strong. Petrochemicals play a vital role in refining processes and the production of various energy-related products. This ongoing growth in the energy sector is expected to sustain the market's momentum, with projections indicating that by 2035, the market could reach 1536.7 USD Billion. The interplay between energy demands and petrochemical production is likely to remain a focal point for industry stakeholders.

    Market Growth Projections

    The Global Global Petrochemicals Market Industry is projected to experience substantial growth in the coming years. With a market value of 588.0 USD Billion in 2024, it is anticipated to reach 1536.7 USD Billion by 2035. This growth trajectory suggests a compound annual growth rate (CAGR) of 9.13% from 2025 to 2035. Such projections indicate a robust demand for petrochemical products, driven by various factors, including technological advancements, increasing applications across industries, and supportive regulatory frameworks. The market's expansion reflects the critical role of petrochemicals in modern economies and their potential to adapt to evolving market dynamics.

    Rising Demand for Plastics

    The Global Global Petrochemicals Market Industry is experiencing a surge in demand for plastics, driven by their extensive applications across various sectors, including packaging, automotive, and construction. In 2024, the market is valued at approximately 588.0 USD Billion, reflecting the increasing reliance on plastic materials for consumer goods and industrial applications. This trend is expected to continue, as the global population grows and urbanization accelerates, leading to higher consumption rates. The versatility of petrochemical-derived plastics, such as polyethylene and polypropylene, further supports this demand, indicating a robust growth trajectory for the industry.

    Technological Advancements in Production

    Technological innovations in the production processes of petrochemicals are significantly influencing the Global Global Petrochemicals Market Industry. Enhanced methods, such as catalytic cracking and advanced polymerization techniques, are improving efficiency and reducing costs. These advancements not only optimize resource utilization but also minimize environmental impacts, aligning with global sustainability goals. As companies adopt these technologies, they are likely to increase their production capacities and meet the rising demand for petrochemical products. This shift may contribute to the projected market growth, with an anticipated CAGR of 9.13% from 2025 to 2035, underscoring the importance of technology in shaping the industry's future.

    Increasing Applications in Automotive Industry

    The automotive industry is increasingly relying on petrochemical products, which is a significant driver for the Global Global Petrochemicals Market Industry. With the rise of electric vehicles and advancements in automotive technology, materials derived from petrochemicals are essential for manufacturing lightweight components, enhancing fuel efficiency, and improving overall vehicle performance. As the automotive sector evolves, the demand for specialized petrochemical products, such as synthetic rubber and advanced composites, is expected to grow. This trend not only supports the market's expansion but also highlights the critical role of petrochemicals in meeting the automotive industry's future needs.

    Regulatory Support for Petrochemical Innovations

    Regulatory frameworks that support innovation within the petrochemical sector are pivotal for the Global Global Petrochemicals Market Industry. Governments worldwide are increasingly recognizing the importance of petrochemicals in driving economic growth and technological advancements. Policies that promote research and development, as well as sustainable practices, are likely to foster a conducive environment for industry growth. Such regulatory support can lead to enhanced investment in new technologies and processes, ultimately contributing to the market's expansion. As the industry adapts to these regulations, it may experience a more favorable growth trajectory, aligning with global sustainability initiatives.

    Market Segment Insights

    Petrochemicals Type Insights

    The market segmentation, based on Type, includes Ethylene, Propylene, Butadiene, Benzene, Toluene, Xylene, and Methanol. The Ethylene segment may dominate the market. This is attributed to a rise in ethylene demand across many sectors, including building, packaging, and transportation. During the projected period, it is anticipated that the consumption of ethylene in rising economies such as India, Brazil, Vietnam, and Thailand would increase due to the nations' ongoing modernization and thriving automotive and packaging industries.

    Petrochemicals Application Insights

    Based on Application, the global market segmentation includes Polymers, Paints and Coatings, Solvents, Rubber, Adhesives and Sealants, Surfactants, Dyes, Other. The Polymers application is holding the largest market. Polymers are long chains of molecules that are made up of repeating units, and they can be produced from a variety of petrochemical feedstocks, such as ethylene, propylene, and styrene. These materials are used to produce a wide range of products, including plastics, synthetic fibers, elastomers, and other polymeric materials.

    Figure 2:  Petrochemicals Market, by Type, 2022 & 2030 (USD Billion)

    Source: Secondary Research, Primary Research, Market Research Future Database, and Analyst Review

    Get more detailed insights about Petrochemicals Market Research Report—Global Forecast till 2032

    Regional Insights

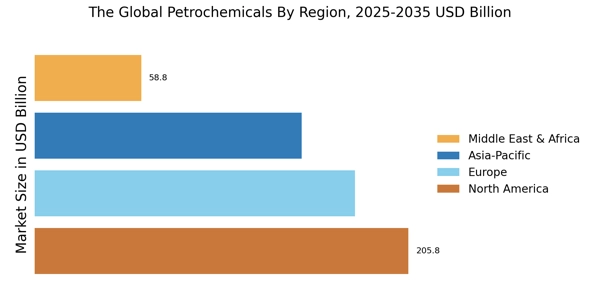
    By region, the study provides market insights into North America, Europe, Asia-Pacific, and the Rest of the World. The largest share markets were in the Asia-Pacific region. Manufacturers may expand in the Asia-Pacific market, which is expected to have the greatest CAGR by 2030. Increased government spending, increased manufacturing capacity, cooperation among important regional companies, and strong demand from end-use sectors are the major causes of this rise. The major producer and user of petrochemicals, in addition, is China. China has made a significant investment in on-purpose propylene processes and coal-to-chemicals manufacturing.

    Figure 3:  PETROCHEMICALS MARKET SHARE BY REGION 2022 (%) PETROCHEMICALS MARKET SHARE BY REGION 2022

    Source: Secondary Research, Primary Research, Market Research Future Database, and Analyst Review

    North America was the second-largest market. The expansion in the North American petrochemical industry is largely related to the shale gas discoveries in the US and Canada, which has greatly expanded the availability of natural gas liquids, changing North America into a low-cost location for the manufacture of chemicals. Also, several multinational corporations have plans to develop new facilities and grow in the area.

    Growth in Europe may be credited mostly to technical advances, a well-developed petrochemical industry, and a significant number of complex refineries.

    Key Players and Competitive Insights

    The major market players are investing a lot of money in R&D to expand their product lines, which will spur further market growth. With significant market development like new product releases, contractual agreements, mergers and acquisitions, increased investments, and collaboration with other organizations, market participants are also undertaking various strategic activities to expand their global presence. To grow and thrive in a market climate that is becoming more competitive and growing, competitors in the Petrochemicals industry must offer affordable products.

    Manufacturing locally to cut operating costs is one of the main business tactics manufacturers use in the global Petrochemicals industry to benefit customers and expand the market sector. Major market players, including BASF SE, Sumitomo Chemical Company, Reliance Industries Limited, DowDuPont, Royal Dutch Shell, and others, are attempting to increase market demand by funding R&D initiatives.

    BASF produces and sells intermediates, performance materials, petrochemicals, monomers, dispersions and pigments, performance chemicals, catalysts, coatings, and care chemicals. The conducts its operations through six business segments: Nutrition and Care, Chemicals, Industrial Solutions, Materials, Surface Technologies, and Agricultural Solutions. The company serves electronics, transportation, construction, energy and resources, consumer goods, health and nutrition, and agriculture industries.

    A chemical firm is Sumitomo Chemical. It offers substances including cyclohexanone, alumina, resorcinol, methanol, etc. as well as chemical intermediates. The firm works in a variety of industries, including those linked to IT, health and crop sciences, essential chemicals and plastics, energy and functional materials, pharmaceuticals, logistics, engineering, and other industries.

    Key Companies in the Petrochemical Market market include

    Industry Developments

    September 2021: SABIC announced a merger agreement with the National Petrochemical company. The merger would signify further consolidation in the Saudi petrochemicals sector.

    Future Outlook

    Petrochemical Market Future Outlook

    The Global Petrochemicals Market is projected to grow at 9.13% CAGR from 2024 to 2035, driven by rising demand for sustainable materials and technological advancements in production processes.

    New opportunities lie in:

    • Invest in bio-based petrochemical alternatives to capture eco-conscious consumer segments.
    • Develop advanced recycling technologies to enhance circular economy initiatives.
    • Expand into emerging markets with tailored product offerings to meet local demands.

    By 2035, the Global Petrochemicals Market is expected to achieve robust growth, positioning itself as a leader in sustainable innovation.

    Market Segmentation

    Petrochemicals Type Outlook

    • Ethylene
    • Propylene
    • Butadiene
    • Benzene
    • Toluene
    • Xylene
    • Methanol

    Petrochemicals Regional Outlook

    North America
    • US
    • Canada

    Petrochemicals Application Outlook

    • Polymers
    • Paints and Coatings
    • Solvents
    • Rubber
    • Adhesives and Sealants
    • Surfactants
    • Dyes
    • Other

    Report Scope

    Attribute/Metric Details
    Market Size 2023 USD 565.55 Billion
    Market Size 2024 USD 588.02 Billion
    Market Size 2032 USD 1178.20 Billion
    Compound Annual Growth Rate (CAGR) 9.26% (2024-2032)
    Base Year 2023
    Market Forecast Period 2024-2032
    Historical Data 2018 & 2022
    Market Forecast Units Value (USD Million)
    Report Coverage Revenue Forecast, Market Competitive Landscape, Growth Factors, and Trends
    Segments Covered Type, Application, and Region
    Geographies Covered North America, Europe, Asia Pacific, and Rest of the World
    Countries Covered The U.S, Canada, Germany, France, UK, Italy, Spain, China, Japan, India, Australia, South Korea, and Brazil
    Key Companies Profiled BASF, SABIC, TOTAL, Indian Oil Corporation Limited, Chevron Phillips Chemical Company, BP PLC, Sumitomo Chemical Company, Reliance Industries Limited, DowDuPont, Royal Dutch Shell
    Key Market Opportunities ·         Increasing use of polymers in the packaging and automotive industries
    Key Market Dynamics ·         Adoption of novel technologies

    Market Highlights

    Author
    Priya Nagrale
    Senior Research Analyst

    With an experience of over five years in market research industry (Chemicals & Materials domain), I gather and analyze market data from diverse sources to produce results, which are then presented back to a client. Also, provide recommendations based on the findings. As a Senior Research Analyst, I perform quality checks (QC) for market estimations, QC for reports, and handle queries and work extensively on client customizations. Also, handle the responsibilities of client proposals, report planning, report finalization, and execution

    Leave a Comment

    FAQs

    What is the size of the petrochemicals market?

    The global Petrochemical market size was valued at USD 565.55 Billion in 2023.

    What is the growth rate of the Petrochemicals market?

    The global market is projected to grow at a CAGR of 9.26% during the forecast period, 2024-2032

    Which region held the largest market share in the Petrochemical market?

    Asia Pacific had the largest share of the Global Petrochemicals Market.

    Who are the key players in the Petrochemicals market?

    The key players in the market are BASF, SABIC, TOTAL, Indian Oil Corporation Limited, Chevron Phillips Chemical Company, BP PLC, Sumitomo Chemical Company, Reliance Industries Limited, DowDuPont, and Royal Dutch Shell.

    Which Type led the market of Petrochemicals?

    The Ethylene category dominated the market in 2023.

    Which Application had the largest market share in the market?

    Polymers had the largest share in the global market for Petrochemicals.

    1. EXECUTIVE SUMMARY 20
      1. MARKET SUMMARY 20
        1. GLOBAL PETROCHEMICALS MARKET, BY TYPE 22
        2. GLOBAL PETROCHEMICALS
    2. MARKET, BY APPLICATION 23
      1. GLOBAL PETROCHEMICALS MARKET, BY END-USE INDUSTRY
        1. GLOBAL PETROCHEMICALS MARKET, BY REGION 25
    3. MARKET INTRODUCTION
      1. DEFINITION 26
      2. SCOPE OF THE STUDY 26
      3. MARKET STRUCTURE
    4. RESEARCH METHODOLOGY 28
      1. RESEARCH PROCESS 28
      2. PRIMARY
    5. RESEARCH 29
      1. SECONDARY RESEARCH 30
      2. MARKET SIZE ESTIMATION 30
      3. FORECAST MODEL 32
      4. LIST OF ASSUMPTIONS 32
    6. MARKET DYNAMICS 33
      1. INTRODUCTION 33
      2. DRIVERS 34
        1. INCREASING USE OF POLYMERS
    7. IN THE PACKAGING AND AUTOMOTIVE INDUSTRIES 34
      1. RISING DEMAND FOR METHANOL
    8. IN VARIOUS END-USE INDUSTRIES 34
      1. GROWING DEMAND FOR PAINTS & COATINGS
        1. EASY AVAILABILITY OF RAW MATERIALS FROM THE MIDDLE EAST 35
    9. RESTRAINTS 36
      1. INCREASING ENVIRONMENTAL CONCERNS 36
        1. SHIFT TOWARDS
    10. BIO-BASED CHEMICALS 36
      1. OPPORTUNITIES 37
        1. ADOPTION OF NOVEL TECHNOLOGIES
        2. RAPID INDUSTRIALIZATION & URBANIZATION IN ASIA-PACIFIC 37
    11. CHALLENGES 38
      1. VOLATILE RAW MATERIAL PRICES 38
    12. MARKET FACTOR ANALYSIS
      1. SUPPLY CHAIN ANALYSIS 40
        1. FEEDSTOCK PROCUREMENT 40
    13. PETROCHEMICAL MANUFACTURING 41
      1. DISTRIBUTION 41
        1. END USE 41
      2. PORTER’S FIVE FORCES ANALYSIS 42
        1. THREAT OF NEW ENTRANTS 42
        2. BARGAINING POWER OF SUPPLIERS 43
        3. THREAT OF SUBSTITUTES 43
        4. BARGAINING POWER OF BUYERS 43
        5. INTENSITY OF RIVALRY 43
    14. PRICING ANALYSIS 44
      1. REGULATORY OVERVIEW 44
        1. OVERVIEW OF EUROPEAN
    15. UNION REGULATIONS 44
      1. CLEAN AIR ACT 1990 44
      2. TRADING ANALYSIS
        1. ETHYLENE (HS CODE-290121) 45
        2. PROPYLENE (HS CODE-290122)
        3. BUTADIENE (HS CODE-290124) 48
        4. BENZENE (HS CODE-290220)
        5. TOLUENE (HS CODE-290230) 50
        6. XYLENE (HS CODE-290244) 51
        7. METHANOL (HS CODE-290511) 52
      3. IMPACT OF COVID-19 ON THE GLOBAL PETROCHEMICALS
    16. MARKET 53
      1. DEMAND-SIDE IMPACT 53
        1. SUPPLY-SIDE IMPACT 54
    17. GLOBAL PETROCHEMICALS MARKET, BY TYPE 55
      1. OVERVIEW 55
        1. PETROCHEMICALS:
    18. MARKET ESTIMATES & FORECAST BY TYPE, 2023–2030 56
      1. PETROCHEMICALS:
    19. MARKET ESTIMATES & FORECAST BY TYPE, 2023–2030 57
      1. ETHYLENE 57
        1. ETHYLENE: MARKET ESTIMATES & FORECAST BY REGION,2023–2030 57
      2. PROPYLENE 58
        1. PROPYLENE: MARKET ESTIMATES & FORECAST BY REGION,2023–2030
      3. BUTADIENE 59
        1. BUTADIENE: MARKET ESTIMATES & FORECAST BY
    20. REGION,2023–2030 59
      1. BENZENE 60
        1. BENZENE: MARKET ESTIMATES
    21. & FORECAST BY REGION,2023–2030 60
      1. TOLUENE 61
        1. TOLUENE:
    22. MARKET ESTIMATES & FORECAST BY REGION,2023–2030 61
      1. XYLENE 62
        1. XYLENE: MARKET ESTIMATES & FORECAST BY REGION,2023–2030 62
      2. METHANOL 63
        1. METHANOL: MARKET ESTIMATES & FORECAST BY REGION,2023–2030
      3. OTHERS 64
        1. OTHERS: MARKET ESTIMATES & FORECAST BY REGION,2023–2030
    23. GLOBAL PETROCHEMICALS MARKET, BY APPLICATION 66
      1. OVERVIEW 66
        1. PETROCHEMICALS: MARKET ESTIMATES & FORECAST BY APPLICATION, 2023–2030
        2. PETROCHEMICALS: MARKET ESTIMATES & FORECAST BY APPLICATION, 2023–2030
      2. ADHESIVES AND SEALANTS 68
        1. ADHESIVES AND SEALANTS: MARKET
    24. ESTIMATES & FORECAST BY REGION,2023–2030 68
      1. POLYMERS 69
    25. POLYMERS: MARKET ESTIMATES & FORECAST BY REGION,2023–2030 69
    26. PAINTS AND COATINGS 70
      1. PAINTS AND COATINGS: MARKET ESTIMATES & FORECAST
    27. BY REGION,2023–2030 70
      1. DYES 71
        1. DYES: MARKET ESTIMATES
    28. & FORECAST BY REGION,2023–2030 71
      1. SURFACTANTS 72
        1. SURFACTANTS:
    29. MARKET ESTIMATES & FORECAST BY REGION,2023–2030 72
      1. RUBBER 73
        1. RUBBER: MARKET ESTIMATES & FORECAST BY REGION,2023–2030 73
      2. SOLVENTS 74
        1. SOLVENTS: MARKET ESTIMATES & FORECAST BY REGION,2023–2030
      3. OTHERS 75
        1. OTHERS: MARKET ESTIMATES & FORECAST BY REGION,2023–2030
    30. GLOBAL PETROCHEMICALS MARKET, BY END-USE 77
      1. OVERVIEW 77
    31. PETROCHEMICALS: MARKET ESTIMATES & FORECAST BY END-USE, 2023–2030 78
      1. PETROCHEMICALS: MARKET ESTIMATES & FORECAST BY END-USE, 2023–2030
      2. PACKAGING 79
        1. AEROSPACE & DEFENSE: MARKET ESTIMATES &
    32. FORECAST BY REGION,2023–2030 79
      1. AUTOMOTIVE & TRANSPORTATION 80
        1. AUTOMOTIVE & TRANSPORTATION: MARKET ESTIMATES & FORECAST BY REGION,2023–2030
      2. BUILDING & CONSTRUCTION 81
        1. BUILDING & CONSTRUCTION:
    33. MARKET ESTIMATES & FORECAST BY REGION,2023–2030 81
      1. ELECTRICAL
    34. & ELECTRONICS 82
      1. ELECTRICAL & ELECTRONICS: MARKET ESTIMATES &
    35. FORECAST BY REGION,2023–2030 82
      1. HEALTHCARE 83
        1. HEALTHCARE:
    36. MARKET ESTIMATES & FORECAST BY REGION,2023–2030 83
      1. OTHERS 84
        1. OTHERS: MARKET ESTIMATES & FORECAST BY REGION,2023–2030 84
    37. GLOBAL PETROCHEMICALS MARKET, BY REGION 86
      1. OVERVIEW 86
      2. NORTH
    38. AMERICA 90
      1. US 94
        1. CANADA 97
      2. EUROPE 100
    39. GERMANY 104
      1. UK 107
        1. FRANCE 110
        2. SPAIN 113
    40. ITALY 116
      1. RUSSIA 119
        1. POLAND 122
        2. REST OF EUROPE
      2. ASIA-PACIFIC 129
        1. CHINA 133
        2. JAPAN 136
    41. INDIA 139
      1. SOUTH KOREA 142
        1. AUSTRALIA & NEW ZEALAND 145
        2. REST OF ASIA-PACIFIC 148
      2. LATIN AMERICA 152
        1. BRAZIL 156
        2. MEXICO 159
        3. ARGENTINA 162
        4. REST OF LATIN AMERICA 165
      3. THE MIDDLE EAST & AFRICA 169
        1. TURKEY 173
        2. GCC COUNTRIES
        3. SOUTH AFRICA 179
        4. REST OF THE MIDDLE EAST & AFRICA
    42. COMPETITIVE LANDSCAPE 186
      1. MARKET INTRODUCTION 186
    43. RECENT DEVELOPMENTS 186
      1. GLOBAL MARKET STRATEGY ANALYSIS 190
    44. COMPETITIVE BENCHMARKING 191
    45. COMPANY PROFILES 192
      1. BASF SE 192
        1. COMPANY OVERVIEW 192
        2. FINANCIAL OVERVIEW 193
        3. PRODUCTS
    46. OFFERED 193
      1. KEY DEVELOPMENTS 197
        1. SWOT ANALYSIS 198
    47. KEY STRATEGIES 198
      1. SABIC 199
        1. COMPANY OVERVIEW 199
    48. FINANCIAL OVERVIEW 199
      1. PRODUCTS OFFERED 200
        1. KEY DEVELOPMENTS
        2. SWOT ANALYSIS 202
        3. KEY STRATEGIES 202
      2. EXXON
    49. MOBIL CORPORATION 203
      1. COMPANY OVERVIEW 203
        1. FINANCIAL OVERVIEW
        2. PRODUCTS OFFERED 205
        3. KEY DEVELOPMENTS 206
    50. SWOT ANALYSIS 206
      1. KEY STRATEGIES 206
      2. LYONDELLBASELL INDUSTRIES
    51. N.V. 207
      1. COMPANY OVERVIEW 207
        1. FINANCIAL OVERVIEW 207
        2. PRODUCTS OFFERED 208
        3. KEY DEVELOPMENTS 211
        4. SWOT
    52. ANALYSIS 212
      1. KEY STRATEGIES 212
      2. TOTAL SE 213
        1. COMPANY
    53. OVERVIEW 213
      1. FINANCIAL OVERVIEW 213
        1. PRODUCTS OFFERED 214
        2. KEY DEVELOPMENTS 214
        3. SWOT ANALYSIS 215
        4. KEY STRATEGIES
      2. CHEVRON PHILLIPS CHEMICAL COMPANY 216
        1. COMPANY OVERVIEW
        2. FINANCIAL OVERVIEW 216
        3. PRODUCTS OFFERED 217
    54. KEY DEVELOPMENTS 218
      1. SWOT ANALYSIS 219
        1. KEY STRATEGIES 219
      2. RELIANCE INDUSTRIES LIMITED 220
        1. COMPANY OVERVIEW 220
    55. FINANCIAL OVERVIEW 220
      1. PRODUCTS OFFERINGS 221
        1. KEY DEVELOPMENTS
        2. SWOT ANALYSIS 222
        3. KEY STRATEGY 222
      2. DOW 223
        1. COMPANY OVERVIEW 223
        2. FINANCIAL OVERVIEW 223
        3. PRODUCTS
    56. OFFERED 224
      1. KEY DEVELOPMENTS 225
        1. SWOT ANALYSIS 226
    57. KEY STRATEGIES 226
      1. BP P.L.C. 227
        1. COMPANY OVERVIEW 227
    58. FINANCIAL OVERVIEW 228
      1. PRODUCTS OFFERED 228
        1. KEY DEVELOPMENTS
        2. SWOT ANALYSIS 229
        3. KEY STRATEGIES 229
      2. ROYAL
    59. DUTCH SHELL 230
      1. COMPANY OVERVIEW 230
        1. FINANCIAL OVERVIEW
        2. PRODUCTS OFFERED 231
        3. KEY DEVELOPMENTS 233
    60. SWOT ANALYSIS 234
      1. KEY STRATEGIES 234
      2. CHINA PETROLEUM &
    61. CHEMICAL CORPORATION 235
      1. COMPANY OVERVIEW 235
        1. FINANCIAL
    62. OVERVIEW 235
      1. PRODUCTS OFFERED 236
        1. KEY DEVELOPMENTS 236
        2. SWOT ANALYSIS 237
        3. KEY STRATEGY 237
      2. INDIAN OIL
    63. CORPORATION LTD 238
      1. COMPANY OVERVIEW 238
        1. FINANCIAL OVERVIEW
        2. PRODUCTS OFFERED 239
        3. KEY DEVELOPMENTS 239
    64. SWOT ANALYSIS 240
      1. KEY STRATEGIES 240
      2. CHINA NATIONAL PETROLEUM
    65. CORPORATION 241
      1. COMPANY OVERVIEW 241
        1. FINANCIAL OVERVIEW
        2. PRODUCTS OFFERED 242
        3. KEY DEVELOPMENTS 242
    66. SWOT ANALYSIS 243
      1. KEY STRATEGY 243
      2. SUMITOMO CHEMICAL CO.,
    67. LTD 244
      1. COMPANY OVERVIEW 244
        1. FINANCIAL OVERVIEW 244
        2. PRODUCTS OFFERED 245
        3. KEY DEVELOPMENTS 245
        4. SWOT
    68. ANALYSIS 246
      1. KEY STRATEGY 246
    69. APPENDIX 247
      1. REFERENCES
      2. RELATED REPORTS 248
    70. LIST OF ASSUMPTIONS 32
    71. COUNTRIES (2020) 35
    72. OF TRADING COUNTRIES, BY EXPORTS, 2023 46
    73. BY IMPORTS, 2023 46
    74. COUNTRIES, BY EXPORTS, 2023 48
    75. BY EXPORT, 2023 50
    76. COUNTRIES, BY IMPORTS, 2023 52
    77. (USD BILLION) 56
    78. TYPE, 2023–2030 (MILLION TONS) 57
    79. & FORECAST, BY REGION, 2023–2030 (USD BILLION) 57
    80. MARKET ESTIMATES & FORECAST, BY REGION, 2023–2030 (MILLION TONS) 58
    81. (USD BILLION) 58
    82. –2030 (MILLION TONS) 59
    83. FORECAST, BY REGION, 2023–2030 (USD BILLION) 59
    84. ESTIMATES & FORECAST, BY REGION, 2023–2030 (MILLION TONS) 60
    85. BENZENE MARKET ESTIMATES & FORECAST, BY REGION, 2023–2030 (USD BILLION)
    86. (MILLION TONS) 61
    87. –2030 (USD BILLION) 61
    88. BY REGION, 2023–2030 (MILLION TONS) 62
    89. & FORECAST, BY REGION, 2023–2030 (USD BILLION) 62
    90. MARKET ESTIMATES & FORECAST, BY REGION, 2023–2030 (MILLION TONS) 63
    91. (USD BILLION) 63
    92. –2030 (MILLION TONS) 64
    93. BY REGION, 2023–2030 (USD BILLION) 64
    94. & FORECAST, BY REGION, 2023–2030 (MILLION TONS) 65
    95. MARKET ESTIMATES & FORECAST, BY APPLICATION, 2023–2030 (USD BILLION) 67
    96. (MILLION TONS) 68
    97. BY REGION, 2023–2030 (USD BILLION) 68
    98. MARKET ESTIMATES & FORECAST, BY REGION, 2023–2030 (MILLION TONS) 69
    99. (USD BILLION) 69
    100. –2030 (MILLION TONS) 70
    101. & FORECAST, BY REGION, 2023–2030 (USD BILLION) 70
    102. AND COATINGS MARKET ESTIMATES & FORECAST, BY REGION, 2023–2030 (MILLION
    103. TONS) 71
    104. (USD BILLION) 71
    105. –2030 (MILLION TONS) 72
    106. FORECAST, BY REGION, 2023–2030 (USD BILLION) 72
    107. MARKET ESTIMATES & FORECAST, BY REGION, 2023–2030 (MILLION TONS) 73
    108. BILLION) 73
    109. (MILLION TONS) 74
    110. –2030 (USD BILLION) 74
    111. BY REGION, 2023–2030 (MILLION TONS) 75
    112. & FORECAST, BY REGION, 2023–2030 (USD BILLION) 75
    113. MARKET ESTIMATES & FORECAST, BY REGION, 2023–2030 (MILLION TONS) 76
    114. (USD BILLION) 78
    115. END-USE, 2023–2030 (MILLION TONS) 79
    116. MARKET ESTIMATES & FORECAST, BY REGION, 2023–2030 (USD BILLION) 79
    117. (MILLION TONS) 80
    118. & FORECAST, BY REGION, 2023–2030 (USD BILLION) 80
    119. & TRANSPORTATION MARKET ESTIMATES & FORECAST, BY REGION, 2023–2030
    120. (MILLION TONS) 81
    121. FORECAST, BY REGION, 2023–2030 (USD BILLION) 81
    122. CONSTRUCTION MARKET ESTIMATES & FORECAST, BY REGION, 2023–2030 (MILLION
    123. TONS) 82
    124. BY REGION, 2023–2030 (USD BILLION) 82
    125. MARKET ESTIMATES & FORECAST, BY REGION, 2023–2030 (MILLION TONS) 83
    126. (USD BILLION) 83
    127. –2030 (MILLION TONS) 84
    128. BY REGION, 2023–2030 (USD BILLION) 84
    129. & FORECAST, BY REGION, 2023–2030 (MILLION TONS) 85
    130. PETROCHEMICALS MARKET, BY REGION, 2023–2030 (USD BILLION) 88
    131. GLOBAL PETROCHEMICALS MARKET, BY REGION, 2023–2030 (MILLION TONS) 89
    132. NORTH AMERICA: PETROCHEMICALS MARKET, BY COUNTRY, 2023–2030 (USD BILLION)
    133. (MILLION TONS) 90
    134. (USD BILLION) 91
    135. (MILLION TONS) 91
    136. –2030 (USD BILLION) 92
    137. BY APPLICATION, 2023–2030 (MILLION TONS) 92
    138. MARKET, BY END-USE, 2023–2030 (USD BILLION) 93
    139. PETROCHEMICALS MARKET, BY END-USE, 2023–2030 (MILLION TONS) 93
    140. US: PETROCHEMICALS MARKET, BY TYPE, 2023–2030 (USD BILLION) 94
    141. US: PETROCHEMICALS MARKET, BY TYPE, 2023–2030 (MILLION TONS) 94
    142. US: PETROCHEMICALS MARKET, BY APPLICATION, 2023–2030 (USD BILLION) 95
    143. TONS) 96
    144. BILLION) 97
    145. (MILLION TONS) 97
    146. (USD BILLION) 98
    147. (MILLION TONS) 98
    148. (USD BILLION) 99
    149. (MILLION TONS) 99
    150. (USD BILLION) 100
    151. (MILLION TONS) 101
    152. (USD BILLION) 101
    153. (MILLION TONS) 102
    154. –2030 (USD BILLION) 102
    155. APPLICATION, 2023–2030 (MILLION TONS) 103
    156. MARKET, BY END-USE, 2023–2030 (USD BILLION) 103
    157. MARKET, BY END-USE, 2023–2030 (MILLION TONS) 104
    158. MARKET, BY TYPE, 2023–2030 (USD BILLION) 104
    159. MARKET, BY TYPE, 2023–2030 (MILLION TONS) 105
    160. MARKET, BY APPLICATION, 2023–2030 (USD BILLION) 105
    161. PETROCHEMICALS MARKET, BY APPLICATION, 2023–2030 (MILLION TONS) 106
    162. GERMANY: PETROCHEMICALS MARKET, BY END-USE, 2023–2030 (USD BILLION) 106
    163. TONS) 107
    164. BILLION) 107
    165. (MILLION TONS) 108
    166. (USD BILLION) 108
    167. (MILLION TONS) 109
    168. (USD BILLION) 109
    169. (MILLION TONS) 110
    170. (USD BILLION) 110
    171. (MILLION TONS) 111
    172. –2030 (USD BILLION) 111
    173. BY APPLICATION, 2023–2030 (MILLION TONS) 112
    174. MARKET, BY END-USE, 2023–2030 (USD BILLION) 112
    175. MARKET, BY END-USE, 2023–2030 (MILLION TONS) 113
    176. MARKET, BY TYPE, 2023–2030 (USD BILLION) 113
    177. MARKET, BY TYPE, 2023–2030 (MILLION TONS) 114
    178. MARKET, BY APPLICATION, 2023–2030 (USD BILLION) 114
    179. PETROCHEMICALS MARKET, BY APPLICATION, 2023–2030 (MILLION TONS) 115
    180. SPAIN: PETROCHEMICALS MARKET, BY END-USE, 2023–2030 (USD BILLION) 115
    181. TONS) 117
    182. (USD BILLION) 117
    183. (MILLION TONS) 118
    184. (USD BILLION) 118
    185. (MILLION TONS) 119
    186. (USD BILLION) 119
    187. (MILLION TONS) 120
    188. –2030 (USD BILLION) 120
    189. BY APPLICATION, 2023–2030 (MILLION TONS) 121
    190. MARKET, BY END-USE, 2023–2030 (USD BILLION) 121
    191. MARKET, BY END-USE, 2023–2030 (MILLION TONS) 122
    192. MARKET, BY TYPE, 2023–2030 (USD BILLION) 122
    193. MARKET, BY TYPE, 2023–2030 (MILLION TONS) 123
    194. MARKET, BY APPLICATION, 2023–2030 (USD BILLION) 123
    195. PETROCHEMICALS MARKET, BY APPLICATION, 2023–2030 (MILLION TONS) 124
    196. POLAND: PETROCHEMICALS MARKET, BY END-USE, 2023–2030 (USD BILLION) 124
    197. TONS) 125
    198. (USD BILLION) 125
    199. –2030 (MILLION TONS) 126
    200. MARKET, BY APPLICATION, 2023–2030 (USD BILLION) 126
    201. EUROPE: PETROCHEMICALS MARKET, BY APPLICATION, 2023–2030 (MILLION TONS) 127
    202. BILLION) 127
    203. (MILLION TONS) 128
    204. –2030 (USD BILLION) 129
    205. BY COUNTRY, 2023–2030 (MILLION TONS) 130
    206. MARKET, BY TYPE, 2023–2030 (USD BILLION) 130
    207. PETROCHEMICALS MARKET, BY TYPE, 2023–2030 (MILLION TONS) 131
    208. ASIA-PACIFIC: PETROCHEMICALS MARKET, BY APPLICATION, 2023–2030 (USD BILLION)
    209. (MILLION TONS) 132
    210. –2030 (USD BILLION) 132
    211. BY END-USE, 2023–2030 (MILLION TONS) 133
    212. MARKET, BY TYPE, 2023–2030 (USD BILLION) 133
    213. MARKET, BY TYPE, 2023–2030 (MILLION TONS) 134
    214. MARKET, BY APPLICATION, 2023–2030 (USD BILLION) 134
    215. PETROCHEMICALS MARKET, BY APPLICATION, 2023–2030 (MILLION TONS) 135
    216. CHINA: PETROCHEMICALS MARKET, BY END-USE, 2023–2030 (USD BILLION) 135
    217. TONS) 137
    218. (USD BILLION) 137
    219. (MILLION TONS) 138
    220. (USD BILLION) 138
    221. (MILLION TONS) 139
    222. (USD BILLION) 139
    223. (MILLION TONS) 140
    224. –2030 (USD BILLION) 140
    225. APPLICATION, 2023–2030 (MILLION TONS) 141
    226. MARKET, BY END-USE, 2023–2030 (USD BILLION) 141
    227. MARKET, BY END-USE, 2023–2030 (MILLION TONS) 142
    228. PETROCHEMICALS MARKET, BY TYPE, 2023–2030 (USD BILLION) 142
    229. SOUTH KOREA: PETROCHEMICALS MARKET, BY TYPE, 2023–2030 (MILLION TONS) 143
    230. (USD BILLION) 143
    231. –2030 (MILLION TONS) 144
    232. BY END-USE, 2023–2030 (USD BILLION) 144
    233. MARKET, BY END-USE, 2023–2030 (MILLION TONS) 145
    234. & NEW ZEALAND: PETROCHEMICALS MARKET, BY TYPE, 2023–2030 (USD BILLION)
    235. –2030 (MILLION TONS) 146
    236. MARKET, BY APPLICATION, 2023–2030 (USD BILLION) 146
    237. & NEW ZEALAND: PETROCHEMICALS MARKET, BY APPLICATION, 2023–2030 (MILLION
    238. TONS) 147
    239. END-USE, 2023–2030 (USD BILLION) 147
    240. PETROCHEMICALS MARKET, BY END-USE, 2023–2030 (MILLION TONS) 148
    241. REST OF ASIA-PACIFIC: PETROCHEMICALS MARKET, BY TYPE, 2023–2030 (USD BILLION)
    242. (MILLION TONS) 149
    243. APPLICATION, 2023–2030 (USD BILLION) 149
    244. PETROCHEMICALS MARKET, BY APPLICATION, 2023–2030 (MILLION TONS) 150
    245. REST OF ASIA-PACIFIC: PETROCHEMICALS MARKET, BY END-USE, 2023–2030 (USD
    246. BILLION) 150
    247. –2030 (MILLION TONS) 151
    248. MARKET, BY COUNTRY, 2023–2030 (USD BILLION) 152
    249. PETROCHEMICALS MARKET, BY COUNTRY, 2023–2030 (MILLION TONS) 153
    250. LATIN AMERICA: PETROCHEMICALS MARKET, BY TYPE, 2023–2030 (USD BILLION)
    251. (MILLION TONS) 154
    252. –2030 (USD BILLION) 154
    253. BY APPLICATION, 2023–2030 (MILLION TONS) 155
    254. PETROCHEMICALS MARKET, BY END-USE, 2023–2030 (USD BILLION) 155
    255. LATIN AMERICA: PETROCHEMICALS MARKET, BY END-USE, 2023–2030 (MILLION TONS)
    256. BILLION) 156
    257. (MILLION TONS) 157
    258. –2030 (USD BILLION) 157
    259. BY APPLICATION, 2023–2030 (MILLION TONS) 158
    260. MARKET, BY END-USE, 2023–2030 (USD BILLION) 158
    261. MARKET, BY END-USE, 2023–2030 (MILLION TONS) 159
    262. MARKET, BY TYPE, 2023–2030 (USD BILLION) 159
    263. MARKET, BY TYPE, 2023–2030 (MILLION TONS) 160
    264. MARKET, BY APPLICATION, 2023–2030 (USD BILLION) 160
    265. PETROCHEMICALS MARKET, BY APPLICATION, 2023–2030 (MILLION TONS) 161
    266. MEXICO: PETROCHEMICALS MARKET, BY END-USE, 2023–2030 (USD BILLION) 161
    267. TONS) 162
    268. (USD BILLION) 162
    269. (MILLION TONS) 163
    270. –2030 (USD BILLION) 163
    271. BY APPLICATION, 2023–2030 (MILLION TONS) 164
    272. MARKET, BY END-USE, 2023–2030 (USD BILLION) 164
    273. PETROCHEMICALS MARKET, BY END-USE, 2023–2030 (MILLION TONS) 165
    274. REST OF LATIN AMERICA: PETROCHEMICALS MARKET, BY TYPE, 2023–2030 (USD
    275. BILLION) 165
    276. –2030 (MILLION TONS) 166
    277. MARKET, BY APPLICATION, 2023–2030 (USD BILLION) 166
    278. LATIN AMERICA: PETROCHEMICALS MARKET, BY APPLICATION, 2023–2030 (MILLION TONS)
    279. (USD BILLION) 167
    280. END-USE, 2023–2030 (MILLION TONS) 168
    281. AFRICA: PETROCHEMICALS MARKET, BY COUNTRY, 2023–2030 (USD BILLION) 169
    282. (MILLION TONS) 170
    283. BY TYPE, 2023–2030 (USD BILLION) 170
    284. AFRICA: PETROCHEMICALS MARKET, BY TYPE, 2023–2030 (MILLION TONS) 171
    285. THE MIDDLE EAST & AFRICA: PETROCHEMICALS MARKET, BY APPLICATION, 2023–2030
    286. (USD BILLION) 171
    287. BY APPLICATION, 2023–2030 (MILLION TONS) 172
    288. & AFRICA: PETROCHEMICALS MARKET, BY END-USE, 2023–2030 (USD BILLION) 172
    289. (MILLION TONS) 173
    290. (USD BILLION) 173
    291. (MILLION TONS) 174
    292. –2030 (USD BILLION) 174
    293. BY APPLICATION, 2023–2030 (MILLION TONS) 175
    294. MARKET, BY END-USE, 2023–2030 (USD BILLION) 175
    295. MARKET, BY END-USE, 2023–2030 (MILLION TONS) 176
    296. PETROCHEMICALS MARKET, BY TYPE, 2023–2030 (USD BILLION) 176
    297. GCC COUNTRIES: PETROCHEMICALS MARKET, BY TYPE, 2023–2030 (MILLION TONS) 177
    298. (USD BILLION) 177

    Petrochemicals Market Segmentation

    Market Segmentation Overview

    • Detailed segmentation data will be available in the full report
    • Comprehensive analysis by multiple parameters
    • Regional and country-level breakdowns
    • Market size forecasts by segment
    Petrochemicals Market Research Report—Global Forecast till 2032 Infographic
    Free Sample Request

    Kindly complete the form below to receive a free sample of this Report

    Customer Strories

    “I am very pleased with how market segments have been defined in a relevant way for my purposes (such as "Portable Freezers & refrigerators" and "last-mile"). In general the report is well structured. Thanks very much for your efforts.”

    Victoria Milne Founder
    Case Study

    Chemicals and Materials