• Cat-intel
  • MedIntelliX
  • Resources
  • About Us
  • Request Free Sample ×

    Kindly complete the form below to receive a free sample of this Report

    Leading companies partner with us for data-driven Insights

    clients tt-cursor

    Organic Beauty & Personal Care Ingredients Market

    ID: MRFR/CR/0785-HCR
    128 Pages
    Pradeep Nandi
    September 2025

    Organic Beauty and Personal Care Ingredients Market Research Report Information by Plant Type (Aloe Vera, Avocado, Rose, Lavender, Jojoba, Rosemary, Neem and others), Ingredient Type (Vegetables, Herbs, Natural Oils, Algae, Minerals & Vitamins and others), Application (Cleansing, Exfoliation, Moisturization, UV-protection, Anti-aging, Multi-functional and others) and Region (North America, Europe, Asia-Pacific and Rest of the World) - Forecast till 2032

    Share:
    Download PDF ×

    We do not share your information with anyone. However, we may send you emails based on your report interest from time to time. You may contact us at any time to opt-out.

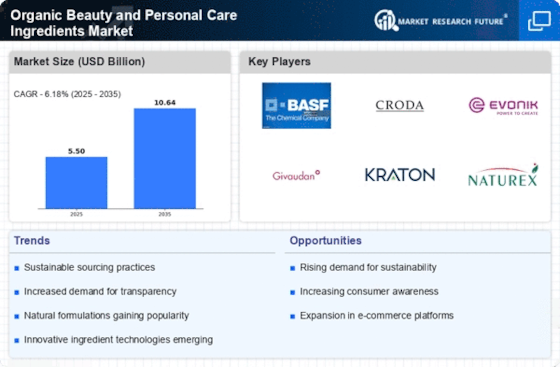
    Organic Beauty and Personal Care Ingredients Market Research Report - Global Forecast till 2032 Infographic
    Purchase Options
    $ 4,950.0
    $ 5,950.0
    $ 7,250.0
    Table of Contents

    Organic Beauty & Personal Care Ingredients Market Summary

    The Global Organic Beauty and Personal Care Ingredients Market is poised for substantial growth, projected to reach 12.0 USD Billion by 2035 from a base of 5.5 USD Billion in 2024.

    Key Market Trends & Highlights

    Global Organic Beauty & Personal Care Ingredients Key Trends and Highlights

    • The market is expected to grow from 5.5 USD Billion in 2024 to 12.0 USD Billion by 2035.
    • A compound annual growth rate (CAGR) of 7.35% is anticipated from 2025 to 2035.
    • Increasing consumer awareness regarding the benefits of organic ingredients is driving market expansion.
    • Growing adoption of sustainable practices due to environmental concerns is a major market driver.

    Market Size & Forecast

    2024 Market Size 5.5 (USD Billion)
    2035 Market Size 12.0 (USD Billion)
    CAGR (2025-2035) 7.35%

    Major Players

    Cargill, Incorporated (US), The Hain Celestial Group (US), Provital Group (Spain), Nan Liu Enterprise Co., Ltd (China), Jedwards International, Inc. (US), Earth Supplied Products, LLC (US), Multiple Organics Inc. (US), Ciranda, Inc. (US), Croda International Plc (UK), BASF SE (Germany), Grain Millers, Inc. (US), Huntsman International LLC (US)

    Organic Beauty & Personal Care Ingredients Market Trends

    The increasing consumer preference for sustainable and eco-friendly products appears to be driving a notable shift towards organic ingredients in the beauty and personal care sector.

    U.S. Department of Agriculture

    Organic Beauty & Personal Care Ingredients Market Drivers

    Market Growth Projections

    The Global Organic Beauty and Personal Care Ingredients Market Industry is projected to experience substantial growth in the coming years. With a market valuation of 5.5 USD Billion in 2024, it is anticipated to reach 12.0 USD Billion by 2035. This growth trajectory suggests a compound annual growth rate of 7.35% from 2025 to 2035. Factors contributing to this expansion include rising consumer demand for organic products, regulatory support for organic standards, and increased awareness of sustainability. As the market evolves, it is likely to attract new entrants and innovations, further enhancing its dynamics.

    Regulatory Support for Organic Standards

    Regulatory frameworks supporting organic standards significantly influence the Global Organic Beauty and Personal Care Ingredients Market Industry. Governments worldwide are implementing stricter regulations regarding the use of synthetic ingredients, thereby encouraging manufacturers to adopt organic alternatives. For instance, the European Union has established guidelines that promote organic certification for beauty products. This regulatory support not only enhances consumer trust but also stimulates market growth. As a result, the industry is likely to see an increase in certified organic products, aligning with the projected market growth to 12.0 USD Billion by 2035, indicating a robust trajectory for the Global Organic Beauty and Personal Care Ingredients Market Industry.

    Rising Consumer Demand for Natural Products

    The Global Organic Beauty and Personal Care Ingredients Market Industry experiences a notable surge in consumer demand for natural and organic products. This trend is driven by increasing awareness of the harmful effects of synthetic chemicals in personal care items. Consumers are gravitating towards products that are perceived as safer and more environmentally friendly. In 2024, the market is valued at 5.5 USD Billion, reflecting a growing preference for organic ingredients. This shift is likely to continue, as consumers increasingly prioritize sustainability and health in their purchasing decisions, thereby propelling the growth of the Global Organic Beauty and Personal Care Ingredients Market Industry.

    Growing Awareness of Environmental Sustainability

    Growing awareness of environmental sustainability is a driving force behind the Global Organic Beauty and Personal Care Ingredients Market Industry. Consumers are increasingly concerned about the ecological impact of their purchasing choices, leading to a preference for products that utilize sustainable practices. Brands that incorporate eco-friendly packaging and ethically sourced ingredients are gaining traction in the market. This shift not only reflects changing consumer values but also aligns with global sustainability goals. As the market adapts to these demands, the industry is poised for growth, with expectations of reaching 12.0 USD Billion by 2035, highlighting the importance of sustainability in the Global Organic Beauty and Personal Care Ingredients Market Industry.

    Technological Advancements in Ingredient Sourcing

    Technological advancements in sourcing and processing organic ingredients play a crucial role in shaping the Global Organic Beauty and Personal Care Ingredients Market Industry. Innovations in extraction and formulation techniques enable manufacturers to enhance the efficacy and stability of organic products. For example, advancements in cold-press extraction methods allow for the preservation of beneficial properties in natural oils. This not only improves product quality but also meets the rising consumer expectations for performance. As the industry evolves, these technological improvements are likely to contribute to a compound annual growth rate of 7.35% from 2025 to 2035, further solidifying the market's position.

    Influence of Social Media and Celebrity Endorsements

    The influence of social media and celebrity endorsements significantly impacts consumer behavior within the Global Organic Beauty and Personal Care Ingredients Market Industry. Platforms such as Instagram and TikTok serve as powerful marketing tools, where influencers promote organic beauty products to their followers. This trend has led to increased visibility and desirability of organic brands, particularly among younger demographics. As consumers seek authenticity and transparency, brands that effectively leverage social media are likely to capture a larger market share. Consequently, this dynamic is expected to contribute to the market's growth, aligning with the projected increase to 12.0 USD Billion by 2035.

    Market Segment Insights

    Regional Insights

    Key Companies in the Organic Beauty & Personal Care Ingredients Market market include

    Industry Developments

    Future Outlook

    Organic Beauty & Personal Care Ingredients Market Future Outlook

    The Global Organic Beauty & Personal Care Ingredients Market is projected to grow at a 7.35% CAGR from 2024 to 2035, driven by increasing consumer demand for sustainable products and regulatory support.

    New opportunities lie in:

    • Develop innovative formulations using plant-based ingredients to meet rising consumer preferences.
    • Leverage digital marketing strategies to enhance brand visibility and consumer engagement.
    • Expand distribution channels through e-commerce platforms to reach a broader audience.

    By 2035, the market is expected to achieve substantial growth, reflecting evolving consumer trends and heightened sustainability awareness.

    Market Segmentation

    Report Scope

    Attribute/Metric Details
    Market Size 2023 USD 5.3 Billion
    Market Size 2024 USD 5.5 Billion
    Market Size 2032 USD 10.02 Billion
    Compound Annual Growth Rate (CAGR) 6.18% (2024-2032)
    Base Year 2023
    Market Forecast Period 2024-2032
    Historical Data 2019- 2022
    Market Forecast Units Value (USD Billion)
    Report Coverage Revenue Forecast, Competitive Landscape, Growth Factors, and Trends
    Segments Covered Plant Type, Ingredient Type, Application, Region
    Geographies Covered North America, Europe, Asia-Pacific, and Rest of the World (RoW)
    Countries Covered The US, Canada, German, France, UK, Italy, Spain, China, Japan, India, Australia, South Korea, and Brazil
    Key Companies Profiled Cargill, Incorporated, The Hain Celestial Group, Provital Group (Spain), Nan Liu Enterprise Co., Ltd (China), Jedwards International, Inc., Earth Supplied Products, LLC, Multiple Organics Inc., Ciranda, Inc., Croda International Plc (UK), BASF SE (Germany), Grain Millers, Inc., and Huntsman International LLC
    Key Market Opportunities Rising Consumer Demand for Natural Products, Innovation in Product Development, Collaborations and Partnerships
    Key Market Driver Increasing Consumer Awareness and Demand, Technological Advancements, Rising Disposable Income and Urbanization
     

    Market Highlights

    Author
    Pradeep Nandi
    Senior Research Analyst

    I have a bachelor's degree in mechanical engineering and an MBA. I have more than two years of expertise in the retail, food, and beverage, chemical, and material industries, and hence have developed a sound cross-domain expertise. A firm believer in lifelong learning and sharing of knowledge. Having a proclivity for hatching ideas and trying to absorb as much information as possible in a short amount of time. Introducing corporates to the data and insight, which enables them to move from probability to possibility, has been my key areas of interest. 

    Leave a Comment

    FAQs

    At what CAGR is the organic personal care ingredients market projected to grow during the forecast period?

    Organic personal care ingredients market is projected to grow at a 6.18% CAGR between 2024- 2032

    Which region is expected to dominate the organic personal care ingredients industry?

    Europe is expected to dominate the organic personal care ingredients market.

    What will be the value of the organic personal care ingredients market during the forecast period?

    Organic personal care ingredients market is predicted to touch USD 10.02 billion by 2032

    Name the key applications of organic personal care ingredients.

    Some key applications of organic personal care ingredients include fragrances, baby & child specific products, men’s grooming, toiletries, skin care, oral care, face care, hair care, and others.

    Name the notable players profiled in organic personal care ingredients market.

    Notable players profiled in the organic personal care ingredients market include Bedemco, Inc., Ciranda Inc., Virginia Dare, Multiple Organics, Inc., Earth Supplied Products, LLC, Nanliu Enterprise (Pinghu) Co., Ltd., Jedwards International, Inc., Hain Celestial Group Inc, Provital Group, WFM Private Label, L.P., among others.

    1. 'Table of
    2. Contents
    3. Executive Summary
    4. Scope of the Report
    5. Market Definition
    6. Scope of the Study
    7. Research Objectives
    8. Assumptions & Limitations
      1. Markets Structure
    9. Market Research Methodology
      1. Research Function
      2. Secondary Research
      3. Primary Research
      4. Forecast Model
    10. Market Landscape
      1. Supply Chain Analysis
        1. Raw Material Suppliers
        2. Manufacturers/Producers
        3. Distributors/Retailers/Wholesalers/E-Commerce
        4. End Users
      2. Porter’s Five
    11. Forces Analysis
    12. Threat of New Entrants
    13. Bargaining Power of Buyers
      1. Bargaining Power of Suppliers
        1. Threat of Substitutes
        2. Rivalry
    14. Market Dynamics of Global Organic Personal Care
    15. Ingredients Market
    16. Introduction
    17. Drivers
    18. Restraints
    19. Opportunities
    20. Challenges
    21. Global Organic Personal Care Ingredients Market, by Plant Type
      1. Introduction
      2. Aloe Vera
        1. Market Estimates &
    22. Forecast, 2024–2032
      1. Market Estimates & Forecast, by Region, 2024–2032
      2. Avocado
        1. Market Estimates
    23. & Forecast, 2024–2032
      1. Market Estimates & Forecast, by Region, 2024–2032
      2. Rose
        1. Market Estimates &
    24. Forecast, 2024–2032
      1. Market Estimates & Forecast, by Region, 2024–2032
      2. Lavender
        1. Market Estimates
    25. & Forecast, 2024–2032
      1. Market Estimates & Forecast, by Region, 2024–2032
      2. Jojoba
        1. Market Estimates
    26. & Forecast, 2024–2032
      1. Market Estimates & Forecast, by Region, 2024–2032
      2. Rosemary
        1. Market Estimates
    27. & Forecast, 2024–2032
      1. Market Estimates & Forecast, by Region, 2024–2032
      2. Neem
        1. Market Estimates &
    28. Forecast, 2024–2032
      1. Market Estimates & Forecast, by Region, 2024–2032
      2. Others
        1. Market Estimates
    29. & Forecast, 2024–2032
      1. Market Estimates & Forecast, by Region, 2024–2032
    30. Global Organic Personal
    31. Care Ingredients Market, by Ingredient Type
      1. Introduction
      2. Vegetables
        1. Market Estimates & Forecast, 2024–2032
        2. Market Estimates
    32. & Forecast, by Region, 2024–2032
      1. Herbs
        1. Market Estimates & Forecast, 2024–2032
        2. Market Estimates
    33. & Forecast, by Region, 2024–2032
      1. Natural Oils
        1. Market Estimates & Forecast, 2024–2032
        2. Market Estimates
    34. & Forecast, by Region, 2024–2032
      1. Algae
        1. Market Estimates & Forecast, 2024–2032
        2. Market Estimates
    35. & Forecast, by Region, 2024–2032
      1. Minerals & Vitamins
        1. Market Estimates & Forecast, 2024–2032
        2. Market Estimates
    36. & Forecast, by Region, 2024–2032
      1. Others
        1. Market Estimates & Forecast, 2024–2032
        2. Market Estimates
    37. & Forecast, by Region, 2024–2032
    38. Global Organic Personal Care Ingredients Market,
    39. by Application
    40. Introduction
    41. Cleansing
    42. Market Estimates & Forecast, 2024–2032
      1. Market Estimates & Forecast, by Region,
    43. Exfoliation
    44. Market Estimates & Forecast, 2024–2032
      1. Market Estimates & Forecast, by Region,
    45. Moisturization
    46. Market Estimates & Forecast, 2024–2032
      1. Market Estimates & Forecast, by Region,
    47. UV-Protection
    48. Market Estimates & Forecast, 2024–2032
      1. Market Estimates & Forecast, by Region,
    49. Anti-Aging
    50. Market Estimates & Forecast, 2024–2032
      1. Market Estimates & Forecast, by Region,
    51. Multi-Functional
    52. Market Estimates & Forecast, 2024–2032
      1. Market Estimates & Forecast, by Region,
    53. Others
    54. Market Estimates & Forecast, 2024–2032
      1. Market Estimates & Forecast, by Region,
    55. Global Organic Personal Care Ingredients Market, by Region
      1. Introduction
      2. North America
        1. Market Estimates & Forecast, 2024–2032
        2. Market Estimates
    56. & Forecast, by Plant Type, 2024–2032
      1. Market Estimates & Forecast, by Ingredient
    57. Type, 2024–2032
    58. Market Estimates & Forecast, by Application, 2024–2032
      1. US
        1. Market Estimates & Forecast, 2024–2032
    59. & Forecast, by Plant Type, 2024–2032
      1. Market Estimates & Forecast, by Ingredient
    60. Type, 2024–2032
    61. Market Estimates & Forecast, by Application, 2024–2032
      1. Canada
        1. Market Estimates &
    62. Forecast, 2024–2032
      1. Market Estimates & Forecast, by Plant Type, 2024–2032
        1. Market Estimates
    63. & Forecast, by Ingredient Type, 2024–2032
      1. Market Estimates & Forecast, by Application,
    64. Mexico
    65. Market Estimates & Forecast, 2024–2032
      1. Market Estimates & Forecast, by Plant
    66. Type, 2024–2032
    67. Market Estimates & Forecast, by Ingredient Type, 2024–2032
      1. Market Estimates &
    68. Forecast, by Application, 2024–2032
      1. Europe
        1. Market Estimates & Forecast, 2024–2032
        2. Market Estimates
    69. & Forecast, by Plant Type, 2024–2032
      1. Market Estimates & Forecast, by Ingredient
    70. Type, 2024–2032
    71. Market Estimates & Forecast, by Application, 2024–2032
      1. Germany
        1. Market Estimates &
    72. Forecast, 2024–2032
      1. Market Estimates & Forecast, by Plant Type, 2024–2032
        1. Market Estimates
    73. & Forecast, by Ingredient Type, 2024–2032
      1. Market Estimates & Forecast, by Application,
    74. France
    75. Market Estimates & Forecast, 2024–2032
      1. Market Estimates & Forecast, by Plant
    76. Type, 2024–2032
    77. Market Estimates & Forecast, by Ingredient Type, 2024–2032
      1. Market Estimates &
    78. Forecast, by Application, 2024–2032
      1. Italy
        1. Market Estimates & Forecast, 2024–2032
    79. & Forecast, by Plant Type, 2024–2032
      1. Market Estimates & Forecast, by Ingredient
    80. Type, 2024–2032
    81. Market Estimates & Forecast, by Application, 2024–2032
      1. Spain
        1. Market Estimates &
    82. Forecast, 2024–2032
      1. Market Estimates & Forecast, by Plant Type, 2024–2032
        1. Market Estimates
    83. & Forecast, by Ingredient Type, 2024–2032
      1. Market Estimates & Forecast, by Application,
    84. –2032 9.3.9 UK
      1. Market Estimates & Forecast, 2024–2032
        1. Market Estimates
    85. & Forecast, by Plant Type, 2024–2032
      1. Market Estimates & Forecast, by Ingredient
    86. Type, 2024–2032
    87. Market Estimates & Forecast, by Application, 2024–2032
      1. Rest of Europe
        1. Market Estimates
    88. & Forecast, 2024–2032
      1. Market Estimates & Forecast, by Plant Type, 2024–2032
        1. Market Estimates
    89. & Forecast, by Ingredient Type, 2024–2032
      1. Market Estimates & Forecast, by Application,
    90. Asia-Pacific
    91. Market Estimates & Forecast, 2024–2032
      1. Market Estimates & Forecast, by Plant Type,
    92. Market Estimates & Forecast, by Ingredient Type, 2024–2032
      1. Market Estimates &
    93. Forecast, by Application, 2024–2032
      1. China
        1. Market Estimates & Forecast, 2024–2032
    94. & Forecast, by Plant Type, 2024–2032
      1. Market Estimates & Forecast, by Ingredient
    95. Type, 2024–2032
    96. Market Estimates & Forecast, by Application, 2024–2032
      1. India
        1. Market Estimates &
    97. Forecast, 2024–2032
      1. Market Estimates & Forecast, by Plant Type, 2024–2032
        1. Market Estimates
    98. & Forecast, by Ingredient Type, 2024–2032
      1. Market Estimates & Forecast, by Application,
    99. Japan
    100. Market Estimates & Forecast, 2024–2032
      1. Market Estimates & Forecast, by Plant
    101. Type, 2024–2032
    102. Market Estimates & Forecast, by Ingredient Type, 2024–2032
      1. Market Estimates &
    103. Forecast, by Application, 2024–2032
      1. Australia & New Zealand
        1. Market Estimates &
    104. Forecast, 2024–2032
      1. Market Estimates & Forecast, by Plant Type, 2024–2032
        1. Market Estimates
    105. & Forecast, by Ingredient Type, 2024–2032
      1. Market Estimates & Forecast, by Application,
    106. Rest of Asia-Pacific
    107. Market Estimates & Forecast, 2024–2032
      1. Market Estimates & Forecast, by Plant
    108. Type, 2024–2032
    109. Market Estimates & Forecast, by Ingredient Type, 2024–2032
      1. Market Estimates &
    110. Forecast, by Application, 2024–2032
      1. Rest of the World (RoW)
        1. Market Estimates & Forecast, 2024–2032
        2. Market Estimates
    111. & Forecast, by Plant Type, 2024–2032
      1. Market Estimates & Forecast, by Ingredient
    112. Type, 2024–2032
    113. Market Estimates & Forecast, by Application, 2024–2032
      1. South America
        1. Market Estimates
    114. & Forecast, 2024–2032
      1. Market Estimates & Forecast, by Plant Type, 2024–2032
        1. Market Estimates
    115. & Forecast, by Ingredient Type, 2024–2032
      1. Market Estimates & Forecast, by Application,
    116. Middle East
    117. Market Estimates & Forecast, 2024–2032
      1. Market Estimates & Forecast, by Plant
    118. Type, 2024–2032
    119. Market Estimates & Forecast, by Ingredient Type, 2024–2032
      1. Market Estimates &
    120. Forecast, by Application, 2024–2032
      1. Africa
        1. Market Estimates & Forecast, 2024–2032
    121. & Forecast, by Plant Type, 2024–2032
      1. Market Estimates & Forecast, by Ingredient
    122. Type, 2024–2032
    123. Market Estimates & Forecast, by Application, 2024–2032
    124. Company Landscape
      1. Introduction
      2. Market Strategies
      3. Key Development
    125. Analysis
    126. (Expansions/Mergers
    127. and Acquisitions/Joint Ventures/New Product Developments/Agreements/Investments)
    128. Company Profiles
      1. Cargill, Incorporated
        1. Company Overview
        2. Financial Updates
        3. Product/Business
    129. Segment Overview
    130. Key Strategies
    131. Key Developments
    132. SWOT Analysis
    133. The Hain Celestial Group
      1. Company Overview
        1. Financial Updates
        2. Product/Business Segment Overview
        3. Key Strategies
        4. Key Developments
        5. SWOT Analysis
      2. Provital Group
        1. Company Overview
        2. Financial Updates
        3. Product/Business
    134. Segment Overview
    135. Key Strategies
    136. Key Developments
    137. SWOT Analysis
    138. Nan Liu Enterprise Co., Ltd
      1. Company Overview
        1. Financial Updates
        2. Product/Business Segment Overview
        3. Key Strategies
        4. Key Developments
        5. SWOT Analysis
      2. Jedwards International,
    139. Inc.
    140. Company Overview
    141. Financial Updates
    142. Product/Business Segment Overview
      1. Key Strategies
        1. Key Developments
        2. SWOT Analysis
      2. Copas Traditional Turkeys (UK)
        1. Company Overview
        2. Financial Updates
        3. Product/Business
    143. Segment Overview
    144. Key Strategies
    145. Key Developments
    146. SWOT Analysis
    147. Earth Supplied Products, LLC
      1. Company Overview
        1. Financial Updates
        2. Product/Business Segment Overview
        3. Key Strategies
        4. Key Developments
        5. SWOT Analysis
      2. Multiple Organics
    148. Inc.
    149. Company Overview
    150. Financial Updates
    151. Product/Business Segment Overview
      1. Key Strategies
        1. Key Developments
        2. SWOT Analysis
      2. Ciranda, Inc.
        1. Company Overview
        2. Financial Updates
        3. Product/Business Segment Overview
        4. Key Strategies
        5. Key Developments
        6. SWOT Analysis
      3. Croda International
    152. Plc
    153. Company Overview
    154. Financial Updates
    155. Product/Business Segment Overview
      1. Key Strategies
        1. Key Developments
        2. SWOT Analysis
      2. BASF SE
        1. Company Overview
        2. Financial Updates
        3. Product/Business Segment Overview
        4. Key Strategies
        5. Key Developments
        6. SWOT Analysis
      3. Grain Millers,
    156. Inc.
    157. Company Overview
    158. Financial Updates
    159. Product/Business Segment Overview
      1. Key Strategies
        1. Key Developments
        2. SWOT Analysis
      2. Huntsman International LLC
        1. Company Overview
        2. Financial Updates
        3. Product/Business
    160. Segment Overview
    161. Key Strategies
    162. Key Developments
    163. SWOT Analysis
    164. Conclusion
    165. LIST
    166. OF TABLES
    167. Global Organic Personal Care Ingredients Market, by Region, 2024–2032 (USD
    168. Million)
    169. Global Organic Personal Care Ingredients Market, by Plant Type, 2024–2032
    170. (USD Million)
    171. Global Organic Personal Care Ingredients Market, by Ingredient Type, 2024–2032
    172. (USD Million)
    173. Global Organic Personal Care Ingredients Market, by Application, 2024–2032
    174. (USD Million)
    175. North America: Organic Personal Care Ingredients Market, by Country, 2024–2032
    176. (USD Million)
    177. North America: Organic Personal Care Ingredients Market, by Plant Type, 2024–2032
    178. (USD Million)
    179. North America: Organic Personal Care Ingredients Market, by Ingredient Type, 2024–2032
    180. (USD Million)
    181. North America: Organic Personal Care Ingredients Market, by Application, 2024–2032
    182. (USD Million)
    183. US: Organic Personal Care Ingredients Market, by Plant Type, 2024–2032 (USD
    184. Million)
    185. US: Organic Personal Care Ingredients Market, by Ingredient Type, 2024–2032
    186. (USD Million)
    187. US: Organic Personal Care Ingredients Market, by Application, 2024–2032
    188. (USD Million)
    189. Canada: Organic Personal Care Ingredients Market, by Plant Type, 2024–2032
    190. (USD Million)
    191. Canada: Organic Personal Care Ingredients Market, by Ingredient Type, 2024–2032
    192. (USD Million)
    193. Canada: Organic Personal Care Ingredients Market, by Application, 2024–2032
    194. (USD Million)
    195. Mexico: Organic Personal Care Ingredients Market, by Plant Type, 2024–2032
    196. (USD Million)
    197. Mexico: Organic Personal Care Ingredients Market, by Ingredient Type, 2024–2032
    198. (USD Million)
    199. Mexico: Organic Personal Care Ingredients Market, by Application, 2024–2032
    200. (USD Million)
    201. Europe: Organic Personal Care Ingredients Market, by Country, 2024–2032
    202. (USD Million)
    203. Europe: Organic Personal Care Ingredients Market, by Plant Type, 2024–2032
    204. (USD Million)
    205. Europe: Organic Personal Care Ingredients Market, by Ingredient Type, 2024–2032
    206. (USD Million)
    207. Europe: Organic Personal Care Ingredients Market, by Application, 2024–2032
    208. (USD Million)
    209. Germany: Organic Personal Care Ingredients Market, by Plant Type, 2024–2032
    210. (USD Million)
    211. Germany: Organic Personal Care Ingredients Market, by Ingredient Type, 2024–2032
    212. (USD Million)
    213. Germany: Organic Personal Care Ingredients Market, by Application, 2024–2032
    214. (USD Million)
    215. France: Organic Personal Care Ingredients Market, by Plant Type, 2024–2032
    216. (USD Million)
    217. France: Organic Personal Care Ingredients Market, by Ingredient Type, 2024–2032
    218. (USD Million)
    219. France: Organic Personal Care Ingredients Market, by Application, 2024–2032
    220. (USD Million)
    221. Italy: Organic Personal Care Ingredients Market, by Plant Type, 2024–2032
    222. (USD Million)
    223. Italy: Organic Personal Care Ingredients Market, by Ingredient Type, 2024–2032
    224. (USD Million)
    225. Italy: Organic Personal Care Ingredients Market, by Application, 2024–2032
    226. (USD Million)
    227. Spain: Organic Personal Care Ingredients Market, by Plant Type, 2024–2032
    228. (USD Million)
    229. Spain: Organic Personal Care Ingredients Market, by Ingredient Type, 2024–2032
    230. (USD Million)
    231. Spain: Organic Personal Care Ingredients Market, by Application, 2024–2032
    232. (USD Million)
    233. UK: Organic Personal Care Ingredients Market, by Plant Type, 2024–2032
    234. (USD Million)
    235. UK: Organic Personal Care Ingredients Market, by Ingredient Type, 2024–2032
    236. (USD Million)
    237. UK: Organic Personal Care Ingredients Market, by Application, 2024–2032
    238. (USD Million)
    239. Rest of Europe: Organic Personal Care Ingredients Market, by Plant Type, 2024–2032
    240. (USD Million)
    241. Rest of Europe: Organic Personal Care Ingredients Market, by Ingredient Type,
    242. –2032 (USD Million)
    243. by Application, 2024–2032 (USD Million)
    244. Market, by Country, 2024–2032 (USD Million)
    245. Market, by Plant Type, 2024–2032 (USD Million)
    246. Market, by Ingredient Type, 2024–2032 (USD Million)
    247. Market, by Application, 2024–2032 (USD Million)
    248. Market, by Plant Type, 2024–2032 (USD Million)
    249. Market, by Ingredient Type, 2024–2032 (USD Million)
    250. Market, by Application, 2024–2032 (USD Million)
    251. Market, by Plant Type, 2024–2032 (USD Million)
    252. Market, by Ingredient Type, 2024–2032 (USD Million)
    253. Market, by Application, 2024–2032 (USD Million)
    254. Market, by Plant Type, 2024–2032 (USD Million)
    255. Market, by Ingredient Type, 2024–2032 (USD Million)
    256. Market, by Application, 2024–2032 (USD Million)
    257. Ingredients Market, by Plant Type, 2024–2032 (USD Million)
    258. Organic Personal Care Ingredients Market, by Ingredient Type, 2024–2032 (USD
    259. Million)
    260. Rest of Asia-Pacific: Organic Personal Care Ingredients Market, by Application,
    261. –2032 (USD Million)
    262. Market, by Country, 2024–2032 (USD Million)
    263. Care Ingredients Market, by Plant Type, 2024–2032 (USD Million)
    264. World (RoW): Organic Personal Care Ingredients Market, by Ingredient Type, 2024–2032
    265. (USD Million)
    266. Rest of the World (RoW): Organic Personal Care Ingredients Market, by Application,
    267. –2032 (USD Million)
    268. Plant Type, 2024–2032 (USD Million)
    269. Market, by Ingredient Type, 2024–2032 (USD Million)
    270. Market, by Application, 2024–2032 (USD Million)
    271. Market, by Plant Type, 2024–2032 (USD Million)
    272. Market, by Ingredient Type, 2024–2032 (USD Million)
    273. Market, by Application, 2024–2032 (USD Million)
    274. Market, by Plant Type, 2024–2032 (USD Million)
    275. Market, by Ingredient Type, 2024–2032 (USD Million)
    276. Market, by Application, 2024–2032 (USD Million)
    277. Market Segmentation
    278. Forecast Research Methodology
    279. Market
    280. Value Chain of the Global Organic Personal Care Ingredients Market
    281. Organic Personal Care Ingredients Market in 2024, by Country (%)
    282. Care Ingredients Market, 2024–2032
    283. Size by Plant Type, 2024
    284. by Plant Type, 2024–2032
    285. Type, 2024
    286. Share of the Global Organic Personal Care Ingredients Market, by Ingredient Type,
    287. Global Organic Personal Care Ingredients Market Size, by Application, 2024
    288. Global Organic Personal Care Ingredients Market, by Application, 2024–2032'

    Organic Beauty and Personal Care Ingredients Market Segmentation

    Market Segmentation Overview

    • Detailed segmentation data will be available in the full report
    • Comprehensive analysis by multiple parameters
    • Regional and country-level breakdowns
    • Market size forecasts by segment
    Organic Beauty and Personal Care Ingredients Market Research Report - Global Forecast till 2032 Infographic
    Free Sample Request

    Kindly complete the form below to receive a free sample of this Report

    Customer Strories

    “I am very pleased with how market segments have been defined in a relevant way for my purposes (such as "Portable Freezers & refrigerators" and "last-mile"). In general the report is well structured. Thanks very much for your efforts.”

    Victoria Milne Founder
    Case Study

    Chemicals and Materials