• Cat-intel
  • MedIntelliX
  • Resources
  • About Us
  • Hero Background
    English
    Chinese
    French
    Japanese
    Korean
    German
    Spanish

    Optical Coatings Market Size

    ID: MRFR/CnM/4588-CR
    100 Pages
    Anshula Mandaokar
    July 2018

    Optical  Coating  Market  Research  Report:  By  Type,  By  Sputter  Deposition,  By Coating  Material,  By  End-use  Industry:  Forecast  to  2030

    Share:
    Download PDF ×

    We do not share your information with anyone. However, we may send you emails based on your report interest from time to time. You may contact us at any time to opt-out.

    Optical Coatings Market Infographic
    $ 4,950.0
    $ 5,950.0
    $ 7,250.0

    Optical Coatings Size

    Optical Coatings Market Growth Projections and Opportunities

    Various market factors significantly influence the growth trajectory of the Optical Coating Market. One of the major drivers is the growing demand for optical coatings in numerous sectors, such as electronics, healthcare, and telecommunications. The optical coatings market is estimated to Register a CAGR of 8.5%, amounting to USD 19.0 billion during 2021-2030; this will result from global market trends. Furthermore, increased consumer electronic devices such as smartphones, tablets, and cameras have fueled demand for optical coatings that protect fragile optical surfaces and enhance image quality. With their proliferation into everyday life, these gadgets drive up demand for coatings offering scratch resistance, water repellency, and anti-fingerprint properties. Additionally, consumers' desire for high-end screen displays and camera lenses also propels the market. Environmental concerns and the adoption of sustainable practices are becoming vital in determining the direction of the optical coating market. To comply with environmental regulations and decrease carbon footprint, manufacturers are increasingly concentrating on developing environmentally friendly coating technologies. Moreover, there are several other economic factors, including global economic trends and geopolitical considerations, that play a very important role when it comes to shaping the optical coating sector. Changes in currency exchange rates, trade wars, or recessions can influence raw material costs as well as manufacturing processes, leading to higher costs of producing/coating products used in optics, hence affecting their pricing & profitability directly again because they're sold worldwide under different currencies with varying inflation rates per country. The research & development space constitutes another significant determinant of the industry's characteristics on the market side. Ongoing innovations in materials used for coating work together with new technologies, thereby transforming this sector completely over time. Expenditures on R&D by major players towards partnering with institutions conducting studies based around cutting-edge coatings that exhibit best-in-class features. Competitor dynamics and mergers and acquisitions also shape the optical coating industry. Key players' presence, M&A process, or strategic alliances drive market competition and overall market share of individual firms. Regulations are another element that influences the optical coating sector. Some materials used in the production processes of optics have strict regulations, particularly when they have environmental implications, which might affect companies' production activities & their product lines as well since there is compliance with such rules must be met by manufacturers to facilitate access to markets where consumers reside while ensuring positive public opinion about them.
    Optical Coatings Market Size Graph

    Market Summary

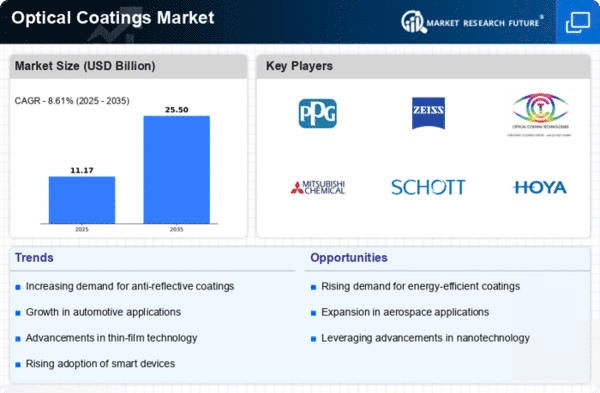
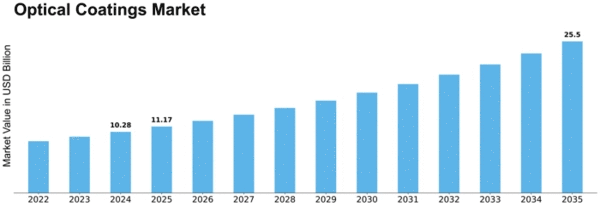
    The Global Optical Coatings Market is projected to grow from 14.1 USD Billion in 2024 to 28.6 USD Billion by 2035, reflecting a robust growth trajectory.

    Key Market Trends & Highlights

    Optical Coatings Key Trends and Highlights

    • The market is expected to achieve a compound annual growth rate (CAGR) of 6.63% from 2025 to 2035.
    • By 2035, the market valuation is anticipated to reach 28.6 USD Billion, indicating substantial expansion.
    • In 2024, the market is valued at 14.1 USD Billion, laying a solid foundation for future growth.
    • Growing adoption of advanced optical technologies due to increasing demand for high-performance coatings is a major market driver.

    Market Size & Forecast

    2024 Market Size 14.1 (USD Billion)
    2035 Market Size 28.6 (USD Billion)
    CAGR (2025-2035) 6.63%
    Largest Regional Market Share in 2024 latin_america)

    Major Players

    Newport Corporation, PPG Industries Ohio, Inc., Abrisa Technologies, Artemis Optical Limited, Inrad Optics, Inc., Nippon Sheet Glass Co., Ltd., ZEISS International

    Market Trends

    The Global Optical Coatings Market is poised for growth, driven by advancements in technology and increasing demand across various sectors, including telecommunications and consumer electronics.

    U.S. Department of Commerce

    Optical Coatings Market Market Drivers

    Market Growth Projections

    The Global Optical Coatings Market Industry is poised for substantial growth, with projections indicating a market value of 14.1 USD Billion in 2024 and an anticipated increase to 28.6 USD Billion by 2035. This growth trajectory suggests a compound annual growth rate of 6.63% from 2025 to 2035, reflecting the industry's resilience and adaptability. Factors such as technological advancements, increasing demand across various sectors, and a focus on sustainability are likely to contribute to this positive outlook. The market's expansion is indicative of the ongoing evolution of optical coatings and their critical role in modern applications.

    Expansion of Consumer Electronics

    The expansion of the consumer electronics sector is a pivotal driver for the Global Optical Coatings Market Industry. With the proliferation of devices such as smartphones, tablets, and smart TVs, the demand for high-quality optical coatings is on the rise. These coatings are essential for enhancing display clarity and durability, thereby improving user experience. As manufacturers strive to differentiate their products in a competitive market, the integration of advanced optical coatings becomes increasingly important. This trend is expected to bolster market growth, as consumer electronics continue to evolve and expand, further solidifying the industry's relevance.

    Rising Adoption in Renewable Energy

    The Global Optical Coatings Market Industry is experiencing increased adoption of optical coatings in renewable energy applications, particularly in solar energy systems. Coatings that enhance light absorption and minimize reflection are critical for improving the efficiency of solar panels. This trend aligns with global efforts to transition towards sustainable energy sources. As governments and organizations worldwide invest in renewable technologies, the demand for high-performance optical coatings is expected to rise. This shift could significantly impact the market, contributing to a projected compound annual growth rate of 6.63% from 2025 to 2035, indicating a robust growth trajectory.

    Growing Demand for Advanced Coatings

    The Global Optical Coatings Market Industry is witnessing a surge in demand for advanced coatings due to their applications in various sectors such as electronics, automotive, and healthcare. These coatings enhance the performance of optical devices by improving light transmission and reducing glare. For instance, anti-reflective coatings are increasingly utilized in eyeglasses and camera lenses, which is indicative of a broader trend towards high-performance optical solutions. This growing demand is projected to contribute to the market's expansion, with an estimated value of 14.1 USD Billion in 2024, reflecting the industry's potential for innovation and growth.

    Increased Focus on Healthcare Applications

    The Global Optical Coatings Market Industry is benefiting from an increased focus on healthcare applications, particularly in medical imaging and diagnostic equipment. Optical coatings play a crucial role in enhancing the performance of devices such as endoscopes and imaging systems by improving light transmission and reducing reflections. As the healthcare sector continues to advance technologically, the demand for high-quality optical coatings is likely to rise. This trend underscores the importance of optical coatings in ensuring accurate diagnostics and effective treatments, thereby driving growth in the market.

    Technological Advancements in Coating Processes

    Technological advancements in coating processes are significantly influencing the Global Optical Coatings Market Industry. Innovations such as atomic layer deposition and magnetron sputtering are enhancing the efficiency and quality of optical coatings. These technologies allow for precise control over the coating thickness and composition, leading to superior optical properties. As a result, manufacturers can produce coatings that meet stringent performance standards across various applications. The ongoing investment in research and development is likely to propel the market forward, with projections indicating a market value of 28.6 USD Billion by 2035, showcasing the industry's commitment to technological excellence.

    Market Segment Insights

    Regional Insights

    Key Companies in the Optical Coatings Market market include

    Industry Developments

    • Q2 2024: Materion Corporation Announces Opening of New Optical Coating Facility in Taiwan Materion Corporation, a global leader in advanced materials, announced the opening of a new optical coating facility in Taiwan to expand its manufacturing capacity and better serve the Asia-Pacific market.
    • Q1 2024: Viavi Solutions Launches New High-Performance Optical Coating for 5G Applications Viavi Solutions introduced a new high-performance optical coating designed specifically for 5G infrastructure, aiming to enhance signal transmission and durability in next-generation networks.
    • Q2 2024: Edmund Optics Expands Manufacturing Capabilities with New Coating Chambers Edmund Optics announced the installation of advanced coating chambers at its U.S. facility, increasing production capacity for precision optical coatings used in medical and industrial applications.
    • Q1 2024: Praxair Surface Technologies and Bühler Partner to Develop Advanced Optical Coating Solutions Praxair Surface Technologies entered a strategic partnership with Bühler to co-develop advanced optical coating solutions for semiconductor and display technologies.
    • Q2 2024: ZEISS Launches New Anti-Reflective Coating for Eyewear Market ZEISS introduced a new anti-reflective optical coating for eyewear, targeting improved clarity and durability for consumer and professional users.
    • Q1 2024: Inrad Optics Secures Multi-Year Contract for Defense Optical Coatings Inrad Optics announced it has secured a multi-year contract to supply specialized optical coatings for defense applications, supporting advanced imaging and targeting systems.
    • Q2 2024: II-VI Incorporated Completes Acquisition of Coherent’s Optical Coating Division II-VI Incorporated completed the acquisition of Coherent’s optical coating division, expanding its portfolio in precision coatings for lasers and photonics.
    • Q1 2024: Jenoptik Appoints New CEO to Drive Growth in Optical Coating Segment Jenoptik announced the appointment of a new CEO, with a strategic focus on expanding the company’s optical coating business in global markets.
    • Q2 2024: HORIBA Launches Next-Generation Optical Coating for Spectroscopy Instruments HORIBA unveiled a next-generation optical coating technology for its spectroscopy instruments, offering improved sensitivity and wavelength selectivity.
    • Q1 2024: Optical Coatings Japan Announces $10M Series B Funding to Expand Production Optical Coatings Japan raised $10 million in Series B funding to expand its production capacity and accelerate development of advanced thin-film coatings.
    • Q2 2024: Thorlabs Opens New European Optical Coating Center Thorlabs announced the opening of a new optical coating center in Europe, aimed at increasing supply chain resilience and supporting regional customers.
    • Q1 2024: OptoSigma Partners with Laser Components to Develop Custom Coating Solutions OptoSigma entered a partnership with Laser Components to jointly develop custom optical coating solutions for laser and photonics applications.

    Future Outlook

    Optical Coatings Market Future Outlook

    The Global Optical Coatings Market is projected to grow at a 6.63% CAGR from 2024 to 2035, driven by advancements in technology, increasing demand in electronics, and expanding applications in healthcare.

    New opportunities lie in:

    • Develop eco-friendly optical coatings to meet sustainability demands.
    • Invest in R&D for anti-reflective coatings in solar energy applications.
    • Expand into emerging markets with tailored optical solutions for local industries.

    By 2035, the market is expected to exhibit robust growth, reflecting evolving technological advancements and diverse application areas.

    Market Segmentation

    Report Scope

    Report Attribute/Metric Details
      Market Size  2030: USD 19 billion
      CAGR  8.5% CAGR
      Base Year   2021
      Forecast Period   2022 to 2030
      Historical Data   2019 & 2020
      Forecast Units   Value (USD Million)
      Report Coverage   Revenue Forecast, Competitive Landscape, Growth Factors, and Trends
      Segments Covered   Type, Sputter Deposition, Coating Material and End-use Industry
      Geographies Covered   North America, Europe, Asia-Pacific, and Rest of the World (RoW)
      Key Vendors   Thorlabs Inc., Angstrom Engineering Inc., Edmund Optics Inc., Abrisa Technologies, Inrad Optics, Carl Zeiss Jena GmbH, Optiforms Inc., MKS Instruments, Reynard Corporation, Optical Coatings Japan, AMETEK, PPG Industries, II-VI Incorporation, DowDuPont Inc., Optics Balzers AG, Berliner Glas
      Key Market Opportunities   Rigorous environmental rules regarding optical coatings production resources
      Key Market Drivers The surge in requirements from the renewable energy sector due to increased investment in the industry The prompt infiltration of optical coatings in the automobile industry for shielding applications

    Market Highlights

    Author

    Anshula Mandaokar
    Team Lead - Research

    She holds an experience of about 6+ years in market research and business consulting, working under the spectrum of information communication technology, telecommunications and semiconductor domains. aarti conceptualizes and implements a scalable business strategy and provides strategic leadership to the clients. her expertise lies in market estimation, competitive intelligence, pipeline analysis, customer assessment, etc.

    Leave a Comment

    Latest Comments

    John Doe
    john@example.com

    This is a great article! Really helped me understand the topic better.

    Posted on July 23, 2025, 10:15 AM
    Jane Smith
    jane@domain.com

    Thanks for sharing this. I’ve bookmarked it for later reference.

    Posted on July 22, 2025, 7:45 PM

    FAQs

    What is the valuation of the global optical coatings market?

    The global optical coatings market size can surpass USD 19 billion by 2035.

    What was the previous valuation of the global optical coatings market?

    The global optical coatings market stood at USD 12.6 billion million in 2019.

    What is the expected growth rate of the global optical coatings market?

    The global optical coatings market can accumulate revenues at over 8.5% CAGR

    Which region can showcase the highest growth in the global optical coatings market?

    The APAC region can showcase the highest growth rate till 2023 in the global optical coatings market.

    Who are the key players of the global optical coatings market?

    Carl Zeiss Jena GmbH, MKS Instruments, Optiforms Inc, DowDuPont Inc, Optics Balzers AG, Abrisa Technologies, Optical Coatings Japan, Berliner Glas, AMETEK, Inrad Optics, Reynard Corporation, Thorlabs inc, Angstrom Engineering Inc, Edmund Optics Inc, II-VI Incorporation, and PPG industries are the key players of the global optical coatings market.

    1. Executive Summary
    2. Market Introduction
      1. Definition 20
      2. Scope of the Study 20
      3. List of Assumptions 21
      4. Market Structure 21
    3. Market Insights
    4. Research Methodology
      1. Research Process 27
      2. Primary Research 28
      3. Secondary Research 29
      4. Market Size Estimation 29
      5. Forecast Model 30
    5. Market Dynamics
      1. Drivers 32
        1. Introduction 32
      2. Drivers 33
        1. Increasing demand for optical coating from the growing consumer electronics industry 33
        2. Advanced technology in optical coating fabrication process 34
        3. Rapid penetration of optical coating in the automobile industry 35
      3. Restraints 35
        1. Stringent environmental regulations against the use of Cr6 36
      4. Opportunities 36
        1. Surging demand for vacuum deposition technology in medical devices & equipment 36
        2. Growing demand from the renewable energy sector, especially from solar energy 37
      5. Supply Chain Analysis 37
        1. Raw Material Suppliers 38
        2. Optical Coating Producers 38
        3. Distribution Channel 38
        4. End-use Industries 38
      6. Porter’s Five Forces 39
        1. Threat of new entrants 39
        2. The intensity of competitive rivalry 39
        3. Bargaining power of supplier 39
        4. Bargaining power of buyer 39
        5. Threat of Substitute 40
    6. Global Optical Coating Market, By Type
      1. Introduction 42
      2. Anti-Reflective Coatings 44
      3. Beam-Splitter Coatings 44
      4. Electrochromic Coatings 45
      5. Filter Coatings 45
        1. Short-Pass & Long-Pass 46
        2. BandPass 46
        3. Notch Filters 47
        4. Other Filters 47
      6. High Reflective Coatings 48
      7. Transparent Conductive Coatings 48
      8. Partial Reflective Coatings 49
      9. Others 49
    7. Global Optical Coating Market, By Coating Method
      1. Introduction 51
      2. Vacuum Deposition/ Evaporative Deposition 52
        1. Thermal Evaporation 53
        2. Electron Beam Deposition/ Electron Beam Evaporation 53
      3. Sputter Deposition 54
        1. Ion Beam Sputtering (IBS) 54
        2. Ion Assisted Deposition (IAS) 55
        3. Reactive Sputtering 55
        4. Magnetron Sputtering 56
        5. Plasma Sputtering 56
        6. Gas Flow Sputtering 57
      4. Others 57
    8. Global Optical Coating Market, By Coating Material
      1. Introduction 59
      2. Metallic Materials 60
      3. Dielectric Materials 60
    9. Global Optical Coating Market, By End-use Industry
      1. Introduction 62
      2. Electronics & Telecommunication 63
      3. Automotive 63
      4. Healthcare 64
      5. Aerospace & Defense 64
      6. Solar 65
      7. Others 65
    10. Global Optical Coating Market, By Region
      1. North America 70
        1. U.S. 73
        2. Canada 75
      2. Europe 78
        1. Germany 81
        2. France 83
        3. UK 85
        4. Spain 87
        5. Italy 89
        6. Russia 91
        7. Rest of Europe 93
      3. Asia-Pacific 96
        1. China 99
        2. Japan 101
        3. South Korea 103
        4. Taiwan 105
        5. India 107
        6. Rest of Asia-Pacific 109
      4. Middle East & Africa 112
        1. GCC 115
        2. South Africa 117
        3. Rest of Middle East & Africa 119
      5. Latin America 122
        1. Mexico 125
        2. Brazil 127
        3. Rest of Latin America 129
    11. Competitive Landscape
      1. Introduction 133
      2. Market Strategy Analysis 133
      3. Key Developments of Major Market Players 134
    12. Company Profiles
      1. Edmund Optics Inc 136
        1. Company Overview 136
        2. Financial Overview 136
        3. Products/Service Offerings 136
        4. Key Developments 136
        5. SWOT Analysis 137
        6. Key Strategy 137
      2. Thorlabs inc 138
        1. Company Overview 138
        2. Financial Overview 138
        3. Products/Service Offerings 138
        4. Key Developments 138
        5. SWOT Analysis 138
        6. Key Strategy 138
      3. Angstrom Engineering Inc 139
        1. Company Overview 139
        2. Financial Overview 139
        3. Products/Service Offerings 139
        4. Key Developments 139
        5. SWOT Analysis 139
        6. Key Strategy 139
      4. Optiforms Inc 140
        1. Company Overview 140
        2. Financial Overview 140
        3. Products/ Service Offerings 140
        4. Key Developments 141
        5. SWOT Analysis 141
        6. Key Strategy 141
      5. AbrisaTechnologies 142
        1. Company Overview 142
        2. Financial Overview 142
        3. Products/ Service Offerings 142
        4. Key Developments 143
        5. SWOT Analysis 143
        6. Key Strategy 143
      6. Carl Zeiss Jena GmbH 144
        1. Company Overview 144
        2. Financial Overview 144
        3. Products/ Service Offerings 144
        4. Key Developments 144
        5. SWOT Analysis 144
        6. Key Strategy 145
      7. Inrad Optics 146
        1. Company Overview 146
        2. Financial Overview 146
        3. Products/ Service Offerings 147
        4. Key Developments 147
        5. SWOT Analysis 147
        6. Key Strategy 147
      8. MKS Instruments 148
        1. Company Overview 148
        2. Financial Overview 148
        3. Products/ Service Offerings 149
        4. Key Developments 149
        5. SWOT Analysis 149
        6. Key Strategy 149
      9. Reynard Corporation 150
        1. Company Overview 150
        2. Financial Overview 150
        3. Products/ Service Offerings 150
        4. Key Developments 150
        5. SWOT Analysis 151
        6. Key Strategy 151
      10. PPG Industries, Inc 152
        1. Company Overview 152
        2. Products/ Service Offerings 153
        3. Key Developments 153
        4. SWOT Analysis 153
        5. Key Strategy 153
      11. Optics Balzers AG 154
        1. Company Overview 154
        2. Financial Overview 154
        3. Products/ Service Offerings 154
        4. SWOT Analysis 155
        5. Key Developments 155
        6. Key Strategy 155
      12. AMETEK 156
        1. Company Overview 156
        2. Financial Overview 156
        3. Products/ Service Offerings 157
        4. SWOT Analysis 157
        5. Key Developments 157
        6. Key Strategy 157
      13. II-VI Incorporation 158
        1. Company Overview 158
        2. Financial Overview 158
        3. Products/ Service Offerings 159
        4. Key Developments 159
        5. SWOT Analysis 159
        6. Key Strategy 159
      14. DowDuPont Inc 160
        1. Company Overview 160
        2. Financial Overview 160
        3. Products/ Service Offerings 161
        4. Key Developments 161
        5. SWOT Analysis 161
        6. Key Strategy 161
      15. Berliner Glas 162
        1. Company Overview 162
        2. Financial Overview 162
        3. Products/ Service Offerings 162
        4. Key Developments 162
        5. SWOT Analysis 163
        6. Key Strategy 163
      16. Optical Coatings Japan 164
        1. Company Overview 164
        2. Financial Overview 164
        3. Products/ Service Offerings 164
        4. Key Developments 164
        5. SWOT Analysis 165
        6. Key Strategy 165
    13. Conclusion
    14. List of Tables and Figures
      1. 14 List of Tables
      2. TABLE 1 MARKET SYNOPSIS 18
      3. TABLE 2 LIST OF ASSUMPTIONS 21
      4. TABLE 3 GLOBAL OPTICAL COATING MARKET, BY TYPE, 2020-2027 (USD MILLION) 43
      5. TABLE 4 GLOBAL OPTICAL COATING MARKET FOR ANTI-REFLECTIVE COATINGS, 2020-2027 (USD MILLION) 44
      6. TABLE 5 GLOBAL OPTICAL COATING MARKET FOR BEAM-SPLITTER COATINGS, 2020-2027 (USD MILLION) 44
      7. TABLE 6 GLOBAL OPTICAL COATING MARKET FOR ELECTROCHROMIC COATINGS, 2020-2027 (USD MILLION) 45
      8. TABLE 7 GLOBAL OPTICAL COATING MARKET FOR FILTER COATINGS, 2020-2027 (USD MILLION) 45
      9. TABLE 8 GLOBAL OPTICAL COATING MARKET FOR SHORT-PASS & LONG-PASS, 2020-2027 (USD MILLION) 46
      10. TABLE 9 GLOBAL OPTICAL COATING MARKET FOR BANDPASS, 2020-2027 (USD MILLION) 46
      11. TABLE 10 GLOBAL OPTICAL COATING MARKET FOR NOTCH FILTERS, 2020-2027 (USD MILLION) 47
      12. TABLE 11 GLOBAL OPTICAL COATING MARKET FOR OTHER FILTERS, 2020-2027 (USD MILLION) 47
      13. TABLE 12 GLOBAL OPTICAL COATING MARKET FOR HIGH REFLECTIVE COATINGS, 2020-2027 (USD MILLION) 48
      14. TABLE 13 GLOBAL OPTICAL COATING MARKET FOR TRANSPARENT CONDUCTIVE COATINGS, 2020-2027 (USD MILLION) 48
      15. TABLE 14 GLOBAL OPTICAL COATING MARKET FOR PARTIAL REFLECTIVE COATINGS, 2020-2027 (USD MILLION) 49
      16. TABLE 15 GLOBAL OPTICAL COATING MARKET FOR OTHERS, 2020-2027 (USD MILLION) 49
      17. TABLE 16 GLOBAL OPTICAL COATING MARKET, BY COATING METHOD, 2020-2027 (USD MILLION) 52
      18. TABLE 17 GLOBAL OPTICAL COATING MARKET FOR VACUUM DEPOSITION/ EVAPORATIVE DEPOSITION, 2020-2027 (USD MILLION) 52
      19. TABLE 18 GLOBAL OPTICAL COATING MARKET FOR THERMAL EVAPORATION, 2020-2027 (USD MILLION) 53
      20. TABLE 19 GLOBAL OPTICAL COATING MARKET FOR ELECTRON BEAM DEPOSITION/ ELECTRON BEAM EVAPORATION, 2020-2027 (USD MILLION) 53
      21. TABLE 20 GLOBAL OPTICAL COATING MARKET FOR SPUTTER DEPOSITION, 2020-2027 (USD MILLION) 54
      22. TABLE 21 GLOBAL OPTICAL COATING MARKET FOR ION BEAM SPUTTERING (IBS), 2020-2027 (USD MILLION) 54
      23. TABLE 22 GLOBAL OPTICAL COATING MARKET FOR ION ASSISTED DEPOSITION (IAS), 2020-2027 (USD MILLION) 55
      24. TABLE 23 GLOBAL OPTICAL COATING MARKET FOR REACTIVE SPUTTERING, 2020-2027 (USD MILLION) 55
      25. TABLE 24 GLOBAL OPTICAL COATING MARKET FOR MAGNETRON SPUTTERING, 2020-2027 (USD MILLION) 56
      26. TABLE 25 GLOBAL OPTICAL COATING MARKET FOR PLASMA SPUTTERING, 2020-2027 (USD MILLION) 56
      27. TABLE 26 GLOBAL OPTICAL COATING MARKET FOR GAS FLOW SPUTTERING, 2020-2027 (USD MILLION) 57
      28. TABLE 27 GLOBAL OPTICAL COATING MARKET FOR OTHERS, 2020-2027 (USD MILLION) 57
      29. TABLE 28 GLOBAL OPTICAL COATING MARKET, BY COATING MATERIAL, 2020-2027 (USD MILLION) 59
      30. TABLE 29 GLOBAL OPTICAL COATING MARKET FOR METALLIC MATERIALS, 2020-2027 (USD MILLION) 60
      31. TABLE 30 GLOBAL OPTICAL COATING MARKET FOR DIELECTRIC MATERIALS, 2020-2027 (USD MILLION) 60
      32. TABLE 31 GLOBAL OPTICAL COATING MARKET, BY END-USE INDUSTRY, 2020-2027 (USD MILLION) 62
      33. TABLE 32 GLOBAL OPTICAL COATING MARKET FOR ELECTRONICS & TELECOMMUNICATION, 2020-2027 (USD MILLION) 63
      34. TABLE 33 GLOBAL OPTICAL COATING MARKET FOR AUTOMOTIVE, 2020-2027 (USD MILLION) 63
      35. TABLE 34 GLOBAL OPTICAL COATING MARKET FOR HEALTHCARE, 2020-2027 (USD MILLION) 64
      36. TABLE 35 GLOBAL OPTICAL COATING MARKET FOR AEROSPACE & DEFENSE, 2020-2027 (USD MILLION) 64
      37. TABLE 36 GLOBAL OPTICAL COATING MARKET FOR SOLAR, 2020-2027 (USD MILLION) 65
      38. TABLE 37 GLOBAL OPTICAL COATING MARKET FOR OTHERS, 2020-2027 (USD MILLION) 65
      39. TABLE 38 GLOBAL OPTICAL COATING MARKET, BY REGION, 2020-2027 (USD MILLION) 67
      40. TABLE 39 GLOBAL OPTICAL COATING MARKET, BY TYPE, 2020-2027 (USD MILLION) 68
      41. TABLE 40 GLOBAL OPTICAL COATING MARKET, BY COATING METHOD, 2020-2027 (USD MILLION) 69
      42. TABLE 41 GLOBAL OPTICAL COATING MARKET, BY COATING MATERIAL, 2020-2027 (USD MILLION) 69
      43. TABLE 42 GLOBAL OPTICAL COATING MARKET, BY END-USE INDUSTRY, 2020-2027 (USD MILLION) 70
      44. TABLE 43 NORTH AMERICA OPTICAL COATING MARKET, BY COUNTRY, 2020-2027 (USD MILLION) 71
      45. TABLE 44 NORTH AMERICA OPTICAL COATING MARKET, BY TYPE, 2020-2027 (USD MILLION) 71
      46. TABLE 45 NORTH AMERICA OPTICAL COATING MARKET, BY COATING METHOD, 2020-2027 (USD MILLION) 72
      47. TABLE 46 NORTH AMERICA OPTICAL COATING MARKET, BY COATING MATERIAL, 2020-2027 (USD MILLION) 72
      48. TABLE 47 NORTH AMERICA OPTICAL COATING MARKET, BY END-USE INDUSTRY, 2020-2027 (USD MILLION) 73
      49. TABLE 48 U.S. OPTICAL COATING MARKET, BY TYPE, 2020-2027 (USD MILLION) 73
      50. TABLE 49 U.S. OPTICAL COATING MARKET, BY COATING METHOD, 2020-2027 (USD MILLION) 74
      51. TABLE 50 U.S. OPTICAL COATING MARKET, BY COATING MATERIAL, 2020-2027 (USD MILLION) 74
      52. TABLE 51 U.S. OPTICAL COATING MARKET, BY END-USE INDUSTRY, 2020-2027 (USD MILLION) 75
      53. TABLE 52 CANADA OPTICAL COATING MARKET, BY TYPE, 2020-2027 (USD MILLION) 75
      54. TABLE 53 CANADA OPTICAL COATING MARKET, BY COATING METHOD, 2020-2027 (USD MILLION) 76
      55. TABLE 54 CANADA OPTICAL COATING MARKET, BY COATING MATERIAL, 2020-2027 (USD MILLION) 76
      56. TABLE 55 CANADA OPTICAL COATING MARKET, BY END-USE INDUSTRY, 2020-2027 (USD MILLION) 77
      57. TABLE 56 EUROPE OPTICAL COATING MARKET, BY COUNTRY, 2020-2027 (USD MILLION) 78
      58. TABLE 57 EUROPE OPTICAL COATING MARKET, BY TYPE, 2020-2027 (USD MILLION) 79
      59. TABLE 58 EUROPE OPTICAL COATING MARKET, BY COATING METHOD, 2020-2027 (USD MILLION) 80
      60. TABLE 59 EUROPE OPTICAL COATING MARKET, BY COATING MATERIAL, 2020-2027 (USD MILLION) 80
      61. TABLE 60 EUROPE OPTICAL COATING MARKET, BY END-USE INDUSTRY, 2020-2027 (USD MILLION) 81
      62. TABLE 61 GERMANY OPTICAL COATING MARKET, BY TYPE, 2020-2027 (USD MILLION) 81
      63. TABLE 62 GERMANY OPTICAL COATING MARKET, BY COATING METHOD, 2020-2027 (USD MILLION) 82
      64. TABLE 63 GERMANY OPTICAL COATING MARKET, BY COATING MATERIAL, 2020-2027 (USD MILLION) 82
      65. TABLE 64 GERMANY OPTICAL COATING MARKET, BY END-USE INDUSTRY, 2020-2027 (USD MILLION) 83
      66. TABLE 65 FRANCE OPTICAL COATING MARKET, BY TYPE, 2020-2027 (USD MILLION) 83
      67. TABLE 66 FRANCE OPTICAL COATING MARKET, BY COATING METHOD, 2020-2027 (USD MILLION) 84
      68. TABLE 67 FRANCE OPTICAL COATING MARKET, BY COATING MATERIAL, 2020-2027 (USD MILLION) 84
      69. TABLE 68 FRANCE OPTICAL COATING MARKET, BY END-USE INDUSTRY, 2020-2027 (USD MILLION) 85
      70. TABLE 69 UK OPTICAL COATING MARKET, BY TYPE, 2020-2027 (USD MILLION) 85
      71. TABLE 70 UK OPTICAL COATING MARKET, BY COATING METHOD, 2020-2027 (USD MILLION) 86
      72. TABLE 71 UK OPTICAL COATING MARKET, BY COATING MATERIAL, 2020-2027 (USD MILLION) 86
      73. TABLE 72 UK OPTICAL COATING MARKET, BY END-USE INDUSTRY, 2020-2027 (USD MILLION) 87
      74. TABLE 73 SPAIN OPTICAL COATING MARKET, BY TYPE, 2020-2027 (USD MILLION) 87
      75. TABLE 74 SPAIN OPTICAL COATING MARKET, BY COATING METHOD, 2020-2027 (USD MILLION) 88
      76. TABLE 75 SPAIN OPTICAL COATING MARKET, BY COATING MATERIAL, 2020-2027 (USD MILLION) 88
      77. TABLE 76 SPAIN OPTICAL COATING MARKET, BY END-USE INDUSTRY, 2020-2027 (USD MILLION) 89
      78. TABLE 77 ITALY OPTICAL COATING MARKET, BY TYPE, 2020-2027 (USD MILLION) 89
      79. TABLE 78 ITALY OPTICAL COATING MARKET, BY COATING METHOD, 2020-2027 (USD MILLION) 90
      80. TABLE 79 ITALY OPTICAL COATING MARKET, BY COATING MATERIAL, 2020-2027 (USD MILLION) 90
      81. TABLE 80 ITALY OPTICAL COATING MARKET, BY END-USE INDUSTRY, 2020-2027 (USD MILLION) 91
      82. TABLE 81 RUSSIA OPTICAL COATING MARKET, BY TYPE, 2020-2027 (USD MILLION) 91
      83. TABLE 82 RUSSIA OPTICAL COATING MARKET, BY COATING METHOD, 2020-2027 (USD MILLION) 92
      84. TABLE 83 RUSSIA OPTICAL COATING MARKET, BY COATING MATERIAL, 2020-2027 (USD MILLION) 92
      85. TABLE 84 RUSSIA OPTICAL COATING MARKET, BY END-USE INDUSTRY, 2020-2027 (USD MILLION) 93
      86. TABLE 85 REST OF EUROPE OPTICAL COATING MARKET, BY TYPE, 2020-2027 (USD MILLION) 93
      87. TABLE 86 REST OF EUROPE OPTICAL COATING MARKET, BY COATING METHOD, 2020-2027 (USD MILLION) 94
      88. TABLE 87 REST OF EUROPE OPTICAL COATING MARKET, BY COATING MATERIAL, 2020-2027 (USD MILLION) 94
      89. TABLE 88 REST OF EUROPE OPTICAL COATING MARKET, BY END-USE INDUSTRY, 2020-2027 (USD MILLION) 95
      90. TABLE 89 ASIA-PACIFIC OPTICAL COATING MARKET, BY COUNTRY, 2020-2027 (USD MILLION) 96
      91. TABLE 90 ASIA-PACIFIC OPTICAL COATING MARKET, BY TYPE, 2020-2027 (USD MILLION) 97
      92. TABLE 91 ASIA-PACIFIC OPTICAL COATING MARKET, BY COATING METHOD, 2020-2027 (USD MILLION) 98
      93. TABLE 92 ASIA-PACIFIC OPTICAL COATING MARKET, BY COATING MATERIAL, 2020-2027 (USD MILLION) 98
      94. TABLE 93 ASIA-PACIFIC OPTICAL COATING MARKET, BY END-USE INDUSTRY, 2020-2027 (USD MILLION) 99
      95. TABLE 94 CHINA OPTICAL COATING MARKET, BY TYPE, 2020-2027 (USD MILLION) 99
      96. TABLE 95 CHINA OPTICAL COATING MARKET, BY COATING METHOD, 2020-2027 (USD MILLION) 100
      97. TABLE 96 CHINA OPTICAL COATING MARKET, BY COATING MATERIAL, 2020-2027 (USD MILLION) 100
      98. TABLE 97 CHINA OPTICAL COATING MARKET, BY END-USE INDUSTRY, 2020-2027 (USD MILLION) 101
      99. TABLE 98 JAPAN OPTICAL COATING MARKET, BY TYPE, 2020-2027 (USD MILLION) 101
      100. TABLE 99 JAPAN OPTICAL COATING MARKET, BY COATING METHOD, 2020-2027 (USD MILLION) 102
      101. TABLE 100 JAPAN OPTICAL COATING MARKET, BY COATING MATERIAL, 2020-2027 (USD MILLION) 102
      102. TABLE 101 JAPAN OPTICAL COATING MARKET, BY END-USE INDUSTRY, 2020-2027 (USD MILLION) 103
      103. TABLE 102 SOUTH KOREA OPTICAL COATING MARKET, BY TYPE, 2020-2027 (USD MILLION) 103
      104. TABLE 103 SOUTH KOREA OPTICAL COATING MARKET, BY COATING METHOD, 2020-2027 (USD MILLION) 104
      105. TABLE 104 SOUTH KOREA OPTICAL COATING MARKET, BY COATING MATERIAL, 2020-2027 (USD MILLION) 104
      106. TABLE 105 SOUTH KOREA OPTICAL COATING MARKET, BY END-USE INDUSTRY, 2020-2027 (USD MILLION) 105
      107. TABLE 106 TAIWAN OPTICAL COATING MARKET, BY TYPE, 2020-2027 (USD MILLION) 105
      108. TABLE 107 TAIWAN OPTICAL COATING MARKET, BY COATING METHOD, 2020-2027 (USD MILLION) 106
      109. TABLE 108 TAIWAN OPTICAL COATING MARKET, BY COATING MATERIAL, 2020-2027 (USD MILLION) 106
      110. TABLE 109 TAIWAN OPTICAL COATING MARKET, BY END-USE INDUSTRY, 2020-2027 (USD MILLION) 107
      111. TABLE 110 INDIA OPTICAL COATING MARKET, BY TYPE, 2020-2027 (USD MILLION) 107
      112. TABLE 111 INDIA OPTICAL COATING MARKET, BY COATING METHOD, 2020-2027 (USD MILLION) 108
      113. TABLE 112 INDIA OPTICAL COATING MARKET, BY COATING MATERIAL, 2020-2027 (USD MILLION) 108
      114. TABLE 113 INDIA OPTICAL COATING MARKET, BY END-USE INDUSTRY, 2020-2027 (USD MILLION) 109
      115. TABLE 114 REST OF ASIA-PACIFIC OPTICAL COATING MARKET, BY TYPE, 2020-2027 (USD MILLION) 109
      116. TABLE 115 REST OF ASIA-PACIFIC OPTICAL COATING MARKET, BY COATING METHOD, 2020-2027 (USD MILLION) 110
      117. TABLE 116 REST OF ASIA-PACIFIC OPTICAL COATING MARKET, BY COATING MATERIAL, 2020-2027 (USD MILLION) 110
      118. TABLE 117 REST OF ASIA-PACIFIC OPTICAL COATING MARKET, BY END-USE INDUSTRY, 2020-2027 (USD MILLION) 111
      119. TABLE 118 MIDDLE EAST & AFRICA OPTICAL COATING MARKET, BY COUNTRY, 2020-2027 (USD MILLION) 112
      120. TABLE 119 MIDDLE EAST & AFRICA OPTICAL COATING MARKET, BY TYPE, 2020-2027 (USD MILLION) 113
      121. TABLE 120 MIDDLE EAST & AFRICA OPTICAL COATING MARKET, BY COATING METHOD, 2020-2027 (USD MILLION) 114
      122. TABLE 121 MIDDLE EAST & AFRICA OPTICAL COATING MARKET, BY COATING MATERIAL, 2020-2027 (USD MILLION) 114
      123. TABLE 122 MIDDLE EAST & AFRICA OPTICAL COATING MARKET, BY END-USE INDUSTRY, 2020-2027 (USD MILLION) 115
      124. TABLE 123 GCC OPTICAL COATING MARKET, BY TYPE, 2020-2027 (USD MILLION) 115
      125. TABLE 124 GCC OPTICAL COATING MARKET, BY COATING METHOD, 2020-2027 (USD MILLION) 116
      126. TABLE 125 GCC OPTICAL COATING MARKET, BY COATING MATERIAL, 2020-2027 (USD MILLION) 116
      127. TABLE 126 GCC OPTICAL COATING MARKET, BY END-USE INDUSTRY, 2020-2027 (USD MILLION) 117
      128. TABLE 127 SOUTH AFRICA OPTICAL COATING MARKET, BY TYPE, 2020-2027 (USD MILLION) 117
      129. TABLE 128 SOUTH AFRICA OPTICAL COATING MARKET, BY COATING METHOD, 2020-2027 (USD MILLION) 118
      130. TABLE 129 SOUTH AFRICA OPTICAL COATING MARKET, BY COATING MATERIAL, 2020-2027 (USD MILLION) 118
      131. TABLE 130 SOUTH AFRICA OPTICAL COATING MARKET, BY END-USE INDUSTRY, 2020-2027 (USD MILLION) 119
      132. TABLE 131 REST OF MIDDLE EAST & AFRICA OPTICAL COATING MARKET, BY TYPE, 2020-2027 (USD MILLION) 119
      133. TABLE 132 REST OF MIDDLE EAST & AFRICA OPTICAL COATING MARKET, BY COATING METHOD, 2020-2027 (USD MILLION) 120
      134. TABLE 133 REST OF MIDDLE EAST & AFRICA OPTICAL COATING MARKET, BY COATING MATERIAL, 2020-2027 (USD MILLION) 120
      135. TABLE 134 REST OF MIDDLE EAST & AFRICA OPTICAL COATING MARKET, BY END-USE INDUSTRY, 2020-2027 (USD MILLION) 121
      136. TABLE 135 LATIN AMERICA OPTICAL COATING MARKET, BY COUNTRY, 2020-2027 (USD MILLION) 122
      137. TABLE 136 LATIN AMERICA OPTICAL COATING MARKET, BY TYPE, 2020-2027 (USD MILLION) 123
      138. TABLE 137 LATIN AMERICA OPTICAL COATING MARKET, BY COATING METHOD, 2020-2027 (USD MILLION) 124
      139. TABLE 138 LATIN AMERICA OPTICAL COATING MARKET, BY COATING MATERIAL, 2020-2027 (USD MILLION) 124
      140. TABLE 139 LATIN AMERICA OPTICAL COATING MARKET, BY END-USE INDUSTRY, 2020-2027 (USD MILLION) 125
      141. TABLE 140 MEXICO OPTICAL COATING MARKET, BY TYPE, 2020-2027 (USD MILLION) 125
      142. TABLE 141 MEXICO OPTICAL COATING MARKET, BY COATING METHOD, 2020-2027 (USD MILLION) 126
      143. TABLE 142 MEXICO OPTICAL COATING MARKET, BY COATING MATERIAL, 2020-2027 (USD MILLION) 126
      144. TABLE 143 MEXICO OPTICAL COATING MARKET, BY END-USE INDUSTRY, 2020-2027 (USD MILLION) 127
      145. TABLE 144 BRAZIL OPTICAL COATING MARKET, BY TYPE, 2020-2027 (USD MILLION) 127
      146. TABLE 145 BRAZIL OPTICAL COATING MARKET, BY COATING METHOD, 2020-2027 (USD MILLION) 128
      147. TABLE 146 BRAZIL OPTICAL COATING MARKET, BY COATING MATERIAL, 2020-2027 (USD MILLION) 128
      148. TABLE 147 BRAZIL OPTICAL COATING MARKET, BY END-USE INDUSTRY, 2020-2027 (USD MILLION) 129
      149. TABLE 148 REST OF LATIN AMERICA OPTICAL COATING MARKET, BY TYPE, 2020-2027 (USD MILLION) 129
      150. TABLE 149 REST OF LATIN AMERICA OPTICAL COATING MARKET, BY COATING METHOD, 2020-2027 (USD MILLION) 130
      151. TABLE 150 REST OF LATIN AMERICA OPTICAL COATING MARKET, BY COATING MATERIAL, 2020-2027 (USD MILLION) 130
      152. TABLE 151 REST OF LATIN AMERICA OPTICAL COATING MARKET, BY END-USE INDUSTRY, 2020-2027 (USD MILLION) 131
      153. TABLE 152 KEY DEVELOPMENTS 134 15 List of Figures
      154. FIGURE 1 GLOBAL OPTICAL COATINGS MARKET: MARKET STRUCTURE 21
      155. FIGURE 2 NORTH AMERICA MARKET SIZE & MARKET SHARE BY COUNTRY (2020 VS 2027) 23
      156. FIGURE 3 EUROPE MARKET SIZE & MARKET SHARE BY COUNTRY (2020 VS 2027) 23
      157. FIGURE 4 ASIA PACIFIC MARKET SHARE BY COUNTRY (2020 VS 2027) 24
      158. FIGURE 5 MIDDLE EAST & AFRICA MARKET SHARE BY COUNTRY (2020 VS 2027) 24
      159. FIGURE 6 LATIN AMERICA MARKET SHARE BY COUNTRY (2020 VS 2027) 25
      160. FIGURE 7 OPTICAL COATINGS MARKET, BY REGION/COUNTRY, 2020 25
      161. FIGURE 8 RESEARCH PROCESS OF MRFR 27
      162. FIGURE 9 TOP DOWN & BOTTOM UP APPROACH 30
      163. FIGURE 10 MARKET DYNAMICS OVERVIEW 32
      164. FIGURE 11 DRIVER IMPACT ANALYSIS 33
      165. FIGURE 12 GLOBAL CONSUMER ELECTRONIC INDUSTRY REVENUE GROWTH (2020-2027) 34
      166. FIGURE 13 AUTOMOTIVE PRODUCTION Y-O-Y GROWTH 35
      167. FIGURE 14 RESTRAINTS IMPACT ANALYSIS 35
      168. FIGURE 15 SUPPLY CHAIN ANALYSIS OF GLOBAL OPTICAL COATING MARKET 37
      169. FIGURE 16 PORTER’S FIVE FORCES ANALYSIS OF GLOBAL OPTICAL COATING MARKET 39
      170. FIGURE 17 GLOBAL OPTICAL COATING MARKET, BY TYPE, 2020-2027 (USD MILLION) 42
      171. FIGURE 18 GLOBAL OPTICAL COATING MARKET, BY COATING METHOD, 2020-2027 (USD MILLION) 51
      172. FIGURE 19 GLOBAL OPTICAL COATING MARKET, BY COATING MATERIAL, 2020-2027 (USD MILLION) 59
      173. FIGURE 20 GLOBAL OPTICAL COATING MARKET, BY END-USE INDUSTRY, 2020-2027 (USD MILLION) 62
      174. FIGURE 21 GLOBAL OPTICAL COATING MARKET, BY REGION, 2020-2027 (USD MILLION) 67
      175. FIGURE 22 NORTH AMERICA OPTICAL COATING MARKET, BY COUNTRY (2020) 70
      176. FIGURE 23 EUROPE OPTICAL COATING MARKET, BY COUNTRY (2020) 78
      177. FIGURE 24 ASIA-PACIFIC OPTICAL COATING MARKET, BY COUNTRY (2020) 96
      178. FIGURE 25 MIDDLE EAST & AFRICA OPTICAL COATING MARKET, BY COUNTRY (2020) 112
      179. FIGURE 26 LATIN AMERICA OPTICAL COATING MARKET, BY COUNTRY (2020) 122
      180. FIGURE 27 MARKET STRATEGY (%) 133

    Optical Coating Market Segmentation

    Market Segmentation Overview

    • Detailed segmentation data will be available in the full report
    • Comprehensive analysis by multiple parameters
    • Regional and country-level breakdowns
    • Market size forecasts by segment
    Infographic

    Free Sample Request

    Kindly complete the form below to receive a free sample of this Report

    Get Free Sample

    Customer Strories

    “I am very pleased with how market segments have been defined in a relevant way for my purposes (such as "Portable Freezers & refrigerators" and "last-mile"). In general the report is well structured. Thanks very much for your efforts.”

    Victoria Milne

    Founder
    Case Study
    Chemicals and Materials