• Cat-intel
  • MedIntelliX
  • Resources
  • About Us
  • Hero Background
    English
    Chinese
    French
    Japanese
    Korean
    German
    Spanish

    Oil Shale Market Trends

    ID: MRFR/CnM/9976-HCR
    128 Pages
    Garvit Vyas
    October 2025

    Oil Shale Market Research Report Information By Process (Extraction (mining), Retorting, and Refining), By Method (In-Situ and Ex-Situ), By Product (Diesel Fuel, Gasoline Fuel, Liquid Petroleum Gas, Kerosene and Others), By End Users (Automobile Fuel, Chemical Industry, Cement Industry and Others), And By Region (North America, Europe, Asia-Pacific, Latin America and Middle East & Africa) -...

    Share:
    Download PDF ×

    We do not share your information with anyone. However, we may send you emails based on your report interest from time to time. You may contact us at any time to opt-out.

    Oil Shale Market Infographic
    Purchase Options

    Market Trends

    Key Emerging Trends in the Oil Shale Market

    The market of oil shale has been going through a rapid evolutionary process influenced by a dome of geopolitical factors, technological advents, and global energy consumption. In the last years, the market has been subject to volatility affected by oil prices’ change, environmental worries and search for energy independence. A significant idea emerging today has been that of the rise of the use of nontraditional energy sources in which oil shale is cited as a game-changer.

    Due to the U.S. shale oil breaking of important areas such as the U.S., there has been a significant effect on the global market. The extraction of oil from shale, which is known as fracking, has become the main factor in the increase of the oil supply, and it has influenced the way the market is currently working. This booming of shale oil extracting in some countries has not only brought energy independence for those countries but also has changed the oil prices on a larger scale.

    Environmental factors, among many other, have a central role in driving the oil shale market. Oil shale extraction and processing requires the implementation of intricate technology that has proven controversial with regards to environmental mitigation. For the world to become environmentally aware, laws and policies getting introduced in this matter. Tightened environmental regulations can limit the commercial feasibility and viability of oil shale operations, thus inciting oil companies to invest in cleaner and more environment-friendly technologies.

    The oil shale market is also determined by the geopolitical phenomena. Oil shale distribution across regions can result in reconfiguring international economies and political structures. Countries owning considerable oil shale fields may become more influential on the geopolitical stage as they become trade partners in the oil market. On the other hand, geopolitical tensions and conflicts in oil producing areas may affect the stability of oil shale supply chains, resulting in unsteady oil prices and market trends.

    Technological breakthroughs are key elements for oil shale market uplifting. Research and development continually strive to optimize extractive methods, to minimize environmental trails and to increase efficiency. Installeries of new drilling equipment, reservoir characterization, and recovery process could play a key role in increasing the productivity and competitiveness of the oil shale industry. The implementation of innovative technologies will most probably be the powerful factor in obtaining the long-term success in the field of oil shale projects.

    Author
    Garvit Vyas
    Analyst

    Explore the profile of Garvit Vyas, one of our esteemed authors at Market Research Future, and access their expert research contributions in the field of market research and industry analysis

    Leave a Comment

    FAQs

    How much is the oil shale market?

    How big is the U.S oil shale market?

    What is the growth rate of the oil shale market?

    Which region held the largest market share in the oil shale market?

    Who are the key players in the oil shale market?

    Which product lead to oil shale market growth?

    Market Summary

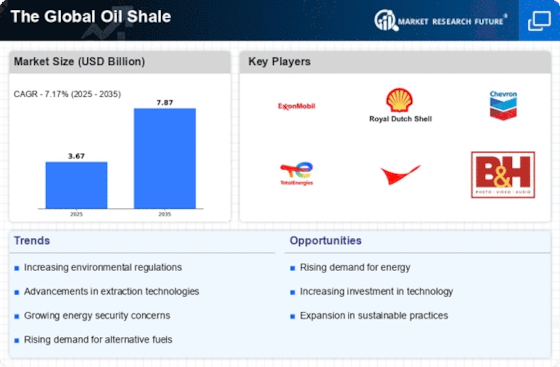
    As per MRFR analysis, The Global Oil Shale Size was estimated at 3.675 USD Billion in 2024. The oil shale industry is projected to grow from 3.939 USD Billion in 2025 to 7.872 USD Billion by 2035, exhibiting a compound annual growth rate (CAGR) of 7.17 during the forecast period 2025 - 2035.

    Key Market Trends & Highlights

    The Global Oil Shale is poised for growth driven by technological advancements and increasing energy demands.

    • Technological advancements in extraction methods are enhancing efficiency and reducing costs in the North American market.
    • The Asia-Pacific region is experiencing rapid growth, driven by rising energy demands and a focus on energy security.
    • The extraction segment remains the largest, while the retorting segment is emerging as the fastest-growing due to innovative processing techniques.
    • Rising energy demand and supportive government policies are key drivers propelling the market forward.

    Market Size & Forecast

    2024 Market Size 3.675 (USD Billion)
    2035 Market Size 7.872 (USD Billion)
    CAGR (2025 - 2035) 7.17%
    Largest Regional Market Share in 2024 North America

    Major Players

    <p>ExxonMobil (US), Royal Dutch Shell (GB), Chevron (US), TotalEnergies (FR), ConocoPhillips (US), BHP (AU), EOG Resources (US), Pioneer Natural Resources (US), Suncor Energy (CA)</p>

    Market Trends

    The Global Oil Shale is currently experiencing a period of transformation, driven by advancements in extraction technologies and a growing emphasis on energy security. As nations seek to diversify their energy portfolios, oil shale presents a viable alternative to conventional fossil fuels. This market appears to be gaining traction, particularly in regions rich in oil shale deposits, where governments are incentivizing exploration and production. The interplay between environmental concerns and the need for energy independence is shaping the landscape, leading to increased investment in sustainable extraction methods. Moreover, The Global Oil Shale is likely to witness a shift in consumer preferences, as stakeholders become more aware of the environmental implications of fossil fuel consumption. This awareness may drive innovation in cleaner extraction techniques and promote the development of oil shale as a more sustainable energy source. The market's future seems to hinge on balancing economic viability with ecological responsibility, suggesting that companies operating within this sector must adapt to evolving regulatory frameworks and public sentiment. As the world transitions towards a more sustainable energy future, the role of oil shale could become increasingly pivotal, potentially reshaping energy dynamics on a global scale.

    Technological Advancements in Extraction Methods

    Recent innovations in extraction technologies are enhancing the efficiency and sustainability of oil shale production. These advancements may lead to reduced environmental impacts and lower operational costs, making oil shale a more attractive option for energy generation.

    Increased Focus on Energy Security

    As geopolitical tensions and supply chain vulnerabilities persist, nations are prioritizing energy security. This trend is likely to drive investments in domestic oil shale resources, allowing countries to reduce dependence on foreign energy supplies.

    Growing Environmental Awareness

    The rising consciousness regarding climate change and environmental degradation is influencing the oil shale sector. Stakeholders are increasingly advocating for cleaner extraction practices, which could reshape industry standards and consumer expectations.

    The global oil shale market appears poised for growth as advancements in extraction technologies and increasing energy demands drive interest in unconventional fossil fuel resources.

    U.S. Energy Information Administration (EIA)

    Oil Shale Market Market Drivers

    Rising Energy Demand

    The increasing The Global Oil Shale Industry. As populations grow and economies expand, the need for energy sources intensifies. According to recent estimates, energy consumption is projected to rise by approximately 30 percent by 2040. This surge in demand compels nations to explore alternative energy sources, including oil shale, which is abundant in various regions. The Oil Shale Market is likely to benefit from this trend, as countries seek to diversify their energy portfolios and reduce reliance on conventional fossil fuels. Furthermore, the strategic importance of oil shale resources may lead to increased investments in extraction technologies, thereby enhancing production capabilities and market growth.

    Government Policies and Incentives

    Government policies and incentives play a crucial role in shaping the Oil Shale Market. Many countries are implementing favorable regulations to promote the development of unconventional oil resources, including oil shale. For instance, tax incentives, subsidies, and research grants are being offered to companies engaged in oil shale exploration and production. These initiatives aim to stimulate investment and innovation in extraction technologies, which could lead to more efficient and environmentally friendly methods. As a result, the Oil Shale Market is likely to experience growth driven by supportive governmental frameworks that encourage sustainable energy practices and enhance energy independence.

    Investment in Research and Development

    Investment in research and development is a key driver for the Oil Shale Market. As the demand for cleaner and more efficient energy sources grows, companies and governments are allocating resources to innovate and improve oil shale extraction and processing methods. This focus on R&D is likely to yield breakthroughs that enhance the economic feasibility of oil shale projects. For instance, advancements in carbon capture and storage technologies could mitigate environmental concerns associated with oil shale production. Consequently, the Oil Shale Market stands to benefit from increased investment in R&D, which may lead to more sustainable practices and greater market acceptance.

    Technological Innovations in Processing

    Technological innovations in processing techniques are transforming the Oil Shale Market. Advances in extraction and processing technologies, such as in-situ retorting and solvent extraction, are enhancing the efficiency and economic viability of oil shale production. These innovations not only reduce operational costs but also minimize environmental impacts associated with traditional extraction methods. The market is witnessing a shift towards more sustainable practices, which could attract investment and foster growth. As companies adopt these cutting-edge technologies, the Oil Shale Market is expected to expand, providing a reliable source of energy while addressing environmental concerns.

    Geopolitical Factors and Resource Accessibility

    Geopolitical factors significantly influence the Oil Shale Market, particularly in regions rich in oil shale deposits. The accessibility of these resources is often affected by political stability, trade relations, and regulatory environments. Countries with abundant oil shale reserves may leverage these resources to enhance their energy security and reduce dependence on imported oil. This strategic positioning can lead to increased exploration and production activities, thereby driving market growth. Additionally, geopolitical tensions may prompt nations to invest in domestic oil shale development as a means of ensuring energy independence, further bolstering the Oil Shale Market.

    Market Segment Insights

    By Process: Extraction (Largest) vs. Retorting (Fastest-Growing)

    <p>In The Global Oil Shale, the extraction segment (mining) has established itself as the largest contributor. This segment accounts for significant share due to the ongoing demand for oil production and the need for raw materials derived from oil shale. Retorting follows as the fastest-growing segment, driven by advancements in technology and increasing investments in the enhancement of retorting processes, which facilitate the transformation of oil shale into usable oil.</p>

    <p>Extraction (Dominant) vs. Retorting (Emerging)</p>

    <p>The extraction segment is characterized by established mining practices and techniques, leading to large-scale production capabilities. Its dominance in the market stems from the necessity of acquiring raw oil shale, which serves as the basis for oil production. On the other hand, retorting is emerging as a critical process fueled by technological enhancements and innovations. As methods improve and become more efficient, retorting is expected to capture a larger market share, reflecting the industry's pivot towards cleaner and more efficient conversion techniques, ultimately widening its application in the oil shale sector.</p>

    By Method: In-Situ (Largest) vs. Ex-Situ (Fastest-Growing)

    <p>In The Global Oil Shale, the distribution of market share between the In-Situ and Ex-Situ methods reveals a clear dominance of In-Situ techniques. In-Situ processes, characterized by their ability to minimize environmental disruption and lower operational costs, continue to hold the largest share in the market. Meanwhile, the Ex-Situ method is increasingly gaining traction, driven by advancements in processing technologies that enhance its efficiency and yield. As oil demand fluctuates, these methods present varying advantages that cater to diverse operational needs in oil shale extraction, positioning them distinctly within the market landscape.</p>

    <p>Method: In-Situ (Dominant) vs. Ex-Situ (Emerging)</p>

    <p>In-Situ extraction is marked by its favored efficiency and reduced environmental footprints, permitting oil recovery directly from the ground without extensive surface disturbance. This method leverages thermal processes to convert kerogen within the shale into crude oil, thus capitalizing on existing geological formations. Conversely, the Ex-Situ method is beginning to emerge rapidly, operating by mining the oil shale and processing it above ground. This method, while traditionally less popular, has seen substantial innovations that promise improved recovery rates and operational viability. The ongoing advancements suggest that Ex-Situ could complement or compete with In-Situ techniques amidst shifting market conditions.</p>

    By Product: Gasoline (Largest) vs. Diesel (Fastest-Growing)

    <p>In The Global Oil Shale, the product segmentation reveals that gasoline dominates market share, accounting for a substantial portion of oil shale production. This dominance is primarily due to the high demand for gasoline in transportation and personal vehicles across the globe. Diesel follows, representing a significant but smaller share, primarily driven by its utilities in commercial transport and logistics sectors. Kerosene and other products contribute to the market but hold lesser shares compared to gasoline and diesel. Looking into growth trends, diesel is currently the fastest-growing segment in the oil shale market, attributed to the increased usage of diesel engines in transportation and industrial activities. Factors such as environmental regulations promoting cleaner fuels and the push for energy efficiency are also propelling diesel's demand. On the other hand, gasoline remains steadfast as the market leader, although its growth is more stable compared to the rapidly expanding diesel segment.</p>

    <p>Gasoline (Dominant) vs. Kerosene (Emerging)</p>

    <p>Gasoline remains the dominant product in The Global Oil Shale due to its extensive applications and high consumer demand. It is preferred for its efficiency and availability, making it the go-to fuel for personal and commercial vehicles. As an established player, gasoline benefits from widespread infrastructure and distribution networks. On the other hand, kerosene is emerging as a relevant segment, particularly in developing regions where it is often used for heating and cooking. Its growth is supported by the increasing need for accessible energy sources in rural areas. While gasoline enjoys the status of a market leader, kerosene's market position is evolving, influenced by trends in energy consumption and environmental sustainability.</p>

    By End User: Automobile Fuel (Largest) vs. Chemical Industry (Fastest-Growing)

    <p>In The Global Oil Shale, the end user segment shows diverse applications, with automobile fuel leading as the dominant application. This segment significantly captures the market share as the demand for alternative fuels rises amidst stringent environmental regulations and the transition to cleaner energy sources. The chemical industry follows suit, leveraging oil shale for various chemical feedstocks, thereby presenting a substantial portion of the market.</p>

    <p>Automobile Fuel (Dominant) vs. Chemical Industry (Emerging)</p>

    <p>The automobile fuel segment remains the cornerstone of The Global Oil Shale, driven by an increasing preference for energy independence and sustainable fuel alternatives. This segment is characterized by its robust infrastructure for extraction and processing, gaining traction due to advances in technology enhancing oil yield from shale deposits. Conversely, the chemical industry presents an emerging opportunity, utilizing oil shale to produce essential chemicals while adapting to evolving regulations. As innovation in shale extraction and processing techniques continues to evolve, the chemical industry is expected to grow rapidly, reflecting a strategic shift towards utilizing unconventional resources.</p>

    Get more detailed insights about Oil Shale Market Research Report—Global Forecast till 2030

    Regional Insights

    By Region, the study segments the market into North America, Europe, Asia-Pacific and Latin America and Middle East & Africa.

    North America dominates the world market where the United States has significant oil shale resources, primarily within the Green River Formation in Wyoming, Utah and Colorado. According to EIA, oil shale resources underlie a total area of 16,000 square miles and represent the largest known concentration of oil shale in the world and have become the largest exporter of oil shale.

    In Europe countries like Russia have a wide range of oil shale resources and are also big exporters of oil shale. According to the EIA report, Russia has a 75 billion barrels share of oil resources and is also a major exporter of oil shale after the USA.

    Further, the major countries studied are The USA, Canada, Germany, France, UK, Italy, Spain, China, Japan, India, Australia, Argentina, Brazil, Mexico, South Africa and GCC countries.

    Key Players and Competitive Insights

    Major market players are focusing on the R&D of the oil shale to refine it so to make it more efficient fuel to use. Majorly companies are also been focused on the extraction of the oil shale from the rocks as it is not an easy process to extract and a lot of water is been polluted in the extraction. New technology in In-Situ like fracturing in which oil is converted into the ground itself and then pumped out, in this process there is no need to extract rock and crush them.

    New advance technologies fracturing of rocks is done so to extract the oil more efficiently.

    ExxonMobil Corporation (ExxonMobil) is an American multinational oil & gas corporation. It performs crude oil refinement, makes lube base stocks and finished lubricants, transports, trades, and sells petroleum products. Additionally, the business produces and sells a wide range of specialty goods in addition to commodity petrochemicals such olefins, aromatics, polyethylene, and polypropylene plastics. High-performance fuels and lubricant products made by ExxonMobil power global transportation, increase efficiency, and lower the entire life-cycle emissions of our clients. It runs through a network of production facilities, transit hubs, and distribution facilities.

    North America, Latin America, Asia Pacific, Europe, the Middle East, and Africa are all operational regions for the company.

    Chevron Corporation (Chevron) is an integrated oil & gas company. It operates along the whole value chain of the oil & gas industry, from exploration and production to storage and pipeline transportation to refining, marketing, and distribution of oil and gas products. With quality base oils as their foundation, Chevron lubricants has more than 30 years of experience producing finished lubricants. Customers on five continents rely on Chevron lubricants to deliver great, dependable performance in a variety of operating circumstances, whether they need motor oil for the family car or lubricants for heavy industrial equipment.

    The company also sells petrochemicals and additives. The company searches for, produces, and transports crude oil and natural gas. It also refines, markets, and distributes transportation fuels and lubricants. In the areas where it operates, Chevron has stakes in gas-to-liquid facilities. North America, South America, Europe, Asia, the Middle East, and Africa are all operational hubs for the organization.

    Key Companies in the Oil Shale Market market include

    Industry Developments

    • Q3 2025: Milbank LLP is advising YPF S.A. in connection with its definitive agreement with Total Austral S.A., an affiliate of TotalEnergies, to acquire a 45% interest in Rincón La Ceniza and La Escalonada, two unconventional oil and gas blocks located in Argentina, for $500 million. YPF S.A. signed a definitive agreement to acquire a 45% stake in two unconventional oil and gas blocks in Argentina from Total Austral S.A., for $500 million, expanding its presence in the oil shale sector.
    • Q3 2025: EOG Resources today announced a definitive agreement to acquire Encino Acquisition Partners (EAP) for $5.6 billion. EOG Resources agreed to acquire Encino Acquisition Partners for $5.6 billion, adding 675,000 net acres in the Utica shale play and significantly increasing its undeveloped resource base.
    • Q3 2025: Occidental has raised $950 million through recent Permian asset sales and repaid $7.5 billion in debt since July 2024, continuing its post-CrownRock strategy to streamline operations and strengthen its balance sheet. Occidental Petroleum completed $950 million in Permian asset sales and repaid $7.5 billion in debt, as part of its ongoing strategy to optimize its shale portfolio and improve financial stability.
    • Q3 2025: Civitas Resources has sold $435 million in non-core DJ Basin assets and named Wouter van Kempen as interim CEO, aligning its portfolio strategy with leadership changes and a focus on debt reduction and shareholder value. Civitas Resources divested $435 million in non-core DJ Basin assets and appointed Wouter van Kempen as interim CEO, reflecting a strategic shift in its shale operations and leadership.
    • Q4 2024: Matterhorn Express Pipeline, which began transporting natural gas in October 2024, is expected to alleviate some bottlenecks. The Matterhorn Express Pipeline commenced operations in October 2024, increasing takeaway capacity for natural gas from the Permian Basin and addressing infrastructure bottlenecks in shale production.

    Future Outlook

    Oil Shale Market Future Outlook

    <p>The Global Oil Shale is projected to grow at a 7.17% CAGR from 2024 to 2035, driven by technological advancements, increasing energy demand, and environmental considerations.</p>

    New opportunities lie in:

    • <p>Investment in advanced extraction technologies to enhance yield efficiency.</p>
    • <p>Development of sustainable oil shale processing methods to reduce environmental impact.</p>
    • <p>Expansion into emerging markets with untapped oil shale reserves.</p>

    <p>By 2035, the market is expected to solidify its position as a key energy source.</p>

    Market Segmentation

    Oil Shale Market Method Outlook

    • In-Situ
    • Ex-Situ

    Oil Shale Market Process Outlook

    • Extraction (mining)
    • Retorting
    • Refining

    Oil Shale Market Product Outlook

    • Gasoline
    • Diesel
    • Kerosene
    • Others

    Oil Shale Market End User Outlook

    • Automobile Fuel
    • Chemical Industry
    • Cement Industry
    • Others

    Report Scope

    MARKET SIZE 20243.675(USD Billion)
    MARKET SIZE 20253.939(USD Billion)
    MARKET SIZE 20357.872(USD Billion)
    COMPOUND ANNUAL GROWTH RATE (CAGR)7.17% (2024 - 2035)
    REPORT COVERAGERevenue Forecast, Competitive Landscape, Growth Factors, and Trends
    BASE YEAR2024
    Market Forecast Period2025 - 2035
    Historical Data2019 - 2024
    Market Forecast UnitsUSD Billion
    Key Companies ProfiledMarket analysis in progress
    Segments CoveredMarket segmentation analysis in progress
    Key Market OpportunitiesAdvancements in extraction technologies enhance efficiency in The Global Oil Shale.
    Key Market DynamicsTechnological advancements in extraction methods are reshaping competitive dynamics within the oil shale market.
    Countries CoveredNorth America, Europe, APAC, South America, MEA

    FAQs

    How much is the oil shale market?

    How big is the U.S oil shale market?

    What is the growth rate of the oil shale market?

    Which region held the largest market share in the oil shale market?

    Who are the key players in the oil shale market?

    Which product lead to oil shale market growth?

    1. MARKET DYNAMICS
      1. \r\n4.1. Introduction
      2. \r\n4.2. Growth Parameters Mapped
      3. - Drivers
      4. \r\n4.2.1. Increasing energy demand from various end use industries
      5. \r\n4.2.2.
      6. Rising technological advancements in shale oil extraction and processing
      7. \r\n4.3.
      8. What are the challenges faced by Industry Participants?
      9. \r\n4.3.1. High production
      10. cost
      11. \r\n4.4. Opportunities
      12. \r\n4.4.1. Vast availability of oil shale
      13. reserves
      14. \r\n4.5. Impact Analysis of COVID-19
      15. \r\n4.5.1. Impact on Supply
      16. Chain of Oil Shale
      17. \r\n4.5.2. Impact on Market Demand of Oil Shale
      18. \r\n5.
    2. MARKET FACTOR ANALYSIS
      1. \r\n5.1. Supply/Value Chain Analysis
      2. \r\n5.1.1.
      3. Participants
      4. \r\n5.1.2. Value Percolation Across the Chain
      5. \r\n5.1.3.
      6. Integration Levels
      7. \r\n5.1.4. Key Issues Addressed
      8. \r\n5.2. Porter’s
      9. Five Forces Model
      10. \r\n5.2.1. Bargaining Power of Suppliers
      11. \r\n5.2.2.
      12. Bargaining Power of Buyers
      13. \r\n5.2.3. Threat of New Entrants
      14. \r\n5.2.4.
      15. Threat of Substitutes
      16. \r\n5.2.5. Intensity of Rivalry
      17. \r\n5.3. Pricing
      18. Analysis, by region (2019-2030)
      19. \r\n5.4. Regulatory Framework
      20. \r\n5.5.
      21. Technological Advancements
      22. \r\n 
      23. \r\nSECTION IV: QUANTITATIVE ANALYSIS
      24. \r\n6.
    3. GLOBAL OIL SHALE MARKET, BY PROCESS (USD MILLION & MILLION BARRELS)
      1. \r\n6.1.
      2. Introduction
      3. \r\n6.2. Extraction (Mining)
      4. \r\n6.2.1. Global Oil Shale
    4. Market Size: Market Estimates & Forecast, By Extraction (Mining), 2019-2030
      1. \r\n6.3.
      2. Retorting
      3. \r\n6.3.1. Global Oil Shale Market Size: Market Estimates &
      4. Forecast, By Retorting, 2019-2030
      5. \r\n6.4. Refining
      6. \r\n6.4.1. Global
    5. Oil Shale Market Size: Market Estimates & Forecast, By Refining, 2019-2030
      1. \r\n7.
    6. GLOBAL OIL SHALE MARKET, BY METHOD (USD MILLION & MILLION BARRELS)
      1. \r\n7.1.
      2. Introduction
      3. \r\n7.2. In-Situ
      4. \r\n7.2.1. Global Oil Shale Market Size:
    7. Market Estimates & Forecast, By In-Situ, 2019-2030
      1. \r\n7.3. Ex-Situ
      2. \r\n7.3.1.
    8. Global Oil Shale Market Size: Market Estimates & Forecast, By Ex-Situ, 2019-2030
      1. \r\n8.
    9. GLOBAL OIL SHALE MARKET, BY PRODUCT (USD MILLION & MILLION BARRELS)
      1. \r\n8.1.
      2. Introduction
      3. \r\n8.2. Diesel Fuel
      4. \r\n8.2.1. Global Oil Shale Market
    10. Size: Market Estimates & Forecast, By Diesel Fuel, 2019-2030
      1. \r\n8.3.
      2. Gasoline Fuel
      3. \r\n8.3.1. Global Oil Shale Market Size: Market Estimates &
      4. Forecast, By Gasoline Fuel, 2019-2030
      5. \r\n8.4. Liquid Petroleum Gas
      6. \r\n8.4.1.
    11. Global Oil Shale Market Size: Market Estimates & Forecast, By Liquid Petroleum
      1. Gas, 2019-2030
      2. \r\n8.5. Kerosene
      3. \r\n8.5.1. Global Oil Shale Market
    12. Size: Market Estimates & Forecast, By Kerosene, 2019-2030
      1. \r\n8.6. Others
      2. \r\n8.6.1.
    13. Global Oil Shale Market Size: Market Estimates & Forecast, By Others, 2019-2030
      1. \r\n9.
    14. GLOBAL OIL SHALE MARKET, BY END USER (USD MILLION & MILLION BARRELS)
      1. \r\n9.1.
      2. Introduction
      3. \r\n9.2. Automobile Fuel
      4. \r\n9.2.1. Global Oil Shale Market
    15. Size: Market Estimates & Forecast, By Automobile Fuel, 2019-2030
      1. \r\n9.3.
      2. Chemical Industry
      3. \r\n9.3.1. Global Oil Shale Market Size: Market Estimates
      4. & Forecast, By Chemical Industry, 2019-2030
      5. \r\n9.4. Cement Industry
      6. \r\n9.4.1.
    16. Global Oil Shale Market Size: Market Estimates & Forecast, By Cement Industry,
      1. \r\n9.5. Others
      2. \r\n9.5.1. Global Oil Shale Market Size: Market
      3. Estimates & Forecast, By Others, 2019-2030
      4. \r\n10. GLOBAL OIL SHALE MARKET,
      5. BY REGION (USD MILLION & MILLION BARRELS)
      6. \r\n10.1. Introduction
      7. \r\n10.2.
      8. North America
      9. \r\n10.2.1. North America Oil Shale Market Size: Market Estimates
      10. & Forecast, By Country, 2019-2030
      11. \r\n10.2.2. North America Oil Shale
    17. Market Size: Market Estimates & Forecast, By Process, 2019-2030
      1. \r\n10.2.3.
    18. North America Oil Shale Market Size: Market Estimates & Forecast, By Method,
      1. \r\n10.2.4. North America Oil Shale Market Size: Market Estimates
      2. & Forecast, By Product, 2019-2030
      3. \r\n10.2.5. North America Oil Shale
    19. Market Size: Market Estimates & Forecast, By End Users, 2019-2030
      1. \r\n10.2.6.
      2. US
      3. \r\n10.2.6.1. US Oil Shale Market Size: Market Estimates & Forecast,
      4. By Process, 2019-2030
      5. \r\n10.2.6.2. US Oil Shale Market Size: Market Estimates
      6. & Forecast, By Method, 2019-2030
      7. \r\n10.2.6.3. US Oil Shale Market Size:
    20. Market Estimates & Forecast, By Product, 2019-2030
      1. \r\n10.2.6.4. US Oil
    21. Shale Market Size: Market Estimates & Forecast, By End Users, 2019-2030
      1. \r\n10.2.7.
      2. Canada
      3. \r\n10.2.7.1. Canada Oil Shale Market Size: Market Estimates &
      4. Forecast, By Process, 2019-2030
      5. \r\n10.2.7.2. Canada Oil Shale Market Size:
    22. Market Estimates & Forecast, By Method, 2019-2030
      1. \r\n10.2.7.3. Canada
    23. Oil Shale Market Size: Market Estimates & Forecast, By Product, 2019-2030
      1. \r\n10.2.7.4.
    24. Canada Oil Shale Market Size: Market Estimates & Forecast, By End Users, 2019-2030
      1. \r\n10.2.8.
      2. Mexico
      3. \r\n10.2.8.1. Mexico Oil Shale Market Size: Market Estimates &
      4. Forecast, By Process, 2019-2030
      5. \r\n10.2.8.2. Mexico Oil Shale Market Size:
    25. Market Estimates & Forecast, By Method, 2019-2030
      1. \r\n10.2.8.3. Mexico
    26. Oil Shale Market Size: Market Estimates & Forecast, By Product, 2019-2030
      1. \r\n10.2.8.4.
    27. Mexico Oil Shale Market Size: Market Estimates & Forecast, By End Users, 2019-2030
      1. \r\n10.3.
      2. Europe
      3. \r\n10.3.1. Europe Oil Shale Market Size: Market Estimates & Forecast,
      4. By Country, 2019-2030
      5. \r\n10.3.2. Europe Oil Shale Market Size: Market Estimates
      6. & Forecast, By Process, 2019-2030
      7. \r\n10.3.3. Europe Oil Shale Market
    28. Size: Market Estimates & Forecast, By Method, 2019-2030
      1. \r\n10.3.4. Europe
    29. Oil Shale Market Size: Market Estimates & Forecast, By Product, 2019-2030
      1. \r\n10.3.5.
    30. Europe Oil Shale Market Size: Market Estimates & Forecast, By End Users, 2019-2030
      1. \r\n10.3.6.
      2. Germany
      3. \r\n10.3.6.1. Germany Oil Shale Market Size: Market Estimates &
      4. Forecast, By Process, 2019-2030
      5. \r\n10.3.6.2. Germany Oil Shale Market Size:
    31. Market Estimates & Forecast, By Method, 2019-2030
      1. \r\n10.3.6.3. Germany
    32. Oil Shale Market Size: Market Estimates & Forecast, By Product, 2019-2030
      1. \r\n10.3.6.4.
    33. Germany Oil Shale Market Size: Market Estimates & Forecast, By End Users, 2019-2030
      1. \r\n10.3.7.
      2. France
      3. \r\n10.3.7.1. France Oil Shale Market Size: Market Estimates &
      4. Forecast, By Process, 2019-2030
      5. \r\n10.3.7.2. France Oil Shale Market Size:
    34. Market Estimates & Forecast, By Method, 2019-2030
      1. \r\n10.3.7.3. France
    35. Oil Shale Market Size: Market Estimates & Forecast, By Product, 2019-2030
      1. \r\n10.3.7.4.
    36. France Oil Shale Market Size: Market Estimates & Forecast, By End Users, 2019-2030
      1. \r\n10.3.8.
      2. UK
      3. \r\n10.3.8.1. UK Oil Shale Market Size: Market Estimates & Forecast,
      4. By Process, 2019-2030
      5. \r\n10.3.8.2. UK Oil Shale Market Size: Market Estimates
      6. & Forecast, By Method, 2019-2030
      7. \r\n10.3.8.3. UK Oil Shale Market Size:
    37. Market Estimates & Forecast, By Product, 2019-2030
      1. \r\n10.3.8.4. UK Oil
    38. Shale Market Size: Market Estimates & Forecast, By End Users, 2019-2030
      1. \r\n10.3.9.
      2. Italy
      3. \r\n10.3.9.1. Italy Oil Shale Market Size: Market Estimates & Forecast,
      4. By Process, 2019-2030
      5. \r\n10.3.9.2. Italy Oil Shale Market Size: Market Estimates
      6. & Forecast, By Method, 2019-2030
      7. \r\n10.3.9.3. Italy Oil Shale Market
    39. Size: Market Estimates & Forecast, By Product, 2019-2030
      1. \r\n10.3.9.4.
    40. Italy Oil Shale Market Size: Market Estimates & Forecast, By End Users, 2019-2030
      1. \r\n10.3.10.
      2. Spain
      3. \r\n10.3.10.1. Spain Oil Shale Market Size: Market Estimates & Forecast,
      4. By Process, 2019-2030
      5. \r\n10.3.10.2. Spain Oil Shale Market Size: Market Estimates
      6. & Forecast, By Method, 2019-2030
      7. \r\n10.3.10.3. Spain Oil Shale Market
    41. Size: Market Estimates & Forecast, By Product, 2019-2030
      1. \r\n10.3.10.4.
    42. Spain Oil Shale Market Size: Market Estimates & Forecast, By End Users, 2019-2030
      1. \r\n10.3.11.
      2. Rest of Europe
      3. \r\n10.3.11.1. Rest of Europe Oil Shale Market Size: Market
      4. Estimates & Forecast, By Process, 2019-2030
      5. \r\n10.3.11.2. Rest of Europe
    43. Oil Shale Market Size: Market Estimates & Forecast, By Method, 2019-2030
      1. \r\n10.3.11.3.
    44. Rest of Europe Oil Shale Market Size: Market Estimates & Forecast, By Product,
      1. \r\n10.3.11.4. Rest of Europe Oil Shale Market Size: Market Estimates
      2. & Forecast, By End Users, 2019-2030
      3. \r\n10.4. Asia-Pacific
      4. \r\n10.4.1.
    45. Asia-Pacific Oil Shale Market Size: Market Estimates & Forecast, By Country,
      1. \r\n10.4.2. Asia-Pacific Oil Shale Market Size: Market Estimates
      2. & Forecast, By Process, 2019-2030
      3. \r\n10.4.3. Asia-Pacific Oil Shale Market
    46. Size: Market Estimates & Forecast, By Method, 2019-2030
      1. \r\n10.4.4. Asia-Pacific
    47. Oil Shale Market Size: Market Estimates & Forecast, By Product, 2019-2030
      1. \r\n10.4.5.
    48. Asia-Pacific Oil Shale Market Size: Market Estimates & Forecast, By End Users,
      1. \r\n10.4.6. China
      2. \r\n10.4.6.1. China Oil Shale Market Size:
    49. Market Estimates & Forecast, By Process, 2019-2030
      1. \r\n10.4.6.2. China
    50. Oil Shale Market Size: Market Estimates & Forecast, By Method, 2019-2030
      1. \r\n10.4.6.3.
    51. China Oil Shale Market Size: Market Estimates & Forecast, By Product, 2019-2030
      1. \r\n10.4.6.4.
    52. China Oil Shale Market Size: Market Estimates & Forecast, By End Users, 2019-2030
      1. \r\n10.4.7.
      2. India
      3. \r\n10.4.7.1. India Oil Shale Market Size: Market Estimates & Forecast,
      4. By Process, 2019-2030
      5. \r\n10.4.7.2. India Oil Shale Market Size: Market Estimates
      6. & Forecast, By Method, 2019-2030
      7. \r\n10.4.7.3. India Oil Shale Market
    53. Size: Market Estimates & Forecast, By Product, 2019-2030
      1. \r\n10.4.7.4.
    54. India Oil Shale Market Size: Market Estimates & Forecast, By End Users, 2019-2030
      1. \r\n10.4.8.
      2. Japan
      3. \r\n10.4.8.1. Japan Oil Shale Market Size: Market Estimates & Forecast,
      4. By Process, 2019-2030
      5. \r\n10.4.8.2. Japan Oil Shale Market Size: Market Estimates
      6. & Forecast, By Method, 2019-2030
      7. \r\n10.4.8.3. Japan Oil Shale Market
    55. Size: Market Estimates & Forecast, By Product, 2019-2030
      1. \r\n10.4.8.4.
    56. Japan Oil Shale Market Size: Market Estimates & Forecast, By End Users, 2019-2030
      1. \r\n10.4.9.
      2. South Korea
      3. \r\n10.4.9.1. South Korea Oil Shale Market Size: Market Estimates
      4. & Forecast, By Process, 2019-2030
      5. \r\n10.4.9.2. South Korea Oil Shale
    57. Market Size: Market Estimates & Forecast, By Method, 2019-2030
      1. \r\n10.4.9.3.
    58. South Korea Oil Shale Market Size: Market Estimates & Forecast, By Product,
      1. \r\n10.4.9.4. South Korea Oil Shale Market Size: Market Estimates
      2. & Forecast, By End Users, 2019-2030
      3. \r\n10.4.10. Rest of Asia-Pacific
      4. \r\n10.4.10.1.
      5. Rest of Asia-Pacific Oil Shale Market Size: Market Estimates & Forecast, By
      6. Process, 2019-2030
      7. \r\n10.4.10.2. Rest of Asia-Pacific Oil Shale Market Size:
    59. Market Estimates & Forecast, By Method, 2019-2030
      1. \r\n10.4.10.3. Rest
    60. of Asia-Pacific Oil Shale Market Size: Market Estimates & Forecast, By Product,
      1. \r\n10.4.10.4. Rest of Asia-Pacific Oil Shale Market Size: Market
      2. Estimates & Forecast, By End Users, 2019-2030
      3. \r\n10.5. Latin America
      4. \r\n10.5.1.
      5. Latin America Automotive Glass Market Size: Market Estimates & Forecast, By
      6. Country, 2019-2030
      7. \r\n10.5.2. Latin America Oil Shale Market Size: Market
      8. Estimates & Forecast, By Process, 2019-2030
      9. \r\n10.5.3. Latin America
    61. Oil Shale Market Size: Market Estimates & Forecast, By Method, 2019-2030
      1. \r\n10.5.4.
    62. Latin America Oil Shale Market Size: Market Estimates & Forecast, By Product,
      1. \r\n10.5.5. Latin America Oil Shale Market Size: Market Estimates
      2. & Forecast, By End Users, 2019-2030
      3. \r\n10.5.6. Argentina
      4. \r\n10.5.6.1.
    63. Argentina Oil Shale Market Size: Market Estimates & Forecast, By Process, 2019-2030
      1. \r\n10.5.6.2.
    64. Argentina Oil Shale Market Size: Market Estimates & Forecast, By Method, 2019-2030
      1. \r\n10.5.6.3.
    65. Argentina Oil Shale Market Size: Market Estimates & Forecast, By Product, 2019-2030
      1. \r\n10.5.6.4.
    66. Argentina Oil Shale Market Size: Market Estimates & Forecast, By End Users,
      1. \r\n10.5.7. Brazil
      2. \r\n10.5.7.1. Brazil Oil Shale Market Size:
    67. Market Estimates & Forecast, By Process, 2019-2030
      1. \r\n10.5.7.2. Brazil
    68. Oil Shale Market Size: Market Estimates & Forecast, By Method, 2019-2030
      1. \r\n10.5.7.3.
    69. Brazil Oil Shale Market Size: Market Estimates & Forecast, By Product, 2019-2030
      1. \r\n10.5.7.4.
    70. Brazil Oil Shale Market Size: Market Estimates & Forecast, By End Users, 2019-2030
      1. \r\n10.5.8.
      2. Rest of Latin America
      3. \r\n10.5.8.1. Rest of Latin America Oil Shale Market
    71. Size: Market Estimates & Forecast, By Process, 2019-2030
      1. \r\n10.5.8.2.
      2. Rest of Latin America Oil Shale Market Size: Market Estimates & Forecast, By
      3. Method, 2019-2030
      4. \r\n10.5.8.3. Rest of Latin America Oil Shale Market Size:
    72. Market Estimates & Forecast, By Product, 2019-2030
      1. \r\n10.5.8.4. Rest
    73. of Latin America Oil Shale Market Size: Market Estimates & Forecast, By End
      1. Users, 2019-2030
      2. \r\n10.6. Middle East & Africa
      3. \r\n10.6.1. Middle
      4. East & Africa Automotive Glass Market Size: Market Estimates & Forecast,
      5. By Country, 2019-2030
      6. \r\n10.6.2. Middle East & Africa Oil Shale Market
    74. Size: Market Estimates & Forecast, By Process, 2019-2030
      1. \r\n10.6.3. Middle
    75. East & Africa Oil Shale Market Size: Market Estimates & Forecast, By Method,
      1. \r\n10.6.4. Middle East & Africa Oil Shale Market Size: Market
      2. Estimates & Forecast, By Product, 2019-2030
      3. \r\n10.6.5. Middle East &
    76. Africa Oil Shale Market Size: Market Estimates & Forecast, By End Users, 2019-2030
      1. \r\n10.6.6.
      2. South Africa
      3. \r\n10.6.6.1. South Africa Oil Shale Market Size: Market Estimates
      4. & Forecast, By Process, 2019-2030
      5. \r\n10.6.6.2. South Africa Oil Shale
    77. Market Size: Market Estimates & Forecast, By Method, 2019-2030
      1. \r\n10.6.6.3.
    78. South Africa Oil Shale Market Size: Market Estimates & Forecast, By Product,
      1. \r\n10.6.6.4. South Africa Oil Shale Market Size: Market Estimates
      2. & Forecast, By End Users, 2019-2030
      3. \r\n10.6.7. GCC Countries
      4. \r\n10.6.7.1.
    79. GCC Countries Oil Shale Market Size: Market Estimates & Forecast, By Process,
      1. \r\n10.6.7.2. GCC Countries Oil Shale Market Size: Market Estimates
      2. & Forecast, By Method, 2019-2030
      3. \r\n10.6.7.3. GCC Countries Oil Shale
    80. Market Size: Market Estimates & Forecast, By Product, 2019-2030
      1. \r\n10.6.7.4.
    81. GCC Countries Oil Shale Market Size: Market Estimates & Forecast, By End Users,
      1. \r\n10.6.8. Rest of Middle East & Africa
      2. \r\n10.6.8.1.
      3. Rest of Middle East & Africa Oil Shale Market Size: Market Estimates & Forecast,
      4. By Process, 2019-2030
      5. \r\n10.6.8.2. Rest of Middle East & Africa Oil Shale
    82. Market Size: Market Estimates & Forecast, By Method, 2019-2030
      1. \r\n10.6.8.3.
      2. Rest of Middle East & Africa Oil Shale Market Size: Market Estimates & Forecast,
      3. By Product, 2019-2030
      4. \r\n10.6.8.4. Rest of Middle East & Africa Oil Shale
    83. Market Size: Market Estimates & Forecast, By End Users, 2019-2030
      1. \r\nSECTION
      2. V: COMPETITIVE ANALYSIS
      3. \r\n11. COMPETITIVE LANDSCAPE
      4. \r\n11.1. Introduction
      5. \r\n11.2.
      6. Competition Dashboard
      7. \r\n11.3. Company Market Share Analysis, 2022 (%)
      8. \r\n11.4.
      9. Competitive Benchmarking
      10. \r\n11.5. The Leading Player in terms of Number of
      11. Developments in the Global Oil Shale Market
      12. \r\n11.6. List of Key Players,
      13. By Region
      14. \r\n11.7. Comparative Analysis: Key Players Financial
      15. \r\n11.8.
      16. Key Developments & Growth Strategies
      17. \r\n11.8.1. New Product Launch/Service
      18. Deployment
      19. \r\n11.8.2. Merger & Acquisition
      20. \r\n11.8.3. Joint Ventures
      21. \r\n12.
      22. COMPANY PROFILES
      23. \r\n12.1. American Shale Oil
      24. \r\n12.1.1. Company Overview
      25. \r\n12.1.2.
      26. Financial Overview
      27. \r\n12.1.3. Product Offered
      28. \r\n12.1.4. Key Developments
      29. \r\n12.1.5.
      30. SWOT Analysis
      31. \r\n12.1.6. Key Strategies
      32. \r\n12.2. Aura Source Inc.
      33. \r\n12.3.
      34. Blue Ensign Technologies Ltd
      35. \r\n12.4. Chevron Corporation
      36. \r\n12.5.
      37. Electro-Petroleum Inc.
      38. \r\n12.6. Exxon Mobil Corporation
      39. \r\n12.7. Occidental
      40. Petroleum Corporation
      41. \r\n12.8. Chesapeake
      42. \r\n12.9. MARATHON OIL COMPANY
      43. \r\n12.10.
      44. CotCabot Oil & Gas Corporation
      45. \r\n12.11. Halliburton Energy Services
      46. \r\n13.
      47. RECOMMENDATIONS & EXPERT INSIGHTS
      48. \r\n13.1. What is the short-term vs
      49. long-term outlook for Oil Shale Market?
      50. \r\n13.2. Who are the players to look
      51. out for?
      52. \r\n13.3. What will the product mix look in coming years?
      53. \r\n14.
      54. MRFR OFFERINGS & TEAM
      55. \r\n14.1. Citations & Media
      56. \r\n14.2.
      57. Our Regional Representatives
      58. \r\n14.3. Related Reports
      59. \r\n14.4. Our
      60. Domain Coverage
      61. \r\n 
      62. \r\nLIST OF TABLES
      63. \r\nTABLE 1. LIST
    84. OF ASSUMPTIONS
      1. \r\nTABLE 2. OIL SHALE MARKET ESTIMATES & FORECAST, BY
      2. PROCESS, 2019-2030 (USD MILLION)
      3. \r\nTABLE 3. OIL SHALE MARKET ESTIMATES &
      4. FORECAST, BY PROCESS, 2019-2030 (MILLION BARRELS)
      5. \r\nTABLE 4. OIL SHALE MARKET
      6. ESTIMATES & FORECAST, BY METHOD, 2019-2030 (USD MILLION)
      7. \r\nTABLE 5.
    85. OIL SHALE MARKET ESTIMATES & FORECAST, BY METHOD, 2019-2030 (MILLION BARRELS)
      1. \r\nTABLE
    86. OIL SHALE MARKET ESTIMATES & FORECAST, BY PRODUCT, 2019-2030 (USD MILLION)
      1. \r\nTABLE
    87. OIL SHALE MARKET ESTIMATES & FORECAST, BY PRODUCT, 2019-2030 (MILLION BARRELS)
      1. \r\nTABLE
    88. OIL SHALE MARKET ESTIMATES & FORECAST, BY END USERS, 2019-2030 (USD MILLION)
      1. \r\nTABLE
    89. OIL SHALE MARKET ESTIMATES & FORECAST, BY END USERS, 2019-2030 (MILLION BARRELS)
      1. \r\nTABLE
    90. GLOBAL OIL SHALE MARKET, BY REGION, 2019-2030 (USD MILLION)
      1. \r\nTABLE
    91. NORTH AMERICA: OIL SHALE MARKET, BY COUNTRY, 2019-2030 (USD MILLION)
      1. \r\nTABLE
    92. NORTH AMERICA: OIL SHALE MARKET, BY COUNTRY, 2019-2030 (MILLION BARRELS)
      1. \r\nTABLE
    93. NORTH AMERICA: OIL SHALE MARKET, BY PROCESS, 2019-2030 (USD MILLION)
      1. \r\nTABLE
    94. NORTH AMERICA: OIL SHALE MARKET, BY PROCESS, 2019-2030 (MILLION BARRELS)
      1. \r\nTABLE
    95. NORTH AMERICA: OIL SHALE MARKET, BY METHOD, 2019-2030 (USD MILLION)
      1. \r\nTABLE
    96. NORTH AMERICA: OIL SHALE MARKET, BY METHOD, 2019-2030 (MILLION BARRELS)
      1. \r\nTABLE
    97. NORTH AMERICA: OIL SHALE MARKET, BY PRODUCT, 2019-2030 (USD MILLION)
      1. \r\nTABLE
    98. NORTH AMERICA: OIL SHALE MARKET, BY PRODUCT, 2019-2030 (MILLION BARRELS)
      1. \r\nTABLE
    99. NORTH AMERICA: OIL SHALE MARKET, BY END USER, 2019-2030 (USD MILLION)
      1. \r\nTABLE
    100. NORTH AMERICA: OIL SHALE MARKET, BY END USER, 2019-2030 (MILLION BARRELS)
      1. \r\nTABLE
    101. US: OIL SHALE MARKET, BY PROCESS, 2019-2030 (USD MILLION)
      1. \r\nTABLE 22.
    102. US: OIL SHALE MARKET, BY PROCESS, 2019-2030 (MILLION BARRELS)
      1. \r\nTABLE 23.
    103. US: OIL SHALE MARKET, BY METHOD, 2019-2030 (USD MILLION)
      1. \r\nTABLE 24. US:
    104. OIL SHALE MARKET, BY METHOD, 2019-2030 (MILLION BARRELS)
      1. \r\nTABLE 25. US:
    105. OIL SHALE MARKET, BY PRODUCT, 2019-2030 (USD MILLION)
      1. \r\nTABLE 26. US: OIL
    106. SHALE MARKET, BY PRODUCT, 2019-2030 (MILLION BARRELS)
      1. \r\nTABLE 27. US: OIL
    107. SHALE MARKET, BY END USER, 2019-2030 (USD MILLION)
      1. \r\nTABLE 28. US: OIL SHALE
    108. MARKET, BY END USER, 2019-2030 (MILLION BARRELS)
      1. \r\nTABLE 29. CANADA: OIL
    109. SHALE MARKET, BY PROCESS, 2019-2030 (USD MILLION)
      1. \r\nTABLE 30. CANADA: OIL
    110. SHALE MARKET, BY PROCESS, 2019-2030 (MILLION BARRELS)
      1. \r\nTABLE 31. CANADA:
    111. OIL SHALE MARKET, BY METHOD, 2019-2030 (USD MILLION)
      1. \r\nTABLE 32. CANADA:
    112. OIL SHALE MARKET, BY METHOD, 2019-2030 (MILLION BARRELS)
      1. \r\nTABLE 33. CANADA:
    113. OIL SHALE MARKET, BY PRODUCT, 2019-2030 (USD MILLION)
      1. \r\nTABLE 34. CANADA:
    114. OIL SHALE MARKET, BY PRODUCT, 2019-2030 (MILLION BARRELS)
      1. \r\nTABLE 35. CANADA:
    115. OIL SHALE MARKET, BY END USER, 2019-2030 (USD MILLION)
      1. \r\nTABLE 36. CANADA:
    116. OIL SHALE MARKET, BY END USER, 2019-2030 (MILLION BARRELS)
      1. \r\nTABLE 37. MEXICO:
    117. OIL SHALE MARKET, BY PROCESS, 2019-2030 (USD MILLION)
      1. \r\nTABLE 38. MEXICO:
    118. OIL SHALE MARKET, BY PROCESS, 2019-2030 (MILLION BARRELS)
      1. \r\nTABLE 39. MEXICO:
    119. OIL SHALE MARKET, BY METHOD, 2019-2030 (USD MILLION)
      1. \r\nTABLE 40. MEXICO:
    120. OIL SHALE MARKET, BY METHOD, 2019-2030 (MILLION BARRELS)
      1. \r\nTABLE 41. MEXICO:
    121. OIL SHALE MARKET, BY PRODUCT, 2019-2030 (USD MILLION)
      1. \r\nTABLE 42. MEXICO:
    122. OIL SHALE MARKET, BY PRODUCT, 2019-2030 (MILLION BARRELS)
      1. \r\nTABLE 43. MEXICO:
    123. OIL SHALE MARKET, BY END USER, 2019-2030 (USD MILLION)
      1. \r\nTABLE 44. MEXICO:
    124. OIL SHALE MARKET, BY END USER, 2019-2030 (MILLION BARRELS)
      1. \r\nTABLE 45. EUROPE:
    125. OIL SHALE MARKET, BY COUNTRY, 2019-2030 (USD MILLION)
      1. \r\nTABLE 46. EUROPE:
    126. OIL SHALE MARKET, BY COUNTRY, 2019-2030 (MILLION BARRELS)
      1. \r\nTABLE 47. EUROPE:
    127. OIL SHALE MARKET, BY PROCESS, 2019-2030 (USD MILLION)
      1. \r\nTABLE 48. EUROPE:
    128. OIL SHALE MARKET, BY PROCESS, 2019-2030 (MILLION BARRELS)
      1. \r\nTABLE 49. EUROPE:
    129. OIL SHALE MARKET, BY METHOD, 2019-2030 (USD MILLION)
      1. \r\nTABLE 50. EUROPE:
    130. OIL SHALE MARKET, BY METHOD, 2019-2030 (MILLION BARRELS)
      1. \r\nTABLE 51. EUROPE:
    131. OIL SHALE MARKET, BY PRODUCT, 2019-2030 (USD MILLION)
      1. \r\nTABLE 52. EUROPE:
    132. OIL SHALE MARKET, BY PRODUCT, 2019-2030 (MILLION BARRELS)
      1. \r\nTABLE 53. EUROPE:
    133. OIL SHALE MARKET, BY END USER, 2019-2030 (USD MILLION)
      1. \r\nTABLE 54. EUROPE:
    134. OIL SHALE MARKET, BY END USER, 2019-2030 (MILLION BARRELS)
      1. \r\nTABLE 55. GERMANY:
    135. OIL SHALE MARKET, BY PROCESS, 2019-2030 (USD MILLION)
      1. \r\nTABLE 56. GERMANY:
    136. OIL SHALE MARKET, BY PROCESS, 2019-2030 (MILLION BARRELS)
      1. \r\nTABLE 57. GERMANY:
    137. OIL SHALE MARKET, BY METHOD, 2019-2030 (USD MILLION)
      1. \r\nTABLE 58. GERMANY:
    138. OIL SHALE MARKET, BY METHOD, 2019-2030 (MILLION BARRELS)
      1. \r\nTABLE 59. GERMANY:
    139. OIL SHALE MARKET, BY PRODUCT, 2019-2030 (USD MILLION)
      1. \r\nTABLE 60. GERMANY:
    140. OIL SHALE MARKET, BY PRODUCT, 2019-2030 (MILLION BARRELS)
      1. \r\nTABLE 61. GERMANY:
    141. OIL SHALE MARKET, BY END USER, 2019-2030 (USD MILLION)
      1. \r\nTABLE 62. GERMANY:
    142. OIL SHALE MARKET, BY END USER, 2019-2030 (MILLION BARRELS)
      1. \r\nTABLE 63. FRANCE:
    143. OIL SHALE MARKET, BY PROCESS, 2019-2030 (USD MILLION)
      1. \r\nTABLE 64. FRANCE:
    144. OIL SHALE MARKET, BY PROCESS, 2019-2030 (MILLION BARRELS)
      1. \r\nTABLE 65. FRANCE:
    145. OIL SHALE MARKET, BY METHOD, 2019-2030 (USD MILLION)
      1. \r\nTABLE 66. FRANCE:
    146. OIL SHALE MARKET, BY METHOD, 2019-2030 (MILLION BARRELS)
      1. \r\nTABLE 67. FRANCE:
    147. OIL SHALE MARKET, BY PRODUCT, 2019-2030 (USD MILLION)
      1. \r\nTABLE 68. FRANCE:
    148. OIL SHALE MARKET, BY PRODUCT, 2019-2030 (MILLION BARRELS)
      1. \r\nTABLE 69. FRANCE:
    149. OIL SHALE MARKET, BY END USER, 2019-2030 (USD MILLION)
      1. \r\nTABLE 70. FRANCE:
    150. OIL SHALE MARKET, BY END USER, 2019-2030 (MILLION BARRELS)
      1. \r\nTABLE 71. UK:
    151. OIL SHALE MARKET, BY PROCESS, 2019-2030 (USD MILLION)
      1. \r\nTABLE 72. UK: OIL
    152. SHALE MARKET, BY PROCESS, 2019-2030 (MILLION BARRELS)
      1. \r\nTABLE 73. UK: OIL
    153. SHALE MARKET, BY METHOD, 2019-2030 (USD MILLION)
      1. \r\nTABLE 74. UK: OIL SHALE
    154. MARKET, BY METHOD, 2019-2030 (MILLION BARRELS)
      1. \r\nTABLE 75. UK: OIL SHALE
    155. MARKET, BY PRODUCT, 2019-2030 (USD MILLION)
      1. \r\nTABLE 76. UK: OIL SHALE MARKET,
      2. BY PRODUCT, 2019-2030 (MILLION BARRELS)
      3. \r\nTABLE 77. UK: OIL SHALE MARKET,
      4. BY END USER, 2019-2030 (USD MILLION)
      5. \r\nTABLE 78. UK: OIL SHALE MARKET, BY
      6. END USER, 2019-2030 (MILLION BARRELS)
      7. \r\nTABLE 79. ITALY: OIL SHALE MARKET,
      8. BY PROCESS, 2019-2030 (USD MILLION)
      9. \r\nTABLE 80. ITALY: OIL SHALE MARKET,
      10. BY PROCESS, 2019-2030 (MILLION BARRELS)
      11. \r\nTABLE 81. ITALY: OIL SHALE MARKET,
      12. BY METHOD, 2019-2030 (USD MILLION)
      13. \r\nTABLE 82. ITALY: OIL SHALE MARKET,
      14. BY METHOD, 2019-2030 (MILLION BARRELS)
      15. \r\nTABLE 83. ITALY: OIL SHALE MARKET,
      16. BY PRODUCT, 2019-2030 (USD MILLION)
      17. \r\nTABLE 84. ITALY: OIL SHALE MARKET,
      18. BY PRODUCT, 2019-2030 (MILLION BARRELS)
      19. \r\nTABLE 85. ITALY: OIL SHALE MARKET,
      20. BY END USER, 2019-2030 (USD MILLION)
      21. \r\nTABLE 86. ITALY: OIL SHALE MARKET,
      22. BY END USER, 2019-2030 (MILLION BARRELS)
      23. \r\nTABLE 87. SPAIN: OIL SHALE MARKET,
      24. BY PROCESS, 2019-2030 (USD MILLION)
      25. \r\nTABLE 88. SPAIN: OIL SHALE MARKET,
      26. BY PROCESS, 2019-2030 (MILLION BARRELS)
      27. \r\nTABLE 89. SPAIN: OIL SHALE MARKET,
      28. BY METHOD, 2019-2030 (USD MILLION)
      29. \r\nTABLE 90. SPAIN: OIL SHALE MARKET,
      30. BY METHOD, 2019-2030 (MILLION BARRELS)
      31. \r\nTABLE 91. SPAIN: OIL SHALE MARKET,
      32. BY PRODUCT, 2019-2030 (USD MILLION)
      33. \r\nTABLE 92. SPAIN: OIL SHALE MARKET,
      34. BY PRODUCT, 2019-2030 (MILLION BARRELS)
      35. \r\nTABLE 93. SPAIN: OIL SHALE MARKET,
      36. BY END USER, 2019-2030 (USD MILLION)
      37. \r\nTABLE 94. SPAIN: OIL SHALE MARKET,
      38. BY END USER, 2019-2030 (MILLION BARRELS)
      39. \r\nTABLE 95. REST OF EUROPE: OIL
    156. SHALE MARKET, BY PROCESS, 2019-2030 (USD MILLION)
      1. \r\nTABLE 96. REST OF EUROPE:
    157. OIL SHALE MARKET, BY PROCESS, 2019-2030 (MILLION BARRELS)
      1. \r\nTABLE 97. REST
    158. OF EUROPE: OIL SHALE MARKET, BY METHOD, 2019-2030 (USD MILLION)
      1. \r\nTABLE
    159. REST OF EUROPE: OIL SHALE MARKET, BY METHOD, 2019-2030 (MILLION BARRELS)
      1. \r\nTABLE
    160. REST OF EUROPE: OIL SHALE MARKET, BY PRODUCT, 2019-2030 (USD MILLION)
      1. \r\nTABLE
    161. REST OF EUROPE: OIL SHALE MARKET, BY PRODUCT, 2019-2030 (MILLION BARRELS)
      1. \r\nTABLE
    162. REST OF EUROPE: OIL SHALE MARKET, BY END USER, 2019-2030 (USD MILLION)
      1. \r\nTABLE
    163. REST OF EUROPE: OIL SHALE MARKET, BY END USER, 2019-2030 (MILLION BARRELS)
      1. \r\nTABLE
    164. ASIA PACIFIC: OIL SHALE MARKET, BY COUNTRY, 2019-2030 (USD MILLION)
      1. \r\nTABLE
    165. ASIA PACIFIC: OIL SHALE MARKET, BY COUNTRY, 2019-2030 (MILLION BARRELS)
      1. \r\nTABLE
    166. ASIA PACIFIC: OIL SHALE MARKET, BY PROCESS, 2019-2030 (USD MILLION)
      1. \r\nTABLE
    167. ASIA PACIFIC: OIL SHALE MARKET, BY PROCESS, 2019-2030 (MILLION BARRELS)
      1. \r\nTABLE
    168. ASIA PACIFIC: OIL SHALE MARKET, BY METHOD, 2019-2030 (USD MILLION)
      1. \r\nTABLE
    169. ASIA PACIFIC: OIL SHALE MARKET, BY METHOD, 2019-2030 (MILLION BARRELS)
      1. \r\nTABLE
    170. ASIA PACIFIC: OIL SHALE MARKET, BY PRODUCT, 2019-2030 (USD MILLION)
      1. \r\nTABLE
    171. ASIA PACIFIC: OIL SHALE MARKET, BY PRODUCT, 2019-2030 (MILLION BARRELS)
      1. \r\nTABLE
    172. ASIA PACIFIC: OIL SHALE MARKET, BY END USER, 2019-2030 (USD MILLION)
      1. \r\nTABLE
    173. ASIA PACIFIC: OIL SHALE MARKET, BY END USER, 2019-2030 (MILLION BARRELS)
      1. \r\nTABLE
    174. CHINA: OIL SHALE MARKET, BY PROCESS, 2019-2030 (USD MILLION)
      1. \r\nTABLE
    175. CHINA: OIL SHALE MARKET, BY PROCESS, 2019-2030 (MILLION BARRELS)
      1. \r\nTABLE
    176. CHINA: OIL SHALE MARKET, BY METHOD, 2019-2030 (USD MILLION)
      1. \r\nTABLE
    177. CHINA: OIL SHALE MARKET, BY METHOD, 2019-2030 (MILLION BARRELS)
      1. \r\nTABLE
    178. CHINA: OIL SHALE MARKET, BY PRODUCT, 2019-2030 (USD MILLION)
      1. \r\nTABLE
    179. CHINA: OIL SHALE MARKET, BY PRODUCT, 2019-2030 (MILLION BARRELS)
      1. \r\nTABLE
    180. CHINA: OIL SHALE MARKET, BY END USER, 2019-2030 (USD MILLION)
      1. \r\nTABLE
    181. CHINA: OIL SHALE MARKET, BY END USER, 2019-2030 (MILLION BARRELS)
      1. \r\nTABLE
    182. JAPAN: OIL SHALE MARKET, BY PROCESS, 2019-2030 (USD MILLION)
      1. \r\nTABLE
    183. JAPAN: OIL SHALE MARKET, BY PROCESS, 2019-2030 (MILLION BARRELS)
      1. \r\nTABLE
    184. JAPAN: OIL SHALE MARKET, BY METHOD, 2019-2030 (USD MILLION)
      1. \r\nTABLE
    185. JAPAN: OIL SHALE MARKET, BY METHOD, 2019-2030 (MILLION BARRELS)
      1. \r\nTABLE
    186. JAPAN: OIL SHALE MARKET, BY PRODUCT, 2019-2030 (USD MILLION)
      1. \r\nTABLE
    187. JAPAN: OIL SHALE MARKET, BY PRODUCT, 2019-2030 (MILLION BARRELS)
      1. \r\nTABLE
    188. JAPAN: OIL SHALE MARKET, BY END USER, 2019-2030 (USD MILLION)
      1. \r\nTABLE
    189. JAPAN: OIL SHALE MARKET, BY END USER, 2019-2030 (MILLION BARRELS)
      1. \r\nTABLE
    190. INDIA: OIL SHALE MARKET, BY PROCESS, 2019-2030 (USD MILLION)
      1. \r\nTABLE
    191. INDIA: OIL SHALE MARKET, BY PROCESS, 2019-2030 (MILLION BARRELS)
      1. \r\nTABLE
    192. INDIA: OIL SHALE MARKET, BY METHOD, 2019-2030 (USD MILLION)
      1. \r\nTABLE
    193. INDIA: OIL SHALE MARKET, BY METHOD, 2019-2030 (MILLION BARRELS)
      1. \r\nTABLE
    194. INDIA: OIL SHALE MARKET, BY PRODUCT, 2019-2030 (USD MILLION)
      1. \r\nTABLE
    195. INDIA: OIL SHALE MARKET, BY PRODUCT, 2019-2030 (MILLION BARRELS)
      1. \r\nTABLE
    196. INDIA: OIL SHALE MARKET, BY END USER, 2019-2030 (USD MILLION)
      1. \r\nTABLE
    197. INDIA: OIL SHALE MARKET, BY END USER, 2019-2030 (MILLION BARRELS)
      1. \r\nTABLE
    198. SOUTH KOREA: OIL SHALE MARKET, BY PROCESS, 2019-2030 (USD MILLION)
      1. \r\nTABLE
    199. SOUTH KOREA: OIL SHALE MARKET, BY PROCESS, 2019-2030 (MILLION BARRELS)
      1. \r\nTABLE
    200. SOUTH KOREA: OIL SHALE MARKET, BY METHOD, 2019-2030 (USD MILLION)
      1. \r\nTABLE
    201. SOUTH KOREA: OIL SHALE MARKET, BY METHOD, 2019-2030 (MILLION BARRELS)
      1. \r\nTABLE
    202. SOUTH KOREA: OIL SHALE MARKET, BY PRODUCT, 2019-2030 (USD MILLION)
      1. \r\nTABLE
    203. SOUTH KOREA: OIL SHALE MARKET, BY PRODUCT, 2019-2030 (MILLION BARRELS)
      1. \r\nTABLE
    204. SOUTH KOREA: OIL SHALE MARKET, BY END USER, 2019-2030 (USD MILLION)
      1. \r\nTABLE
    205. SOUTH KOREA: OIL SHALE MARKET, BY END USER, 2019-2030 (MILLION BARRELS)
      1. \r\nTABLE
    206. REST OF ASIA PACIFIC: OIL SHALE MARKET, BY PROCESS, 2019-2030 (USD MILLION)
      1. \r\nTABLE
    207. REST OF ASIA PACIFIC: OIL SHALE MARKET, BY PROCESS, 2019-2030 (MILLION BARRELS)
      1. \r\nTABLE
    208. REST OF ASIA PACIFIC: OIL SHALE MARKET, BY METHOD, 2019-2030 (USD MILLION)
      1. \r\nTABLE
    209. REST OF ASIA PACIFIC: OIL SHALE MARKET, BY METHOD, 2019-2030 (MILLION BARRELS)
      1. \r\nTABLE
    210. REST OF ASIA PACIFIC: OIL SHALE MARKET, BY PRODUCT, 2019-2030 (USD MILLION)
      1. \r\nTABLE
    211. REST OF ASIA PACIFIC: OIL SHALE MARKET, BY PRODUCT, 2019-2030 (MILLION BARRELS)
      1. \r\nTABLE
    212. REST OF ASIA PACIFIC: OIL SHALE MARKET, BY END USER, 2019-2030 (USD MILLION)
      1. \r\nTABLE
    213. REST OF ASIA PACIFIC: OIL SHALE MARKET, BY END USER, 2019-2030 (MILLION BARRELS)
      1. \r\nTABLE
    214. LATIN AMERICA: OIL SHALE MARKET, BY COUNTRY, 2019-2030 (USD MILLION)
      1. \r\nTABLE
    215. LATIN AMERICA: OIL SHALE MARKET, BY COUNTRY, 2019-2030 (MILLION BARRELS)
      1. \r\nTABLE
    216. LATIN AMERICA: OIL SHALE MARKET, BY PROCESS, 2019-2030 (USD MILLION)
      1. \r\nTABLE
    217. LATIN AMERICA: OIL SHALE MARKET, BY PROCESS, 2019-2030 (MILLION BARRELS)
      1. \r\nTABLE
    218. LATIN AMERICA: OIL SHALE MARKET, BY METHOD, 2019-2030 (USD MILLION)
      1. \r\nTABLE
    219. LATIN AMERICA: OIL SHALE MARKET, BY METHOD, 2019-2030 (MILLION BARRELS)
      1. \r\nTABLE
    220. LATIN AMERICA: OIL SHALE MARKET, BY PRODUCT, 2019-2030 (USD MILLION)
      1. \r\nTABLE
    221. LATIN AMERICA: OIL SHALE MARKET, BY PRODUCT, 2019-2030 (MILLION BARRELS)
      1. \r\nTABLE
    222. LATIN AMERICA: OIL SHALE MARKET, BY END USER, 2019-2030 (USD MILLION)
      1. \r\nTABLE
    223. LATIN AMERICA: OIL SHALE MARKET, BY END USER, 2019-2030 (MILLION BARRELS)
      1. \r\nTABLE
    224. ARGENTINA: OIL SHALE MARKET, BY PROCESS, 2019-2030 (USD MILLION)
      1. \r\nTABLE
    225. ARGENTINA: OIL SHALE MARKET, BY PROCESS, 2019-2030 (MILLION BARRELS)
      1. \r\nTABLE
    226. ARGENTINA: OIL SHALE MARKET, BY METHOD, 2019-2030 (USD MILLION)
      1. \r\nTABLE
    227. ARGENTINA: OIL SHALE MARKET, BY METHOD, 2019-2030 (MILLION BARRELS)
      1. \r\nTABLE
    228. ARGENTINA: OIL SHALE MARKET, BY PRODUCT, 2019-2030 (USD MILLION)
      1. \r\nTABLE
    229. ARGENTINA: OIL SHALE MARKET, BY PRODUCT, 2019-2030 (MILLION BARRELS)
      1. \r\nTABLE
    230. ARGENTINA: OIL SHALE MARKET, BY END USER, 2019-2030 (USD MILLION)
      1. \r\nTABLE
    231. ARGENTINA: OIL SHALE MARKET, BY END USER, 2019-2030 (MILLION BARRELS)
      1. \r\nTABLE
    232. BRAZIL: OIL SHALE MARKET, BY PROCESS, 2019-2030 (USD MILLION)
      1. \r\nTABLE
    233. BRAZIL: OIL SHALE MARKET, BY PROCESS, 2019-2030 (MILLION BARRELS)
      1. \r\nTABLE
    234. BRAZIL: OIL SHALE MARKET, BY METHOD, 2019-2030 (USD MILLION)
      1. \r\nTABLE
    235. BRAZIL: OIL SHALE MARKET, BY METHOD, 2019-2030 (MILLION BARRELS)
      1. \r\nTABLE
    236. BRAZIL: OIL SHALE MARKET, BY PRODUCT, 2019-2030 (USD MILLION)
      1. \r\nTABLE
    237. BRAZIL: OIL SHALE MARKET, BY PRODUCT, 2019-2030 (MILLION BARRELS)
      1. \r\nTABLE
    238. BRAZIL: OIL SHALE MARKET, BY END USER, 2019-2030 (USD MILLION)
      1. \r\nTABLE
    239. BRAZIL: OIL SHALE MARKET, BY END USER, 2019-2030 (MILLION BARRELS)
      1. \r\nTABLE
    240. REST OF LATIN AMERICA: OIL SHALE MARKET, BY PROCESS, 2019-2030 (USD MILLION)
      1. \r\nTABLE
    241. REST OF LATIN AMERICA: OIL SHALE MARKET, BY PROCESS, 2019-2030 (MILLION BARRELS)
      1. \r\nTABLE
    242. REST OF LATIN AMERICA: OIL SHALE MARKET, BY METHOD, 2019-2030 (USD MILLION)
      1. \r\nTABLE
    243. REST OF LATIN AMERICA: OIL SHALE MARKET, BY METHOD, 2019-2030 (MILLION BARRELS)
      1. \r\nTABLE
    244. REST OF LATIN AMERICA: OIL SHALE MARKET, BY PRODUCT, 2019-2030 (USD MILLION)
      1. \r\nTABLE
    245. REST OF LATIN AMERICA: OIL SHALE MARKET, BY PRODUCT, 2019-2030 (MILLION BARRELS)
      1. \r\nTABLE
    246. REST OF LATIN AMERICA: OIL SHALE MARKET, BY END USER, 2019-2030 (USD MILLION)
      1. \r\nTABLE
    247. REST OF LATIN AMERICA: OIL SHALE MARKET, BY END USER, 2019-2030 (MILLION BARRELS)
      1. \r\nTABLE
    248. MIDDLE EAST & AFRICA: OIL SHALE MARKET, BY COUNTRY, 2019-2030 (USD MILLION)
      1. \r\nTABLE
    249. MIDDLE EAST & AFRICA: OIL SHALE MARKET, BY COUNTRY, 2019-2030 (MILLION
      1. BARRELS)
    250. \r\nTABLE 189. MIDDLE EAST & AFRICA: OIL SHALE MARKET, BY PROCESS,
      1. \r\nTABLE 190. MIDDLE EAST & AFRICA: OIL SHALE
    251. MARKET, BY PROCESS, 2019-2030 (MILLION BARRELS)
      1. \r\nTABLE 191. MIDDLE EAST
    252. & AFRICA: OIL SHALE MARKET, BY METHOD, 2019-2030 (USD MILLION)
      1. \r\nTABLE
    253. MIDDLE EAST & AFRICA: OIL SHALE MARKET, BY METHOD, 2019-2030 (MILLION BARRELS)
      1. \r\nTABLE
    254. MIDDLE EAST & AFRICA: OIL SHALE MARKET, BY PRODUCT, 2019-2030 (USD MILLION)
      1. \r\nTABLE
    255. MIDDLE EAST & AFRICA: OIL SHALE MARKET, BY PRODUCT, 2019-2030 (MILLION
      1. BARRELS)
    256. \r\nTABLE 195. MIDDLE EAST & AFRICA: OIL SHALE MARKET, BY END
      1. USER, 2019-2030 (USD MILLION)
      2. \r\nTABLE 196. MIDDLE EAST & AFRICA: OIL
    257. SHALE MARKET, BY END USER, 2019-2030 (MILLION BARRELS)
      1. \r\nTABLE 197. SOUTH
    258. AFRICA: OIL SHALE MARKET, BY PROCESS, 2019-2030 (USD MILLION)
      1. \r\nTABLE 198.
    259. SOUTH AFRICA: OIL SHALE MARKET, BY PROCESS, 2019-2030 (MILLION BARRELS)
      1. \r\nTABLE
    260. SOUTH AFRICA: OIL SHALE MARKET, BY METHOD, 2019-2030 (USD MILLION)
      1. \r\nTABLE
    261. SOUTH AFRICA: OIL SHALE MARKET, BY METHOD, 2019-2030 (MILLION BARRELS)
      1. \r\nTABLE
    262. SOUTH AFRICA: OIL SHALE MARKET, BY PRODUCT, 2019-2030 (USD MILLION)
      1. \r\nTABLE
    263. SOUTH AFRICA: OIL SHALE MARKET, BY PRODUCT, 2019-2030 (MILLION BARRELS)
      1. \r\nTABLE
    264. SOUTH AFRICA: OIL SHALE MARKET, BY END USER, 2019-2030 (USD MILLION)
      1. \r\nTABLE
    265. SOUTH AFRICA: OIL SHALE MARKET, BY END USER, 2019-2030 (MILLION BARRELS)
      1. \r\nTABLE
    266. GCC COUNTRIES: OIL SHALE MARKET, BY PROCESS, 2019-2030 (USD MILLION)
      1. \r\nTABLE
    267. GCC COUNTRIES: OIL SHALE MARKET, BY PROCESS, 2019-2030 (MILLION BARRELS)
      1. \r\nTABLE
    268. GCC COUNTRIES: OIL SHALE MARKET, BY METHOD, 2019-2030 (USD MILLION)
      1. \r\nTABLE
    269. GCC COUNTRIES: OIL SHALE MARKET, BY METHOD, 2019-2030 (MILLION BARRELS)
      1. \r\nTABLE
    270. GCC COUNTRIES: OIL SHALE MARKET, BY PRODUCT, 2019-2030 (USD MILLION)
      1. \r\nTABLE
    271. GCC COUNTRIES: OIL SHALE MARKET, BY PRODUCT, 2019-2030 (MILLION BARRELS)
      1. \r\nTABLE
    272. GCC COUNTRIES: OIL SHALE MARKET, BY END USER, 2019-2030 (USD MILLION)
      1. \r\nTABLE
    273. GCC COUNTRIES: OIL SHALE MARKET, BY END USER, 2019-2030 (MILLION BARRELS)
      1. \r\nTABLE
    274. REST OF MIDDLE EAST & AFRICA: OIL SHALE MARKET, BY PROCESS, 2019-2030 (USD
      1. MILLION)
      2. \r\nTABLE 214. REST OF MIDDLE EAST & AFRICA: OIL SHALE MARKET,
      3. BY PROCESS, 2019-2030 (MILLION BARRELS)
      4. \r\nTABLE 215. REST OF MIDDLE EAST
    275. & AFRICA: OIL SHALE MARKET, BY METHOD, 2019-2030 (USD MILLION)
      1. \r\nTABLE
    276. REST OF MIDDLE EAST & AFRICA: OIL SHALE MARKET, BY METHOD, 2019-2030 (MILLION
      1. BARRELS)
      2. \r\nTABLE 217. REST OF MIDDLE EAST & AFRICA: OIL SHALE MARKET,
      3. BY PRODUCT, 2019-2030 (USD MILLION)
      4. \r\nTABLE 218. REST OF MIDDLE EAST &
    277. AFRICA: OIL SHALE MARKET, BY PRODUCT, 2019-2030 (MILLION BARRELS)
      1. \r\nTABLE
    278. REST OF MIDDLE EAST & AFRICA: OIL SHALE MARKET, BY END USER, 2019-2030
      1. (USD MILLION)
      2. \r\nTABLE 220. REST OF MIDDLE EAST & AFRICA: OIL SHALE MARKET,
      3. BY END USER, 2019-2030 (MILLION BARRELS)
      4. \r\n 
      5. \r\nLIST OF FIGURES
      6. \r\nFIGURE
    279. MARKET SYNOPSIS
      1. \r\nFIGURE 2. MARKET ATTRACTIVENESS ANALYSIS: GLOBAL OIL
    280. SHALE MARKET
      1. \r\nFIGURE 3. GLOBAL OIL SHALE MARKET ANALYSIS BY PROCESS
      2. \r\nFIGURE
    281. GLOBAL OIL SHALE MARKET ANALYSIS BY METHOD
      1. \r\nFIGURE 5. GLOBAL OIL SHALE
      2. MARKET ANALYSIS BY PRODCT
      3. \r\nFIGURE 6. GLOBAL OIL SHALE MARKET ANALYSIS BY
      4. END USER
      5. \r\nFIGURE 7. GLOBAL OIL SHALE MARKET ANALYSIS BY REGION
      6. \r\nFIGURE
    282. GLOBAL OIL SHALE MARKET: MARKET STRUCTURE
      1. \r\nFIGURE 9. KEY BUYING CRITERIA
      2. OF OIL SHALE RESEARCH PROCESS OF MRFR
      3. \r\nFIGURE 10. NORTH AMERICA MARKET
      4. SIZE & MARKET SHARE BY COUNTRY (2023 VS 2030)
      5. \r\nFIGURE 11. EUROPE MARKET
      6. SIZE & MARKET SHARE BY COUNTRY (2023 VS 2030)
      7. \r\nFIGURE 12. ASIA-PACIFIC
      8. & MARKET SHARE BY COUNTRY (2023 VS 2030)
      9. \r\nFIGURE 13. MIDDLE EAST &
      10. AFRICA MARKET SIZE & MARKET SHARE BY COUNTRY (2023 VS 2030)
      11. \r\nFIGURE
    283. LATIN AMERICA MARKET SIZE & MARKET SHARE BY COUNTRY (2023 VS 2030)
      1. \r\nFIGURE
    284. DROC ANALYSIS OF GLOBAL OIL SHALE MARKET
      1. \r\nFIGURE 16. DRIVERS IMPACT
      2. ANALYSIS: OIL SHALE MARKET
      3. \r\nFIGURE 17. RESTRAINTS IMPACT ANALYSIS: OIL
    285. SHALE MARKET
      1. \r\nFIGURE 18. SUPPLY / VALUE CHAIN: GLOBAL OIL SHALE MARKET
      2. \r\nFIGURE
    286. GLOBAL OIL SHALE MARKET, BY END USE, 2022 (% SHARE)
      1. \r\nFIGURE 20. GLOBAL
    287. OIL SHALE MARKET, BY END USE, 2023 TO 2030 (USD MILLION)

    Oil Shale Market Segmentation

    Market Segmentation Overview

    • Detailed segmentation data will be available in the full report
    • Comprehensive analysis by multiple parameters
    • Regional and country-level breakdowns
    • Market size forecasts by segment
    Infographic

    Free Sample Request

    Kindly complete the form below to receive a free sample of this Report

    Get Free Sample

    Customer Strories

    “I am very pleased with how market segments have been defined in a relevant way for my purposes (such as "Portable Freezers & refrigerators" and "last-mile"). In general the report is well structured. Thanks very much for your efforts.”

    Victoria Milne

    Founder
    Case Study
    Chemicals and Materials

    Compare Licence

    ×
    Features License Type
    Single User Multiuser License Enterprise User
    Price $4,950 $5,950 $7,250
    Maximum User Access Limit 1 User Upto 10 Users Unrestricted Access Throughout the Organization
    Free Customization
    Direct Access to Analyst
    Deliverable Format
    Platform Access
    Discount on Next Purchase 10% 15% 15%
    Printable Versions