• Cat-intel
  • MedIntelliX
  • Resources
  • About Us
  • Hero Background
    English
    Chinese
    French
    Japanese
    Korean
    German
    Spanish

    Oil Gas Projects Market Trends

    ID: MRFR/E&P/14634-HCR
    128 Pages
    Garvit Vyas
    October 2025

    Oil and Gas Projects Market Research Report Information By Type (Surface and Lease Equipment, Gathering & Processing, Oil, Gas & NGL Pipelines, Oil & Gas Storage, Refining & Oil Products Transport and Export Terminals), By Drilling (Offshore and Onshore) And By Region (North America, Europe, Asia-Pacific, And Rest Of The World) –Market Forecast Till 2035

    Share:
    Download PDF ×

    We do not share your information with anyone. However, we may send you emails based on your report interest from time to time. You may contact us at any time to opt-out.

    Oil Gas Projects Market Infographic
    $ 4,950.0
    $ 5,950.0
    $ 7,250.0

    Market Trends

    Key Emerging Trends in the Oil Gas Projects Market

    In the dynamic landscape of the oil and gas projects market, effective market share positioning strategies play a pivotal role in determining the success and sustainability of companies. One common approach is differentiation, where companies strive to distinguish their offerings from competitors. This could involve technological advancements, proprietary processes, or superior project management capabilities. By highlighting unique features, companies aim to attract a niche market or appeal to clients seeking specialized solutions.

    Another strategy revolves around cost leadership, where companies focus on becoming the low-cost producers in the market. This involves optimizing operational efficiency, streamlining supply chains, and implementing cost-effective technologies. By offering competitive pricing, companies can capture a larger market share and gain a strategic advantage over rivals. However, it's crucial to balance cost-cutting measures to ensure that quality and safety standards are not compromised.

    Collaboration and partnerships also play a significant role in market share positioning within the oil and gas projects sector. Companies often form alliances with other organizations, leveraging complementary strengths to enhance their overall value proposition. Strategic partnerships can provide access to new markets, resources, and technologies, allowing companies to expand their reach and competitiveness. Joint ventures and collaborations are particularly prevalent in large-scale projects where the expertise of multiple entities is required for success.

    Innovation is a key driver for companies aiming to secure a prominent market share. Embracing cutting-edge technologies, sustainable practices, and green initiatives not only aligns with evolving industry trends but also attracts environmentally conscious clients. Companies that position themselves as leaders in innovation often enjoy a first-mover advantage, gaining credibility and trust in the market. This can be achieved through continuous research and development efforts, as well as a commitment to staying ahead of industry disruptions.

    Geographical positioning is another crucial aspect of market share strategies in the oil and gas projects market. Companies strategically select regions based on factors such as resource availability, geopolitical stability, and market demand. By establishing a strong presence in key global hubs, companies can enhance their accessibility to clients and streamline project execution. Additionally, being close to major oil and gas reserves can minimize logistical challenges, reducing costs and project timelines.

    Adaptability is essential in a market characterized by fluctuating demand, geopolitical uncertainties, and evolving regulatory landscapes. Companies that can swiftly adjust their strategies in response to changing market conditions are better positioned to capture opportunities and mitigate risks. This may involve diversifying service offerings, entering new markets, or pivoting towards emerging trends such as renewable energy integration.

    In conclusion, successful market share positioning in the oil and gas projects market requires a multifaceted approach. Companies must carefully consider differentiation, cost leadership, collaboration, innovation, geographical positioning, and adaptability to craft a robust strategy. By understanding and navigating these dynamics effectively, organizations can carve out a sustainable and competitive niche in a challenging and ever-evolving industry.

    Market Summary

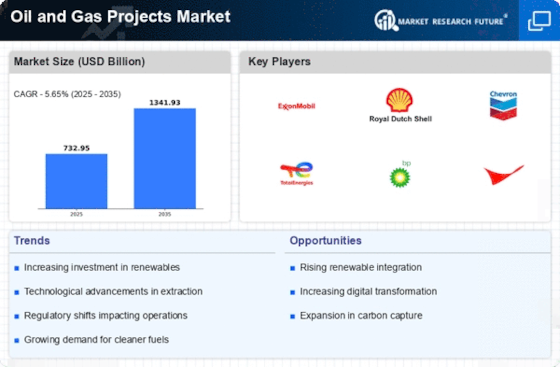
    As per Market Research Future Analysis, the Oil and Gas Projects Market was valued at 732.95 USD Billion in 2024 and is projected to grow to 1341.93 USD Billion by 2035, reflecting a CAGR of 5.65% from 2025 to 2035. The market growth is driven by increased global energy demand and technological innovations. Key sectors such as transportation and industrialization heavily rely on oil and gas, with the transportation sector depending on oil-derived products and natural gas serving as a cleaner alternative. The power generation sector continues to consume significant oil and gas resources, despite a growing focus on renewable energy. Investment in exploration and production projects is essential to meet the escalating energy needs, particularly in emerging economies.

    Key Market Trends & Highlights

    The Oil and Gas Projects Market is experiencing significant growth driven by various factors.

    • Market Size in 2024: 732.95 USD Billion; Expected to reach 1341.93 USD Billion by 2035. CAGR from 2025 to 2035: 5.65%; driven by rising global energy demand. North America dominates the market due to abundant shale resources and technological advancements. Offshore drilling is the leading segment due to access to vast untapped resources.

    Market Size & Forecast

    2024 Market Size USD 732.95 Billion
    2035 Market Size USD 1341.93 Billion
    CAGR (2025-2035) 5.65%
    Largest Regional Market Share in 2024 North America.

    Major Players

    <p>Key players include Exxon Mobil Corporation, Chevron Corporation, Schlumberger Limited, Kinder Morgan, and Halliburton.</p>

    Market Trends

    Growing global demand for the energy is driving the market growth

    Market CAGR for oil and gas projects is being driven by the surging global demand for energy. The population, along with surging industrialization and urbanization, and the need for energy, mainly in the form of oil and gas, remain insatiable. This unrelenting need stems from diverse firms like manufacturing, transportation, and power generation, establishing oil and gas as crucial components in the global energy landscape.

    With the proliferation of automobiles in developing markets and the proliferation of global trade, the demand for oil in transportation remains robust. Additionally, natural gas plays an important role in the transportation sector as a cleaner alternative for vehicles and as a feedstock for the production of liquefied natural gas (LNG) used in marine transport. The industrial demand for energy, especially in emerging economies undergoing rapid industrialization, continues to boost investment in oil and gas projects to meet these escalating needs.

    <p>The global oil and gas projects market is poised for a transformative shift as nations increasingly prioritize energy security and sustainability, indicating a potential reconfiguration of investment strategies and project execution.</p>

    U.S. Energy Information Administration (EIA)

    Oil Gas Projects Market Market Drivers

    Geopolitical Factors

    Geopolitical dynamics play a crucial role in shaping the Global Oil and Gas Projects Market Industry. Political stability in oil-rich regions is essential for maintaining consistent production levels. Recent tensions in various regions have led to fluctuations in oil prices, prompting countries to reassess their energy strategies. Nations are increasingly focusing on energy independence, which may lead to a diversification of supply sources. This shift could result in new investment opportunities in less politically stable areas, thereby influencing the overall market landscape. The interplay of these factors suggests a complex environment for future oil and gas projects.

    Market Growth Projections

    The Global Oil and Gas Projects Market Industry is poised for substantial growth, with projections indicating a market value of 1341.9 USD Billion by 2035. This anticipated growth is underpinned by various factors, including rising energy demand, technological advancements, and increased investment in infrastructure. The market is expected to experience a compound annual growth rate (CAGR) of 5.65% from 2025 to 2035, reflecting a robust outlook for the industry. These projections suggest that stakeholders should prepare for a dynamic and evolving market landscape, characterized by both challenges and opportunities.

    Technological Advancements

    Innovations in technology are reshaping the Global Oil and Gas Projects Market Industry, enhancing efficiency and reducing costs. Advanced drilling techniques, such as hydraulic fracturing and horizontal drilling, have unlocked previously inaccessible reserves, leading to increased production levels. Moreover, digital technologies, including artificial intelligence and data analytics, are optimizing operations and improving decision-making processes. These advancements not only contribute to higher output but also promote sustainability within the industry. As companies adopt these technologies, they are likely to experience improved profitability, which could further stimulate investment in new projects.

    Rising Global Energy Demand

    The Global Oil and Gas Projects Market Industry is experiencing a surge in demand driven by increasing energy needs across various sectors. As populations grow and economies expand, the demand for energy is projected to rise significantly. In 2024, the market is valued at approximately 733.0 USD Billion, reflecting the urgent need for new oil and gas projects to meet this demand. Countries are investing heavily in exploration and production to secure energy supplies, which is likely to propel the industry forward. This trend indicates a robust growth trajectory, with the market expected to reach 1341.9 USD Billion by 2035.

    Investment in Infrastructure Development

    Infrastructure development is a pivotal driver of the Global Oil and Gas Projects Market Industry. The need for robust transportation and processing facilities is paramount to ensure efficient supply chains. Investments in pipelines, refineries, and storage facilities are crucial for accommodating the anticipated growth in production levels. As the market is projected to grow at a CAGR of 5.65% from 2025 to 2035, infrastructure investments will likely increase to support this expansion. Governments and private entities are collaborating to enhance infrastructure, thereby facilitating smoother operations and improving overall market dynamics.

    Environmental Regulations and Sustainability Initiatives

    The Global Oil and Gas Projects Market Industry is increasingly influenced by stringent environmental regulations and a growing emphasis on sustainability. Governments worldwide are implementing policies aimed at reducing carbon emissions and promoting cleaner energy sources. This regulatory landscape compels oil and gas companies to invest in cleaner technologies and practices. As a result, firms are exploring renewable energy options and carbon capture technologies to align with global sustainability goals. While this transition may pose challenges, it also presents opportunities for innovation and growth within the industry, potentially reshaping project development strategies.

    Market Segment Insights

    Oil and Gas Projects Type Insights

    <p>The Oil and Gas Projects Market segmentation, based on type, includes Surface and Lease Equipment, Gathering and processing, Oil and gas, NGL Pipelines, <a href="https://www.marketresearchfuture.com/reports/oil-and-gas-storage-market-3935">Oil and gas Storage</a>, Refining and oil Products, Transport, and Export Terminals. The oil, gas &amp; pipelines segment dominated the market, accounting for the largest market revenue because of their critical role in the extraction, transportation, and distribution of hydrocarbons.&nbsp;</p>

    <p>The growing investments and intricate infrastructure needed for these projects position the oil, gas, and pipeline sector as a dominant force in shaping the overall landscape of the Oil and Gas Projects market. The exploration and the generation of oil and gas reserves involve deep drilling and extraction operations, making these projects integral to the industry. Additionally, the construction and maintenance of pipelines are important for efficiently transporting oil and gas over large distances that connect production sites with processing facilities and end-users.</p>

    Oil and Gas Projects Drilling Insights

    <p>The Oil and Gas Projects Market segmentation, based on drilling, includes Offshore and Onshore. The offshore category dominates the market due to the significant reserves located beneath the ocean floor, providing vast untapped resources for exploration and extraction.&nbsp;</p>

    <p>The development of advanced drilling technologies and the capability to reach deeper and more remote offshore locations have made it economically viable to pursue offshore projects. Moreover, offshore drilling provides access to huge reservoirs in regions where onshore exploration may face environmental or geopolitical challenges, further focusing on its strategic importance in the oil and gas industry globally.</p>

    <p>Figure 1: Oil and Gas Projects Market, by Drilling, 2022 &amp; 2032 (USD Billion)</p>

    Get more detailed insights about Oil and Gas Projects Market Research Report – Forecast till 2034

    Regional Insights

    By region, the study delivers market insights of North America, Europe, Asia-Pacific, and the Rest of the World. The North American Oil and Gas Projects market area dominates this market, with abundant shale resources, leading to increased exploration, extraction, and production activities. Further, the pursuit of energy independence, technological advancements in extraction methods, and the surging demand for natural gas in power generation contribute to the market growth.

    Further, the prime countries studied in the market report are the US, Canada, Germany, France, the UK, Italy, Spain, Japan, China, India, Australia, South Korea, and Brazil.

    Figure 2: Oil and Gas Projects Market Share By Region 2022 (USD Billion)

    Oil and Gas Projects Market Share By Region 2022

    Source: The Primary Research, Secondary Research, MRFR Database and Analyst Review

    Europe's Oil and Gas Projects market accounts for the second-largest market share due to the strategic efforts to diversify its energy sources and improve energy security, increasing the investments in exploration, production, and infrastructure projects. Further, the German Oil and Gas Projects market held the biggest market revenue share, and the UK Oil and Gas Projects market was the fastest-growing market in the European region.

    The Asia-Pacific Oil and Gas Projects Market is expected to rise at the fastest CAGR from 2023 to 2032. This is due to the rising industrialization, rapid urbanization, and growing energy demands. Moreover, China’s Oil and Gas Projects market held the largest market revenue share, and the Indian Oil and Gas Projects market was the fastest-growing market in the Asia-Pacific region.

    Key Players and Competitive Insights

    Leading market players are investing heavily in the research and development in order to expand their product lines, which will assist the Oil and Gas Projects market grow even more. Market players are also undertaking different strategic activities for expanding their global footprint, with important market developments inclusive of contractual agreements, mergers and acquisitions, new product launches, higher investments, and collaboration with the other organizations. To expand and survive in the  more competitive and rising market climate, the Oil and Gas Projects industry must offer cost-effective items.

    Manufacturing locally to minimize the operational costs is one of the prime business tactics utilized by the manufacturers in the global Oil and Gas Projects industry to benefit the clients and increase the market sector. In recent years, the Oil and Gas Projects industry has offered some of the most significant advantages to different industries. 

    Major players in the Oil and Gas Projects market, including NGL Energy Partners LP, Centrica plc, Kinder Morgan, Schlumberger Limited, Exxon Mobil Corporation, Chevron Corporation, ConocoPhillips Company, Marathon Oil Company, Occidental Petroleum Corporation, Halliburton and others, are trying to raise market requirement by investing in the research and development operations.

    ExxonMobil is one of the world's largest publicly traded international oil and gas companies; popular for its prominence in the energy sector, ExxonMobil operates throughout the entire spectrum of the oil and gas industry, from the exploration and production to refining, marketing, and the development of petrochemical products. The company's global footprint spans numerous continents, and it plays a significant role in meeting the world's energy needs. 

    On October 27, 2023,ExxonMobil partnered with Microsoft to accelerate digital transformation in their Permian Basin operations, emphasizing optimizing production and reducing emissions.

    Chevron Corporation, one of the biggest multinational energy corporations globally, is a prime player in the oil and gas industry. Headquartered in California, Chevron operates throughout the entire energy spectrum, from the exploration and production to refining, marketing, and the development of renewable energy sources. The company's broad portfolio includes a significant presence in upstream exploration and production activities and downstream operations that involve refining crude oil and marketing different petroleum and petrochemical products. 

    On November 10, 2023,Chevron and Enbridge announced a joint venture in order to develop the Golden Dawn LNG export project in Louisiana, expected to be operational by 2027.

    Key Companies in the Oil Gas Projects Market market include

    Industry Developments

    December 2023:EOG Resources partnered with CarbonCapture Inc. to deploy carbon capture and storage technology at its Anadarko Basin facilities, aiming to achieve net-zero emissions by 2040.

    November 2023:Coterra Energy acquires Haynesville Shale assets from Chesapeake Energy for $1.8 billion, strengthening Coterra's position as the  leading natural gas producer in the Haynesville Shale.

    February 2021:Hydroxycut's newest creation, CUT Energy, a delectable clean energy drink, was released. This powerful mix was carefully formulated for regular energy drink consumers, exercise enthusiasts, and dieters looking to lose weight.

    Future Outlook

    Oil Gas Projects Market Future Outlook

    <p>The Oil and Gas Projects Market is projected to grow at a 5.65% CAGR from 2025 to 2035, driven by technological advancements, increasing energy demand, and regulatory support for sustainable practices.</p>

    New opportunities lie in:

    • <p>Invest in digital transformation technologies to enhance operational efficiency and reduce costs. Develop renewable energy integration strategies to diversify offerings and meet evolving consumer preferences. Explore partnerships with local governments to capitalize on emerging markets and infrastructure projects.</p>

    <p>By 2035, the Oil and Gas Projects Market is expected to achieve robust growth, reflecting evolving industry dynamics and increased investment.</p>

    Market Segmentation

    Oil and Gas Projects Type Outlook

    • Surface and Lease Equipment
    • Gathering & Processing
    • Oil
    • Gas & NGL Pipelines
    • Oil & Gas Storage
    • Refining & Oil Products Transport
    • Export Terminals

    Oil and Gas Projects Drilling Outlook

    • Offshore
    • Onshore

    Oil and Gas Projects Regional Outlook

    • {""=>["US"
    • "Canada"]}
    • {""=>["Germany"
    • "France"
    • "UK"
    • "Italy"
    • "Spain"
    • "Rest of Europe"]}
    • {""=>["China"
    • "Japan"
    • "India"
    • "Australia"
    • "South Korea"
    • "Rest of Asia-Pacific"]}
    • {""=>["Middle East"
    • "Africa"
    • "Latin America"]}

    Report Scope

    Report Attribute/MetricDetails
    Market Size 2024 732.95 (USD Billion)
    Market Size 2025 774.38 (USD Billion)
    Market Size 20351341.93 (USD Billion)
    Compound Annual Growth Rate (CAGR)5.65% (2025 - 2035)
    Report CoverageRevenue Forecast, Competitive Landscape, Growth Factors, and Trends
    Base Year2024
    Market Forecast Period2025 - 2035
    Historical Data2019 - 2023
    Report CoverageRevenue Forecast, The Market Competitive Landscape, Growth Factors, and Trends
    Segments CoveredType, Drilling, and Region
    Geographies CoveredNorth America, Europe, Asia Pacific, and the Rest of the World
    Countries CoveredThe US, Canada, Germany, France, UK, Italy, Spain, Japan, China, India, Australia, South Korea, and Brazil
    Key Companies Profiled NGL Energy Partners LP, Centrica plc, Kinder Morgan, Schlumberger Limited, Exxon Mobil Corporation, Chevron Corporation, ConocoPhillips Company, Marathon Oil Company, Occidental Petroleum Corporation, Halliburton
    Key Market OpportunitiesThe growing innovation in technology.
    Key Market DynamicsIncreased global demand for energy.

    Market Highlights

    Author

    Garvit Vyas
    Analyst

    She holds an experience of about 6+ years in market research and business consulting, working under the spectrum of information communication technology, telecommunications and semiconductor domains. aarti conceptualizes and implements a scalable business strategy and provides strategic leadership to the clients. her expertise lies in market estimation, competitive intelligence, pipeline analysis, customer assessment, etc.

    Leave a Comment

    Latest Comments

    John Doe
    john@example.com

    This is a great article! Really helped me understand the topic better.

    Posted on July 23, 2025, 10:15 AM
    Jane Smith
    jane@domain.com

    Thanks for sharing this. I’ve bookmarked it for later reference.

    Posted on July 22, 2025, 7:45 PM

    FAQs

    How big is the oil and gas projects market?

    The Oil and Gas Projects Market size was valued at USD 732.95 Billion in 2024.

    What is the growth rate of the Oil and Gas Projects market?

    The global market is foreseen to rise at a CAGR of 5.65% during the forecast period, 2025-2034.

    Which region held the biggest market share in the Oil and Gas Projects market?

    North America held the biggest share of the global market

    Who are the prime players in the Oil and Gas Projects market?

    The key players in the market are NGL Energy Partners LP, Centrica plc, Kinder Morgan, Schlumberger Limited, Exxon Mobil Corporation, Chevron Corporation, ConocoPhillips Company, Marathon Oil Company, Occidental Petroleum Corporation, Halliburton.

    Which type led the Oil and Gas Projects market?

    The Oil, Gas &amp; NGL Pipelines category dominated the market in 2022.

    Which drilling had the largest market share in the Oil and Gas Projects market?

    The offshore had the largest share in the global market.

    1. EXECUTIVE SUMMARY
      1. \r\n
    2. MARKET INTRODUCTION
      1. \r\n
      2. Definition
      3. \r\n
      4. Scope of the Study
        1. Research Objective
        2. Assumptions
      5. \r\n
      6. \r\n
      7. \r\n
      8. 2.2.3.Limitations
      9. \r\n
    3. RESEARCH METHODOLOGY
      1. \r\n
      2. Overview
      3. \r\n
      4. Data Mining
      5. \r\n
      6. Secondary Research
      7. \r\n
      8. Primary Research
        1. Primary Interviews and Information Gathering Process
      9. \r\n
      10. \r\n
      11. 3.4.2.Breakdown of Primary Respondents
      12. \r\n
      13. Forecasting Model
      14. \r\n
      15. Market Size Estimation
        1. Bottom-Up Approach
        2. Top-Down Approach
      16. \r\n
      17. \r\n
      18. \r\n
      19. Data Triangulation
      20. \r\n
      21. Validation
      22. \r\n
    4. MARKET DYNAMICS
      1. \r\n
      2. Overview
      3. \r\n
      4. Drivers
      5. \r\n
      6. Restraints
      7. \r\n
      8. Opportunities
      9. \r\n
    5. MARKET FACTOR ANALYSIS
      1. \r\n
      2. Value Chain Analysis
      3. \r\n
      4. Porter’s Five Forces Analysis
        1. Bargaining Power of Suppliers
        2. Bargaining Power of Buyers
        3. Threat of New Entrants
        4. Threat of Substitutes
        5. Intensity of Rivalry
      5. \r\n
      6. \r\n
      7. \r\n
      8. \r\n
      9. \r\n
      10. \r\n
      11. COVID-19 Impact Analysis
        1. Market Impact Analysis
        2. Regional Impact
        3. Opportunity and Threat Analysis
      12. \r\n
      13. \r\n
      14. \r\n
      15. \r\n
    6. GLOBAL OIL AND GAS PROJECTS MARKET, BY TYPE
      1. \r\n
      2. Overview
      3. \r\n
      4. Surface and Lease Equipment
      5. \r\n
      6. Gathering & Processing
      7. \r\n
      8. Oil, Gas & NGL Pipelines
      9. \r\n
      10. Oil & Gas Storage
      11. \r\n
      12. Refining & Oil Products Transport
      13. \r\n
      14. Export Terminals
      15. \r\n
    7. GLOBAL OIL AND GAS PROJECTS MARKET, BY DRILLING
      1. \r\n
      2. Overview
      3. \r\n
      4. Offshore
      5. \r\n
      6. Onshore
      7. \r\n
    8. GLOBAL OIL AND GAS PROJECTS MARKET, BY REGION
      1. \r\n
      2. Overview
      3. \r\n
      4. North America
        1. US
        2. Canada
      5. \r\n
      6. \r\n
      7. \r\n
      8. Europe
        1. Germany
        2. France
        3. UK
        4. Italy
        5. Spain
        6. Rest of Europe
      9. \r\n
      10. \r\n
      11. \r\n
      12. \r\n
      13. \r\n
      14. \r\n
      15. \r\n
      16. Asia-Pacific
        1. China
        2. India
        3. Japan
        4. South Korea
        5. Australia
        6. Rest of Asia-Pacific
      17. \r\n
      18. \r\n
      19. \r\n
      20. \r\n
      21. \r\n
      22. \r\n
      23. \r\n
      24. Rest of the World
        1. Middle East
        2. Africa
        3. Latin America
      25. \r\n
      26. \r\n
      27. \r\n
      28. \r\n
    9. COMPETITIVE LANDSCAPE
      1. \r\n
      2. Overview
      3. \r\n
      4. Competitive Analysis
      5. \r\n
      6. Market Share Analysis
      7. \r\n
      8. Major Growth Strategy in the Global Oil and Gas Projects Market,
      9. \r\n
      10. Competitive Benchmarking
      11. \r\n
      12. Leading Players in Terms of Number of Developments in the Global Oil and Gas Projects Market,
      13. \r\n
      14. Key developments and Growth Strategies
        1. New Product Launch/Service Deployment
        2. Merger & Acquisitions
        3. Joint Ventures
      15. \r\n
      16. \r\n
      17. \r\n
      18. \r\n
      19. Major Players Financial Matrix
        1. Sales & Operating Income, 2022
        2. Major Players R&D Expenditure. 2022
      20. \r\n
      21. \r\n
      22. \r\n
    10. COMPANY PROFILES
      1. \r\n
      2. NGL Energy Partners LP
        1. Company Overview
        2. Financial Overview
        3. Products Offered
        4. Key Developments
        5. SWOT Analysis
        6. Key Strategies
      3. \r\n
      4. \r\n
      5. \r\n
      6. \r\n
      7. \r\n
      8. \r\n
      9. \r\n
      10. Centrica plc
        1. Company Overview
        2. Financial Overview
        3. Products Offered
        4. Key Developments
        5. SWOT Analysis
        6. Key Strategies
      11. \r\n
      12. \r\n
      13. \r\n
      14. \r\n
      15. \r\n
      16. \r\n
      17. \r\n
      18. Kinder Morgan
        1. Company Overview
        2. Financial Overview
        3. Products Offered
        4. Key Developments
        5. SWOT Analysis
        6. Key Strategies
      19. \r\n
      20. \r\n
      21. \r\n
      22. \r\n
      23. \r\n
      24. \r\n
      25. \r\n
      26. Schlumberger limited
        1. Company Overview
        2. Financial Overview
        3. Products Offered
        4. Key Developments
        5. SWOT Analysis
        6. Key Strategies
      27. \r\n
      28. \r\n
      29. \r\n
      30. \r\n
      31. \r\n
      32. \r\n
      33. \r\n
      34. Exxon Mobil Corporation
        1. Company Overview
        2. Financial Overview
        3. Products Offered
        4. Key Developments
        5. SWOT Analysis
        6. Key Strategies
      35. \r\n
      36. \r\n
      37. \r\n
      38. \r\n
      39. \r\n
      40. \r\n
      41. \r\n
      42. Chevron Corporation
        1. Company Overview
        2. Financial Overview
        3. Products Offered
        4. Key Developments
        5. SWOT Analysis
        6. Key Strategies
      43. \r\n
      44. \r\n
      45. \r\n
      46. \r\n
      47. \r\n
      48. \r\n
      49. \r\n
      50. ConocoPhilllips Company
        1. Company Overview
        2. Financial Overview
        3. Products Offered
        4. Key Developments
        5. SWOT Analysis
        6. Key Strategies
      51. \r\n
      52. \r\n
      53. \r\n
      54. \r\n
      55. \r\n
      56. \r\n
      57. \r\n
      58. Marathon Oil Company
        1. Company Overview
        2. Financial Overview
        3. Products Offered
        4. Key Developments
        5. SWOT Analysis
        6. Key Strategies
      59. \r\n
      60. \r\n
      61. \r\n
      62. \r\n
      63. \r\n
      64. \r\n
      65. \r\n
      66. Occidental Petroleum Corporation
        1. Company Overview
        2. Financial Overview
        3. Products Offered
        4. Key Developments
        5. SWOT Analysis
        6. Key Strategies
      67. \r\n
      68. \r\n
      69. \r\n
      70. \r\n
      71. \r\n
      72. \r\n
      73. \r\n
      74. Halliburton
        1. Company Overview
        2. Financial Overview
        3. Products Offered
        4. Key Developments
        5. SWOT Analysis
        6. Key Strategies
      75. \r\n
      76. \r\n
      77. \r\n
      78. \r\n
      79. \r\n
      80. \r\n
      81. \r\n
    11. APPENDIX
      1. \r\n
      2. References
      3. \r\n
      4. Related Reports
      5. \r\n\r\n\r\n\r\n
    12. LIST OF TABLES
      1. \r\n
    13. GLOBAL OIL AND GAS PROJECTS MARKET, SYNOPSIS, 2018-2032
      1. \r\n
    14. GLOBAL OIL AND GAS PROJECTS MARKET, ESTIMATES & FORECAST, 2018-2032 (USD BILLION)
      1. \r\n
    15. GLOBAL OIL AND GAS PROJECTS MARKET, BY TYPE, 2018-2032 (USD BILLION)
      1. \r\n
    16. GLOBAL OIL AND GAS PROJECTS MARKET, BY DRILLING, 2018-2032 (USD BILLION)
      1. \r\n
    17. NORTH AMERICA: OIL AND GAS PROJECTS MARKET, BY TYPE, 2018-2032 (USD BILLION)
      1. \r\n
    18. NORTH AMERICA: OIL AND GAS PROJECTS MARKET, BY DRILLING, 2018-2032 (USD BILLION)
      1. \r\n
    19. US: OIL AND GAS PROJECTS MARKET, BY TYPE, 2018-2032 (USD BILLION)
      1. \r\n
    20. US: OIL AND GAS PROJECTS MARKET, BY DRILLING, 2018-2032 (USD BILLION)
      1. \r\n
    21. CANADA: OIL AND GAS PROJECTS MARKET, BY TYPE, 2018-2032 (USD BILLION)
      1. \r\n
    22. CANADA: OIL AND GAS PROJECTS MARKET, BY DRILLING, 2018-2032 (USD BILLION)
      1. \r\n
    23. EUROPE: OIL AND GAS PROJECTS MARKET, BY TYPE, 2018-2032 (USD BILLION)
      1. \r\n
    24. EUROPE: OIL AND GAS PROJECTS MARKET, BY DRILLING, 2018-2032 (USD BILLION)
      1. \r\n
    25. GERMANY: OIL AND GAS PROJECTS MARKET, BY TYPE, 2018-2032 (USD BILLION)
      1. \r\n
    26. GERMANY: OIL AND GAS PROJECTS MARKET, BY DRILLING, 2018-2032 (USD BILLION)
      1. \r\n
    27. FRANCE: OIL AND GAS PROJECTS MARKET, BY TYPE, 2018-2032 (USD BILLION)
      1. \r\n
    28. FRANCE: OIL AND GAS PROJECTS MARKET, BY DRILLING, 2018-2032 (USD BILLION)
      1. \r\n
    29. ITALY: OIL AND GAS PROJECTS MARKET, BY TYPE, 2018-2032 (USD BILLION)
      1. \r\n
    30. ITALY: OIL AND GAS PROJECTS MARKET, BY DRILLING, 2018-2032 (USD BILLION)
      1. \r\n
    31. SPAIN: OIL AND GAS PROJECTS MARKET, BY TYPE, 2018-2032 (USD BILLION)
      1. \r\n
    32. SPAIN: OIL AND GAS PROJECTS MARKET, BY DRILLING, 2018-2032 (USD BILLION)
      1. \r\n
    33. UK: OIL AND GAS PROJECTS MARKET, BY TYPE, 2018-2032 (USD BILLION)
      1. \r\n
    34. UK: OIL AND GAS PROJECTS MARKET, BY DRILLING, 2018-2032 (USD BILLION)
      1. \r\n
    35. REST OF EUROPE: OIL AND GAS PROJECTS MARKET, BY TYPE, 2018-2032 (USD BILLION)
      1. \r\n
    36. REST OF EUROPE: OIL AND GAS PROJECTS MARKET, BY DRILLING, 2018-2032 (USD BILLION)
      1. \r\n
    37. ASIA-PACIFIC: OIL AND GAS PROJECTS MARKET, BY TYPE, 2018-2032 (USD BILLION)
      1. \r\n
    38. ASIA-PACIFIC: OIL AND GAS PROJECTS MARKET, BY DRILLING, 2018-2032 (USD BILLION)
      1. \r\n
    39. JAPAN: OIL AND GAS PROJECTS MARKET, BY TYPE, 2018-2032 (USD BILLION)
      1. \r\n
    40. JAPAN: OIL AND GAS PROJECTS MARKET, BY DRILLING, 2018-2032 (USD BILLION)
      1. \r\n
    41. CHINA: OIL AND GAS PROJECTS MARKET, BY TYPE, 2018-2032 (USD BILLION)
      1. \r\n
    42. CHINA: OIL AND GAS PROJECTS MARKET, BY DRILLING, 2018-2032 (USD BILLION)
      1. \r\n
    43. INDIA: OIL AND GAS PROJECTS MARKET, BY TYPE, 2018-2032 (USD BILLION)
      1. \r\n
    44. INDIA: OIL AND GAS PROJECTS MARKET, BY DRILLING, 2018-2032 (USD BILLION)
      1. \r\n
    45. AUSTRALIA: OIL AND GAS PROJECTS MARKET, BY TYPE, 2018-2032 (USD BILLION)
      1. \r\n
    46. AUSTRALIA: OIL AND GAS PROJECTS MARKET, BY DRILLING, 2018-2032 (USD BILLION)
      1. \r\n
    47. SOUTH KOREA: OIL AND GAS PROJECTS MARKET, BY TYPE, 2018-2032 (USD BILLION)
      1. \r\n
    48. SOUTH KOREA: OIL AND GAS PROJECTS MARKET, BY DRILLING, 2018-2032 (USD BILLION)
      1. \r\n
    49. REST OF ASIA-PACIFIC: OIL AND GAS PROJECTS MARKET, BY TYPE, 2018-2032 (USD BILLION)
      1. \r\n
    50. REST OF ASIA-PACIFIC: OIL AND GAS PROJECTS MARKET, BY DRILLING, 2018-2032 (USD BILLION)
      1. \r\n
    51. REST OF THE WORLD: OIL AND GAS PROJECTS MARKET, BY TYPE, 2018-2032 (USD BILLION)
      1. \r\n
    52. REST OF THE WORLD: OIL AND GAS PROJECTS MARKET, BY DRILLING, 2018-2032 (USD BILLION)
      1. \r\n
    53. MIDDLE EAST: OIL AND GAS PROJECTS MARKET, BY TYPE, 2018-2032 (USD BILLION)
      1. \r\n
    54. MIDDLE EAST: OIL AND GAS PROJECTS MARKET, BY DRILLING, 2018-2032 (USD BILLION)
      1. \r\n
    55. AFRICA: OIL AND GAS PROJECTS MARKET, BY TYPE, 2018-2032 (USD BILLION)
      1. \r\n
    56. AFRICA: OIL AND GAS PROJECTS MARKET, BY DRILLING, 2018-2032 (USD BILLION)
      1. \r\n
    57. LATIN AMERICA: OIL AND GAS PROJECTS MARKET, BY TYPE, 2018-2032 (USD BILLION)
      1. \r\n
    58. LATIN AMERICA: OIL AND GAS PROJECTS MARKET, BY DRILLING, 2018-2032 (USD BILLION)
      1. \r\n
    59. LIST OF FIGURES
      1. \r\n
    60. RESEARCH PROCESS
      1. \r\n
    61. MARKET STRUCTURE FOR THE GLOBAL OIL AND GAS PROJECTS MARKET
      1. \r\n
    62. MARKET DYNAMICS FOR THE GLOBAL OIL AND GAS PROJECTS MARKET
      1. \r\n
    63. GLOBAL OIL AND GAS PROJECTS MARKET, SHARE (%), BY TYPE, 2022
      1. \r\n
    64. GLOBAL OIL AND GAS PROJECTS MARKET, SHARE (%), BY DRILLING, 2022
      1. \r\n
    65. GLOBAL OIL AND GAS PROJECTS MARKET, SHARE (%), BY REGION, 2022
      1. \r\n
    66. NORTH AMERICA: OIL AND GAS PROJECTS MARKET, SHARE (%), BY REGION, 2022
      1. \r\n
    67. EUROPE: OIL AND GAS PROJECTS MARKET, SHARE (%), BY REGION, 2022
      1. \r\n
    68. ASIA-PACIFIC: OIL AND GAS PROJECTS MARKET, SHARE (%), BY REGION, 2022
      1. \r\n
    69. REST OF THE WORLD: OIL AND GAS PROJECTS MARKET, SHARE (%), BY REGION, 2022
      1. \r\n
    70. GLOBAL OIL AND GAS PROJECTS MARKET: COMPANY SHARE ANALYSIS, 2022 (%)
      1. \r\n
    71. NGL ENERGY PARTNERS LP: FINANCIAL OVERVIEW SNAPSHOT
      1. \r\n
    72. NGL ENERGY PARTNERS LP: SWOT ANALYSIS
      1. \r\n
    73. CENTRICA PLC: FINANCIAL OVERVIEW SNAPSHOT
      1. \r\n
    74. CENTRICA PLC: SWOT ANALYSIS
      1. \r\n
    75. KINDER MORGAN: FINANCIAL OVERVIEW SNAPSHOT
      1. \r\n
    76. KINDER MORGAN: SWOT ANALYSIS
      1. \r\n
    77. SCHLUMBERGER LIMITED: FINANCIAL OVERVIEW SNAPSHOT
      1. \r\n
    78. SCHLUMBERGER LIMITED: SWOT ANALYSIS
      1. \r\n
    79. EXXON MOBIL CORPORATION: FINANCIAL OVERVIEW SNAPSHOT
      1. \r\n
    80. EXXON MOBIL CORPORATION: SWOT ANALYSIS
      1. \r\n
    81. CHEVRON CORPORATION: FINANCIAL OVERVIEW SNAPSHOT
      1. \r\n
    82. CHEVRON CORPORATION: SWOT ANALYSIS
      1. \r\n
    83. CONOCOPHILLLIPS COMPANY: FINANCIAL OVERVIEW SNAPSHOT
      1. \r\n
    84. CONOCOPHILLLIPS COMPANY: SWOT ANALYSIS
      1. \r\n
    85. MARATHON OIL COMPANY: FINANCIAL OVERVIEW SNAPSHOT
      1. \r\n
    86. MARATHON OIL COMPANY: SWOT ANALYSIS
      1. \r\n
    87. OCCIDENTAL PETROLEUM CORPORATION: FINANCIAL OVERVIEW SNAPSHOT
      1. \r\n
    88. OCCIDENTAL PETROLEUM CORPORATION: SWOT ANALYSIS
      1. \r\n
    89. HALLIBURTON: FINANCIAL OVERVIEW SNAPSHOT
      1. \r\n
    90. HALLIBURTON: SWOT ANALYSIS
      1. "

    Oil and Gas Projects Market Segmentation

    Oil and Gas Projects Type Outlook (USD Billion, 2018-2032)

    Surface and Lease Equipment

    Gathering & Processing

    Oil, Gas & NGL Pipelines

    Oil & Gas Storage

    Refining & Oil Products Transport

    Export Terminals

    Oil and gas projects Drilling Outlook (USD Billion, 2018-2032)

    Offshore

    Onshore

    Oil and Gas Projects Regional Outlook (USD Billion, 2018-2032)

    North America Outlook (USD Billion, 2018-2032)

    North America Oil and Gas Projects by Type

    Surface and Lease Equipment

    Gathering & Processing

    Oil, Gas & NGL Pipelines

    Oil & Gas Storage

    Refining & Oil Products Transport

    Export Terminals

    North America Oil and Gas Projects by Drilling

    Offshore

    Onshore

    US Outlook (USD Billion, 2018-2032)

    US Oil and Gas Projects by Type

    Surface and Lease Equipment

    Gathering & Processing

    Oil, Gas & NGL Pipelines

    Oil & Gas Storage

    Refining & Oil Products Transport

    Export Terminals

    US Oil and Gas Projects by Drilling

    Offshore

    Onshore

    CANADA Outlook (USD Billion, 2018-2032)

    CANADA Oil and Gas Projects by Type

    Surface and Lease Equipment

    Gathering & Processing

    Oil, Gas & NGL Pipelines

    Oil & Gas Storage

    Refining & Oil Products Transport

    Export Terminals

    CANADA Oil and Gas Projects by Drilling

    Offshore

    Onshore

    Europe Outlook (USD Billion, 2018-2032)

    Europe Oil and Gas Projects by Type

    Surface and Lease Equipment

    Gathering & Processing

    Oil, Gas & NGL Pipelines

    Oil & Gas Storage

    Refining & Oil Products Transport

    Export Terminals

    Europe Oil and Gas Projects by Drilling

    Offshore

    Onshore

    Germany Outlook (USD Billion, 2018-2032)

    Germany Oil and Gas Projects by Type

    Surface and Lease Equipment

    Gathering & Processing

    Oil, Gas & NGL Pipelines

    Oil & Gas Storage

    Refining & Oil Products Transport

    Export Terminals

    Germany Oil and Gas Projects by Drilling

    Offshore

    Onshore

    France Outlook (USD Billion, 2018-2032)

    France Oil and Gas Projects by Type

    Surface and Lease Equipment

    Gathering & Processing

    Oil, Gas & NGL Pipelines

    Oil & Gas Storage

    Refining & Oil Products Transport

    Export Terminals

    France Oil and Gas Projects by Drilling

    Offshore

    Onshore

    UK Outlook (USD Billion, 2018-2032)

    UK Oil and Gas Projects by Type

    Surface and Lease Equipment

    Gathering & Processing

    Oil, Gas & NGL Pipelines

    Oil & Gas Storage

    Refining & Oil Products Transport

    Export Terminals

    UK Oil and Gas Projects by Drilling

    Offshore

    Onshore

    ITALY Outlook (USD Billion, 2018-2032)

    ITALY Oil and Gas Projects by Type

    Surface and Lease Equipment

    Gathering & Processing

    Oil, Gas & NGL Pipelines

    Oil & Gas Storage

    Refining & Oil Products Transport

    Export Terminals

    ITALY Oil and Gas Projects by Drilling

    Offshore

    Onshore

    SPAIN Outlook (USD Billion, 2018-2032)

    Spain Oil and Gas Projects by Type

    Surface and Lease Equipment

    Gathering & Processing

    Oil, Gas & NGL Pipelines

    Oil & Gas Storage

    Refining & Oil Products Transport

    Export Terminals

    Spain Oil and Gas Projects by Drilling

    Offshore

    Onshore

    Rest Of Europe Outlook (USD Billion, 2018-2032)

    Rest Of Europe Oil and Gas Projects by Type

    Surface and Lease Equipment

    Gathering & Processing

    Oil, Gas & NGL Pipelines

    Oil & Gas Storage

    Refining & Oil Products Transport

    Export Terminals

    REST OF EUROPE Oil and Gas Projects by Drilling

    Offshore

    Onshore

    Asia-Pacific Outlook (USD Billion, 2018-2032)

    Asia-Pacific Oil and Gas Projects by Type

    Surface and Lease Equipment

    Gathering & Processing

    Oil, Gas & NGL Pipelines

    Oil & Gas Storage

    Refining & Oil Products Transport

    Export Terminals

    Asia-Pacific Oil and Gas Projects by Drilling

    Offshore

    Onshore

    China Outlook (USD Billion, 2018-2032)

    China Oil and Gas Projects by Type

    Surface and Lease Equipment

    Gathering & Processing

    Oil, Gas & NGL Pipelines

    Oil & Gas Storage

    Refining & Oil Products Transport

    Export Terminals

    China Oil and Gas Projects by Drilling

    Offshore

    Onshore

    Japan Outlook (USD Billion, 2018-2032)

    Japan Oil and Gas Projects by Type

    Surface and Lease Equipment

    Gathering & Processing

    Oil, Gas & NGL Pipelines

    Oil & Gas Storage

    Refining & Oil Products Transport

    Export Terminals

    Japan Oil and Gas Projects by Drilling

    Offshore

    Onshore

    India Outlook (USD Billion, 2018-2032)

    India Oil and Gas Projects by Type

    Surface and Lease Equipment

    Gathering & Processing

    Oil, Gas & NGL Pipelines

    Oil & Gas Storage

    Refining & Oil Products Transport

    Export Terminals

    India Oil and Gas Projects by Drilling

    Offshore

    Onshore

    Australia Outlook (USD Billion, 2018-2032)

    Australia Oil and Gas Projects by Type

    Surface and Lease Equipment

    Gathering & Processing

    Oil, Gas & NGL Pipelines

    Oil & Gas Storage

    Refining & Oil Products Transport

    Export Terminals

    Australia Oil and Gas Projects by Drilling

    Offshore

    Onshore

    Rest of Asia-Pacific Outlook (USD Billion, 2018-2032)

    Rest of Asia-Pacific Oil and Gas Projects by Type

    Surface and Lease Equipment

    Gathering & Processing

    Oil, Gas & NGL Pipelines

    Oil & Gas Storage

    Refining & Oil Products Transport

    Export Terminals

    Rest of Asia-Pacific Oil and Gas Projects by Drilling

    Offshore

    Onshore

    Rest of the World Outlook (USD Billion, 2018-2032)

    Rest of the World Oil and Gas Projects by Type

    Surface and Lease Equipment

    Gathering & Processing

    Oil, Gas & NGL Pipelines

    Oil & Gas Storage

    Refining & Oil Products Transport

    Export Terminals

    Rest of the World Oil and Gas Projects by Drilling

    Offshore

    Onshore

    Middle East Outlook (USD Billion, 2018-2032)

    Middle East Oil and Gas Projects by Type

    Surface and Lease Equipment

    Gathering & Processing

    Oil, Gas & NGL Pipelines

    Oil & Gas Storage

    Refining & Oil Products Transport

    Export Terminals

    Middle East Oil and Gas Projects by Drilling

    Offshore

    Onshore

    Africa Outlook (USD Billion, 2018-2032)

    Africa Oil and Gas Projects by Type

    Surface and Lease Equipment

    Gathering & Processing

    Oil, Gas & NGL Pipelines

    Oil & Gas Storage

    Refining & Oil Products Transport

    Export Terminals

    Africa Oil and Gas Projects by Drilling

    Offshore

    Onshore

    Latin America Outlook (USD Billion, 2018-2032)

    Latin America Oil and Gas Projects by Type

    Surface and Lease Equipment

    Gathering & Processing

    Oil, Gas & NGL Pipelines

    Oil & Gas Storage

    Refining & Oil Products Transport

    Export Terminals

    Latin America Oil and Gas Projects by Drilling

    Offshore

    Onshore

    Infographic

    Free Sample Request

    Kindly complete the form below to receive a free sample of this Report

    Get Free Sample

    Customer Strories

    “I am very pleased with how market segments have been defined in a relevant way for my purposes (such as "Portable Freezers & refrigerators" and "last-mile"). In general the report is well structured. Thanks very much for your efforts.”

    Victoria Milne

    Founder
    Case Study
    Chemicals and Materials