• Cat-intel
  • MedIntelliX
  • Resources
  • About Us
  • Hero Background
    English
    Chinese
    French
    Japanese
    Korean
    German
    Spanish

    Niobium Capacitor Market Share

    ID: MRFR/SEM/11085-HCR
    128 Pages
    Shubham Munde
    October 2025

    Niobium Capacitor Market Research Report Information By Product Type (Solid Electrolytic Capacitor and Liquid Electrolytic Capacitor), By Material (Niobium Oxide, Niobium Pentoxide, Niobium Powders and Others), By Capacitance (10-100µF, 100-300µF, 300-470µF and Above 470µF), By End-use Industry (Consumer Electronics, Automotive, Industrial, Aerospace and Defense, Power and Energy and Others), A...

    Share:
    Download PDF ×

    We do not share your information with anyone. However, we may send you emails based on your report interest from time to time. You may contact us at any time to opt-out.

    Niobium Capacitor Market Infographic
    Purchase Options

    Market Share

    Niobium Capacitor Market Share Analysis

    In the dynamic landscape of the Niobium Capacitor Market, companies employ various market share positioning strategies to carve out a competitive edge and thrive in the industry. One key strategy is differentiation through technological innovation. By investing in research and development, companies can create niobium capacitors with unique features, improved performance, and enhanced efficiency. This technological differentiation allows them to attract customers looking for advanced and cutting-edge solutions, thereby capturing a segment of the market that values innovation.

    Another crucial aspect of market share positioning is pricing strategy. Some companies may opt for a cost leadership approach, aiming to offer niobium capacitors at lower prices than competitors while maintaining acceptable quality. This strategy can help attract price-sensitive customers and gain a significant market share based on affordability. On the flip side, premium pricing can be employed by companies focusing on delivering high-quality, premium niobium capacitors with advanced features. This strategy targets customers who prioritize performance over cost and are willing to pay a premium for superior products.

    Strategic partnerships and collaborations are also instrumental in market share positioning. Companies may form alliances with other industry players, suppliers, or even research institutions to leverage complementary strengths. These collaborations can lead to shared resources, knowledge exchange, and the development of innovative solutions. By aligning with strategic partners, companies can enhance their capabilities, expand their product portfolios, and secure a more prominent position in the market.

    Geographical expansion is a fundamental strategy to increase market share in the Niobium Capacitor Market. Companies may explore untapped markets, both domestically and internationally, to expand their customer base. By identifying regions with growing demand for electronic devices and capacitors, companies can strategically position themselves to capture market share in those areas. This may involve establishing new distribution channels, partnering with local businesses, or setting up manufacturing facilities in key regions.

    Customer-centric strategies play a pivotal role in market share positioning. Understanding the needs and preferences of target customers allows companies to tailor their products and services accordingly. Providing excellent customer support, after-sales services, and customization options can create a positive brand perception, fostering customer loyalty and retention. Satisfied customers are more likely to become repeat buyers and advocates for the brand, contributing to increased market share over time.

    Mergers and acquisitions represent a strategic move for companies aiming to strengthen their market position. By acquiring or merging with other players in the Niobium Capacitor Market, companies can consolidate resources, streamline operations, and benefit from economies of scale. This strategy not only enhances market share but also positions the company as a key player with a broader product portfolio and increased market influence.

    Lastly, a focus on sustainability and environmental responsibility can be a compelling market share positioning strategy. As awareness of environmental issues grows, consumers are increasingly inclined to choose products from companies committed to sustainability. Manufacturers adopting eco-friendly practices in the production of niobium capacitors can appeal to a growing segment of environmentally conscious consumers, positioning themselves as responsible industry leaders.

    Author
    Shubham Munde
    Research Analyst Level II

    With a technical background in information technology & semiconductors, Shubham has 4.5+ years of experience in market research and analytics with the tasks of data mining, analysis, and project execution. He is the POC for our clients, for their consulting projects running under the ICT/Semiconductor domain. Shubham holds a Bachelor’s in Information and Technology and a Master of Business Administration (MBA). Shubham has executed over 150 research projects for our clients under the brand name Market Research Future in the last 2 years. His core skill is building the research respondent relation for gathering the primary information from industry and market estimation for niche markets. He is having expertise in conducting secondary & primary research, market estimations, market projections, competitive analysis, analysing current market trends and market dynamics, deep-dive analysis on market scenarios, consumer behaviour, technological impact analysis, consulting, analytics, etc. He has worked on fortune 500 companies' syndicate and consulting projects along with several government projects. He has worked on the projects of top tech brands such as IBM, Google, Microsoft, AWS, Meta, Oracle, Cisco Systems, Samsung, Accenture, VMware, Schneider Electric, Dell, HP, Ericsson, and so many others. He has worked on Metaverse, Web 3.0, Zero-Trust security, cyber-security, blockchain, quantum computing, robotics, 5G technology, High-Performance computing, data centers, AI, automation, IT equipment, sensors, semiconductors, consumer electronics and so many tech domain projects.

    Leave a Comment

    FAQs

    How much is the Niobium Capacitor market?

    The Niobium Capacitor Market size was valued at USD 7.34 billion in 2024.

    What is the growth rate of the Niobium Capacitor market?

    The global market is projected to grow at a CAGR of 10.10% during the forecast period, 2025 to 2035.

    Which region held the largest market share in the Niobium Capacitor market?

    North America had the largest share in the global market

    Who are the key players in the Niobium Capacitor market?

    The key players in the market are AMG NV, AVX Corporation, Illinois Capacitor, Toshiba Corporation, CBMM, NioCorp Developments, JX Nippon Mining & Metals, MITSUI Mining & Smelting Co. Ltd., Murata Manufacturing Co., Ltd., Kyocera Corporation.

    Which product Type led the Niobium Capacitor market?

    The Solid Electrolytic Capacitor category dominated the market in 2022.

    Which Material had the largest market share in the Niobium Capacitor market?

    The Niobium Oxide had the largest share in the global market.

    Market Summary

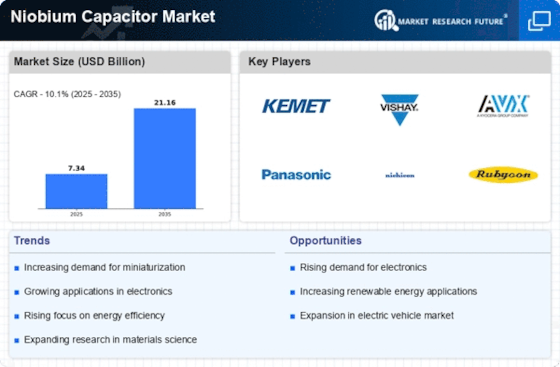
    As per Market Research Future Analysis, the Global Niobium Capacitor Market was valued at USD 7.34 Billion in 2024 and is projected to reach USD 21.16 Billion by 2035, growing at a CAGR of 10.10% from 2025 to 2035. The market is driven by the increasing demand for miniaturization and high-performance capacitors in electronic devices, particularly in consumer electronics and the automotive sector. The solid electrolytic capacitor segment dominates the market, accounting for over 75% of revenue, while niobium oxide is the leading material, generating 33% of income. North America is expected to maintain its dominance due to strong R&D and demand from automotive and aerospace industries.

    Key Market Trends & Highlights

    Key trends driving the Niobium Capacitor market include miniaturization and high capacitance in compact sizes.

    • Market Size in 2024: USD 7.34 Billion
    • Projected Market Size by 2035: USD 21.16 Billion
    • CAGR from 2025 to 2035: 10.10%
    • Solid electrolytic capacitors account for over 75% of market revenue

    Market Size & Forecast

    2024 Market Size USD 7.34 Billion
    2035 Market Size USD 21.16 Billion
    CAGR (2025-2035) 10.10%
    Largest Regional Market Share in 2024 North America

    Major Players

    Key players include AMG NV, AVX Corporation, Illinois Capacitor, Toshiba Corporation, CBMM, NioCorp Developments, JX Nippon Mining & Metals, MITSUI Mining & Smelting Co. Ltd., Murata Manufacturing Co., Ltd., and Kyocera Corporation.

    Market Trends

    High capacitance in compact sizes is driving the market growth

    Market CAGR for Niobium Capacitor is being driven by the several factors such as trend towards smaller and more compact electronic devices, such as smartphones, tablets, wearables, and IoT sensors. Niobium capacitors provide a unique advantage by offering high capacitance values in small packages. This is crucial for modern electronic devices where space is at a premium, and designers require compact components that can store and deliver energy efficiently. Capacitors are energy storage devices that store electrical charge and release it as needed.

    In addition, automotive industry increasingly relies on advanced electronics for vehicle control, infotainment systems, and safety features. Niobium capacitors offer reliability and stability, making them a valuable choice in critical automotive applications where performance is paramount.

    Moreover, the wearable technology market includes devices like fitness trackers, smartwatches, and medical wearables. These devices are intended to be lightweight and unobtrusive. Niobium capacitors provide the necessary energy storage for these devices without compromising their lightweight and compact design, allowing users to wear them comfortably for extended periods.

    The increasing demand for compact and efficient electronic components is driving the adoption of niobium capacitors across various industries, suggesting a transformative shift in energy storage solutions.

    U.S. Department of Energy

    Niobium Capacitor Market Market Drivers

    Market Growth Projections

    The Global Niobium Capacitor Market is experiencing robust growth, with projections indicating a market size of 7.34 USD Billion in 2024 and an anticipated increase to 21.2 USD Billion by 2035. This growth trajectory suggests a compound annual growth rate of 10.1% from 2025 to 2035, driven by various factors including technological advancements, increased demand in automotive applications, and the expansion of the renewable energy sector. These figures illustrate the dynamic nature of the market and the potential for niobium capacitors to play a pivotal role in future electronic and energy systems.

    Rising Demand for Miniaturization

    The trend towards miniaturization in electronic devices is a primary driver of the Global Niobium Capacitor Market Industry. As consumer electronics become smaller and more compact, the need for capacitors that occupy less space while maintaining high performance becomes critical. Niobium capacitors, known for their high capacitance and reliability, are increasingly favored in applications such as smartphones and wearables. This shift is reflected in the projected market growth, with the Global Niobium Capacitor Market expected to reach 7.34 USD Billion in 2024, indicating a robust demand for these components in miniaturized electronic designs.

    Expansion of Renewable Energy Sector

    The expansion of the renewable energy sector is a crucial driver for the Global Niobium Capacitor Market Industry. As countries invest in solar, wind, and other renewable energy sources, the need for efficient energy storage solutions becomes paramount. Niobium capacitors, with their high performance and reliability, are increasingly utilized in energy storage systems and power electronics. This trend is expected to bolster the market, as the Global Niobium Capacitor Market is projected to grow significantly, reflecting the increasing integration of renewable energy technologies into the global energy landscape.

    Growing Adoption in Automotive Applications

    The automotive sector's increasing reliance on advanced electronic systems is a significant driver for the Global Niobium Capacitor Market Industry. With the rise of electric vehicles and smart automotive technologies, there is a heightened demand for capacitors that can withstand harsh operating conditions while providing reliable performance. Niobium capacitors are particularly well-suited for these applications due to their thermal stability and longevity. As the automotive industry continues to innovate, the market for niobium capacitors is expected to expand, contributing to a compound annual growth rate of 10.1% from 2025 to 2035.

    Environmental Regulations and Sustainability

    Increasing environmental regulations and a global shift towards sustainability are impacting the Global Niobium Capacitor Market Industry. Governments worldwide are implementing stricter guidelines on electronic waste and promoting the use of eco-friendly materials in manufacturing. Niobium capacitors, which are often more environmentally friendly compared to traditional capacitors, align with these regulatory trends. As manufacturers seek to comply with sustainability standards, the demand for niobium capacitors is likely to rise, fostering market growth and encouraging innovation in eco-conscious designs.

    Technological Advancements in Capacitor Design

    Innovations in capacitor technology are significantly influencing the Global Niobium Capacitor Market Industry. Advances in materials science and manufacturing processes have led to the development of niobium capacitors that offer improved performance characteristics, such as higher energy density and lower equivalent series resistance. These enhancements make niobium capacitors suitable for a wider range of applications, including electric vehicles and renewable energy systems. As industries increasingly adopt these technologies, the market is poised for substantial growth, with projections suggesting a market size of 21.2 USD Billion by 2035, driven by the ongoing evolution in capacitor design.

    Market Segment Insights

    Niobium Capacitor Product Type Insights

    The Niobium Capacitor Market segmentation, based on product type includes solid electrolytic capacitor and liquid electrolytic capacitor. The solid electrolytic capacitor segment dominated the market, accounting for more than three-fourth of market revenue due to the rising demand for automation in manufacturing, electronic industry has led to increased adoption of Niobium Capacitor.

    Niobium Capacitor Material Insights

    The Niobium Capacitor Market segmentation, based on material, includes niobium oxide, niobium pentoxide, niobium powders and others. The niobium oxide category generated the most income (33%). The electronic industry's & rising demand in smartphone and laptops. Modern smartphones are designed to be energy-efficient to extend battery life.

    Source: Secondary Research, Primary Research, MRFR Database and Analyst Review

    Niobium Capacitor Capacitance Insights

    The Niobium Capacitor Market segmentation, based on capacitance includes 10-100µF, 100-300µF, 300-470µF and Above 470µF. The 100-300µF segment dominated the market, accounting for two third of market revenue. These capacitors are used in power management circuits to stabilize voltage levels, reduce voltage ripples, and improve energy efficiency, ensuring the reliable operation of these devices.

    Niobium Capacitor End-use Industry Insights

    The Niobium Capacitor Market segmentation, based on End-use Industry includes Consumer Electronics, Automotive, Industrial, Aerospace and Defense, Power and Energy and Others. The consumer electronics segment dominated the market, accounting More than three-fifth revenue due to compact design, high capacitance, and efficiency in energy storage and voltage regulation.

    Niobium Capacitor Regional Insights

    By region, the study provides the market insights into North America, Europe, Asia-Pacific and Rest of the World. The North American Niobium Capacitor market area will dominate this market, due to ongoing research and development & heavily demand by automotive & Aeronautics sectors. In addition, North America is at the forefront of technological innovation. The region has a strong ecosystem for research and development, leading to advancements in capacitor technology, including niobium capacitors. These innovations enhance their performance, making them more attractive for various applications.

    Furthermore, North America hosts a significant electronics manufacturing industry, which includes the production of consumer electronics, automotive components, industrial equipment, and more. Niobium capacitors are essential components in these products, driving the demand for these capacitors in the region.

    Further, the major countries studied in the market report are the US, Canada, Germany, France, the UK, Italy, Spain, China, Japan, India, Australia, South Korea, and Brazil.

    Source: Secondary Research, Primary Research, MRFR Database and Analyst Review

    Get more detailed insights about Niobium Capacitor Market Research Report—Global Forecast till 2035

    Regional Insights

    By region, the study provides the market insights into North America, Europe, Asia-Pacific and Rest of the World. The North American Niobium Capacitor market area will dominate this market, due to ongoing research and development & heavily demand by automotive & Aeronautics sectors. In addition, North America is at the forefront of technological innovation. The region has a strong ecosystem for research and development, leading to advancements in capacitor technology, including niobium capacitors. These innovations enhance their performance, making them more attractive for various applications.

    Furthermore, North America hosts a significant electronics manufacturing industry, which includes the production of consumer electronics, automotive components, industrial equipment, and more. Niobium capacitors are essential components in these products, driving the demand for these capacitors in the region.

    Further, the major countries studied in the market report are the US, Canada, Germany, France, the UK, Italy, Spain, China, Japan, India, Australia, South Korea, and Brazil.

    Figure 2: NIOBIUM CAPACITOR MARKET SHARE BY REGION 2022 (USD Billion)

    NIOBIUM CAPACITOR MARKET SHARE BY REGION 2022

    Source: Secondary Research, Primary Research, MRFR Database and Analyst Review

    Europe Niobium Capacitor market accounts for the second-largest market share. Europe has a robust aerospace and defense sector, which relies on reliable and efficient electronic components. Niobium capacitors are used in critical applications, such as avionics, radar systems, and missile guidance, due to their ability to perform well under extreme conditions. Moreover, Europe is a leader in renewable energy adoption, with a significant focus on wind and solar power. Niobium capacitors are used in energy storage systems and power electronics, helping to ensure efficient energy conversion and grid integration.

    The Asia-Pacific Niobium Capacitor market is expected to grow at the fastest CAGR from 2023 to 2032. This is due to the huge electronics manufacturing hub, with countries like China, Japan, South Korea, and Taiwan playing a pivotal role in the production of consumer electronics, semiconductors, and a wide range of electronic devices. Niobium capacitors are essential components in these products, driving demand. Moreover, China’s Niobium Capacitor market held the largest market share, and the Indian Niobium Capacitor market was the fastest growing market in the Asia-Pacific region.

    Key Players and Competitive Insights

    Leading market players are investing heavily in advanced technologies in order to expand their solutions and services, which will help the Niobium Capacitor market, grow even more. Market participants are also undertaking a variety of strategic activities to expand their global footprint, with important market developments including new solution launches, contractual agreements, mergers and acquisitions, higher investments, and collaboration with other organizations. To expand and survive in a more competitive and rising market climate, Niobium Capacitor industry must offer cost-effective solutions.

    Growing demand for automation in manufacturing, healthcare, and other tactics used by key players in the global Niobium Capacitor industry to benefit clients and increase the market sector. In recent years, the Niobium Capacitor industry has offered some of the most significant advantages to enterprises. Major players in the Niobium Capacitor market, including AMG NV, AVX Corporation, Illinois Capacitor, Toshiba Corporation, CBMM, NioCorp Developments, JX Nippon Mining & Metals, MITSUI Mining & Smelting Co. Ltd., Murata Manufacturing Co., Ltd., Kyocera Corporation, are attempting to increase market demand by investing in research and development operations.

    AVX Corporation is a globally recognized manufacturer and supplier of advanced electronic components and interconnect solutions. It offers an extensive product portfolio, including ceramic, tantalum, aluminum, and film capacitors. These components are crucial in a variety of applications, from energy storage and power management to signal filtering and electronic protection. It operates a global network of manufacturing facilities, research and development centers, and sales offices. This global presence enables the company to serve customers worldwide, catering to regional needs and ensuring timely delivery. It places a strong emphasis on innovation and research and development.

    It continually invests in cutting-edge technologies and new product development, keeping pace with the ever-evolving electronic industry. This dedication to innovation has led to the creation of advanced components with improved performance and reliability. It collaborates with various global partners, including electronic component distributors and manufacturers. These partnerships extend the company's reach and ensure that its components are readily available to customers.

    Murata Manufacturing Co., Ltd. is a globally renowned Japanese company that specializes in the design, manufacturing, and distribution of electronic components, modules, and solutions. It offers an extensive range of electronic components, including ceramic capacitors, inductors, resistors, sensors, wireless communication modules, and power supplies. These components play a vital role in various electronic applications, from smartphones and automotive systems to healthcare devices and industrial equipment. It operates a worldwide network of manufacturing facilities, research and development centers, and sales offices.

    This global footprint allows the company to serve customers on a global scale, providing tailored solutions to meet regional needs and requirements. It deeply committed to sustainability and environmental responsibility. The company implements eco-friendly manufacturing practices, such as energy-efficient operations, waste reduction, and compliance with environmental regulations. Murata's dedication to sustainability extends to its product development, with a focus on creating energy-efficient components.

    Key Companies in the Niobium Capacitor Market market include

    Industry Developments

    May 2021: Auxico Resources Canada Inc. became a member of the Tantalum-Niobium International Study Centre. The organization includes 80 member companies from over 30 countries involved in the entire value chain of tantalum and niobium products. TIC membership provides Auxico Resources with valuable industry insights, market information, and access to research and data related to tantalum and niobium.

    February 2020: AVX Corporation launched an updated version of the SpiCAT Online Simulation Tool. The tool is widely used for accurate parametric characterization of the niobium oxide capacitors. The latest update increases reliability and enhances multi-functionality across domains.

    Future Outlook

    Niobium Capacitor Market Future Outlook

    The Global Niobium Capacitor Market is projected to grow at a 10.10% CAGR from 2025 to 2035, driven by advancements in electronics and increasing demand for energy-efficient solutions.

    New opportunities lie in:

    • Invest in R&D for high-capacity niobium capacitors targeting renewable energy applications.
    • Develop strategic partnerships with electronics manufacturers to enhance market penetration.
    • Explore emerging markets in Asia-Pacific for localized production and distribution.

    By 2035, the Niobium Capacitor Market is expected to achieve substantial growth, solidifying its position in the global electronics sector.

    Market Segmentation

    Niobium Capacitor Material Outlook

    • 10-100µF,
    • 100-300µF,
    • 300-470µF and
    • Above 470µF.Piezoelectric Polymer

    Niobium Capacitor Regional Outlook

    North America
    • US
    • Canada

    Niobium Capacitor Product Type Outlook

    • Solid Electrolytic Capacitor
    • Liquid Electrolytic Capacitor

    Niobium Capacitor End-use Industry Outlook

    • Consumer Electronics,
    • Automotive,
    • Industrial,
    • Aerospace and Defense,
    • Power & Energy and Others

    Report Scope

    Report Attribute/Metric Details
    Market Size 2024 USD 7.34 Billion
    Market Size 2025 USD 8.08 Billion
    Market Size 2035 21.16 (Value (USD Billion))
    Compound Annual Growth Rate (CAGR) 10.10% (2025 - 2035)
    Base Year 2024
    Market Forecast Period 2025 - 2035
    Historical Data 2020- 2023
    Market Forecast Units Value (USD Billion)
    Report Coverage Revenue Forecast, Market Competitive Landscape, Growth Factors, and Trends
    Segments Covered Product Type, Capacitance, Material, End-use Industry and Region
    Geographies Covered North America, Europe, Asia Pacific, and the Rest of the World
    Countries Covered The US, Canada, German, France, UK, Italy, Spain, China, Japan, India, Australia, South Korea, and Brazil
    Key Companies Profiled AMG NV, AVX Corporation, Illinois Capacitor, Toshiba Corporation, CBMM, NioCorp Developments, JX Nippon Mining & Metals, MITSUI Mining & Smelting Co. Ltd., Murata Manufacturing Co., Ltd., Kyocera Corporation
    Key Market Opportunities Heavy Demand from automotive, aerospace, electronics sectors. 
    Key Market Dynamics Research and development lead to advancements in capacitance materials, manufacturing techniques, and actuator designs.

    FAQs

    How much is the Niobium Capacitor market?

    The Niobium Capacitor Market size was valued at USD 7.34 billion in 2024.

    What is the growth rate of the Niobium Capacitor market?

    The global market is projected to grow at a CAGR of 10.10% during the forecast period, 2025 to 2035.

    Which region held the largest market share in the Niobium Capacitor market?

    North America had the largest share in the global market

    Who are the key players in the Niobium Capacitor market?

    The key players in the market are AMG NV, AVX Corporation, Illinois Capacitor, Toshiba Corporation, CBMM, NioCorp Developments, JX Nippon Mining & Metals, MITSUI Mining & Smelting Co. Ltd., Murata Manufacturing Co., Ltd., Kyocera Corporation.

    Which product Type led the Niobium Capacitor market?

    The Solid Electrolytic Capacitor category dominated the market in 2022.

    Which Material had the largest market share in the Niobium Capacitor market?

    The Niobium Oxide had the largest share in the global market.

    1. SECTION I: EXECUTIVE SUMMARY AND KEY HIGHLIGHTS
      1. | 1.1 EXECUTIVE SUMMARY
      2. | | 1.1.1 Market Overview
      3. | | 1.1.2 Key Findings
      4. | | 1.1.3 Market Segmentation
      5. | | 1.1.4 Competitive Landscape
      6. | | 1.1.5 Challenges and Opportunities
      7. | | 1.1.6 Future Outlook
    2. SECTION II: SCOPING, METHODOLOGY AND MARKET STRUCTURE
      1. | 2.1 MARKET INTRODUCTION
      2. | | 2.1.1 Definition
      3. | | 2.1.2 Scope of the study
      4. | | | 2.1.2.1 Research Objective
      5. | | | 2.1.2.2 Assumption
      6. | | | 2.1.2.3 Limitations
      7. | 2.2 RESEARCH METHODOLOGY
      8. | | 2.2.1 Overview
      9. | | 2.2.2 Data Mining
      10. | | 2.2.3 Secondary Research
      11. | | 2.2.4 Primary Research
      12. | | | 2.2.4.1 Primary Interviews and Information Gathering Process
      13. | | | 2.2.4.2 Breakdown of Primary Respondents
      14. | | 2.2.5 Forecasting Model
      15. | | 2.2.6 Market Size Estimation
      16. | | | 2.2.6.1 Bottom-Up Approach
      17. | | | 2.2.6.2 Top-Down Approach
      18. | | 2.2.7 Data Triangulation
      19. | | 2.2.8 Validation
    3. SECTION III: QUALITATIVE ANALYSIS
      1. | 3.1 MARKET DYNAMICS
      2. | | 3.1.1 Overview
      3. | | 3.1.2 Drivers
      4. | | 3.1.3 Restraints
      5. | | 3.1.4 Opportunities
      6. | 3.2 MARKET FACTOR ANALYSIS
      7. | | 3.2.1 Value chain Analysis
      8. | | 3.2.2 Porter's Five Forces Analysis
      9. | | | 3.2.2.1 Bargaining Power of Suppliers
      10. | | | 3.2.2.2 Bargaining Power of Buyers
      11. | | | 3.2.2.3 Threat of New Entrants
      12. | | | 3.2.2.4 Threat of Substitutes
      13. | | | 3.2.2.5 Intensity of Rivalry
      14. | | 3.2.3 COVID-19 Impact Analysis
      15. | | | 3.2.3.1 Market Impact Analysis
      16. | | | 3.2.3.2 Regional Impact
      17. | | | 3.2.3.3 Opportunity and Threat Analysis
    4. SECTION IV: QUANTITATIVE ANALYSIS
      1. | 4.1 Semiconductor & Electronics, BY Product Type (USD Billion)
      2. | | 4.1.1 Solid Electrolytic Capacitor
      3. | | 4.1.2 Liquid Electrolytic Capacitor
      4. | 4.2 Semiconductor & Electronics, BY Material (USD Billion)
      5. | | 4.2.1 Niobium Oxide
      6. | | 4.2.2 Niobium Pentoxide
      7. | | 4.2.3 Niobium Powders
      8. | | 4.2.4 Others
      9. | 4.3 Semiconductor & Electronics, BY Capacitance (USD Billion)
      10. | | 4.3.1 10-100µF
      11. | | 4.3.2 100-300µF
      12. | | 4.3.3 300-470µF
      13. | | 4.3.4 Above 470µF
      14. | 4.4 Semiconductor & Electronics, BY End-use Industry (USD Billion)
      15. | | 4.4.1 Consumer Electronics
      16. | | 4.4.2 Automotive
      17. | | 4.4.3 Industrial
      18. | | 4.4.4 Aerospace and Defense
      19. | | 4.4.5 Power and Energy
      20. | | 4.4.6 Others
      21. | 4.5 Semiconductor & Electronics, BY Region (USD Billion)
      22. | | 4.5.1 North America
      23. | | | 4.5.1.1 US
      24. | | | 4.5.1.2 Canada
      25. | | 4.5.2 Europe
      26. | | | 4.5.2.1 Germany
      27. | | | 4.5.2.2 UK
      28. | | | 4.5.2.3 France
      29. | | | 4.5.2.4 Russia
      30. | | | 4.5.2.5 Italy
      31. | | | 4.5.2.6 Spain
      32. | | | 4.5.2.7 Rest of Europe
      33. | | 4.5.3 APAC
      34. | | | 4.5.3.1 China
      35. | | | 4.5.3.2 India
      36. | | | 4.5.3.3 Japan
      37. | | | 4.5.3.4 South Korea
      38. | | | 4.5.3.5 Malaysia
      39. | | | 4.5.3.6 Thailand
      40. | | | 4.5.3.7 Indonesia
      41. | | | 4.5.3.8 Rest of APAC
      42. | | 4.5.4 South America
      43. | | | 4.5.4.1 Brazil
      44. | | | 4.5.4.2 Mexico
      45. | | | 4.5.4.3 Argentina
      46. | | | 4.5.4.4 Rest of South America
      47. | | 4.5.5 MEA
      48. | | | 4.5.5.1 GCC Countries
      49. | | | 4.5.5.2 South Africa
      50. | | | 4.5.5.3 Rest of MEA
    5. SECTION V: COMPETITIVE ANALYSIS
      1. | 5.1 Competitive Landscape
      2. | | 5.1.1 Overview
      3. | | 5.1.2 Competitive Analysis
      4. | | 5.1.3 Market share Analysis
      5. | | 5.1.4 Major Growth Strategy in the Semiconductor & Electronics
      6. | | 5.1.5 Competitive Benchmarking
      7. | | 5.1.6 Leading Players in Terms of Number of Developments in the Semiconductor & Electronics
      8. | | 5.1.7 Key developments and growth strategies
      9. | | | 5.1.7.1 New Product Launch/Service Deployment
      10. | | | 5.1.7.2 Merger & Acquisitions
      11. | | | 5.1.7.3 Joint Ventures
      12. | | 5.1.8 Major Players Financial Matrix
      13. | | | 5.1.8.1 Sales and Operating Income
      14. | | | 5.1.8.2 Major Players R&D Expenditure. 2023
      15. | 5.2 Company Profiles
      16. | | 5.2.1 KEMET Corporation (US)
      17. | | | 5.2.1.1 Financial Overview
      18. | | | 5.2.1.2 Products Offered
      19. | | | 5.2.1.3 Key Developments
      20. | | | 5.2.1.4 SWOT Analysis
      21. | | | 5.2.1.5 Key Strategies
      22. | | 5.2.2 Vishay Intertechnology, Inc. (US)
      23. | | | 5.2.2.1 Financial Overview
      24. | | | 5.2.2.2 Products Offered
      25. | | | 5.2.2.3 Key Developments
      26. | | | 5.2.2.4 SWOT Analysis
      27. | | | 5.2.2.5 Key Strategies
      28. | | 5.2.3 AVX Corporation (US)
      29. | | | 5.2.3.1 Financial Overview
      30. | | | 5.2.3.2 Products Offered
      31. | | | 5.2.3.3 Key Developments
      32. | | | 5.2.3.4 SWOT Analysis
      33. | | | 5.2.3.5 Key Strategies
      34. | | 5.2.4 Panasonic Corporation (JP)
      35. | | | 5.2.4.1 Financial Overview
      36. | | | 5.2.4.2 Products Offered
      37. | | | 5.2.4.3 Key Developments
      38. | | | 5.2.4.4 SWOT Analysis
      39. | | | 5.2.4.5 Key Strategies
      40. | | 5.2.5 Nichicon Corporation (JP)
      41. | | | 5.2.5.1 Financial Overview
      42. | | | 5.2.5.2 Products Offered
      43. | | | 5.2.5.3 Key Developments
      44. | | | 5.2.5.4 SWOT Analysis
      45. | | | 5.2.5.5 Key Strategies
      46. | | 5.2.6 Rubycon Corporation (JP)
      47. | | | 5.2.6.1 Financial Overview
      48. | | | 5.2.6.2 Products Offered
      49. | | | 5.2.6.3 Key Developments
      50. | | | 5.2.6.4 SWOT Analysis
      51. | | | 5.2.6.5 Key Strategies
      52. | | 5.2.7 Taiyo Yuden Co., Ltd. (JP)
      53. | | | 5.2.7.1 Financial Overview
      54. | | | 5.2.7.2 Products Offered
      55. | | | 5.2.7.3 Key Developments
      56. | | | 5.2.7.4 SWOT Analysis
      57. | | | 5.2.7.5 Key Strategies
      58. | | 5.2.8 Samsung Electro-Mechanics (KR)
      59. | | | 5.2.8.1 Financial Overview
      60. | | | 5.2.8.2 Products Offered
      61. | | | 5.2.8.3 Key Developments
      62. | | | 5.2.8.4 SWOT Analysis
      63. | | | 5.2.8.5 Key Strategies
      64. | | 5.2.9 WIMA GmbH (DE)
      65. | | | 5.2.9.1 Financial Overview
      66. | | | 5.2.9.2 Products Offered
      67. | | | 5.2.9.3 Key Developments
      68. | | | 5.2.9.4 SWOT Analysis
      69. | | | 5.2.9.5 Key Strategies
      70. | 5.3 Appendix
      71. | | 5.3.1 References
      72. | | 5.3.2 Related Reports
    6. LIST OF FIGURES
      1. | 6.1 MARKET SYNOPSIS
      2. | 6.2 NORTH AMERICA MARKET ANALYSIS
      3. | 6.3 US MARKET ANALYSIS BY PRODUCT TYPE
      4. | 6.4 US MARKET ANALYSIS BY MATERIAL
      5. | 6.5 US MARKET ANALYSIS BY CAPACITANCE
      6. | 6.6 US MARKET ANALYSIS BY END-USE INDUSTRY
      7. | 6.7 CANADA MARKET ANALYSIS BY PRODUCT TYPE
      8. | 6.8 CANADA MARKET ANALYSIS BY MATERIAL
      9. | 6.9 CANADA MARKET ANALYSIS BY CAPACITANCE
      10. | 6.10 CANADA MARKET ANALYSIS BY END-USE INDUSTRY
      11. | 6.11 EUROPE MARKET ANALYSIS
      12. | 6.12 GERMANY MARKET ANALYSIS BY PRODUCT TYPE
      13. | 6.13 GERMANY MARKET ANALYSIS BY MATERIAL
      14. | 6.14 GERMANY MARKET ANALYSIS BY CAPACITANCE
      15. | 6.15 GERMANY MARKET ANALYSIS BY END-USE INDUSTRY
      16. | 6.16 UK MARKET ANALYSIS BY PRODUCT TYPE
      17. | 6.17 UK MARKET ANALYSIS BY MATERIAL
      18. | 6.18 UK MARKET ANALYSIS BY CAPACITANCE
      19. | 6.19 UK MARKET ANALYSIS BY END-USE INDUSTRY
      20. | 6.20 FRANCE MARKET ANALYSIS BY PRODUCT TYPE
      21. | 6.21 FRANCE MARKET ANALYSIS BY MATERIAL
      22. | 6.22 FRANCE MARKET ANALYSIS BY CAPACITANCE
      23. | 6.23 FRANCE MARKET ANALYSIS BY END-USE INDUSTRY
      24. | 6.24 RUSSIA MARKET ANALYSIS BY PRODUCT TYPE
      25. | 6.25 RUSSIA MARKET ANALYSIS BY MATERIAL
      26. | 6.26 RUSSIA MARKET ANALYSIS BY CAPACITANCE
      27. | 6.27 RUSSIA MARKET ANALYSIS BY END-USE INDUSTRY
      28. | 6.28 ITALY MARKET ANALYSIS BY PRODUCT TYPE
      29. | 6.29 ITALY MARKET ANALYSIS BY MATERIAL
      30. | 6.30 ITALY MARKET ANALYSIS BY CAPACITANCE
      31. | 6.31 ITALY MARKET ANALYSIS BY END-USE INDUSTRY
      32. | 6.32 SPAIN MARKET ANALYSIS BY PRODUCT TYPE
      33. | 6.33 SPAIN MARKET ANALYSIS BY MATERIAL
      34. | 6.34 SPAIN MARKET ANALYSIS BY CAPACITANCE
      35. | 6.35 SPAIN MARKET ANALYSIS BY END-USE INDUSTRY
      36. | 6.36 REST OF EUROPE MARKET ANALYSIS BY PRODUCT TYPE
      37. | 6.37 REST OF EUROPE MARKET ANALYSIS BY MATERIAL
      38. | 6.38 REST OF EUROPE MARKET ANALYSIS BY CAPACITANCE
      39. | 6.39 REST OF EUROPE MARKET ANALYSIS BY END-USE INDUSTRY
      40. | 6.40 APAC MARKET ANALYSIS
      41. | 6.41 CHINA MARKET ANALYSIS BY PRODUCT TYPE
      42. | 6.42 CHINA MARKET ANALYSIS BY MATERIAL
      43. | 6.43 CHINA MARKET ANALYSIS BY CAPACITANCE
      44. | 6.44 CHINA MARKET ANALYSIS BY END-USE INDUSTRY
      45. | 6.45 INDIA MARKET ANALYSIS BY PRODUCT TYPE
      46. | 6.46 INDIA MARKET ANALYSIS BY MATERIAL
      47. | 6.47 INDIA MARKET ANALYSIS BY CAPACITANCE
      48. | 6.48 INDIA MARKET ANALYSIS BY END-USE INDUSTRY
      49. | 6.49 JAPAN MARKET ANALYSIS BY PRODUCT TYPE
      50. | 6.50 JAPAN MARKET ANALYSIS BY MATERIAL
      51. | 6.51 JAPAN MARKET ANALYSIS BY CAPACITANCE
      52. | 6.52 JAPAN MARKET ANALYSIS BY END-USE INDUSTRY
      53. | 6.53 SOUTH KOREA MARKET ANALYSIS BY PRODUCT TYPE
      54. | 6.54 SOUTH KOREA MARKET ANALYSIS BY MATERIAL
      55. | 6.55 SOUTH KOREA MARKET ANALYSIS BY CAPACITANCE
      56. | 6.56 SOUTH KOREA MARKET ANALYSIS BY END-USE INDUSTRY
      57. | 6.57 MALAYSIA MARKET ANALYSIS BY PRODUCT TYPE
      58. | 6.58 MALAYSIA MARKET ANALYSIS BY MATERIAL
      59. | 6.59 MALAYSIA MARKET ANALYSIS BY CAPACITANCE
      60. | 6.60 MALAYSIA MARKET ANALYSIS BY END-USE INDUSTRY
      61. | 6.61 THAILAND MARKET ANALYSIS BY PRODUCT TYPE
      62. | 6.62 THAILAND MARKET ANALYSIS BY MATERIAL
      63. | 6.63 THAILAND MARKET ANALYSIS BY CAPACITANCE
      64. | 6.64 THAILAND MARKET ANALYSIS BY END-USE INDUSTRY
      65. | 6.65 INDONESIA MARKET ANALYSIS BY PRODUCT TYPE
      66. | 6.66 INDONESIA MARKET ANALYSIS BY MATERIAL
      67. | 6.67 INDONESIA MARKET ANALYSIS BY CAPACITANCE
      68. | 6.68 INDONESIA MARKET ANALYSIS BY END-USE INDUSTRY
      69. | 6.69 REST OF APAC MARKET ANALYSIS BY PRODUCT TYPE
      70. | 6.70 REST OF APAC MARKET ANALYSIS BY MATERIAL
      71. | 6.71 REST OF APAC MARKET ANALYSIS BY CAPACITANCE
      72. | 6.72 REST OF APAC MARKET ANALYSIS BY END-USE INDUSTRY
      73. | 6.73 SOUTH AMERICA MARKET ANALYSIS
      74. | 6.74 BRAZIL MARKET ANALYSIS BY PRODUCT TYPE
      75. | 6.75 BRAZIL MARKET ANALYSIS BY MATERIAL
      76. | 6.76 BRAZIL MARKET ANALYSIS BY CAPACITANCE
      77. | 6.77 BRAZIL MARKET ANALYSIS BY END-USE INDUSTRY
      78. | 6.78 MEXICO MARKET ANALYSIS BY PRODUCT TYPE
      79. | 6.79 MEXICO MARKET ANALYSIS BY MATERIAL
      80. | 6.80 MEXICO MARKET ANALYSIS BY CAPACITANCE
      81. | 6.81 MEXICO MARKET ANALYSIS BY END-USE INDUSTRY
      82. | 6.82 ARGENTINA MARKET ANALYSIS BY PRODUCT TYPE
      83. | 6.83 ARGENTINA MARKET ANALYSIS BY MATERIAL
      84. | 6.84 ARGENTINA MARKET ANALYSIS BY CAPACITANCE
      85. | 6.85 ARGENTINA MARKET ANALYSIS BY END-USE INDUSTRY
      86. | 6.86 REST OF SOUTH AMERICA MARKET ANALYSIS BY PRODUCT TYPE
      87. | 6.87 REST OF SOUTH AMERICA MARKET ANALYSIS BY MATERIAL
      88. | 6.88 REST OF SOUTH AMERICA MARKET ANALYSIS BY CAPACITANCE
      89. | 6.89 REST OF SOUTH AMERICA MARKET ANALYSIS BY END-USE INDUSTRY
      90. | 6.90 MEA MARKET ANALYSIS
      91. | 6.91 GCC COUNTRIES MARKET ANALYSIS BY PRODUCT TYPE
      92. | 6.92 GCC COUNTRIES MARKET ANALYSIS BY MATERIAL
      93. | 6.93 GCC COUNTRIES MARKET ANALYSIS BY CAPACITANCE
      94. | 6.94 GCC COUNTRIES MARKET ANALYSIS BY END-USE INDUSTRY
      95. | 6.95 SOUTH AFRICA MARKET ANALYSIS BY PRODUCT TYPE
      96. | 6.96 SOUTH AFRICA MARKET ANALYSIS BY MATERIAL
      97. | 6.97 SOUTH AFRICA MARKET ANALYSIS BY CAPACITANCE
      98. | 6.98 SOUTH AFRICA MARKET ANALYSIS BY END-USE INDUSTRY
      99. | 6.99 REST OF MEA MARKET ANALYSIS BY PRODUCT TYPE
      100. | 6.100 REST OF MEA MARKET ANALYSIS BY MATERIAL
      101. | 6.101 REST OF MEA MARKET ANALYSIS BY CAPACITANCE
      102. | 6.102 REST OF MEA MARKET ANALYSIS BY END-USE INDUSTRY
      103. | 6.103 KEY BUYING CRITERIA OF SEMICONDUCTOR & ELECTRONICS
      104. | 6.104 RESEARCH PROCESS OF MRFR
      105. | 6.105 DRO ANALYSIS OF SEMICONDUCTOR & ELECTRONICS
      106. | 6.106 DRIVERS IMPACT ANALYSIS: SEMICONDUCTOR & ELECTRONICS
      107. | 6.107 RESTRAINTS IMPACT ANALYSIS: SEMICONDUCTOR & ELECTRONICS
      108. | 6.108 SUPPLY / VALUE CHAIN: SEMICONDUCTOR & ELECTRONICS
      109. | 6.109 SEMICONDUCTOR & ELECTRONICS, BY PRODUCT TYPE, 2024 (% SHARE)
      110. | 6.110 SEMICONDUCTOR & ELECTRONICS, BY PRODUCT TYPE, 2024 TO 2035 (USD Billion)
      111. | 6.111 SEMICONDUCTOR & ELECTRONICS, BY MATERIAL, 2024 (% SHARE)
      112. | 6.112 SEMICONDUCTOR & ELECTRONICS, BY MATERIAL, 2024 TO 2035 (USD Billion)
      113. | 6.113 SEMICONDUCTOR & ELECTRONICS, BY CAPACITANCE, 2024 (% SHARE)
      114. | 6.114 SEMICONDUCTOR & ELECTRONICS, BY CAPACITANCE, 2024 TO 2035 (USD Billion)
      115. | 6.115 SEMICONDUCTOR & ELECTRONICS, BY END-USE INDUSTRY, 2024 (% SHARE)
      116. | 6.116 SEMICONDUCTOR & ELECTRONICS, BY END-USE INDUSTRY, 2024 TO 2035 (USD Billion)
      117. | 6.117 BENCHMARKING OF MAJOR COMPETITORS
    7. LIST OF TABLES
      1. | 7.1 LIST OF ASSUMPTIONS
      2. | | 7.1.1
      3. | 7.2 North America MARKET SIZE ESTIMATES; FORECAST
      4. | | 7.2.1 BY PRODUCT TYPE, 2025-2035 (USD Billion)
      5. | | 7.2.2 BY MATERIAL, 2025-2035 (USD Billion)
      6. | | 7.2.3 BY CAPACITANCE, 2025-2035 (USD Billion)
      7. | | 7.2.4 BY END-USE INDUSTRY, 2025-2035 (USD Billion)
      8. | 7.3 US MARKET SIZE ESTIMATES; FORECAST
      9. | | 7.3.1 BY PRODUCT TYPE, 2025-2035 (USD Billion)
      10. | | 7.3.2 BY MATERIAL, 2025-2035 (USD Billion)
      11. | | 7.3.3 BY CAPACITANCE, 2025-2035 (USD Billion)
      12. | | 7.3.4 BY END-USE INDUSTRY, 2025-2035 (USD Billion)
      13. | 7.4 Canada MARKET SIZE ESTIMATES; FORECAST
      14. | | 7.4.1 BY PRODUCT TYPE, 2025-2035 (USD Billion)
      15. | | 7.4.2 BY MATERIAL, 2025-2035 (USD Billion)
      16. | | 7.4.3 BY CAPACITANCE, 2025-2035 (USD Billion)
      17. | | 7.4.4 BY END-USE INDUSTRY, 2025-2035 (USD Billion)
      18. | 7.5 Europe MARKET SIZE ESTIMATES; FORECAST
      19. | | 7.5.1 BY PRODUCT TYPE, 2025-2035 (USD Billion)
      20. | | 7.5.2 BY MATERIAL, 2025-2035 (USD Billion)
      21. | | 7.5.3 BY CAPACITANCE, 2025-2035 (USD Billion)
      22. | | 7.5.4 BY END-USE INDUSTRY, 2025-2035 (USD Billion)
      23. | 7.6 Germany MARKET SIZE ESTIMATES; FORECAST
      24. | | 7.6.1 BY PRODUCT TYPE, 2025-2035 (USD Billion)
      25. | | 7.6.2 BY MATERIAL, 2025-2035 (USD Billion)
      26. | | 7.6.3 BY CAPACITANCE, 2025-2035 (USD Billion)
      27. | | 7.6.4 BY END-USE INDUSTRY, 2025-2035 (USD Billion)
      28. | 7.7 UK MARKET SIZE ESTIMATES; FORECAST
      29. | | 7.7.1 BY PRODUCT TYPE, 2025-2035 (USD Billion)
      30. | | 7.7.2 BY MATERIAL, 2025-2035 (USD Billion)
      31. | | 7.7.3 BY CAPACITANCE, 2025-2035 (USD Billion)
      32. | | 7.7.4 BY END-USE INDUSTRY, 2025-2035 (USD Billion)
      33. | 7.8 France MARKET SIZE ESTIMATES; FORECAST
      34. | | 7.8.1 BY PRODUCT TYPE, 2025-2035 (USD Billion)
      35. | | 7.8.2 BY MATERIAL, 2025-2035 (USD Billion)
      36. | | 7.8.3 BY CAPACITANCE, 2025-2035 (USD Billion)
      37. | | 7.8.4 BY END-USE INDUSTRY, 2025-2035 (USD Billion)
      38. | 7.9 Russia MARKET SIZE ESTIMATES; FORECAST
      39. | | 7.9.1 BY PRODUCT TYPE, 2025-2035 (USD Billion)
      40. | | 7.9.2 BY MATERIAL, 2025-2035 (USD Billion)
      41. | | 7.9.3 BY CAPACITANCE, 2025-2035 (USD Billion)
      42. | | 7.9.4 BY END-USE INDUSTRY, 2025-2035 (USD Billion)
      43. | 7.10 Italy MARKET SIZE ESTIMATES; FORECAST
      44. | | 7.10.1 BY PRODUCT TYPE, 2025-2035 (USD Billion)
      45. | | 7.10.2 BY MATERIAL, 2025-2035 (USD Billion)
      46. | | 7.10.3 BY CAPACITANCE, 2025-2035 (USD Billion)
      47. | | 7.10.4 BY END-USE INDUSTRY, 2025-2035 (USD Billion)
      48. | 7.11 Spain MARKET SIZE ESTIMATES; FORECAST
      49. | | 7.11.1 BY PRODUCT TYPE, 2025-2035 (USD Billion)
      50. | | 7.11.2 BY MATERIAL, 2025-2035 (USD Billion)
      51. | | 7.11.3 BY CAPACITANCE, 2025-2035 (USD Billion)
      52. | | 7.11.4 BY END-USE INDUSTRY, 2025-2035 (USD Billion)
      53. | 7.12 Rest of Europe MARKET SIZE ESTIMATES; FORECAST
      54. | | 7.12.1 BY PRODUCT TYPE, 2025-2035 (USD Billion)
      55. | | 7.12.2 BY MATERIAL, 2025-2035 (USD Billion)
      56. | | 7.12.3 BY CAPACITANCE, 2025-2035 (USD Billion)
      57. | | 7.12.4 BY END-USE INDUSTRY, 2025-2035 (USD Billion)
      58. | 7.13 APAC MARKET SIZE ESTIMATES; FORECAST
      59. | | 7.13.1 BY PRODUCT TYPE, 2025-2035 (USD Billion)
      60. | | 7.13.2 BY MATERIAL, 2025-2035 (USD Billion)
      61. | | 7.13.3 BY CAPACITANCE, 2025-2035 (USD Billion)
      62. | | 7.13.4 BY END-USE INDUSTRY, 2025-2035 (USD Billion)
      63. | 7.14 China MARKET SIZE ESTIMATES; FORECAST
      64. | | 7.14.1 BY PRODUCT TYPE, 2025-2035 (USD Billion)
      65. | | 7.14.2 BY MATERIAL, 2025-2035 (USD Billion)
      66. | | 7.14.3 BY CAPACITANCE, 2025-2035 (USD Billion)
      67. | | 7.14.4 BY END-USE INDUSTRY, 2025-2035 (USD Billion)
      68. | 7.15 India MARKET SIZE ESTIMATES; FORECAST
      69. | | 7.15.1 BY PRODUCT TYPE, 2025-2035 (USD Billion)
      70. | | 7.15.2 BY MATERIAL, 2025-2035 (USD Billion)
      71. | | 7.15.3 BY CAPACITANCE, 2025-2035 (USD Billion)
      72. | | 7.15.4 BY END-USE INDUSTRY, 2025-2035 (USD Billion)
      73. | 7.16 Japan MARKET SIZE ESTIMATES; FORECAST
      74. | | 7.16.1 BY PRODUCT TYPE, 2025-2035 (USD Billion)
      75. | | 7.16.2 BY MATERIAL, 2025-2035 (USD Billion)
      76. | | 7.16.3 BY CAPACITANCE, 2025-2035 (USD Billion)
      77. | | 7.16.4 BY END-USE INDUSTRY, 2025-2035 (USD Billion)
      78. | 7.17 South Korea MARKET SIZE ESTIMATES; FORECAST
      79. | | 7.17.1 BY PRODUCT TYPE, 2025-2035 (USD Billion)
      80. | | 7.17.2 BY MATERIAL, 2025-2035 (USD Billion)
      81. | | 7.17.3 BY CAPACITANCE, 2025-2035 (USD Billion)
      82. | | 7.17.4 BY END-USE INDUSTRY, 2025-2035 (USD Billion)
      83. | 7.18 Malaysia MARKET SIZE ESTIMATES; FORECAST
      84. | | 7.18.1 BY PRODUCT TYPE, 2025-2035 (USD Billion)
      85. | | 7.18.2 BY MATERIAL, 2025-2035 (USD Billion)
      86. | | 7.18.3 BY CAPACITANCE, 2025-2035 (USD Billion)
      87. | | 7.18.4 BY END-USE INDUSTRY, 2025-2035 (USD Billion)
      88. | 7.19 Thailand MARKET SIZE ESTIMATES; FORECAST
      89. | | 7.19.1 BY PRODUCT TYPE, 2025-2035 (USD Billion)
      90. | | 7.19.2 BY MATERIAL, 2025-2035 (USD Billion)
      91. | | 7.19.3 BY CAPACITANCE, 2025-2035 (USD Billion)
      92. | | 7.19.4 BY END-USE INDUSTRY, 2025-2035 (USD Billion)
      93. | 7.20 Indonesia MARKET SIZE ESTIMATES; FORECAST
      94. | | 7.20.1 BY PRODUCT TYPE, 2025-2035 (USD Billion)
      95. | | 7.20.2 BY MATERIAL, 2025-2035 (USD Billion)
      96. | | 7.20.3 BY CAPACITANCE, 2025-2035 (USD Billion)
      97. | | 7.20.4 BY END-USE INDUSTRY, 2025-2035 (USD Billion)
      98. | 7.21 Rest of APAC MARKET SIZE ESTIMATES; FORECAST
      99. | | 7.21.1 BY PRODUCT TYPE, 2025-2035 (USD Billion)
      100. | | 7.21.2 BY MATERIAL, 2025-2035 (USD Billion)
      101. | | 7.21.3 BY CAPACITANCE, 2025-2035 (USD Billion)
      102. | | 7.21.4 BY END-USE INDUSTRY, 2025-2035 (USD Billion)
      103. | 7.22 South America MARKET SIZE ESTIMATES; FORECAST
      104. | | 7.22.1 BY PRODUCT TYPE, 2025-2035 (USD Billion)
      105. | | 7.22.2 BY MATERIAL, 2025-2035 (USD Billion)
      106. | | 7.22.3 BY CAPACITANCE, 2025-2035 (USD Billion)
      107. | | 7.22.4 BY END-USE INDUSTRY, 2025-2035 (USD Billion)
      108. | 7.23 Brazil MARKET SIZE ESTIMATES; FORECAST
      109. | | 7.23.1 BY PRODUCT TYPE, 2025-2035 (USD Billion)
      110. | | 7.23.2 BY MATERIAL, 2025-2035 (USD Billion)
      111. | | 7.23.3 BY CAPACITANCE, 2025-2035 (USD Billion)
      112. | | 7.23.4 BY END-USE INDUSTRY, 2025-2035 (USD Billion)
      113. | 7.24 Mexico MARKET SIZE ESTIMATES; FORECAST
      114. | | 7.24.1 BY PRODUCT TYPE, 2025-2035 (USD Billion)
      115. | | 7.24.2 BY MATERIAL, 2025-2035 (USD Billion)
      116. | | 7.24.3 BY CAPACITANCE, 2025-2035 (USD Billion)
      117. | | 7.24.4 BY END-USE INDUSTRY, 2025-2035 (USD Billion)
      118. | 7.25 Argentina MARKET SIZE ESTIMATES; FORECAST
      119. | | 7.25.1 BY PRODUCT TYPE, 2025-2035 (USD Billion)
      120. | | 7.25.2 BY MATERIAL, 2025-2035 (USD Billion)
      121. | | 7.25.3 BY CAPACITANCE, 2025-2035 (USD Billion)
      122. | | 7.25.4 BY END-USE INDUSTRY, 2025-2035 (USD Billion)
      123. | 7.26 Rest of South America MARKET SIZE ESTIMATES; FORECAST
      124. | | 7.26.1 BY PRODUCT TYPE, 2025-2035 (USD Billion)
      125. | | 7.26.2 BY MATERIAL, 2025-2035 (USD Billion)
      126. | | 7.26.3 BY CAPACITANCE, 2025-2035 (USD Billion)
      127. | | 7.26.4 BY END-USE INDUSTRY, 2025-2035 (USD Billion)
      128. | 7.27 MEA MARKET SIZE ESTIMATES; FORECAST
      129. | | 7.27.1 BY PRODUCT TYPE, 2025-2035 (USD Billion)
      130. | | 7.27.2 BY MATERIAL, 2025-2035 (USD Billion)
      131. | | 7.27.3 BY CAPACITANCE, 2025-2035 (USD Billion)
      132. | | 7.27.4 BY END-USE INDUSTRY, 2025-2035 (USD Billion)
      133. | 7.28 GCC Countries MARKET SIZE ESTIMATES; FORECAST
      134. | | 7.28.1 BY PRODUCT TYPE, 2025-2035 (USD Billion)
      135. | | 7.28.2 BY MATERIAL, 2025-2035 (USD Billion)
      136. | | 7.28.3 BY CAPACITANCE, 2025-2035 (USD Billion)
      137. | | 7.28.4 BY END-USE INDUSTRY, 2025-2035 (USD Billion)
      138. | 7.29 South Africa MARKET SIZE ESTIMATES; FORECAST
      139. | | 7.29.1 BY PRODUCT TYPE, 2025-2035 (USD Billion)
      140. | | 7.29.2 BY MATERIAL, 2025-2035 (USD Billion)
      141. | | 7.29.3 BY CAPACITANCE, 2025-2035 (USD Billion)
      142. | | 7.29.4 BY END-USE INDUSTRY, 2025-2035 (USD Billion)
      143. | 7.30 Rest of MEA MARKET SIZE ESTIMATES; FORECAST
      144. | | 7.30.1 BY PRODUCT TYPE, 2025-2035 (USD Billion)
      145. | | 7.30.2 BY MATERIAL, 2025-2035 (USD Billion)
      146. | | 7.30.3 BY CAPACITANCE, 2025-2035 (USD Billion)
      147. | | 7.30.4 BY END-USE INDUSTRY, 2025-2035 (USD Billion)
      148. | 7.31 PRODUCT LAUNCH/PRODUCT DEVELOPMENT/APPROVAL
      149. | | 7.31.1
      150. | 7.32 ACQUISITION/PARTNERSHIP
      151. | | 7.32.1

    Niobium Capacitor Market Segmentation

    Niobium Capacitor Product Type Outlook (USD Billion, 2020-2034)

    • Solid Electrolytic Capacitor
    • Liquid Electrolytic Capacitor

    Niobium Capacitor Material Outlook (USD Billion, 2020-2034)

    • Niobium Oxide
    • Niobium Pentoxide
    • Niobium Powders
    • Others

    Niobium Capacitor Capacitance Outlook (USD Billion, 2020-2034)

    • 10-100µFs
    • 100-300µF
    • 300-470µF
    • Above 470µF

    Niobium Capacitor End-use Industry Outlook (USD Billion, 2020-2034)

    • Consumer Electronics
    • Automotive
    • Industrial
    • Aerospace and Defense
    • Power and Energy
    • Others

    Niobium Capacitor Regional Outlook (USD Billion, 2020-2034)

    • North America Outlook (USD Billion, 2020-2034)
      • North America Niobium Capacitor by Product Type
        • Solid Electrolytic Capacitor
        • Liquid Electrolytic Capacitor
      • North America Niobium Capacitor by Material
        • Niobium Oxide
        • Niobium Pentoxide
        • Niobium Powders
        • Others
      • North America Niobium Capacitor by Capacitance
        • 10-100µF
        • 100-300µF
        • 300-470µF
        • Above 470µF
      • North America Niobium Capacitor by End-use Industry
        • Consumer Electronics
        • Automotive
        • Industrial
        • Aerospace and Defense
        • Power and Energy
        • Others
      • US Outlook (USD Billion, 2020-2034)
      • US Niobium Capacitor by Product Type
        • Solid Electrolytic Capacitor
        • Liquid Electrolytic Capacitor
      • US Niobium Capacitor by Material
        • Niobium Oxide
        • Niobium Pentoxide
        • Niobium Powders
        • Others
      • US Niobium Capacitor by Capacitance
        • 10-100µF
        • 100-300µF
        • 300-470µF
        • Above 470µF
      • US Niobium Capacitor by End-use Industry
        • Consumer Electronics
        • Automotive
        • Industrial
        • Aerospace and Defense
        • Power and Energy
        • Others
      • CANADA Outlook (USD Billion, 2020-2034)
      • Canada Niobium Capacitor by Product Type
        • Solid Electrolytic Capacitor
        • Liquid Electrolytic Capacitor
      • Canada Niobium Capacitor by Material
        • Niobium Oxide
        • Niobium Pentoxide
        • Niobium Powders
        • Others
      • Canada Niobium Capacitor by Capacitance
        • 10-100µF
        • 100-300µF
        • 300-470µF
        • Above 470µF
      • Canada Niobium Capacitor by End-use Industry
        • Consumer Electronics
        • Automotive
        • Industrial
        • Aerospace and Defense
        • Power and Energy
        • Others
      • Europe Outlook (USD Billion, 2020-2034)
        • Europe Niobium Capacitor by Product Type
          • Solid Electrolytic Capacitor
          • Liquid Electrolytic Capacitor
        • Europe Niobium Capacitor by Material
          • Niobium Oxide
          • Niobium Pentoxide
          • Niobium Powders
          • Others
        • Europe Niobium Capacitor by Capacitance
          • 10-100µF
          • 100-300µF
          • 300-470µF
          • Above 470µF
        • Europe Niobium Capacitor by End-use Industry
          • Consumer Electronics
          • Automotive
          • Industrial
          • Aerospace and Defense
          • Power and Energy
          • Others
        • Germany Outlook (USD Billion, 2020-2034)
        • Germany Niobium Capacitor by Product Type
          • Solid Electrolytic Capacitor
          • Liquid Electrolytic Capacitor
        • Germany Niobium Capacitor by Material
          • Niobium Oxide
          • Niobium Pentoxide
          • Niobium Powders
          • Others
        • Germany Niobium Capacitor by Capacitance
          • 10-100µF
          • 100-300µF
          • 300-470µF
          • Above 470µF
        • Germany Niobium Capacitor by End-use Industry
          • Consumer Electronics
          • Automotive
          • Industrial
          • Aerospace and Defense
          • Power and Energy
          • Others
        • France Outlook (USD Billion, 2020-2034)
        • France Niobium Capacitor by Product Type
          • Solid Electrolytic Capacitor
          • Liquid Electrolytic Capacitor
        • France Niobium Capacitor by Material
          • Niobium Oxide
          • Niobium Pentoxide
          • Niobium Powders
          • Others
        • France Niobium Capacitor by Capacitance
          • 10-100µF
          • 100-300µF
          • 300-470µF
          • Above 470µF
        • France Niobium Capacitor by End-use Industry
          • Consumer Electronics
          • Automotive
          • Industrial
          • Aerospace and Defense
          • Power and Energy
          • Others
        • UK Outlook (USD Billion, 2020-2034)
        • UK Niobium Capacitor by Product Type
          • Solid Electrolytic Capacitor
          • Liquid Electrolytic Capacitor
        • UK Niobium Capacitor by Material
          • Niobium Oxide
          • Niobium Pentoxide
          • Niobium Powders
          • Others
        • UK Niobium Capacitor by Capacitance
          • 10-100µF
          • 100-300µF
          • 300-470µF
          • Above 470µF
        • UK Niobium Capacitor by End-use Industry
          • Consumer Electronics
          • Automotive
          • Industrial
          • Aerospace and Defense
          • Power and Energy
          • Others
        • ITALY Outlook (USD Billion, 2020-2034)
        • Italy Niobium Capacitor by Product Type
          • Solid Electrolytic Capacitor
          • Liquid Electrolytic Capacitor
        • Italy Niobium Capacitor by Material
          • Niobium Oxide
          • Niobium Pentoxide
          • Niobium Powders
          • Others
        • Italy Niobium Capacitor by Capacitance
          • 10-100µF
          • 100-300µF
          • 300-470µF
          • Above 470µF
        • Italy Niobium Capacitor by End-use Industry
          • Consumer Electronics
          • Automotive
          • Industrial
          • Aerospace and Defense
          • Power and Energy
          • Others
        • SPAIN Outlook (USD Billion, 2020-2034)
        • Spain Niobium Capacitor by Product Type
          • Solid Electrolytic Capacitor
          • Liquid Electrolytic Capacitor
        • Spain Niobium Capacitor by Material
          • Niobium Oxide
          • Niobium Pentoxide
          • Niobium Powders
          • Others
        • Spain Niobium Capacitor by Capacitance
          • 10-100µF
          • 100-300µF
          • 300-470µF
          • Above 470µF
        • Spain Niobium Capacitor by End-use Industry
          • Consumer Electronics
          • Automotive
          • Industrial
          • Aerospace and Defense
          • Power and Energy
          • Others
        • Rest Of Europe Outlook (USD Billion, 2020-2034)
        • Rest of Europe Niobium Capacitor by Product Type
          • Solid Electrolytic Capacitor
          • Liquid Electrolytic Capacitor
        • Rest of Europe Niobium Capacitor by Material
          • Niobium Oxide
          • Niobium Pentoxide
          • Niobium Powders and Others
        • Rest of Europe Niobium Capacitor by Capacitance
          • 10-100µF
          • 100-300µF
          • 300-470µF
          • Above 470µF
        • Rest of Europe Niobium Capacitor by End-use Industry
          • Consumer Electronics
          • Automotive
          • Industrial
          • Aerospace and Defense
          • Power and Energy
          • Others
        • Asia-Pacific Outlook (USD Billion, 2020-2034)
          • Asia-Pacific Niobium Capacitor by Product Type
            • Solid Electrolytic Capacitor
            • Liquid Electrolytic Capacitor
          • Asia-Pacific Niobium Capacitor by Material
            • Niobium Oxide
            • Niobium Pentoxide
            • Niobium Powders
            • Others
          • Asia-Pacific Niobium Capacitor by Capacitance
            • 10-100µF
            • 100-300µF
            • 300-470µF
            • Above 470µF
          • Asia-Pacific Niobium Capacitor by End-use Industry
            • Consumer Electronics
            • Automotive
            • Industrial
            • Aerospace and Defense
            • Power and Energy
            • Others
          • China Outlook (USD Billion, 2020-2034)
          • China Niobium Capacitor by Product Type
            • Solid Electrolytic Capacitor
            • Liquid Electrolytic Capacitor
          • China Niobium Capacitor by Material
            • Niobium Oxide
            • Niobium Pentoxide
            • Niobium Powders
            • Others
          • China Niobium Capacitor by Capacitance
            • 10-100µF
            • 100-300µF
            • 300-470µF
            • Above 470µF
          • China Niobium Capacitor by End-use Industry
            • Consumer Electronics
            • Automotive
            • Industrial
            • Aerospace and Defense
            • Power and Energy
            • Others
          • Japan Outlook (USD Billion, 2020-2034)
          • Japan Niobium Capacitor by Product Type
            • Solid Electrolytic Capacitor
            • Liquid Electrolytic Capacitor
          • Japan Niobium Capacitor by Material
            • Niobium Oxide
            • Niobium Pentoxide
            • Niobium Powders
            • Others
          • Japan Niobium Capacitor by Capacitance
            • 10-100µF
            • 100-300µF
            • 300-470µF
            • Above 470µF
          • Japan Niobium Capacitor by End-use Industry
            • Consumer Electronics
            • Automotive
            • Industrial
            • Aerospace and Defense
            • Power and Energy
            • Others
          • India Outlook (USD Billion, 2020-2034)
          • India Niobium Capacitor by Product Type
            • Solid Electrolytic Capacitor
            • Liquid Electrolytic Capacitor
          • India Niobium Capacitor by Material
            • Niobium Oxide
            • Niobium Pentoxide
            • Niobium Powders
            • Others
          • India Niobium Capacitor by Capacitance
            • 10-100µF
            • 100-300µF
            • 300-470µF
            • Above 470µF
          • India Niobium Capacitor by End-use Industry
            • Consumer Electronics
            • Automotive
            • Industrial
            • Aerospace and Defense
            • Power and Energy
            • Others
          • Australia Outlook (USD Billion, 2020-2034)
          • Australia Niobium Capacitor by Product Type
            • Solid Electrolytic Capacitor
            • Liquid Electrolytic Capacitor
          • Australia Niobium Capacitor by Material
            • Niobium Oxide
            • Niobium Pentoxide
            • Niobium Powders
            • Others
          • Australia Niobium Capacitor by Capacitance
            • 10-100µF
            • 100-300µF
            • 300-470µF
            • Above 470µF
          • Australia Niobium Capacitor by End-use Industry
            • Consumer Electronics
            • Automotive
            • Industrial
            • Aerospace and Defense
            • Power and Energy
            • Others
          • Rest of Asia-Pacific Outlook (USD Billion, 2020-2034)
          • Rest of Asia-Pacific Niobium Capacitor by Product Type
            • Solid Electrolytic Capacitor
            • Liquid Electrolytic Capacitor
          • Rest of Asia-Pacific Niobium Capacitor by Material
            • Niobium Oxide
            • Niobium Pentoxide
            • Niobium Powders
            • Others
          • Rest of Asia-Pacific Niobium Capacitor by Capacitance
            • 10-100µF
            • 100-300µF
            • 300-470µF
            • Above 470µF
          • Rest of Asia-Pacific Niobium Capacitor by End-use Industry
            • Consumer Electronics
            • Automotive
            • Industrial
            • Aerospace and Defense
            • Power and Energy
            • Others
          • Rest of the World Outlook (USD Billion, 2020-2034)
            • Rest of the World Niobium Capacitor by Product Type
              • Solid Electrolytic Capacitor
              • Liquid Electrolytic Capacitor
            • Rest of the World Niobium Capacitor by Material
              • Niobium Oxide
              • Niobium Pentoxide
              • Niobium Powders
              • Others
            • Rest of the World Niobium Capacitor by Capacitance
              • 10-100µF
              • 100-300µF
              • 300-470µF
              • Above 470µF
            • Rest of the World Niobium Capacitor by End-use Industry
              • Consumer Electronics
              • Automotive
              • Industrial
              • Aerospace and Defense
              • Power and Energy
              • Others
            • Middle East Outlook (USD Billion, 2020-2034)
            • Middle East Niobium Capacitor by Product Type
              • Solid Electrolytic Capacitor
              • Liquid Electrolytic Capacitor
            • Middle East Niobium Capacitor by Material
              • Niobium Oxide
              • Niobium Pentoxide
              • Niobium Powders
              • Others
            • Middle East Niobium Capacitor by Capacitance
              • 10-100µF
              • 100-300µF
              • 300-470µF
              • Above 470µF
            • Middle East Niobium Capacitor by End-use Industry
              • Consumer Electronics
              • Automotive
              • Industrial
              • Aerospace and Defense
              • Power and Energy
              • Others
            • Africa Outlook (USD Billion, 2020-2034)
            • Africa Niobium Capacitor by Product Type
              • Solid Electrolytic Capacitor
              • Liquid Electrolytic Capacitor
            • Africa Niobium Capacitor by Material
              • Niobium Oxide
              • Niobium Pentoxide
              • Niobium Powders
              • Others
            • Africa Niobium Capacitor by Capacitance
              • 10-100µF
              • 100-300µF
              • 300-470µF
              • Above 470µF
            • Africa Niobium Capacitor by End-use Industry
              • Consumer Electronics
              • Automotive
              • Industrial
              • Aerospace and Defense
              • Power and Energy
              • Others
            • Latin America Outlook (USD Billion, 2020-2034)
            • Latin America Niobium Capacitor by Product Type
              • Solid Electrolytic Capacitor
              • Liquid Electrolytic Capacitor
            • Latin America Niobium Capacitor by Material
              • Niobium Oxide
              • Niobium Pentoxide
              • Niobium Powders
              • Others
            • Latin America Niobium Capacitor by Capacitance
              • 10-100µF
              • 100-300µF
              • 300-470µF
              • Above 470µF
            • Latin America Niobium Capacitor by End-use Industry
              • Consumer Electronics
              • Automotive
              • Industrial
              • Aerospace and Defense
              • Power and Energy
              • Others
    Infographic

    Free Sample Request

    Kindly complete the form below to receive a free sample of this Report

    Get Free Sample

    Customer Strories

    “I am very pleased with how market segments have been defined in a relevant way for my purposes (such as "Portable Freezers & refrigerators" and "last-mile"). In general the report is well structured. Thanks very much for your efforts.”

    Victoria Milne

    Founder
    Case Study
    Chemicals and Materials

    Compare Licence

    ×
    Features License Type
    Single User Multiuser License Enterprise User
    Price $4,950 $5,950 $7,250
    Maximum User Access Limit 1 User Upto 10 Users Unrestricted Access Throughout the Organization
    Free Customization
    Direct Access to Analyst
    Deliverable Format
    Platform Access
    Discount on Next Purchase 10% 15% 15%
    Printable Versions