• Cat-intel
  • MedIntelliX
  • Resources
  • About Us
  • Hero Background
    English
    Chinese
    French
    Japanese
    Korean
    German
    Spanish

    Neuromorphic Computing Market Size

    ID: MRFR/ICT/3674-CR
    200 Pages
    Aarti Dhapte
    July 2025

    Neuromorphic Computing Market Research Report By Technology Type (Analog Neuromorphic Computing, Digital Neuromorphic Computing, Hybrid Neuromorphic Computing), By Application (Robotics, Natural Language Processing, Computer Vision, Automotive Applications), By End-use (Consumer Electronics, Healthcare, Aerospace and Defense, Industrial Automation), By Component (Hardware, Software, Services), ...

    Share:
    Download PDF ×

    We do not share your information with anyone. However, we may send you emails based on your report interest from time to time. You may contact us at any time to opt-out.

    Neuromorphic Computing Market Infographic
    Purchase Options

    Neuromorphic Computing Size

    Neuromorphic Computing Market Growth Projections and Opportunities

    In the rapidly evolving landscape of technology, the Neuromorphic Computing Market has emerged as a focal point for innovation and competition. Neuromorphic computing, inspired by the human brain's structure and function, is gaining momentum as a promising approach to advancing artificial intelligence. As companies vie for a significant share in this burgeoning market, strategic positioning becomes paramount.

    One prevalent market share positioning strategy is differentiation, where companies distinguish their offerings from competitors through unique features or capabilities. In the realm of neuromorphic computing, this could involve the development of specialized hardware architectures, proprietary algorithms, or integration with other emerging technologies. By emphasizing distinct advantages, companies aim to carve out a niche for themselves and appeal to specific segments of the market.

    Another strategic avenue is cost leadership, where companies focus on becoming the most cost-efficient players in the market. This approach involves optimizing production processes, sourcing materials efficiently, and leveraging economies of scale. In the context of neuromorphic computing, achieving cost leadership could be pivotal in attracting a broad customer base, especially as the technology becomes more widespread and accessible.

    Market segmentation is a nuanced strategy that involves tailoring products or services to meet the unique needs of specific customer groups. In the Neuromorphic Computing Market, companies may identify distinct user segments based on industries, applications, or computing requirements. By customizing their offerings to cater to these segments, companies can deepen their market penetration and establish themselves as leaders in specialized niches.

    Collaboration and partnerships represent yet another strategy for market share positioning in the Neuromorphic Computing Market. Given the interdisciplinary nature of neuromorphic computing, collaboration with other technology companies, research institutions, or industry players can lead to synergies that accelerate innovation. By forming strategic alliances, companies can pool resources, share expertise, and collectively address challenges, ultimately strengthening their market position.

    Timing can be a critical factor in market share positioning, especially in fast-paced industries. Early entrants into the Neuromorphic Computing Market may gain a first-mover advantage, establishing brand recognition and capturing a significant portion of the market share. However, late entrants can still succeed by offering improvements, innovations, or cost advantages that set them apart from established players.

    Additionally, a customer-centric approach is essential for long-term market share sustainability. Understanding and responding to customer needs, feedback, and evolving preferences can contribute to building a loyal customer base. Companies that prioritize user experience, provide excellent customer support, and iterate their products based on customer input are likely to secure a more robust market position.

    Neuromorphic Computing Market Size Graph
    Author
    Aarti Dhapte
    Team Lead - Research

    She holds an experience of about 6+ years in Market Research and Business Consulting, working under the spectrum of Information Communication Technology, Telecommunications and Semiconductor domains. Aarti conceptualizes and implements a scalable business strategy and provides strategic leadership to the clients. Her expertise lies in market estimation, competitive intelligence, pipeline analysis, customer assessment, etc.

    Leave a Comment

    FAQs

    What is the projected market valuation of the Neuromorphic Computing Market by 2035?

    The Neuromorphic Computing Market is projected to reach a valuation of 17.3 USD Billion by 2035.

    What was the market valuation of the Neuromorphic Computing Market in 2024?

    In 2024, the Neuromorphic Computing Market had a valuation of 2.77 USD Billion.

    What is the expected CAGR for the Neuromorphic Computing Market during the forecast period 2025 - 2035?

    The expected CAGR for the Neuromorphic Computing Market during the forecast period 2025 - 2035 is 18.12%.

    Which technology type segment is anticipated to grow the most in the Neuromorphic Computing Market?

    Digital Neuromorphic Computing is anticipated to grow significantly, with a projected increase from 1.1 USD Billion to 7.5 USD Billion.

    What are the key applications driving the Neuromorphic Computing Market?

    Key applications include Robotics, Natural Language Processing, Computer Vision, and Automotive Applications, with Robotics expected to grow from 0.83 USD Billion to 4.95 USD Billion.

    Which end-use segment is expected to have the highest valuation in the Neuromorphic Computing Market?

    The Consumer Electronics segment is expected to have the highest valuation, projected to grow from 0.83 USD Billion to 5.25 USD Billion.

    Who are the leading players in the Neuromorphic Computing Market?

    Key players in the Neuromorphic Computing Market include IBM, Intel, BrainChip, Qualcomm, NVIDIA, Samsung, Micron Technology, University of Manchester, and HRL Laboratories.

    What is the projected growth for the Hardware component in the Neuromorphic Computing Market?

    The Hardware component is projected to grow from 1.39 USD Billion to 8.5 USD Billion.

    How does the Neuromorphic Computing Market's growth compare across different components?

    The Software component is expected to grow from 0.83 USD Billion to 5.1 USD Billion, while Services may increase from 0.55 USD Billion to 3.7 USD Billion.

    What trends are influencing the Neuromorphic Computing Market's expansion?

    Trends such as advancements in AI, increased demand for efficient computing solutions, and applications in various sectors are influencing the Neuromorphic Computing Market's expansion.

    Market Summary

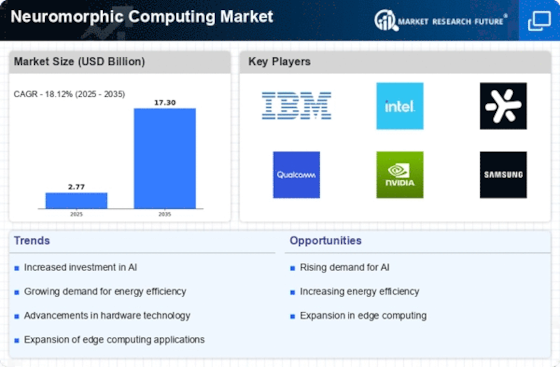
    As per MRFR analysis, the Neuromorphic Computing Market Size was estimated at 2.77 USD Billion in 2024. The Neuromorphic Computing industry is projected to grow from 3.272 USD Billion in 2025 to 17.3 USD Billion by 2035, exhibiting a compound annual growth rate (CAGR) of 18.12 during the forecast period 2025 - 2035.

    Key Market Trends & Highlights

    The Neuromorphic Computing Market is poised for substantial growth driven by advancements in AI and energy efficiency.

    • The market experiences increased adoption in AI applications, particularly in North America, which remains the largest market. Energy efficiency emerges as a focal point, influencing the design and implementation of neuromorphic systems across various sectors. Research collaborations expand, fostering innovation and development in both Digital and Hybrid Neuromorphic Computing segments. Rising demand for advanced computing solutions and technological advancements in hardware drive growth, particularly in Natural Language Processing and Computer Vision applications.

    Market Size & Forecast

    2024 Market Size 2.77 (USD Billion)
    2035 Market Size 17.3 (USD Billion)
    CAGR (2025 - 2035) 18.12%
    Largest Regional Market Share in 2024 North America

    Major Players

    <p>IBM (US), Intel (US), BrainChip (AU), Qualcomm (US), NVIDIA (US), Samsung (KR), Micron Technology (US), University of Manchester (GB), HRL Laboratories (US)</p>

    Market Trends

    The Neuromorphic Computing Market is currently experiencing a transformative phase, characterized by the integration of advanced technologies that mimic the neural structures of the human brain. This innovative approach to computing is gaining traction due to its potential to enhance processing efficiency and reduce energy consumption. As organizations increasingly seek solutions that can handle complex data and perform real-time analytics, neuromorphic systems appear to offer a compelling alternative to traditional computing architectures. The growing interest in artificial intelligence and machine learning further propels the demand for neuromorphic solutions, as these technologies require sophisticated processing capabilities that align well with the principles of neuromorphic design. Moreover, the Neuromorphic Computing Market is witnessing a surge in research and development activities, driven by both academic institutions and private enterprises. Collaborations between technology firms and research organizations seem to be fostering innovation, leading to the emergence of novel applications across various sectors, including healthcare, automotive, and robotics. As the market evolves, it is likely that neuromorphic computing will play a pivotal role in shaping the future of intelligent systems, enabling more adaptive and efficient solutions. The ongoing advancements in hardware and software are expected to further enhance the capabilities of neuromorphic systems, making them increasingly viable for widespread adoption in the coming years.

    Increased Adoption in AI Applications

    The Neuromorphic Computing Market is witnessing heightened interest from sectors focused on artificial intelligence. Organizations are exploring neuromorphic systems for their ability to process information in a manner akin to human cognition, which may lead to more intuitive AI applications.

    Focus on Energy Efficiency

    A notable trend within the Neuromorphic Computing Market is the emphasis on energy-efficient computing solutions. As energy costs rise and environmental concerns grow, neuromorphic architectures are being recognized for their potential to significantly reduce power consumption compared to conventional systems.

    Expansion in Research Collaborations

    The landscape of the Neuromorphic Computing Market is evolving through increased collaborations between academia and industry. These partnerships are fostering innovation and accelerating the development of neuromorphic technologies, potentially leading to breakthroughs in various applications.

    <p>The evolution of neuromorphic computing technology appears to be reshaping the landscape of artificial intelligence, potentially enabling more efficient and adaptive systems that mimic human cognitive processes.</p>

    U.S. Department of Energy

    Neuromorphic Computing Market Market Drivers

    Expansion of Application Areas

    The Neuromorphic Computing Market is expanding into diverse application areas, which is a key driver of its growth. From autonomous vehicles to smart cities, the versatility of neuromorphic systems is becoming increasingly apparent. These systems are capable of processing sensory data in real-time, making them ideal for applications that require immediate decision-making. The expansion into sectors such as healthcare, finance, and manufacturing is indicative of the technology's adaptability and potential. As organizations seek to leverage neuromorphic computing for enhanced operational efficiency and innovation, market analysts predict that the breadth of applications will continue to grow, further solidifying the industry's position in the broader technology landscape.

    Increased Focus on Energy Efficiency

    Energy efficiency is becoming a critical focus within the Neuromorphic Computing Market. As the demand for computing power escalates, the need for systems that consume less energy while delivering high performance is paramount. Neuromorphic computing offers a solution by mimicking the energy-efficient processes of the human brain. This focus on energy efficiency aligns with global sustainability goals, prompting organizations to seek out neuromorphic solutions that can reduce their carbon footprint. Market data indicates that energy-efficient computing solutions are expected to capture a larger market share, as companies prioritize sustainability alongside performance. This trend is likely to drive further innovation and adoption of neuromorphic technologies across various sectors.

    Technological Advancements in Hardware

    Technological advancements in hardware are propelling the Neuromorphic Computing Market forward. Innovations in chip design and materials science are enabling the development of neuromorphic chips that are not only more efficient but also capable of performing complex computations akin to human cognitive processes. These advancements are crucial as they allow for the creation of systems that can learn and adapt in real-time, which is essential for applications in robotics and AI. The market is witnessing significant investments in research and development, with projections indicating that the neuromorphic hardware segment could reach a valuation of several billion dollars by the end of the decade, underscoring the importance of these technological strides.

    Growing Interest in Brain-Inspired Computing

    The Neuromorphic Computing Market is witnessing a growing interest in brain-inspired computing paradigms. Researchers and developers are increasingly exploring how the human brain processes information, leading to the creation of systems that can replicate these processes. This interest is not merely academic; it has practical implications for industries such as healthcare, where neuromorphic systems can enhance diagnostic tools and patient monitoring. The potential for brain-inspired computing to revolutionize data processing and analysis is substantial, with market analysts suggesting that this segment could account for a significant share of the overall computing market in the near future. As more organizations recognize the benefits of these systems, investment and research in this area are likely to intensify.

    Rising Demand for Advanced Computing Solutions

    The Neuromorphic Computing Market is experiencing a surge in demand for advanced computing solutions that can efficiently process vast amounts of data. As industries increasingly rely on artificial intelligence and machine learning, the need for systems that mimic human brain functions becomes paramount. This demand is driven by the necessity for faster processing speeds and lower energy consumption. According to recent estimates, the neuromorphic computing sector is projected to grow at a compound annual growth rate of over 30% in the coming years. This growth reflects a broader trend towards integrating neuromorphic systems into various applications, including robotics, autonomous vehicles, and smart devices, thereby enhancing their capabilities and performance.

    Market Segment Insights

    By Technology Type: Digital Neuromorphic Computing (Largest) vs. Hybrid Neuromorphic Computing (Fastest-Growing)

    <p>The Neuromorphic Computing Market is witnessing a dynamic segmentation by technology type, with Digital Neuromorphic Computing leading the way as the largest segment. This technology has garnered widespread adoption due to its efficiency and adaptability in simulating human brain processes. Following closely, Hybrid Neuromorphic Computing is emerging as a rapidly growing segment, attracting attention for its ability to combine the advantages of both analog and digital technologies, appealing to a broader range of applications. Growth trends within the Neuromorphic Computing Market are significantly influenced by advancements in AI and <a href="https://www.marketresearchfuture.com/reports/machine-learning-market-2494">machine learning</a>. The demand for high-performance computing solutions is driving interest in Digital Neuromorphic Computing, while Hybrid Neuromorphic Computing is being propelled by its versatility and potential for integration into existing infrastructures. This combination of factors is expected to enhance innovation and speed up the development of neuromorphic systems across various sectors.</p>

    <p>Technology: Digital Neuromorphic Computing (Dominant) vs. Hybrid Neuromorphic Computing (Emerging)</p>

    <p>Digital Neuromorphic Computing is characterized by its reliance on digital circuits and algorithms to emulate neural processes, offering higher precision and interoperability with existing digital systems. Its dominant market position is bolstered by its applicability in various areas such as robotics, autonomous systems, and data processing where high throughput and low latency are critical. In contrast, Hybrid Neuromorphic Computing represents an emerging approach that blends analog and digital methodologies to create more adaptive and efficient systems. This hybrid model can leverage the benefits of both technologies, enabling superior performance in specific tasks such as pattern recognition and sensory processing, thus positioning it strongly for future growth in the Neuromorphic Computing Market.</p>

    By Application: Natural Language Processing (Largest) vs. Computer Vision (Fastest-Growing)

    <p>In the Neuromorphic Computing Market, the application landscape is dominated by Natural Language Processing (NLP), capturing a significant share with its wide adoption across various sectors. NLP's ability to interpret and generate human-like text enhances communication between machines and humans, making it a critical segment in today’s technology-driven world. Conversely, Computer Vision is emerging rapidly as a vital application, leveraging neuromorphic chips to enhance image recognition and analysis, which is gaining traction in industries like security and autonomous vehicles. Growth trends in this segment are being fueled by increasing advancements in deep learning techniques, particularly for NLP and Computer Vision, as industries seek smarter and more efficient solutions. The demand for real-time data processing continues to rise, propelling both segments forward. Moreover, the integration of neuromorphic computing into existing systems is helping organizations enhance operational efficiency, prompting a broader adoption of these applications that address complex challenges with innovative solutions.</p>

    <p>Natural Language Processing (Dominant) vs. Computer Vision (Emerging)</p>

    <p>Natural Language Processing (NLP) is currently the dominant application within the Neuromorphic Computing Market, owing to its extensive use in voice assistants, chatbots, and translation tools. Its capabilities in understanding, interpreting, and generating human language have led to widespread adoption across diverse industries like finance, healthcare, and customer service. NLP systems powered by neuromorphic computing demonstrate significantly improved efficiency and processing speed, allowing for more responsive and engaging user interactions. On the other hand, Computer Vision is an emerging force in this market, characterized by its cutting-edge applications in fields such as automotive and surveillance. With the ability to interpret visual information and make decisions in real-time, neuromorphic-enabled Computer Vision is considered pivotal for advancements in machine learning models, autonomous driving technologies, and more.</p>

    By End-use: Consumer Electronics (Largest) vs. Healthcare (Fastest-Growing)

    <p>In the Neuromorphic Computing Market, the end-use segment is characterized by a diverse distribution among consumer electronics, healthcare, aerospace and defense, and <a href="https://www.marketresearchfuture.com/reports/industrial-automation-market-2212">industrial automation</a>. Consumer electronics stands out as the largest segment, leveraging neuromorphic computing to enhance processing capabilities and energy efficiency in devices such as smartphones, cameras, and home automation systems. Healthcare is notably gaining traction, employing neuromorphic systems to improve diagnostic tools, robotic surgeries, and personalized medicine, thus serving a significant portion of market demand.</p>

    <p>Consumer Electronics: Dominant vs. Healthcare: Emerging</p>

    <p>Consumer electronics emerges as the dominant end-use sector for neuromorphic computing, driven by the need for more efficient resource management and enhanced computational power in everyday devices. The integration of neuromorphic chips allows for reduced power consumption while improving performance, making them ideal for mobile devices and smart technologies. Conversely, healthcare represents an emerging segment that is rapidly adapting neuromorphic solutions. This area focuses on applications such as real-time patient monitoring and intelligent data processing for medical imaging, poised to redefine operational efficiencies and patient outcomes. The synergy of neuromorphic technology in these sectors embodies a transformative shift towards smarter and more adaptive applications.</p>

    By Component: Hardware (Largest) vs. Software (Fastest-Growing)

    <p>In the Neuromorphic Computing Market, the dominance of the hardware component is notable, primarily due to its critical role in implementing neuromorphic architectures. Hardware solutions, including chips and systems, represent the largest share, driving much of the market's momentum. Software components, while currently smaller in market share, are experiencing rapid growth as software development increasingly adapts to neuromorphic paradigms.</p>

    <p>Hardware (Dominant) vs. Software (Emerging)</p>

    <p>The hardware segment of the Neuromorphic Computing Market is characterized by advanced processing units designed to mimic the neural structures of the human brain, offering unparalleled efficiency in tasks such as deep learning and sensory processing. Companies invested in hardware are focusing on miniaturization and energy efficiency, solidifying their position as leaders. Conversely, the software segment, although emerging, is gaining traction as developers create specialized algorithms capable of leveraging neuromorphic hardware effectively. This growing demand for intelligent software solutions signifies a shift towards more versatile applications, propelling the software segment's growth.</p>

    Get more detailed insights about Neuromorphic Computing Market Research Report - Global Forecast till 2035

    Regional Insights

    North America : Innovation and Leadership Hub

    North America is the largest market for neuromorphic computing, holding approximately 45% of the global share. The region's growth is driven by significant investments in AI and machine learning technologies, alongside supportive government policies that encourage innovation. The demand for advanced computing solutions in sectors like healthcare, automotive, and finance further propels market expansion. Regulatory frameworks are increasingly favorable, promoting research and development initiatives. The competitive landscape in North America is robust, featuring key players such as IBM, Intel, and NVIDIA, which are at the forefront of neuromorphic technology. The United States leads the market, followed by Canada, which is also making strides in AI research. The presence of top-tier universities and research institutions enhances the region's capabilities, fostering collaboration between academia and industry to drive innovation in neuromorphic computing.

    Europe : Emerging Innovation Ecosystem

    Europe is witnessing a surge in neuromorphic computing initiatives, holding around 30% of the global market share. The region's growth is fueled by increasing investments in AI research and a strong focus on sustainable technology solutions. European governments are actively promoting digital transformation through various funding programs and regulatory frameworks that support innovation in computing technologies. This regulatory environment is crucial for fostering collaboration between public and private sectors. Leading countries in Europe include Germany, France, and the United Kingdom, which are home to several key players like the University of Manchester and various startups focused on neuromorphic solutions. The competitive landscape is characterized by a mix of established tech giants and innovative startups, creating a dynamic ecosystem that encourages research and development. The collaboration between academia and industry is pivotal in advancing neuromorphic computing technologies in the region.

    Asia-Pacific : Rapid Growth and Adoption

    Asia-Pacific is rapidly emerging as a significant player in the neuromorphic computing market, accounting for approximately 20% of the global share. The region's growth is driven by increasing demand for AI applications across various sectors, including manufacturing, healthcare, and smart cities. Countries like China and Japan are investing heavily in research and development, supported by government initiatives aimed at enhancing technological capabilities and fostering innovation in computing technologies. China is leading the charge in neuromorphic computing, with substantial investments from both the government and private sector. Japan follows closely, with companies like Sony and Fujitsu exploring neuromorphic architectures. The competitive landscape is evolving, with a mix of established firms and startups focusing on AI and neuromorphic solutions. The region's emphasis on technological advancement and collaboration between industry and academia is crucial for driving growth in this market.

    Middle East and Africa : Emerging Technology Frontier

    The Middle East and Africa region is in the nascent stages of neuromorphic computing, holding about 5% of the global market share. Growth is primarily driven by increasing interest in AI technologies and digital transformation initiatives across various sectors. Governments in the region are beginning to recognize the potential of neuromorphic computing, leading to investments in research and development. Regulatory frameworks are gradually evolving to support innovation and attract foreign investment in technology sectors. Countries like South Africa and the UAE are taking the lead in exploring neuromorphic computing applications, with initiatives aimed at enhancing technological capabilities. The competitive landscape is still developing, with a focus on building local expertise and fostering partnerships between academia and industry. As the region continues to invest in technology, the potential for neuromorphic computing growth is significant, paving the way for future advancements.

    Key Players and Competitive Insights

    The Neuromorphic Computing Market is currently characterized by a dynamic competitive landscape, driven by rapid advancements in artificial intelligence and machine learning technologies. Key players such as IBM (US), Intel (US), and BrainChip (AU) are at the forefront, each adopting distinct strategies to enhance their market positioning. IBM (US) focuses on innovation through its neuromorphic chip development, aiming to integrate cognitive computing capabilities into various applications. Meanwhile, Intel (US) emphasizes partnerships with academic institutions to foster research and development, thereby enhancing its technological prowess. BrainChip (AU) is carving a niche by targeting edge computing solutions, which are increasingly vital in IoT applications. Collectively, these strategies not only bolster individual company growth but also intensify competition within the market, as firms strive to differentiate themselves through technological advancements and strategic collaborations.

    In terms of business tactics, companies are increasingly localizing manufacturing and optimizing supply chains to enhance operational efficiency. The Neuromorphic Computing Market appears moderately fragmented, with several players vying for market share. This competitive structure allows for a diverse range of innovations and applications, as companies leverage their unique strengths to capture emerging opportunities. The collective influence of these key players is shaping the market dynamics, fostering an environment where technological advancements are paramount.

    In August 2025, IBM (US) announced a strategic partnership with a leading university to co-develop neuromorphic computing solutions aimed at enhancing AI capabilities in healthcare. This collaboration is significant as it not only reinforces IBM's commitment to innovation but also positions the company to leverage academic research for practical applications, potentially leading to breakthroughs in medical diagnostics and treatment.

    In September 2025, Intel (US) unveiled its latest neuromorphic chip, designed specifically for autonomous systems. This launch is pivotal, as it underscores Intel's focus on integrating neuromorphic computing into real-world applications, particularly in the automotive sector. By addressing the growing demand for intelligent systems, Intel is likely to strengthen its competitive edge and expand its market reach.

    In July 2025, BrainChip (AU) secured a major contract with a telecommunications provider to implement its neuromorphic technology in edge devices. This development is crucial, as it not only validates BrainChip's technology but also opens new avenues for revenue generation. The partnership highlights the increasing relevance of neuromorphic computing in enhancing the performance of edge devices, which are becoming integral to modern telecommunications infrastructure.

    As of October 2025, the competitive trends in the Neuromorphic Computing Market are increasingly defined by digitalization, sustainability, and the integration of AI technologies. Strategic alliances are playing a critical role in shaping the current landscape, as companies collaborate to pool resources and expertise. Looking ahead, it is anticipated that competitive differentiation will evolve, with a pronounced shift from price-based competition to a focus on innovation, technological advancements, and supply chain reliability. This transition is likely to redefine how companies position themselves in the market, emphasizing the importance of cutting-edge solutions and strategic partnerships.

    Key Companies in the Neuromorphic Computing Market market include

    Industry Developments

    In April 2024, Intel revealed Hala Point, the biggest neuromorphic system in the world, which is installed at Sandia National Labs for AI workloads that are inspired by the brain and sustainable. It is constructed using Loihi 2 processors and has 1.15 billion neurons, 128 billion synapses, and ~20 petaops of performance.With 256 cores and 224 MB of on-chip SRAM, IBM Research's NorthPole device, a digital neuromorphic inference accelerator, was unveiled in October 2023. It allows memory-compute convergence for image recognition applications while using around 25 % less energy than GPUs.

    IBM released the APL Materials "Roadmap to Neuromorphic Computing" in October 2024, detailing new technologies and hybrid analog/digital systems that are getting close to commercial maturity. The AKD1500 reference chip and developer framework for spiking neural network deployment at the edge, aimed at ultra-low power use cases, were added to BrainChip's Akida platform in June 2025.IBM signaled a greater business focus on next-generation brain-inspired architectures in June 2025 when it emphasized neuromorphic computing as a core investment alongside quantum in its Research Annual Letter.

    Future Outlook

    Neuromorphic Computing Market Future Outlook

    <p>The Neuromorphic Computing Market is projected to grow at an 18.12% CAGR from 2024 to 2035, driven by advancements in AI, energy efficiency, and demand for real-time processing.</p>

    New opportunities lie in:

    • <p>Development of neuromorphic chips for <a href="https://www.marketresearchfuture.com/reports/edge-computing-market-3239">edge computing </a>applications.</p><p>Integration of neuromorphic systems in autonomous vehicles.</p><p>Creation of neuromorphic solutions for smart healthcare devices.</p>

    <p>By 2035, the Neuromorphic Computing Market is expected to be a pivotal sector in technology innovation.</p>

    Market Segmentation

    Neuromorphic Computing Market End-use Outlook

    • Consumer Electronics
    • Healthcare
    • Aerospace and Defense
    • Industrial Automation

    Neuromorphic Computing Market Component Outlook

    • Hardware
    • Software
    • Services

    Neuromorphic Computing Market Application Outlook

    • Robotics
    • Natural Language Processing
    • Computer Vision
    • Automotive Applications

    Neuromorphic Computing Market Technology Type Outlook

    • Analog Neuromorphic Computing
    • Digital Neuromorphic Computing
    • Hybrid Neuromorphic Computing

    Report Scope

    MARKET SIZE 20242.77(USD Billion)
    MARKET SIZE 20253.272(USD Billion)
    MARKET SIZE 203517.3(USD Billion)
    COMPOUND ANNUAL GROWTH RATE (CAGR)18.12% (2024 - 2035)
    REPORT COVERAGERevenue Forecast, Competitive Landscape, Growth Factors, and Trends
    BASE YEAR2024
    Market Forecast Period2025 - 2035
    Historical Data2019 - 2024
    Market Forecast UnitsUSD Billion
    Key Companies ProfiledMarket analysis in progress
    Segments CoveredMarket segmentation analysis in progress
    Key Market OpportunitiesAdvancements in artificial intelligence drive demand for efficient Neuromorphic Computing Market solutions.
    Key Market DynamicsRising demand for energy-efficient computing drives innovation and competition in the neuromorphic computing sector.
    Countries CoveredNorth America, Europe, APAC, South America, MEA

    FAQs

    What is the projected market valuation of the Neuromorphic Computing Market by 2035?

    The Neuromorphic Computing Market is projected to reach a valuation of 17.3 USD Billion by 2035.

    What was the market valuation of the Neuromorphic Computing Market in 2024?

    In 2024, the Neuromorphic Computing Market had a valuation of 2.77 USD Billion.

    What is the expected CAGR for the Neuromorphic Computing Market during the forecast period 2025 - 2035?

    The expected CAGR for the Neuromorphic Computing Market during the forecast period 2025 - 2035 is 18.12%.

    Which technology type segment is anticipated to grow the most in the Neuromorphic Computing Market?

    Digital Neuromorphic Computing is anticipated to grow significantly, with a projected increase from 1.1 USD Billion to 7.5 USD Billion.

    What are the key applications driving the Neuromorphic Computing Market?

    Key applications include Robotics, Natural Language Processing, Computer Vision, and Automotive Applications, with Robotics expected to grow from 0.83 USD Billion to 4.95 USD Billion.

    Which end-use segment is expected to have the highest valuation in the Neuromorphic Computing Market?

    The Consumer Electronics segment is expected to have the highest valuation, projected to grow from 0.83 USD Billion to 5.25 USD Billion.

    Who are the leading players in the Neuromorphic Computing Market?

    Key players in the Neuromorphic Computing Market include IBM, Intel, BrainChip, Qualcomm, NVIDIA, Samsung, Micron Technology, University of Manchester, and HRL Laboratories.

    What is the projected growth for the Hardware component in the Neuromorphic Computing Market?

    The Hardware component is projected to grow from 1.39 USD Billion to 8.5 USD Billion.

    How does the Neuromorphic Computing Market's growth compare across different components?

    The Software component is expected to grow from 0.83 USD Billion to 5.1 USD Billion, while Services may increase from 0.55 USD Billion to 3.7 USD Billion.

    What trends are influencing the Neuromorphic Computing Market's expansion?

    Trends such as advancements in AI, increased demand for efficient computing solutions, and applications in various sectors are influencing the Neuromorphic Computing Market's expansion.

    1. SECTION I: EXECUTIVE SUMMARY AND KEY HIGHLIGHTS
      1. | 1.1 EXECUTIVE SUMMARY
      2. | | 1.1.1 Market Overview
      3. | | 1.1.2 Key Findings
      4. | | 1.1.3 Market Segmentation
      5. | | 1.1.4 Competitive Landscape
      6. | | 1.1.5 Challenges and Opportunities
      7. | | 1.1.6 Future Outlook
    2. SECTION II: SCOPING, METHODOLOGY AND MARKET STRUCTURE
      1. | 2.1 MARKET INTRODUCTION
      2. | | 2.1.1 Definition
      3. | | 2.1.2 Scope of the study
      4. | | | 2.1.2.1 Research Objective
      5. | | | 2.1.2.2 Assumption
      6. | | | 2.1.2.3 Limitations
      7. | 2.2 RESEARCH METHODOLOGY
      8. | | 2.2.1 Overview
      9. | | 2.2.2 Data Mining
      10. | | 2.2.3 Secondary Research
      11. | | 2.2.4 Primary Research
      12. | | | 2.2.4.1 Primary Interviews and Information Gathering Process
      13. | | | 2.2.4.2 Breakdown of Primary Respondents
      14. | | 2.2.5 Forecasting Model
      15. | | 2.2.6 Market Size Estimation
      16. | | | 2.2.6.1 Bottom-Up Approach
      17. | | | 2.2.6.2 Top-Down Approach
      18. | | 2.2.7 Data Triangulation
      19. | | 2.2.8 Validation
    3. SECTION III: QUALITATIVE ANALYSIS
      1. | 3.1 MARKET DYNAMICS
      2. | | 3.1.1 Overview
      3. | | 3.1.2 Drivers
      4. | | 3.1.3 Restraints
      5. | | 3.1.4 Opportunities
      6. | 3.2 MARKET FACTOR ANALYSIS
      7. | | 3.2.1 Value chain Analysis
      8. | | 3.2.2 Porter's Five Forces Analysis
      9. | | | 3.2.2.1 Bargaining Power of Suppliers
      10. | | | 3.2.2.2 Bargaining Power of Buyers
      11. | | | 3.2.2.3 Threat of New Entrants
      12. | | | 3.2.2.4 Threat of Substitutes
      13. | | | 3.2.2.5 Intensity of Rivalry
      14. | | 3.2.3 COVID-19 Impact Analysis
      15. | | | 3.2.3.1 Market Impact Analysis
      16. | | | 3.2.3.2 Regional Impact
      17. | | | 3.2.3.3 Opportunity and Threat Analysis
    4. SECTION IV: QUANTITATIVE ANALYSIS
      1. | 4.1 Information and Communications Technology, BY Technology Type (USD Billion)
      2. | | 4.1.1 Analog Neuromorphic Computing
      3. | | 4.1.2 Digital Neuromorphic Computing
      4. | | 4.1.3 Hybrid Neuromorphic Computing
      5. | 4.2 Information and Communications Technology, BY Application (USD Billion)
      6. | | 4.2.1 Robotics
      7. | | 4.2.2 Natural Language Processing
      8. | | 4.2.3 Computer Vision
      9. | | 4.2.4 Automotive Applications
      10. | 4.3 Information and Communications Technology, BY End-use (USD Billion)
      11. | | 4.3.1 Consumer Electronics
      12. | | 4.3.2 Healthcare
      13. | | 4.3.3 Aerospace and Defense
      14. | | 4.3.4 Industrial Automation
      15. | 4.4 Information and Communications Technology, BY Component (USD Billion)
      16. | | 4.4.1 Hardware
      17. | | 4.4.2 Software
      18. | | 4.4.3 Services
      19. | 4.5 Information and Communications Technology, BY Region (USD Billion)
      20. | | 4.5.1 North America
      21. | | | 4.5.1.1 US
      22. | | | 4.5.1.2 Canada
      23. | | 4.5.2 Europe
      24. | | | 4.5.2.1 Germany
      25. | | | 4.5.2.2 UK
      26. | | | 4.5.2.3 France
      27. | | | 4.5.2.4 Russia
      28. | | | 4.5.2.5 Italy
      29. | | | 4.5.2.6 Spain
      30. | | | 4.5.2.7 Rest of Europe
      31. | | 4.5.3 APAC
      32. | | | 4.5.3.1 China
      33. | | | 4.5.3.2 India
      34. | | | 4.5.3.3 Japan
      35. | | | 4.5.3.4 South Korea
      36. | | | 4.5.3.5 Malaysia
      37. | | | 4.5.3.6 Thailand
      38. | | | 4.5.3.7 Indonesia
      39. | | | 4.5.3.8 Rest of APAC
      40. | | 4.5.4 South America
      41. | | | 4.5.4.1 Brazil
      42. | | | 4.5.4.2 Mexico
      43. | | | 4.5.4.3 Argentina
      44. | | | 4.5.4.4 Rest of South America
      45. | | 4.5.5 MEA
      46. | | | 4.5.5.1 GCC Countries
      47. | | | 4.5.5.2 South Africa
      48. | | | 4.5.5.3 Rest of MEA
    5. SECTION V: COMPETITIVE ANALYSIS
      1. | 5.1 Competitive Landscape
      2. | | 5.1.1 Overview
      3. | | 5.1.2 Competitive Analysis
      4. | | 5.1.3 Market share Analysis
      5. | | 5.1.4 Major Growth Strategy in the Information and Communications Technology
      6. | | 5.1.5 Competitive Benchmarking
      7. | | 5.1.6 Leading Players in Terms of Number of Developments in the Information and Communications Technology
      8. | | 5.1.7 Key developments and growth strategies
      9. | | | 5.1.7.1 New Product Launch/Service Deployment
      10. | | | 5.1.7.2 Merger & Acquisitions
      11. | | | 5.1.7.3 Joint Ventures
      12. | | 5.1.8 Major Players Financial Matrix
      13. | | | 5.1.8.1 Sales and Operating Income
      14. | | | 5.1.8.2 Major Players R&D Expenditure. 2023
      15. | 5.2 Company Profiles
      16. | | 5.2.1 IBM (US)
      17. | | | 5.2.1.1 Financial Overview
      18. | | | 5.2.1.2 Products Offered
      19. | | | 5.2.1.3 Key Developments
      20. | | | 5.2.1.4 SWOT Analysis
      21. | | | 5.2.1.5 Key Strategies
      22. | | 5.2.2 Intel (US)
      23. | | | 5.2.2.1 Financial Overview
      24. | | | 5.2.2.2 Products Offered
      25. | | | 5.2.2.3 Key Developments
      26. | | | 5.2.2.4 SWOT Analysis
      27. | | | 5.2.2.5 Key Strategies
      28. | | 5.2.3 BrainChip (AU)
      29. | | | 5.2.3.1 Financial Overview
      30. | | | 5.2.3.2 Products Offered
      31. | | | 5.2.3.3 Key Developments
      32. | | | 5.2.3.4 SWOT Analysis
      33. | | | 5.2.3.5 Key Strategies
      34. | | 5.2.4 Qualcomm (US)
      35. | | | 5.2.4.1 Financial Overview
      36. | | | 5.2.4.2 Products Offered
      37. | | | 5.2.4.3 Key Developments
      38. | | | 5.2.4.4 SWOT Analysis
      39. | | | 5.2.4.5 Key Strategies
      40. | | 5.2.5 NVIDIA (US)
      41. | | | 5.2.5.1 Financial Overview
      42. | | | 5.2.5.2 Products Offered
      43. | | | 5.2.5.3 Key Developments
      44. | | | 5.2.5.4 SWOT Analysis
      45. | | | 5.2.5.5 Key Strategies
      46. | | 5.2.6 Samsung (KR)
      47. | | | 5.2.6.1 Financial Overview
      48. | | | 5.2.6.2 Products Offered
      49. | | | 5.2.6.3 Key Developments
      50. | | | 5.2.6.4 SWOT Analysis
      51. | | | 5.2.6.5 Key Strategies
      52. | | 5.2.7 Micron Technology (US)
      53. | | | 5.2.7.1 Financial Overview
      54. | | | 5.2.7.2 Products Offered
      55. | | | 5.2.7.3 Key Developments
      56. | | | 5.2.7.4 SWOT Analysis
      57. | | | 5.2.7.5 Key Strategies
      58. | | 5.2.8 University of Manchester (GB)
      59. | | | 5.2.8.1 Financial Overview
      60. | | | 5.2.8.2 Products Offered
      61. | | | 5.2.8.3 Key Developments
      62. | | | 5.2.8.4 SWOT Analysis
      63. | | | 5.2.8.5 Key Strategies
      64. | | 5.2.9 HRL Laboratories (US)
      65. | | | 5.2.9.1 Financial Overview
      66. | | | 5.2.9.2 Products Offered
      67. | | | 5.2.9.3 Key Developments
      68. | | | 5.2.9.4 SWOT Analysis
      69. | | | 5.2.9.5 Key Strategies
      70. | 5.3 Appendix
      71. | | 5.3.1 References
      72. | | 5.3.2 Related Reports
    6. LIST OF FIGURES
      1. | 6.1 MARKET SYNOPSIS
      2. | 6.2 NORTH AMERICA MARKET ANALYSIS
      3. | 6.3 US MARKET ANALYSIS BY TECHNOLOGY TYPE
      4. | 6.4 US MARKET ANALYSIS BY APPLICATION
      5. | 6.5 US MARKET ANALYSIS BY END-USE
      6. | 6.6 US MARKET ANALYSIS BY COMPONENT
      7. | 6.7 CANADA MARKET ANALYSIS BY TECHNOLOGY TYPE
      8. | 6.8 CANADA MARKET ANALYSIS BY APPLICATION
      9. | 6.9 CANADA MARKET ANALYSIS BY END-USE
      10. | 6.10 CANADA MARKET ANALYSIS BY COMPONENT
      11. | 6.11 EUROPE MARKET ANALYSIS
      12. | 6.12 GERMANY MARKET ANALYSIS BY TECHNOLOGY TYPE
      13. | 6.13 GERMANY MARKET ANALYSIS BY APPLICATION
      14. | 6.14 GERMANY MARKET ANALYSIS BY END-USE
      15. | 6.15 GERMANY MARKET ANALYSIS BY COMPONENT
      16. | 6.16 UK MARKET ANALYSIS BY TECHNOLOGY TYPE
      17. | 6.17 UK MARKET ANALYSIS BY APPLICATION
      18. | 6.18 UK MARKET ANALYSIS BY END-USE
      19. | 6.19 UK MARKET ANALYSIS BY COMPONENT
      20. | 6.20 FRANCE MARKET ANALYSIS BY TECHNOLOGY TYPE
      21. | 6.21 FRANCE MARKET ANALYSIS BY APPLICATION
      22. | 6.22 FRANCE MARKET ANALYSIS BY END-USE
      23. | 6.23 FRANCE MARKET ANALYSIS BY COMPONENT
      24. | 6.24 RUSSIA MARKET ANALYSIS BY TECHNOLOGY TYPE
      25. | 6.25 RUSSIA MARKET ANALYSIS BY APPLICATION
      26. | 6.26 RUSSIA MARKET ANALYSIS BY END-USE
      27. | 6.27 RUSSIA MARKET ANALYSIS BY COMPONENT
      28. | 6.28 ITALY MARKET ANALYSIS BY TECHNOLOGY TYPE
      29. | 6.29 ITALY MARKET ANALYSIS BY APPLICATION
      30. | 6.30 ITALY MARKET ANALYSIS BY END-USE
      31. | 6.31 ITALY MARKET ANALYSIS BY COMPONENT
      32. | 6.32 SPAIN MARKET ANALYSIS BY TECHNOLOGY TYPE
      33. | 6.33 SPAIN MARKET ANALYSIS BY APPLICATION
      34. | 6.34 SPAIN MARKET ANALYSIS BY END-USE
      35. | 6.35 SPAIN MARKET ANALYSIS BY COMPONENT
      36. | 6.36 REST OF EUROPE MARKET ANALYSIS BY TECHNOLOGY TYPE
      37. | 6.37 REST OF EUROPE MARKET ANALYSIS BY APPLICATION
      38. | 6.38 REST OF EUROPE MARKET ANALYSIS BY END-USE
      39. | 6.39 REST OF EUROPE MARKET ANALYSIS BY COMPONENT
      40. | 6.40 APAC MARKET ANALYSIS
      41. | 6.41 CHINA MARKET ANALYSIS BY TECHNOLOGY TYPE
      42. | 6.42 CHINA MARKET ANALYSIS BY APPLICATION
      43. | 6.43 CHINA MARKET ANALYSIS BY END-USE
      44. | 6.44 CHINA MARKET ANALYSIS BY COMPONENT
      45. | 6.45 INDIA MARKET ANALYSIS BY TECHNOLOGY TYPE
      46. | 6.46 INDIA MARKET ANALYSIS BY APPLICATION
      47. | 6.47 INDIA MARKET ANALYSIS BY END-USE
      48. | 6.48 INDIA MARKET ANALYSIS BY COMPONENT
      49. | 6.49 JAPAN MARKET ANALYSIS BY TECHNOLOGY TYPE
      50. | 6.50 JAPAN MARKET ANALYSIS BY APPLICATION
      51. | 6.51 JAPAN MARKET ANALYSIS BY END-USE
      52. | 6.52 JAPAN MARKET ANALYSIS BY COMPONENT
      53. | 6.53 SOUTH KOREA MARKET ANALYSIS BY TECHNOLOGY TYPE
      54. | 6.54 SOUTH KOREA MARKET ANALYSIS BY APPLICATION
      55. | 6.55 SOUTH KOREA MARKET ANALYSIS BY END-USE
      56. | 6.56 SOUTH KOREA MARKET ANALYSIS BY COMPONENT
      57. | 6.57 MALAYSIA MARKET ANALYSIS BY TECHNOLOGY TYPE
      58. | 6.58 MALAYSIA MARKET ANALYSIS BY APPLICATION
      59. | 6.59 MALAYSIA MARKET ANALYSIS BY END-USE
      60. | 6.60 MALAYSIA MARKET ANALYSIS BY COMPONENT
      61. | 6.61 THAILAND MARKET ANALYSIS BY TECHNOLOGY TYPE
      62. | 6.62 THAILAND MARKET ANALYSIS BY APPLICATION
      63. | 6.63 THAILAND MARKET ANALYSIS BY END-USE
      64. | 6.64 THAILAND MARKET ANALYSIS BY COMPONENT
      65. | 6.65 INDONESIA MARKET ANALYSIS BY TECHNOLOGY TYPE
      66. | 6.66 INDONESIA MARKET ANALYSIS BY APPLICATION
      67. | 6.67 INDONESIA MARKET ANALYSIS BY END-USE
      68. | 6.68 INDONESIA MARKET ANALYSIS BY COMPONENT
      69. | 6.69 REST OF APAC MARKET ANALYSIS BY TECHNOLOGY TYPE
      70. | 6.70 REST OF APAC MARKET ANALYSIS BY APPLICATION
      71. | 6.71 REST OF APAC MARKET ANALYSIS BY END-USE
      72. | 6.72 REST OF APAC MARKET ANALYSIS BY COMPONENT
      73. | 6.73 SOUTH AMERICA MARKET ANALYSIS
      74. | 6.74 BRAZIL MARKET ANALYSIS BY TECHNOLOGY TYPE
      75. | 6.75 BRAZIL MARKET ANALYSIS BY APPLICATION
      76. | 6.76 BRAZIL MARKET ANALYSIS BY END-USE
      77. | 6.77 BRAZIL MARKET ANALYSIS BY COMPONENT
      78. | 6.78 MEXICO MARKET ANALYSIS BY TECHNOLOGY TYPE
      79. | 6.79 MEXICO MARKET ANALYSIS BY APPLICATION
      80. | 6.80 MEXICO MARKET ANALYSIS BY END-USE
      81. | 6.81 MEXICO MARKET ANALYSIS BY COMPONENT
      82. | 6.82 ARGENTINA MARKET ANALYSIS BY TECHNOLOGY TYPE
      83. | 6.83 ARGENTINA MARKET ANALYSIS BY APPLICATION
      84. | 6.84 ARGENTINA MARKET ANALYSIS BY END-USE
      85. | 6.85 ARGENTINA MARKET ANALYSIS BY COMPONENT
      86. | 6.86 REST OF SOUTH AMERICA MARKET ANALYSIS BY TECHNOLOGY TYPE
      87. | 6.87 REST OF SOUTH AMERICA MARKET ANALYSIS BY APPLICATION
      88. | 6.88 REST OF SOUTH AMERICA MARKET ANALYSIS BY END-USE
      89. | 6.89 REST OF SOUTH AMERICA MARKET ANALYSIS BY COMPONENT
      90. | 6.90 MEA MARKET ANALYSIS
      91. | 6.91 GCC COUNTRIES MARKET ANALYSIS BY TECHNOLOGY TYPE
      92. | 6.92 GCC COUNTRIES MARKET ANALYSIS BY APPLICATION
      93. | 6.93 GCC COUNTRIES MARKET ANALYSIS BY END-USE
      94. | 6.94 GCC COUNTRIES MARKET ANALYSIS BY COMPONENT
      95. | 6.95 SOUTH AFRICA MARKET ANALYSIS BY TECHNOLOGY TYPE
      96. | 6.96 SOUTH AFRICA MARKET ANALYSIS BY APPLICATION
      97. | 6.97 SOUTH AFRICA MARKET ANALYSIS BY END-USE
      98. | 6.98 SOUTH AFRICA MARKET ANALYSIS BY COMPONENT
      99. | 6.99 REST OF MEA MARKET ANALYSIS BY TECHNOLOGY TYPE
      100. | 6.100 REST OF MEA MARKET ANALYSIS BY APPLICATION
      101. | 6.101 REST OF MEA MARKET ANALYSIS BY END-USE
      102. | 6.102 REST OF MEA MARKET ANALYSIS BY COMPONENT
      103. | 6.103 KEY BUYING CRITERIA OF INFORMATION AND COMMUNICATIONS TECHNOLOGY
      104. | 6.104 RESEARCH PROCESS OF MRFR
      105. | 6.105 DRO ANALYSIS OF INFORMATION AND COMMUNICATIONS TECHNOLOGY
      106. | 6.106 DRIVERS IMPACT ANALYSIS: INFORMATION AND COMMUNICATIONS TECHNOLOGY
      107. | 6.107 RESTRAINTS IMPACT ANALYSIS: INFORMATION AND COMMUNICATIONS TECHNOLOGY
      108. | 6.108 SUPPLY / VALUE CHAIN: INFORMATION AND COMMUNICATIONS TECHNOLOGY
      109. | 6.109 INFORMATION AND COMMUNICATIONS TECHNOLOGY, BY TECHNOLOGY TYPE, 2024 (% SHARE)
      110. | 6.110 INFORMATION AND COMMUNICATIONS TECHNOLOGY, BY TECHNOLOGY TYPE, 2024 TO 2035 (USD Billion)
      111. | 6.111 INFORMATION AND COMMUNICATIONS TECHNOLOGY, BY APPLICATION, 2024 (% SHARE)
      112. | 6.112 INFORMATION AND COMMUNICATIONS TECHNOLOGY, BY APPLICATION, 2024 TO 2035 (USD Billion)
      113. | 6.113 INFORMATION AND COMMUNICATIONS TECHNOLOGY, BY END-USE, 2024 (% SHARE)
      114. | 6.114 INFORMATION AND COMMUNICATIONS TECHNOLOGY, BY END-USE, 2024 TO 2035 (USD Billion)
      115. | 6.115 INFORMATION AND COMMUNICATIONS TECHNOLOGY, BY COMPONENT, 2024 (% SHARE)
      116. | 6.116 INFORMATION AND COMMUNICATIONS TECHNOLOGY, BY COMPONENT, 2024 TO 2035 (USD Billion)
      117. | 6.117 BENCHMARKING OF MAJOR COMPETITORS
    7. LIST OF TABLES
      1. | 7.1 LIST OF ASSUMPTIONS
      2. | | 7.1.1
      3. | 7.2 North America MARKET SIZE ESTIMATES; FORECAST
      4. | | 7.2.1 BY TECHNOLOGY TYPE, 2025-2035 (USD Billion)
      5. | | 7.2.2 BY APPLICATION, 2025-2035 (USD Billion)
      6. | | 7.2.3 BY END-USE, 2025-2035 (USD Billion)
      7. | | 7.2.4 BY COMPONENT, 2025-2035 (USD Billion)
      8. | 7.3 US MARKET SIZE ESTIMATES; FORECAST
      9. | | 7.3.1 BY TECHNOLOGY TYPE, 2025-2035 (USD Billion)
      10. | | 7.3.2 BY APPLICATION, 2025-2035 (USD Billion)
      11. | | 7.3.3 BY END-USE, 2025-2035 (USD Billion)
      12. | | 7.3.4 BY COMPONENT, 2025-2035 (USD Billion)
      13. | 7.4 Canada MARKET SIZE ESTIMATES; FORECAST
      14. | | 7.4.1 BY TECHNOLOGY TYPE, 2025-2035 (USD Billion)
      15. | | 7.4.2 BY APPLICATION, 2025-2035 (USD Billion)
      16. | | 7.4.3 BY END-USE, 2025-2035 (USD Billion)
      17. | | 7.4.4 BY COMPONENT, 2025-2035 (USD Billion)
      18. | 7.5 Europe MARKET SIZE ESTIMATES; FORECAST
      19. | | 7.5.1 BY TECHNOLOGY TYPE, 2025-2035 (USD Billion)
      20. | | 7.5.2 BY APPLICATION, 2025-2035 (USD Billion)
      21. | | 7.5.3 BY END-USE, 2025-2035 (USD Billion)
      22. | | 7.5.4 BY COMPONENT, 2025-2035 (USD Billion)
      23. | 7.6 Germany MARKET SIZE ESTIMATES; FORECAST
      24. | | 7.6.1 BY TECHNOLOGY TYPE, 2025-2035 (USD Billion)
      25. | | 7.6.2 BY APPLICATION, 2025-2035 (USD Billion)
      26. | | 7.6.3 BY END-USE, 2025-2035 (USD Billion)
      27. | | 7.6.4 BY COMPONENT, 2025-2035 (USD Billion)
      28. | 7.7 UK MARKET SIZE ESTIMATES; FORECAST
      29. | | 7.7.1 BY TECHNOLOGY TYPE, 2025-2035 (USD Billion)
      30. | | 7.7.2 BY APPLICATION, 2025-2035 (USD Billion)
      31. | | 7.7.3 BY END-USE, 2025-2035 (USD Billion)
      32. | | 7.7.4 BY COMPONENT, 2025-2035 (USD Billion)
      33. | 7.8 France MARKET SIZE ESTIMATES; FORECAST
      34. | | 7.8.1 BY TECHNOLOGY TYPE, 2025-2035 (USD Billion)
      35. | | 7.8.2 BY APPLICATION, 2025-2035 (USD Billion)
      36. | | 7.8.3 BY END-USE, 2025-2035 (USD Billion)
      37. | | 7.8.4 BY COMPONENT, 2025-2035 (USD Billion)
      38. | 7.9 Russia MARKET SIZE ESTIMATES; FORECAST
      39. | | 7.9.1 BY TECHNOLOGY TYPE, 2025-2035 (USD Billion)
      40. | | 7.9.2 BY APPLICATION, 2025-2035 (USD Billion)
      41. | | 7.9.3 BY END-USE, 2025-2035 (USD Billion)
      42. | | 7.9.4 BY COMPONENT, 2025-2035 (USD Billion)
      43. | 7.10 Italy MARKET SIZE ESTIMATES; FORECAST
      44. | | 7.10.1 BY TECHNOLOGY TYPE, 2025-2035 (USD Billion)
      45. | | 7.10.2 BY APPLICATION, 2025-2035 (USD Billion)
      46. | | 7.10.3 BY END-USE, 2025-2035 (USD Billion)
      47. | | 7.10.4 BY COMPONENT, 2025-2035 (USD Billion)
      48. | 7.11 Spain MARKET SIZE ESTIMATES; FORECAST
      49. | | 7.11.1 BY TECHNOLOGY TYPE, 2025-2035 (USD Billion)
      50. | | 7.11.2 BY APPLICATION, 2025-2035 (USD Billion)
      51. | | 7.11.3 BY END-USE, 2025-2035 (USD Billion)
      52. | | 7.11.4 BY COMPONENT, 2025-2035 (USD Billion)
      53. | 7.12 Rest of Europe MARKET SIZE ESTIMATES; FORECAST
      54. | | 7.12.1 BY TECHNOLOGY TYPE, 2025-2035 (USD Billion)
      55. | | 7.12.2 BY APPLICATION, 2025-2035 (USD Billion)
      56. | | 7.12.3 BY END-USE, 2025-2035 (USD Billion)
      57. | | 7.12.4 BY COMPONENT, 2025-2035 (USD Billion)
      58. | 7.13 APAC MARKET SIZE ESTIMATES; FORECAST
      59. | | 7.13.1 BY TECHNOLOGY TYPE, 2025-2035 (USD Billion)
      60. | | 7.13.2 BY APPLICATION, 2025-2035 (USD Billion)
      61. | | 7.13.3 BY END-USE, 2025-2035 (USD Billion)
      62. | | 7.13.4 BY COMPONENT, 2025-2035 (USD Billion)
      63. | 7.14 China MARKET SIZE ESTIMATES; FORECAST
      64. | | 7.14.1 BY TECHNOLOGY TYPE, 2025-2035 (USD Billion)
      65. | | 7.14.2 BY APPLICATION, 2025-2035 (USD Billion)
      66. | | 7.14.3 BY END-USE, 2025-2035 (USD Billion)
      67. | | 7.14.4 BY COMPONENT, 2025-2035 (USD Billion)
      68. | 7.15 India MARKET SIZE ESTIMATES; FORECAST
      69. | | 7.15.1 BY TECHNOLOGY TYPE, 2025-2035 (USD Billion)
      70. | | 7.15.2 BY APPLICATION, 2025-2035 (USD Billion)
      71. | | 7.15.3 BY END-USE, 2025-2035 (USD Billion)
      72. | | 7.15.4 BY COMPONENT, 2025-2035 (USD Billion)
      73. | 7.16 Japan MARKET SIZE ESTIMATES; FORECAST
      74. | | 7.16.1 BY TECHNOLOGY TYPE, 2025-2035 (USD Billion)
      75. | | 7.16.2 BY APPLICATION, 2025-2035 (USD Billion)
      76. | | 7.16.3 BY END-USE, 2025-2035 (USD Billion)
      77. | | 7.16.4 BY COMPONENT, 2025-2035 (USD Billion)
      78. | 7.17 South Korea MARKET SIZE ESTIMATES; FORECAST
      79. | | 7.17.1 BY TECHNOLOGY TYPE, 2025-2035 (USD Billion)
      80. | | 7.17.2 BY APPLICATION, 2025-2035 (USD Billion)
      81. | | 7.17.3 BY END-USE, 2025-2035 (USD Billion)
      82. | | 7.17.4 BY COMPONENT, 2025-2035 (USD Billion)
      83. | 7.18 Malaysia MARKET SIZE ESTIMATES; FORECAST
      84. | | 7.18.1 BY TECHNOLOGY TYPE, 2025-2035 (USD Billion)
      85. | | 7.18.2 BY APPLICATION, 2025-2035 (USD Billion)
      86. | | 7.18.3 BY END-USE, 2025-2035 (USD Billion)
      87. | | 7.18.4 BY COMPONENT, 2025-2035 (USD Billion)
      88. | 7.19 Thailand MARKET SIZE ESTIMATES; FORECAST
      89. | | 7.19.1 BY TECHNOLOGY TYPE, 2025-2035 (USD Billion)
      90. | | 7.19.2 BY APPLICATION, 2025-2035 (USD Billion)
      91. | | 7.19.3 BY END-USE, 2025-2035 (USD Billion)
      92. | | 7.19.4 BY COMPONENT, 2025-2035 (USD Billion)
      93. | 7.20 Indonesia MARKET SIZE ESTIMATES; FORECAST
      94. | | 7.20.1 BY TECHNOLOGY TYPE, 2025-2035 (USD Billion)
      95. | | 7.20.2 BY APPLICATION, 2025-2035 (USD Billion)
      96. | | 7.20.3 BY END-USE, 2025-2035 (USD Billion)
      97. | | 7.20.4 BY COMPONENT, 2025-2035 (USD Billion)
      98. | 7.21 Rest of APAC MARKET SIZE ESTIMATES; FORECAST
      99. | | 7.21.1 BY TECHNOLOGY TYPE, 2025-2035 (USD Billion)
      100. | | 7.21.2 BY APPLICATION, 2025-2035 (USD Billion)
      101. | | 7.21.3 BY END-USE, 2025-2035 (USD Billion)
      102. | | 7.21.4 BY COMPONENT, 2025-2035 (USD Billion)
      103. | 7.22 South America MARKET SIZE ESTIMATES; FORECAST
      104. | | 7.22.1 BY TECHNOLOGY TYPE, 2025-2035 (USD Billion)
      105. | | 7.22.2 BY APPLICATION, 2025-2035 (USD Billion)
      106. | | 7.22.3 BY END-USE, 2025-2035 (USD Billion)
      107. | | 7.22.4 BY COMPONENT, 2025-2035 (USD Billion)
      108. | 7.23 Brazil MARKET SIZE ESTIMATES; FORECAST
      109. | | 7.23.1 BY TECHNOLOGY TYPE, 2025-2035 (USD Billion)
      110. | | 7.23.2 BY APPLICATION, 2025-2035 (USD Billion)
      111. | | 7.23.3 BY END-USE, 2025-2035 (USD Billion)
      112. | | 7.23.4 BY COMPONENT, 2025-2035 (USD Billion)
      113. | 7.24 Mexico MARKET SIZE ESTIMATES; FORECAST
      114. | | 7.24.1 BY TECHNOLOGY TYPE, 2025-2035 (USD Billion)
      115. | | 7.24.2 BY APPLICATION, 2025-2035 (USD Billion)
      116. | | 7.24.3 BY END-USE, 2025-2035 (USD Billion)
      117. | | 7.24.4 BY COMPONENT, 2025-2035 (USD Billion)
      118. | 7.25 Argentina MARKET SIZE ESTIMATES; FORECAST
      119. | | 7.25.1 BY TECHNOLOGY TYPE, 2025-2035 (USD Billion)
      120. | | 7.25.2 BY APPLICATION, 2025-2035 (USD Billion)
      121. | | 7.25.3 BY END-USE, 2025-2035 (USD Billion)
      122. | | 7.25.4 BY COMPONENT, 2025-2035 (USD Billion)
      123. | 7.26 Rest of South America MARKET SIZE ESTIMATES; FORECAST
      124. | | 7.26.1 BY TECHNOLOGY TYPE, 2025-2035 (USD Billion)
      125. | | 7.26.2 BY APPLICATION, 2025-2035 (USD Billion)
      126. | | 7.26.3 BY END-USE, 2025-2035 (USD Billion)
      127. | | 7.26.4 BY COMPONENT, 2025-2035 (USD Billion)
      128. | 7.27 MEA MARKET SIZE ESTIMATES; FORECAST
      129. | | 7.27.1 BY TECHNOLOGY TYPE, 2025-2035 (USD Billion)
      130. | | 7.27.2 BY APPLICATION, 2025-2035 (USD Billion)
      131. | | 7.27.3 BY END-USE, 2025-2035 (USD Billion)
      132. | | 7.27.4 BY COMPONENT, 2025-2035 (USD Billion)
      133. | 7.28 GCC Countries MARKET SIZE ESTIMATES; FORECAST
      134. | | 7.28.1 BY TECHNOLOGY TYPE, 2025-2035 (USD Billion)
      135. | | 7.28.2 BY APPLICATION, 2025-2035 (USD Billion)
      136. | | 7.28.3 BY END-USE, 2025-2035 (USD Billion)
      137. | | 7.28.4 BY COMPONENT, 2025-2035 (USD Billion)
      138. | 7.29 South Africa MARKET SIZE ESTIMATES; FORECAST
      139. | | 7.29.1 BY TECHNOLOGY TYPE, 2025-2035 (USD Billion)
      140. | | 7.29.2 BY APPLICATION, 2025-2035 (USD Billion)
      141. | | 7.29.3 BY END-USE, 2025-2035 (USD Billion)
      142. | | 7.29.4 BY COMPONENT, 2025-2035 (USD Billion)
      143. | 7.30 Rest of MEA MARKET SIZE ESTIMATES; FORECAST
      144. | | 7.30.1 BY TECHNOLOGY TYPE, 2025-2035 (USD Billion)
      145. | | 7.30.2 BY APPLICATION, 2025-2035 (USD Billion)
      146. | | 7.30.3 BY END-USE, 2025-2035 (USD Billion)
      147. | | 7.30.4 BY COMPONENT, 2025-2035 (USD Billion)
      148. | 7.31 PRODUCT LAUNCH/PRODUCT DEVELOPMENT/APPROVAL
      149. | | 7.31.1
      150. | 7.32 ACQUISITION/PARTNERSHIP
      151. | | 7.32.1

    Neuromorphic Computing Market Segmentation


    Neuromorphic Computing Market By Technology Type (USD Billion, 2019-2035)

    Analog Neuromorphic Computing

    Digital Neuromorphic Computing

    Hybrid Neuromorphic Computing


    Neuromorphic Computing Market By Application (USD Billion, 2019-2035)

    Robotics

    Natural Language Processing

    Computer Vision

    Automotive Applications


    Neuromorphic Computing Market By End Use (USD Billion, 2019-2035)

    Consumer Electronics

    Healthcare

    Aerospace and Defense

    Industrial Automation


    Neuromorphic Computing Market By Component (USD Billion, 2019-2035)

    Hardware

    Software

    Services


    Neuromorphic Computing Market By Regional (USD Billion, 2019-2035)

    North America

    Europe

    South America

    Asia Pacific

    Middle East and Africa


    Neuromorphic Computing Market Regional Outlook (USD Billion, 2019-2035)


    North America Outlook (USD Billion, 2019-2035)

    North America Neuromorphic Computing Market by Technology Type

    Analog Neuromorphic Computing

    Digital Neuromorphic Computing

    Hybrid Neuromorphic Computing

    North America Neuromorphic Computing Market by Application Type

    Robotics

    Natural Language Processing

    Computer Vision

    Automotive Applications

    North America Neuromorphic Computing Market by End Use Type

    Consumer Electronics

    Healthcare

    Aerospace and Defense

    Industrial Automation

    North America Neuromorphic Computing Market by Component Type

    Hardware

    Software

    Services

    North America Neuromorphic Computing Market by Regional Type

    US

    Canada

    US Outlook (USD Billion, 2019-2035)

    US Neuromorphic Computing Market by Technology Type

    Analog Neuromorphic Computing

    Digital Neuromorphic Computing

    Hybrid Neuromorphic Computing

    US Neuromorphic Computing Market by Application Type

    Robotics

    Natural Language Processing

    Computer Vision

    Automotive Applications

    US Neuromorphic Computing Market by End Use Type

    Consumer Electronics

    Healthcare

    Aerospace and Defense

    Industrial Automation

    US Neuromorphic Computing Market by Component Type

    Hardware

    Software

    Services

    CANADA Outlook (USD Billion, 2019-2035)

    CANADA Neuromorphic Computing Market by Technology Type

    Analog Neuromorphic Computing

    Digital Neuromorphic Computing

    Hybrid Neuromorphic Computing

    CANADA Neuromorphic Computing Market by Application Type

    Robotics

    Natural Language Processing

    Computer Vision

    Automotive Applications

    CANADA Neuromorphic Computing Market by End Use Type

    Consumer Electronics

    Healthcare

    Aerospace and Defense

    Industrial Automation

    CANADA Neuromorphic Computing Market by Component Type

    Hardware

    Software

    Services

    Europe Outlook (USD Billion, 2019-2035)

    Europe Neuromorphic Computing Market by Technology Type

    Analog Neuromorphic Computing

    Digital Neuromorphic Computing

    Hybrid Neuromorphic Computing

    Europe Neuromorphic Computing Market by Application Type

    Robotics

    Natural Language Processing

    Computer Vision

    Automotive Applications

    Europe Neuromorphic Computing Market by End Use Type

    Consumer Electronics

    Healthcare

    Aerospace and Defense

    Industrial Automation

    Europe Neuromorphic Computing Market by Component Type

    Hardware

    Software

    Services

    Europe Neuromorphic Computing Market by Regional Type

    Germany

    UK

    France

    Russia

    Italy

    Spain

    Rest of Europe

    GERMANY Outlook (USD Billion, 2019-2035)

    GERMANY Neuromorphic Computing Market by Technology Type

    Analog Neuromorphic Computing

    Digital Neuromorphic Computing

    Hybrid Neuromorphic Computing

    GERMANY Neuromorphic Computing Market by Application Type

    Robotics

    Natural Language Processing

    Computer Vision

    Automotive Applications

    GERMANY Neuromorphic Computing Market by End Use Type

    Consumer Electronics

    Healthcare

    Aerospace and Defense

    Industrial Automation

    GERMANY Neuromorphic Computing Market by Component Type

    Hardware

    Software

    Services

    UK Outlook (USD Billion, 2019-2035)

    UK Neuromorphic Computing Market by Technology Type

    Analog Neuromorphic Computing

    Digital Neuromorphic Computing

    Hybrid Neuromorphic Computing

    UK Neuromorphic Computing Market by Application Type

    Robotics

    Natural Language Processing

    Computer Vision

    Automotive Applications

    UK Neuromorphic Computing Market by End Use Type

    Consumer Electronics

    Healthcare

    Aerospace and Defense

    Industrial Automation

    UK Neuromorphic Computing Market by Component Type

    Hardware

    Software

    Services

    FRANCE Outlook (USD Billion, 2019-2035)

    FRANCE Neuromorphic Computing Market by Technology Type

    Analog Neuromorphic Computing

    Digital Neuromorphic Computing

    Hybrid Neuromorphic Computing

    FRANCE Neuromorphic Computing Market by Application Type

    Robotics

    Natural Language Processing

    Computer Vision

    Automotive Applications

    FRANCE Neuromorphic Computing Market by End Use Type

    Consumer Electronics

    Healthcare

    Aerospace and Defense

    Industrial Automation

    FRANCE Neuromorphic Computing Market by Component Type

    Hardware

    Software

    Services

    RUSSIA Outlook (USD Billion, 2019-2035)

    RUSSIA Neuromorphic Computing Market by Technology Type

    Analog Neuromorphic Computing

    Digital Neuromorphic Computing

    Hybrid Neuromorphic Computing

    RUSSIA Neuromorphic Computing Market by Application Type

    Robotics

    Natural Language Processing

    Computer Vision

    Automotive Applications

    RUSSIA Neuromorphic Computing Market by End Use Type

    Consumer Electronics

    Healthcare

    Aerospace and Defense

    Industrial Automation

    RUSSIA Neuromorphic Computing Market by Component Type

    Hardware

    Software

    Services

    ITALY Outlook (USD Billion, 2019-2035)

    ITALY Neuromorphic Computing Market by Technology Type

    Analog Neuromorphic Computing

    Digital Neuromorphic Computing

    Hybrid Neuromorphic Computing

    ITALY Neuromorphic Computing Market by Application Type

    Robotics

    Natural Language Processing

    Computer Vision

    Automotive Applications

    ITALY Neuromorphic Computing Market by End Use Type

    Consumer Electronics

    Healthcare

    Aerospace and Defense

    Industrial Automation

    ITALY Neuromorphic Computing Market by Component Type

    Hardware

    Software

    Services

    SPAIN Outlook (USD Billion, 2019-2035)

    SPAIN Neuromorphic Computing Market by Technology Type

    Analog Neuromorphic Computing

    Digital Neuromorphic Computing

    Hybrid Neuromorphic Computing

    SPAIN Neuromorphic Computing Market by Application Type

    Robotics

    Natural Language Processing

    Computer Vision

    Automotive Applications

    SPAIN Neuromorphic Computing Market by End Use Type

    Consumer Electronics

    Healthcare

    Aerospace and Defense

    Industrial Automation

    SPAIN Neuromorphic Computing Market by Component Type

    Hardware

    Software

    Services

    REST OF EUROPE Outlook (USD Billion, 2019-2035)

    REST OF EUROPE Neuromorphic Computing Market by Technology Type

    Analog Neuromorphic Computing

    Digital Neuromorphic Computing

    Hybrid Neuromorphic Computing

    REST OF EUROPE Neuromorphic Computing Market by Application Type

    Robotics

    Natural Language Processing

    Computer Vision

    Automotive Applications

    REST OF EUROPE Neuromorphic Computing Market by End Use Type

    Consumer Electronics

    Healthcare

    Aerospace and Defense

    Industrial Automation

    REST OF EUROPE Neuromorphic Computing Market by Component Type

    Hardware

    Software

    Services

    APAC Outlook (USD Billion, 2019-2035)

    APAC Neuromorphic Computing Market by Technology Type

    Analog Neuromorphic Computing

    Digital Neuromorphic Computing

    Hybrid Neuromorphic Computing

    APAC Neuromorphic Computing Market by Application Type

    Robotics

    Natural Language Processing

    Computer Vision

    Automotive Applications

    APAC Neuromorphic Computing Market by End Use Type

    Consumer Electronics

    Healthcare

    Aerospace and Defense

    Industrial Automation

    APAC Neuromorphic Computing Market by Component Type

    Hardware

    Software

    Services

    APAC Neuromorphic Computing Market by Regional Type

    China

    India

    Japan

    South Korea

    Malaysia

    Thailand

    Indonesia

    Rest of APAC

    CHINA Outlook (USD Billion, 2019-2035)

    CHINA Neuromorphic Computing Market by Technology Type

    Analog Neuromorphic Computing

    Digital Neuromorphic Computing

    Hybrid Neuromorphic Computing

    CHINA Neuromorphic Computing Market by Application Type

    Robotics

    Natural Language Processing

    Computer Vision

    Automotive Applications

    CHINA Neuromorphic Computing Market by End Use Type

    Consumer Electronics

    Healthcare

    Aerospace and Defense

    Industrial Automation

    CHINA Neuromorphic Computing Market by Component Type

    Hardware

    Software

    Services

    INDIA Outlook (USD Billion, 2019-2035)

    INDIA Neuromorphic Computing Market by Technology Type

    Analog Neuromorphic Computing

    Digital Neuromorphic Computing

    Hybrid Neuromorphic Computing

    INDIA Neuromorphic Computing Market by Application Type

    Robotics

    Natural Language Processing

    Computer Vision

    Automotive Applications

    INDIA Neuromorphic Computing Market by End Use Type

    Consumer Electronics

    Healthcare

    Aerospace and Defense

    Industrial Automation

    INDIA Neuromorphic Computing Market by Component Type

    Hardware

    Software

    Services

    JAPAN Outlook (USD Billion, 2019-2035)

    JAPAN Neuromorphic Computing Market by Technology Type

    Analog Neuromorphic Computing

    Digital Neuromorphic Computing

    Hybrid Neuromorphic Computing

    JAPAN Neuromorphic Computing Market by Application Type

    Robotics

    Natural Language Processing

    Computer Vision

    Automotive Applications

    JAPAN Neuromorphic Computing Market by End Use Type

    Consumer Electronics

    Healthcare

    Aerospace and Defense

    Industrial Automation

    JAPAN Neuromorphic Computing Market by Component Type

    Hardware

    Software

    Services

    SOUTH KOREA Outlook (USD Billion, 2019-2035)

    SOUTH KOREA Neuromorphic Computing Market by Technology Type

    Analog Neuromorphic Computing

    Digital Neuromorphic Computing

    Hybrid Neuromorphic Computing

    SOUTH KOREA Neuromorphic Computing Market by Application Type

    Robotics

    Natural Language Processing

    Computer Vision

    Automotive Applications

    SOUTH KOREA Neuromorphic Computing Market by End Use Type

    Consumer Electronics

    Healthcare

    Aerospace and Defense

    Industrial Automation

    SOUTH KOREA Neuromorphic Computing Market by Component Type

    Hardware

    Software

    Services

    MALAYSIA Outlook (USD Billion, 2019-2035)

    MALAYSIA Neuromorphic Computing Market by Technology Type

    Analog Neuromorphic Computing

    Digital Neuromorphic Computing

    Hybrid Neuromorphic Computing

    MALAYSIA Neuromorphic Computing Market by Application Type

    Robotics

    Natural Language Processing

    Computer Vision

    Automotive Applications

    MALAYSIA Neuromorphic Computing Market by End Use Type

    Consumer Electronics

    Healthcare

    Aerospace and Defense

    Industrial Automation

    MALAYSIA Neuromorphic Computing Market by Component Type

    Hardware

    Software

    Services

    THAILAND Outlook (USD Billion, 2019-2035)

    THAILAND Neuromorphic Computing Market by Technology Type

    Analog Neuromorphic Computing

    Digital Neuromorphic Computing

    Hybrid Neuromorphic Computing

    THAILAND Neuromorphic Computing Market by Application Type

    Robotics

    Natural Language Processing

    Computer Vision

    Automotive Applications

    THAILAND Neuromorphic Computing Market by End Use Type

    Consumer Electronics

    Healthcare

    Aerospace and Defense

    Industrial Automation

    THAILAND Neuromorphic Computing Market by Component Type

    Hardware

    Software

    Services

    INDONESIA Outlook (USD Billion, 2019-2035)

    INDONESIA Neuromorphic Computing Market by Technology Type

    Analog Neuromorphic Computing

    Digital Neuromorphic Computing

    Hybrid Neuromorphic Computing

    INDONESIA Neuromorphic Computing Market by Application Type

    Robotics

    Natural Language Processing

    Computer Vision

    Automotive Applications

    INDONESIA Neuromorphic Computing Market by End Use Type

    Consumer Electronics

    Healthcare

    Aerospace and Defense

    Industrial Automation

    INDONESIA Neuromorphic Computing Market by Component Type

    Hardware

    Software

    Services

    REST OF APAC Outlook (USD Billion, 2019-2035)

    REST OF APAC Neuromorphic Computing Market by Technology Type

    Analog Neuromorphic Computing

    Digital Neuromorphic Computing

    Hybrid Neuromorphic Computing

    REST OF APAC Neuromorphic Computing Market by Application Type

    Robotics

    Natural Language Processing

    Computer Vision

    Automotive Applications

    REST OF APAC Neuromorphic Computing Market by End Use Type

    Consumer Electronics

    Healthcare

    Aerospace and Defense

    Industrial Automation

    REST OF APAC Neuromorphic Computing Market by Component Type

    Hardware

    Software

    Services

    South America Outlook (USD Billion, 2019-2035)

    South America Neuromorphic Computing Market by Technology Type

    Analog Neuromorphic Computing

    Digital Neuromorphic Computing

    Hybrid Neuromorphic Computing

    South America Neuromorphic Computing Market by Application Type

    Robotics

    Natural Language Processing

    Computer Vision

    Automotive Applications

    South America Neuromorphic Computing Market by End Use Type

    Consumer Electronics

    Healthcare

    Aerospace and Defense

    Industrial Automation

    South America Neuromorphic Computing Market by Component Type

    Hardware

    Software

    Services

    South America Neuromorphic Computing Market by Regional Type

    Brazil

    Mexico

    Argentina

    Rest of South America

    BRAZIL Outlook (USD Billion, 2019-2035)

    BRAZIL Neuromorphic Computing Market by Technology Type

    Analog Neuromorphic Computing

    Digital Neuromorphic Computing

    Hybrid Neuromorphic Computing

    BRAZIL Neuromorphic Computing Market by Application Type

    Robotics

    Natural Language Processing

    Computer Vision

    Automotive Applications

    BRAZIL Neuromorphic Computing Market by End Use Type

    Consumer Electronics

    Healthcare

    Aerospace and Defense

    Industrial Automation

    BRAZIL Neuromorphic Computing Market by Component Type

    Hardware

    Software

    Services

    MEXICO Outlook (USD Billion, 2019-2035)

    MEXICO Neuromorphic Computing Market by Technology Type

    Analog Neuromorphic Computing

    Digital Neuromorphic Computing

    Hybrid Neuromorphic Computing

    MEXICO Neuromorphic Computing Market by Application Type

    Robotics

    Natural Language Processing

    Computer Vision

    Automotive Applications

    MEXICO Neuromorphic Computing Market by End Use Type

    Consumer Electronics

    Healthcare

    Aerospace and Defense

    Industrial Automation

    MEXICO Neuromorphic Computing Market by Component Type

    Hardware

    Software

    Services

    ARGENTINA Outlook (USD Billion, 2019-2035)

    ARGENTINA Neuromorphic Computing Market by Technology Type

    Analog Neuromorphic Computing

    Digital Neuromorphic Computing

    Hybrid Neuromorphic Computing

    ARGENTINA Neuromorphic Computing Market by Application Type

    Robotics

    Natural Language Processing

    Computer Vision

    Automotive Applications

    ARGENTINA Neuromorphic Computing Market by End Use Type

    Consumer Electronics

    Healthcare

    Aerospace and Defense

    Industrial Automation

    ARGENTINA Neuromorphic Computing Market by Component Type

    Hardware

    Software

    Services

    REST OF SOUTH AMERICA Outlook (USD Billion, 2019-2035)

    REST OF SOUTH AMERICA Neuromorphic Computing Market by Technology Type

    Analog Neuromorphic Computing

    Digital Neuromorphic Computing

    Hybrid Neuromorphic Computing

    REST OF SOUTH AMERICA Neuromorphic Computing Market by Application Type

    Robotics

    Natural Language Processing

    Computer Vision

    Automotive Applications

    REST OF SOUTH AMERICA Neuromorphic Computing Market by End Use Type

    Consumer Electronics

    Healthcare

    Aerospace and Defense

    Industrial Automation

    REST OF SOUTH AMERICA Neuromorphic Computing Market by Component Type

    Hardware

    Software

    Services

    MEA Outlook (USD Billion, 2019-2035)

    MEA Neuromorphic Computing Market by Technology Type

    Analog Neuromorphic Computing

    Digital Neuromorphic Computing

    Hybrid Neuromorphic Computing

    MEA Neuromorphic Computing Market by Application Type

    Robotics

    Natural Language Processing

    Computer Vision

    Automotive Applications

    MEA Neuromorphic Computing Market by End Use Type

    Consumer Electronics

    Healthcare

    Aerospace and Defense

    Industrial Automation

    MEA Neuromorphic Computing Market by Component Type

    Hardware

    Software

    Services

    MEA Neuromorphic Computing Market by Regional Type

    GCC Countries

    South Africa

    Rest of MEA

    GCC COUNTRIES Outlook (USD Billion, 2019-2035)

    GCC COUNTRIES Neuromorphic Computing Market by Technology Type

    Analog Neuromorphic Computing

    Digital Neuromorphic Computing

    Hybrid Neuromorphic Computing

    GCC COUNTRIES Neuromorphic Computing Market by Application Type

    Robotics

    Natural Language Processing

    Computer Vision

    Automotive Applications

    GCC COUNTRIES Neuromorphic Computing Market by End Use Type

    Consumer Electronics

    Healthcare

    Aerospace and Defense

    Industrial Automation

    GCC COUNTRIES Neuromorphic Computing Market by Component Type

    Hardware

    Software

    Services

    SOUTH AFRICA Outlook (USD Billion, 2019-2035)

    SOUTH AFRICA Neuromorphic Computing Market by Technology Type

    Analog Neuromorphic Computing

    Digital Neuromorphic Computing

    Hybrid Neuromorphic Computing

    SOUTH AFRICA Neuromorphic Computing Market by Application Type

    Robotics

    Natural Language Processing

    Computer Vision

    Automotive Applications

    SOUTH AFRICA Neuromorphic Computing Market by End Use Type

    Consumer Electronics

    Healthcare

    Aerospace and Defense

    Industrial Automation

    SOUTH AFRICA Neuromorphic Computing Market by Component Type

    Hardware

    Software

    Services

    REST OF MEA Outlook (USD Billion, 2019-2035)

    REST OF MEA Neuromorphic Computing Market by Technology Type

    Analog Neuromorphic Computing

    Digital Neuromorphic Computing

    Hybrid Neuromorphic Computing

    REST OF MEA Neuromorphic Computing Market by Application Type

    Robotics

    Natural Language Processing

    Computer Vision

    Automotive Applications

    REST OF MEA Neuromorphic Computing Market by End Use Type

    Consumer Electronics

    Healthcare

    Aerospace and Defense

    Industrial Automation

    REST OF MEA Neuromorphic Computing Market by Component Type

    Hardware

    Software

    Services
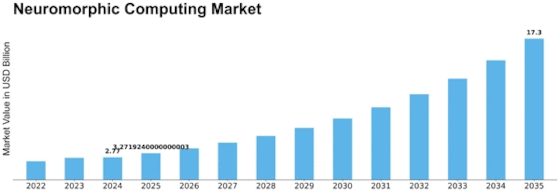


    Infographic

    Free Sample Request

    Kindly complete the form below to receive a free sample of this Report

    Get Free Sample

    Customer Strories

    “I am very pleased with how market segments have been defined in a relevant way for my purposes (such as "Portable Freezers & refrigerators" and "last-mile"). In general the report is well structured. Thanks very much for your efforts.”

    Victoria Milne

    Founder
    Case Study
    Chemicals and Materials

    Compare Licence

    ×
    Features License Type
    Single User Multiuser License Enterprise User
    Price $4,950 $5,950 $7,250
    Maximum User Access Limit 1 User Upto 10 Users Unrestricted Access Throughout the Organization
    Free Customization
    Direct Access to Analyst
    Deliverable Format
    Platform Access
    Discount on Next Purchase 10% 15% 15%
    Printable Versions