• Cat-intel
  • MedIntelliX
  • Resources
  • About Us
  • Request Free Sample ×

    Kindly complete the form below to receive a free sample of this Report

    Leading companies partner with us for data-driven Insights

    clients tt-cursor

    Natural Additives Market

    ID: MRFR/F-B & N/11060-HCR
    128 Pages
    Snehal Singh
    September 2025

    Natural Additives Market Research Report Information By Type (Organic and Conventional), By End Use (Food & Beverage, Dairy & Confectionery, Bakery & Frozen, and Sauces & Dressings), by Origin (Plant, Animals and Insects) And By Region (North America, Europe, Asia-Pacific, And Rest Of The World) –Market Forecast Till 2032

    Share:
    Download PDF ×

    We do not share your information with anyone. However, we may send you emails based on your report interest from time to time. You may contact us at any time to opt-out.

    Natural Additives Market Research Report – Forecast till 2032 Infographic
    Purchase Options
    $ 4,950.0
    $ 5,950.0
    $ 7,250.0
    Table of Contents

    Natural Additives Market Summary

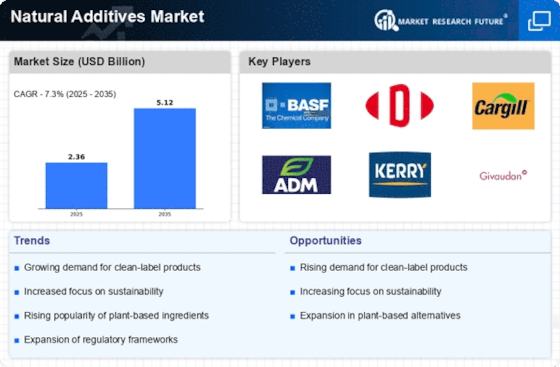
    The Global Natural Additives Market is projected to grow from 2.36 USD Billion in 2024 to 5.11 USD Billion by 2035.

    Key Market Trends & Highlights

    Natural Additives Key Trends and Highlights

    • The market is expected to experience a compound annual growth rate (CAGR) of 7.28 percent from 2025 to 2035.
    • By 2035, the market valuation is anticipated to reach 5.11 USD Billion, indicating robust growth.
    • In 2024, the market is valued at 2.36 USD Billion, reflecting a strong foundation for future expansion.
    • Growing adoption of natural ingredients due to increasing consumer health awareness is a major market driver.

    Market Size & Forecast

    2024 Market Size 2.36 (USD Billion)
    2035 Market Size 5.11 (USD Billion)
    CAGR (2025-2035) 7.28%

    Major Players

    Cargill, Incorporated, ADM, DuPont de Nemours, Inc., Kerry Group plc, Chr. Hansen Holding A/S, BASF SE, Kalsec Inc., Ingredion, Döhler Group, International Flavors & Fragrances Inc.

    Natural Additives Market Trends

    Growing consumer preference for clean-label and healthier food products is driving the market growth.

    Market CAGR for natural additives is being driven by the rising consumer preference for clean-label and healthier food products. Consumers are increasingly scrutinizing product labels and ingredient lists. They prefer products with easily recognizable, natural ingredients, and they often view clean-label products as more trustworthy and wholesome. The pursuit of healthier lifestyles and better dietary choices has prompted consumers to seek foods that are free from synthetic additives, artificial preservatives, and excessive chemicals. Natural additives align with this health-conscious trend by offering functional benefits without the perceived drawbacks of synthetic alternatives.

    Regulatory authorities in various countries are increasingly scrutinizing synthetic additives, leading to stricter regulations and labeling requirements. This has encouraged food manufacturers to explore natural alternatives to ensure compliance. As consumer demand for clean-label products continues to rise, food manufacturers are responding by reformulating their products to include natural additives, which, in turn, drives the growth of the market for these ingredients.

    Thus, driving the Natural Additives market revenue.

    The Global Natural Additives Market is poised for growth as consumers increasingly seek products that align with health-conscious and environmentally sustainable choices, reflecting a broader trend towards natural ingredients in various industries.

    U.S. Department of Agriculture

    Natural Additives Market Drivers

    Health Benefits of Natural Additives

    The Global Natural Additives Market Industry is significantly influenced by the recognized health benefits associated with natural additives. These substances are often perceived as safer and more beneficial compared to their synthetic counterparts. For example, natural preservatives such as rosemary extract and vitamin E are known for their antioxidant properties, which can enhance product shelf life while providing health benefits. This growing awareness among consumers regarding the advantages of natural additives contributes to the market's expansion, with a projected value of 2.36 USD Billion in 2024. The anticipated CAGR of 7.28% from 2025 to 2035 further underscores the increasing preference for health-oriented products.

    Regulatory Support for Natural Additives

    The Global Natural Additives Market Industry benefits from supportive regulatory frameworks that encourage the use of natural additives. Governments across various regions are increasingly implementing regulations that favor natural ingredients over synthetic ones, promoting consumer safety and environmental sustainability. For instance, the European Union has established guidelines that facilitate the approval of natural additives, thereby enhancing their market presence. This regulatory support not only boosts consumer confidence but also stimulates innovation in the development of new natural additives. As a result, the market is poised for substantial growth, aligning with the projected increase in market value to 5.11 USD Billion by 2035.

    Sustainability Trends in Food Production

    The Global Natural Additives Market Industry is increasingly shaped by sustainability trends in food production. As consumers demand more environmentally friendly products, manufacturers are compelled to adopt sustainable practices, including the use of natural additives. These additives not only enhance product quality but also align with the growing emphasis on reducing environmental impact. For instance, natural colorants derived from plants are gaining traction as sustainable alternatives to synthetic dyes. This trend is expected to drive market growth, with the industry projected to reach 5.11 USD Billion by 2035, reflecting a broader commitment to sustainability in food and beverage sectors.

    Rising Consumer Demand for Natural Ingredients

    The Global Natural Additives Market Industry experiences a notable surge in consumer demand for natural ingredients, driven by increasing health consciousness and a preference for clean label products. As consumers become more aware of the potential health risks associated with synthetic additives, they gravitate towards natural alternatives. This shift is reflected in the market's projected growth, with an estimated value of 2.36 USD Billion in 2024 and a forecasted increase to 5.11 USD Billion by 2035. The compound annual growth rate (CAGR) of 7.28% from 2025 to 2035 indicates a robust trend towards natural additives in various sectors, including food and beverages, cosmetics, and pharmaceuticals.

    Technological Advancements in Extraction Methods

    The Global Natural Additives Market Industry is benefiting from technological advancements in extraction methods, which enhance the efficiency and quality of natural additives. Innovations such as supercritical fluid extraction and cold pressing are enabling manufacturers to obtain high-quality natural ingredients with minimal environmental impact. These advancements not only improve the yield of natural additives but also ensure that their beneficial properties are preserved. As a result, the market is expected to grow significantly, with a projected value of 2.36 USD Billion in 2024 and a CAGR of 7.28% from 2025 to 2035, indicating a strong future for natural additives in various applications.

    Market Segment Insights

    Natural Additives Type Insights

    The Natural Additives market segmentation, based on type, includes Organic and Conventional. The organic category dominated the market, accounting for the largest market revenue due to their alignment with consumers' preference for clean, transparent, and health-conscious products. Organic additives are sourced from natural, sustainable, and environmentally responsible methods, appealing to those who prioritize chemical-free, non-GMO, and eco-friendly ingredients. This growing demand for organic natural additives reflects a broader shift towards clean-label and sustainable food and beverage products, driving the prominence of this additive type in the market.

    Natural Additives End-Use Insights

    The Natural Additives market segmentation, based on end use, includes Food & Beverage, Dairy & Confectionery, Bakery & Frozen, and Sauces & Dressings. The food & beverage category dominates the market due to the widespread consumer preference for clean-label and healthier food products. Natural additives are extensively used in this sector to enhance taste, texture, shelf life, and nutritional profiles while meeting the demand for more transparent and natural ingredient lists.

    As the food and beverage industry adapts to changing consumer preferences, the use of natural additives has become a fundamental strategy, making this end-use segment a dominant force in the natural additives market. Further, the dairy & confectionery segment is one of the fastest-growing in the market of natural additives. This is driven by the demand for natural ingredients in dairy products, as well as the confectionery sector.

    Natural Additives Origin Insights

    The Natural Additives market segmentation, based on origin, includes Plants, Animals, and Insects. The plants category dominates the market of natural additives in origin. Plant-based natural additives, derived from sources like fruits, vegetables, and herbs, are widely used in the food and beverage industry due to their clean-label appeal, sustainability, and perceived health benefits. This aligns with the surging consumer preference for plant-based and natural ingredients in food products.

    Figure 1: Natural Additives Market, by Origin, 2022 & 2032 (USD Billion)

    Source: The Secondary Research, Primary Research, Market Research Future Database and Analyst Review

    Get more detailed insights about Natural Additives Market Research Report – Forecast till 2032

    Regional Insights

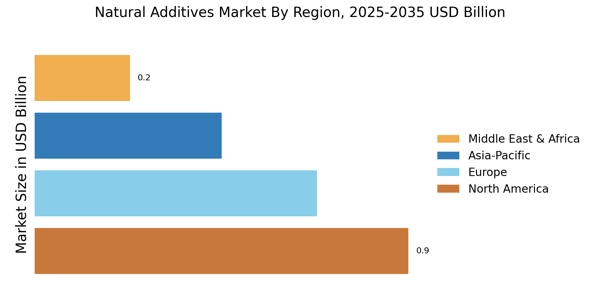
    By region, the study gives market insights into the North America, Europe, Asia-Pacific and the Rest of the World. The North American Natural Additives market area dominates the market due to stringent regulatory standards and a well-established clean-label food trend, driving both consumer and industry demand for natural and safer food ingredients. The region's robust research and development efforts, combined with a strong emphasis on sustainability and food safety, further contribute to its leadership in the natural additives market.

    Further, the prime countries studied in the market report are The US, Canada, Germany, France, the UK, Italy, Spain, Japan, China, India, Australia, South Korea, and Brazil.

    Figure 2: NATURAL ADDITIVES MARKET SHARE BY REGION 2022 (USD Billion)

    NATURAL ADDITIVES MARKET SHARE BY REGION 2022

    Source: The Secondary Research, Primary Research, Market Research Future Database and Analyst Review

    Europe's Natural Additives market accounts for the second-largest market share due to the stringent food safety regulations, a growing preference for clean-label products, and increased consumer awareness of the health and the environmental benefits of natural ingredients in food and beverages. Further, the German Natural Additives market held the largest market share, and the UK Natural Additives market was the fastest-growing market in European region.

    The Asia-Pacific Natural Additives Market is expected to rise at the fastest CAGR from 2023 to 2032. This is due to the region's expanding food and beverage industry, which is increasingly focused on clean-label products and consumer demand for natural and healthier ingredients. Moreover, China’s Natural Additives market held the largest market share, and the Indian Natural Additives market was the fastest-growing market in Asia-Pacific region.

    Key Players and Competitive Insights

    Leading market players are investing heavily in research and development in order to spread their product lines, which will help the Natural Additives market grow even more. Market players are also undertaking a variety of strategic activities to spread their footprint, with important market developments including contractual agreements, new product launches, mergers and acquisitions, higher investments, and collaboration with other organizations. To spread and survive in a more competitive and rising market climate, the Natural Additives industry must offer cost-effective items.

    Manufacturing locally to minimize the operational costs is one of the key business tactics used by the manufacturers in the Natural Additives industry to benefit the clients and increase the market sector. In recent years, the Natural Additives industry has offered some of the most significant advantages to the food industry. Major players in the natural additives market include Cargill, Incorporated, ADM, DuPont de Nemours, Inc., Kerry Group plc, Chr. Hansen Holding A/S, BASF SE, Kalsec Inc., Ingredion, DöhlerGroup, International Flavors & Fragrances Inc., and others are trying to increase the market demand by investing in research and development operations.

    DuPont Nutrition & Biosciences, formerly known as DuPont Nutrition & Health, is a leader in food and beverage, healthcare, and industrial biotechnology sectors. The company is known for its innovative solutions in the development of ingredients and technologies that enhance the nutritional, taste, texture, and safety of various products. DuPont Nutrition & Biosciences operates in a wide range of applications, including food and beverage, dietary supplements, pharmaceuticals, and personal care. The company's expertise in science and research contributes to advancements in nutrition and biotechnology. In May 2023, DuPont Nutrition & Biosciences announced a partnership with Chr.

    Hansen, a manufacturer of natural food cultures and enzymes develops and commercializes new natural food solutions for food and beverage manufacturers. This partnership will help DuPont Nutrition & Biosciences expand its portfolio of natural food solutions and meet the growing demand for natural food solutions from food and beverage manufacturers.

    DSM (short for Royal DSM N.V.) is a science-based company headquartered in Heerlen, Netherlands. It is a leading company in the field of health, nutrition, and materials. Innovation is a core part of DSM's strategy. The company invests heavily in research and development to create innovative products and technologies that benefit society and the environment. DSM's work is grounded in science and research, and it collaborates with experts and institutions to address complex challenges, particularly in the areas of nutrition, health, and sustainability.

    In April 2023, DSM announced a partnership with Givaudan, a manufacturer of natural flavors and fragrances, to develop and commercialize new natural food and beverage solutions. This partnership will help DSM to expand its portfolio of natural food and beverage solutions and meet the growing demand for natural food and beverage solutions from food and beverage manufacturers.

    Key Companies in the Natural Additives Market market include

    Industry Developments

    May 2023: Ingredion acquired PureCircle Stevia, a manufacturer of stevia sweeteners, for $600 million. PureCircle Stevia produces a range of stevia sweeteners, including Reb A, Reb D, and Reb M. This acquisition will help Ingredion to expand its portfolio of natural sweeteners and meet the growing demand for natural sweeteners from food and beverage manufacturers.
    June 2023: Kerry Group announced a partnership with Natreon, a manufacturer of natural preservatives, to develop and commercialize new natural preservation solutions for food and beverage manufacturers. This partnership will help Kerry Group to expand its portfolio of natural preservation solutions and meet the growing demand for natural preservatives from food and beverage manufacturers.
    March 2023: Tate & Lyle announced a partnership with Firmenich to develop and produce sustainable natural flavors and fragrances. The partnership will focus on developing new natural flavors and fragrances for a variety of food and beverage applications.

    Future Outlook

    Natural Additives Market Future Outlook

    The Global Natural Additives Market is projected to grow at a 7.28% CAGR from 2024 to 2035, driven by increasing consumer demand for clean-label products and sustainable sourcing.

    New opportunities lie in:

    • Develop innovative plant-based additives to cater to health-conscious consumers.
    • Leverage technology for enhanced extraction processes to improve product quality.
    • Expand distribution channels in emerging markets to capture new customer segments.

    By 2035, the market is expected to achieve substantial growth, solidifying its position as a key player in the food and beverage industry.

    Market Segmentation

    Natural Additives Type Outlook

    • Organic
    • Conventional

    Natural Additives Origin Outlook

    • Plant
    • Animals
    • Insects

    Natural Additives End-Use Outlook

    • Food & Beverage
    • Dairy & Confectionery
    • Bakery & Frozen
    • Sauces & Dressings

    Natural Additives Regional Outlook

    • US
    • Canada

    Report Scope

    Report Attribute/Metric Details
    Market Size 2023 USD 2.2 Billion
    Market Size 2024 USD 2.36 Billion
    Market Size 2032 USD 4.14 Billion
    Compound Annual Growth Rate (CAGR) 7.30% (2024-2032)
    Base Year 2023
    Market Forecast Period 2024-2032
    Historical Data 2019- 2022
    Market Forecast Units Value (USD Billion)
    Report Coverage Revenue Forecast, The Market Competitive Landscape, Growth Factors, and Trends
    Segments Covered Type, End Use, Origin and Region
    Geographies Covered North America, Europe, Asia Pacific, and the Rest of the World
    Countries Covered The US, Canada, Germany, France, UK, Italy, Spain, Japan, China, India, Australia, South Korea, and Brazil
    Key Companies Profiled Cargill, Incorporated, ADM, DuPont de Nemours, Inc., Kerry Group plc, Chr. Hansen Holding A/S, BASF SE, Kalsec Inc., Ingredion, DöhlerGroup, and International Flavors & Fragrances Inc
    Key Market Opportunities The regulatory push and industry focus on food safety and sustainability.
    Key Market Dynamics Increased consumer preference for clean-label and healthier food products.

    Market Highlights

    Author
    Snehal Singh
    Assistant Manager - Research

    High acumen in analyzing complex macro & micro markets with more than 6 years of work experience in the field of market research. By implementing her analytical skills in forecasting and estimation into market research reports, she has expertise in Packaging, Construction, and Equipment domains. She handles a team size of 20-25 resources and ensures smooth running of the projects, associated marketing activities, and client servicing.

    Leave a Comment

    FAQs

    How much is the Natural Additives market?

    The Natural Additives market size was valued at USD 2.2 Billion in 2023.

    What is the growth rate of the Natural Additives market?

    The market is foreseen to rise at a CAGR of 7.30% during the forecast period, 2024-2032.

    Which region had largest market share in the Natural Additives market?

    North America held the largest share in the market

    Who are the key participants in the Natural Additives market?

    The key participants in the market are Cargill, Incorporated, ADM, DuPont de Nemours, Inc., Kerry Group plc, Chr. Hansen Holding A/S, BASF SE, Kalsec Inc., Ingredion, DöhlerGroup, and International Flavors & Fragrances Inc.

    Which type led the Natural Additives market?

    The organic category dominates the market in 2023.

    Which end-use held the largest market share in the Natural Additives market?

    The food & beverage held the largest share in the market.

    1. 'Table of Contents
    2. Executive summary
    3. Market Introduction
    4. Definition
    5. Scope of the Study
    6. Research Objective
    7. Assumptions
    8. Limitations
    9. Research Methodology
    10. Overview
    11. Data Mining
    12. Secondary Research
    13. Primary Research
    14. Primary Interviews and
    15. Information Gathering Process
    16. Breakdown of Primary Respondents
    17. Forecasting Model
    18. Market Size Estimation
    19. Bottom-Up Approach
    20. Top-Down Approach
    21. Data Triangulation
    22. Validation
    23. Market Dynamics
    24. Overview
    25. Drivers
    26. Restraints
    27. Opportunities
    28. Market Factor Analysis
    29. Value Chain Analysis
    30. Porter’s Five Forces Analysis
    31. Bargaining Power of Suppliers
    32. Bargaining Power of Buyers
    33. Threat of New Entrants
    34. Threat of Substitutes
    35. Intensity of Rivalry
    36. COVID-19 Impact Analysis
    37. Market Impact Analysis
    38. Regional Impact
    39. Opportunity and Threat
    40. Analysis
    41. GLOBAL
    42. CARRY BAG MARKET, BY Type
    43. Overview
    44. Organic
    45. Conventional
    46. GLOBAL CARRY BAG MARKET,
    47. BY End Use
    48. Overview
    49. Food & Beverage
    50. Dairy & Confectionery
    51. Bakery & Frozen
    52. Sauces & Dressings
    53. GLOBAL CARRY BAG MARKET,
    54. By Origin
    55. Overview
    56. Plants
    57. Animals
    58. Insects
    59. GLOBAL CARRY BAG MARKET, by Region
    60. Overview
    61. North America
    62. US
    63. Canada
    64. Europe
    65. Germany
    66. France
    67. UK
    68. Italy
    69. Spain
    70. Rest of Europe
    71. Asia-Pacific
    72. China
    73. India
    74. Japan
    75. South Korea
    76. Australia
    77. Rest of Asia-Pacific
    78. Rest of the World
    79. Middle East
    80. Africa
    81. Latin
    82. America
    83. Competitive Landscape
    84. Overview
    85. Competitive Analysis
    86. Market Share Analysis
    87. Major Growth Strategy
    88. in the Global Carry bag Market,
    89. Competitive Benchmarking
    90. Leading Players in Terms of Number of Developments in the
    91. Global Carry bag Market,
    92. Key developments and Growth Strategies
    93. New Product Launch/Service Deployment
    94. Merger & Acquisitions
    95. Joint Ventures
    96. Major Players Financial
    97. Matrix
    98. Sales
    99. & Operating Income, 2022
    100. Major Players R&D Expenditure. 2022
    101. Company ProfileS
    102. Cargill Incorporated
    103. Company Overview
    104. Financial Overview
    105. Products Offered
    106. Key Developments
    107. SWOT Analysis
    108. Key Strategies
    109. ADM
    110. Company Overview
    111. Financial Overview
    112. Products Offered
    113. Key Developments
    114. SWOT Analysis
    115. Key Strategies
    116. DuPont de Nemours, Inc
    117. Company Overview
    118. Financial Overview
    119. Products Offered
    120. Key Developments
    121. SWOT Analysis
    122. Key Strategies
    123. Kerry Group Plc
    124. Company Overview
    125. Financial Overview
    126. Products Offered
    127. Key Developments
    128. SWOT Analysis
    129. Key Strategies
    130. Hansen Holding A/S
    131. Company Overview
    132. Financial Overview
    133. Products Offered
    134. Key Developments
    135. SWOT Analysis
    136. Key Strategies
    137. BASF SE
    138. Company Overview
    139. Financial Overview
    140. Products Offered
    141. Key Developments
    142. SWOT Analysis
    143. Key Strategies
    144. Kalsec Inc.
    145. Company Overview
    146. Financial Overview
    147. Products Offered
    148. Key Developments
    149. SWOT Analysis
    150. Key Strategies
    151. Ingredion
    152. Company Overview
    153. Financial Overview
    154. Products Offered
    155. Key Developments
    156. SWOT Analysis
    157. Key Strategies
    158. Dohler Group
    159. Company Overview
    160. Financial Overview
    161. Products Offered
    162. Key Developments
    163. SWOT Analysis
    164. Key Strategies
    165. International Flavors & Fragrances Inc
    166. Company Overview
    167. Financial Overview
    168. Products Offered
    169. Key Developments
    170. SWOT Analysis
    171. Key Strategies
    172. References
    173. Related Reports
    174. Global Carry bag
    175. Market, Synopsis, 2024-2032
    176. Global Carry bag Market, Estimates & Forecast, 2024-2032 (USD BILLION)
    177. GLOBAL CARRY BAG MARKET,
    178. BY Type, 2024-2032 (USD BILLION)
    179. GLOBAL CARRY BAG MARKET, By End Use, 2024-2032 (USD BILLION)
    180. GLOBAL CARRY BAG MARKET,
    181. By Origin, 2024-2032 (USD BILLION)
    182. North America: CARRY BAG MARKET, BY Type, 2024-2032 (USD
    183. BILLION)
    184. North
    185. America: CARRY BAG MARKET, By End Use, 2024-2032 (USD BILLION)
    186. North America: CARRY BAG MARKET,
    187. By Origin, 2024-2032 (USD BILLION)
    188. US: CARRY BAG MARKET, BY Type, 2024-2032 (USD BILLION)
    189. US: CARRY BAG MARKET,
    190. By End Use, 2024-2032 (USD BILLION)
    191. US: CARRY BAG MARKET, By Origin, 2024-2032 (USD BILLION)
    192. Canada: CARRY BAG MARKET,
    193. BY Type, 2024-2032 (USD BILLION)
    194. Canada: CARRY BAG MARKET, By End Use, 2024-2032 (USD BILLION)
    195. Canada: CARRY BAG MARKET,
    196. By Origin, 2024-2032 (USD BILLION)
    197. Europe: CARRY BAG MARKET, BY Type, 2024-2032 (USD BILLION)
    198. Europe: CARRY BAG MARKET,
    199. By End Use, 2024-2032 (USD BILLION)
    200. Europe: CARRY BAG MARKET, By Origin, 2024-2032 (USD BILLION)
    201. germany: CARRY BAG MARKET,
    202. BY Type, 2024-2032 (USD BILLION)
    203. germany: CARRY BAG MARKET, By End Use, 2024-2032 (USD BILLION)
    204. germany: CARRY BAG MARKET,
    205. By Origin, 2024-2032 (USD BILLION)
    206. FRANCE: CARRY BAG MARKET, BY Type, 2024-2032 (USD BILLION)
    207. FRANCE: CARRY BAG MARKET,
    208. By End Use, 2024-2032 (USD BILLION)
    209. FRANCE: CARRY BAG MARKET, By Origin, 2024-2032 (USD BILLION)
    210. italy: CARRY BAG MARKET,
    211. BY Type, 2024-2032 (USD BILLION)
    212. italy: CARRY BAG MARKET, By End Use, 2024-2032 (USD BILLION)
    213. italy: CARRY BAG MARKET,
    214. By Origin, 2024-2032 (USD BILLION)
    215. spain: CARRY BAG MARKET, BY Type, 2024-2032 (USD BILLION)
    216. spain: CARRY BAG MARKET,
    217. By End Use, 2024-2032 (USD BILLION)
    218. spain: CARRY BAG MARKET, By Origin, 2024-2032 (USD BILLION)
    219. UK: CARRY BAG MARKET,
    220. BY Type, 2024-2032 (USD BILLION)
    221. UK: CARRY BAG MARKET, By End Use, 2024-2032 (USD BILLION)
    222. UK: CARRY BAG MARKET,
    223. By Origin, 2024-2032 (USD BILLION)
    224. rest of europe: CARRY BAG MARKET, BY Type, 2024-2032 (USD
    225. BILLION)
    226. rest
    227. of europe: CARRY BAG MARKET, By End Use, 2024-2032 (USD BILLION)
    228. rest of europe: CARRY BAG MARKET,
    229. By Origin, 2024-2032 (USD BILLION)
    230. Asia-Pacific: CARRY BAG MARKET, BY Type, 2024-2032 (USD
    231. BILLION)
    232. Asia-Pacific:
    233. CARRY BAG MARKET, By End Use, 2024-2032 (USD BILLION)
    234. Asia-Pacific: CARRY BAG MARKET, By Origin, 2024-2032
    235. (USD BILLION)
    236. japan:
    237. CARRY BAG MARKET, BY Type, 2024-2032 (USD BILLION)
    238. japan: CARRY BAG MARKET, By End Use, 2024-2032 (USD
    239. BILLION)
    240. japan:
    241. CARRY BAG MARKET, By Origin, 2024-2032 (USD BILLION)
    242. china: CARRY BAG MARKET, BY Type, 2024-2032 (USD
    243. BILLION)
    244. china:
    245. CARRY BAG MARKET, By End Use, 2024-2032 (USD BILLION)
    246. china: CARRY BAG MARKET, By Origin, 2024-2032 (USD
    247. BILLION)
    248. india:
    249. CARRY BAG MARKET, BY Type, 2024-2032 (USD BILLION)
    250. india: CARRY BAG MARKET, By End Use, 2024-2032 (USD
    251. BILLION)
    252. india:
    253. CARRY BAG MARKET, By Origin, 2024-2032 (USD BILLION)
    254. australia: CARRY BAG MARKET, BY Type, 2024-2032 (USD
    255. BILLION)
    256. australia:
    257. CARRY BAG MARKET, By End Use, 2024-2032 (USD BILLION)
    258. australia: CARRY BAG MARKET, By Origin, 2024-2032
    259. (USD BILLION)
    260. south
    261. korea: CARRY BAG MARKET, BY Type, 2024-2032 (USD BILLION)
    262. south korea: CARRY BAG MARKET, By End Use, 2024-2032
    263. (USD BILLION)
    264. south
    265. korea: CARRY BAG MARKET, By Origin, 2024-2032 (USD BILLION)
    266. rest of asia-pacific: CARRY BAG MARKET, BY Type,
    267. 2032 (USD BILLION)
    268. rest of asia-pacific: CARRY BAG MARKET, By End Use, 2024-2032 (USD
    269. BILLION)
    270. rest
    271. of asia-pacific: CARRY BAG MARKET, By Origin, 2024-2032 (USD BILLION)
    272. rest of the world: CARRY
    273. BAG MARKET, BY Type, 2024-2032 (USD BILLION)
    274. rest of the world: CARRY BAG MARKET, By End Use,
    275. 2032 (USD BILLION)
    276. rest of the world: CARRY BAG MARKET, By Origin, 2024-2032 (USD BILLION)
    277. Middle east: CARRY BAG
    278. MARKET, BY Type, 2024-2032 (USD BILLION)
    279. Middle east: CARRY BAG MARKET, By End Use, 2024-2032 (USD
    280. BILLION)
    281. Middle
    282. east: CARRY BAG MARKET, By Origin, 2024-2032 (USD BILLION)
    283. Africa: CARRY BAG MARKET, BY Type, 2024-2032 (USD
    284. BILLION)
    285. Africa:
    286. CARRY BAG MARKET, By End Use, 2024-2032 (USD BILLION)
    287. Africa: CARRY BAG MARKET, By Origin, 2024-2032 (USD
    288. BILLION)
    289. Latin
    290. america: CARRY BAG MARKET, BY Type, 2024-2032 (USD BILLION)
    291. Latin america: CARRY BAG MARKET, By End Use, 2024-2032
    292. (USD BILLION)
    293. Latin
    294. america: CARRY BAG MARKET, By Origin, 2024-2032 (USD BILLION)
    295. Research Process
    296. Market Structure for
    297. the Global Carry bag Market
    298. Market Dynamics for the Global Carry bag Market
    299. Global Carry bag Market, Share (%), BY Type, 2022
    300. Global Carry bag Market,
    301. Share (%), By End Use, 2022
    302. Global Carry bag Market, Share (%), By Origin, 2022
    303. Global Carry bag Market, Share
    304. (%), By Origin, 2022
    305. Global
    306. Carry bag Market, Share (%), by Region, 2022
    307. north AMERICA: CARRY BAG MARKET, SHARE (%), BY REGION,
    308. Europe:
    309. CARRY BAG MARKET, SHARE (%), BY REGION, 2022
    310. Asia-Pacific: CARRY BAG MARKET, SHARE (%), BY REGION,
    311. Rest of
    312. the world: CARRY BAG MARKET, SHARE (%), BY REGION, 2022
    313. Global Carry bag Market: Company Share Analysis,
    314. cargill
    315. incorporated: FINANCIAL OVERVIEW SNAPSHOT
    316. cargill incorporated: SWOT ANALYSIS
    317. Adm:FINANCIAL OVERVIEW SNAPSHOT
    318. Adm:SWOT ANALYSIS
    319. dupont de nemours inc:FINANCIAL
    320. OVERVIEW SNAPSHOT
    321. dupont
    322. de nemours inc:SWOT ANALYSIS
    323. kerry group plc: FINANCIAL OVERVIEW SNAPSHOT
    324. kerry group plc:SWOT ANALYSIS
    325. hansen holdings a/s:FINANCIAL OVERVIEW SNAPSHOT
    326. hansen holdings a/s:SWOT
    327. ANALYSIS
    328. basf
    329. se:FINANCIAL OVERVIEW SNAPSHOT
    330. basf se:SWOT ANALYSIS
    331. kalsec inc: FINANCIAL OVERVIEW SNAPSHOT
    332. kalsec inc: SWOT ANALYSIS
    333. ingredion: FINANCIAL
    334. OVERVIEW SNAPSHOT
    335. ingredion:
    336. SWOT ANALYSIS
    337. dolher
    338. group: FINANCIAL OVERVIEW SNAPSHOT
    339. dolher group: SWOT ANALYSIS
    340. international flavours & Fragrances Inc:FINANCIAL
    341. OVERVIEW SNAPSHOT
    342. international
    343. flavours & Fragrances Inc:SWOT ANALYSIS

    Natural Additives Market Segmentation

    Natural Additives Type Outlook (USD Billion, 2018-2032)

    • Organic
    • Conventional

    Natural Additives End Use Outlook (USD Billion, 2018-2032)

    • Food & Beverage
    • Dairy & Confectionery
    • Bakery & Frozen
    • Sauces & Dressings

    Natural Additives Origin Outlook (USD Billion, 2018-2032)

    • Plant
    • Animals
    • Insects

    Natural Additives Regional Outlook (USD Billion, 2018-2032)

    • North America Outlook (USD Billion, 2018-2032)

      • North America Natural Additives by Type
        • Organic
        • Conventional
      • North America Natural Additives by End Use
        • Food & Beverage
        • Dairy & Confectionery
        • Bakery & Frozen
        • Sauces & Dressings
      • North America Natural Additives by Origin
        • Plants
        • Animals
        • Insects
      • US Outlook (USD Billion, 2018-2032)

      • US Natural Additives by Type
        • Organic
        • Conventional
      • US Natural Additives by End Use
        • Food & Beverage
        • Dairy & Confectionery
        • Bakery & Frozen
        • Sauces & Dressings
      • US Natural Additives by Origin
        • Plants
        • Animals
        • Insects
      • CANADA Outlook (USD Billion, 2018-2032)

      • CANADA Natural Additives by Type
        • Organic
        • Conventional
      • CANADA Natural Additives by End Use
        • Food & Beverage
        • Dairy & Confectionery
        • Bakery & Frozen
        • Sauces & Dressings
      • CANADA Natural Additives by Origin
        • Plants
        • Animals
        • Insects
    • Europe Outlook (USD Billion, 2018-2032)

      • Europe Natural Additives by Type
        • Organic
        • Conventional
      • Europe Natural Additives by End Use
        • Food & Beverage
        • Dairy & Confectionery
        • Bakery & Frozen
        • Sauces & Dressings
      • Europe Natural Additives by Origin
        • Plants
        • Animals
        • Insects
      • Germany Outlook (USD Billion, 2018-2032)

      • Germany Natural Additives by Type
        • Organic
        • Conventional
      • Germany Natural Additives by End Use
        • Food & Beverage
        • Dairy & Confectionery
        • Bakery & Frozen
        • Sauces & Dressings
      • Germany Natural Additives by Origin
        • Plants
        • Animals
        • Insects
      • France Outlook (USD Billion, 2018-2032)

      • France Natural Additives by Type
        • Organic
        • Conventional
      • France Natural Additives by End Use
        • Food & Beverage
        • Dairy & Confectionery
        • Bakery & Frozen
        • Sauces & Dressings
      • France Natural Additives by Origin
        • Plants
        • Animals
        • Insects
      • UK Outlook (USD Billion, 2018-2032)

      • UK Natural Additives by Type
        • Organic
        • Conventional
      • UK Natural Additives by End Use
        • Food & Beverage
        • Dairy & Confectionery
        • Bakery & Frozen
        • Sauces & Dressings
      • UK Natural Additives by Origin
        • Plants
        • Animals
        • Insects
      • ITALY Outlook (USD Billion, 2018-2032)

      • ITALY Natural Additives by Type
        • Organic
        • Conventional
      • ITALY Natural Additives by End Use
        • Food & Beverage
        • Dairy & Confectionery
        • Bakery & Frozen
        • Sauces & Dressings
      • ITALY Natural Additives by Origin
        • Plants
        • Animals
        • Insects
      • SPAIN Outlook (USD Billion, 2018-2032)

      • Spain Natural Additives by Type
        • Organic
        • Conventional
      • Spain Natural Additives by End Use
        • Food & Beverage
        • Dairy & Confectionery
        • Bakery & Frozen
        • Sauces & Dressings
      • Spain Natural Additives by Origin
        • Plants
        • Animals
        • Insects
      • Rest Of Europe Outlook (USD Billion, 2018-2032)

      • Rest Of Europe Natural Additives by Type
        • Organic
        • Conventional
      • REST OF EUROPE Natural Additives by End Use
        • Food & Beverage
        • Dairy & Confectionery
        • Bakery & Frozen
        • Sauces & Dressings
      • REST OF EUROPE Natural Additives by Origin
        • Plants
        • Animals
        • Insects
    • Asia-Pacific Outlook (USD Billion, 2018-2032)

      • Asia-Pacific Natural Additives by Type
        • Organic
        • Conventional
      • Asia-Pacific Natural Additives by End Use
        • Food & Beverage
        • Dairy & Confectionery
        • Bakery & Frozen
        • Sauces & Dressings
      • Asia-Pacific Natural Additives by Origin
        • Plants
        • Animals
        • Insects
      • China Outlook (USD Billion, 2018-2032)

      • China Natural Additives by Type
        • Organic
        • Conventional
      • China Natural Additives by End Use
        • Food & Beverage
        • Dairy & Confectionery
        • Bakery & Frozen
        • Sauces & Dressings
      • China Natural Additives by Origin
        • Plants
        • Animals
        • Insects
      • Japan Outlook (USD Billion, 2018-2032)

      • Japan Natural Additives by Type
        • Organic
        • Conventional
      • Japan Natural Additives by End Use
        • Food & Beverage
        • Dairy & Confectionery
        • Bakery & Frozen
        • Sauces & Dressings
      • Japan Natural Additives by Origin
        • Plants
        • Animals
        • Insects
      • India Outlook (USD Billion, 2018-2032)

      • India Natural Additives by Type
        • Organic
        • Conventional
      • India Natural Additives by End Use
        • Food & Beverage
        • Dairy & Confectionery
        • Bakery & Frozen
        • Sauces & Dressings
      • India Natural Additives by Origin
        • Plants
        • Animals
        • Insects
      • Australia Outlook (USD Billion, 2018-2032)

      • Australia Natural Additives by Type
        • Organic
        • Conventional
      • Australia Natural Additives by End Use
        • Food & Beverage
        • Dairy & Confectionery
        • Bakery & Frozen
        • Sauces & Dressings
      • Australia Natural Additives by Origin
        • Plants
        • Animals
        • Insects
      • Rest of Asia-Pacific Outlook (USD Billion, 2018-2032)

      • Rest of Asia-Pacific Natural Additives by Type
        • Organic
        • Conventional
      • Rest of Asia-Pacific Natural Additives by End Use
        • Food & Beverage
        • Dairy & Confectionery
        • Bakery & Frozen
        • Sauces & Dressings
      • Rest of Asia-Pacific Natural Additives by Origin
        • Plants
        • Animals
        • Insects
    • Rest of the World Outlook (USD Billion, 2018-2032)

      • Rest of the World Natural Additives by Type
        • Organic
        • Conventional
      • Rest of the World Natural Additives by End Use
        • Food & Beverage
        • Dairy & Confectionery
        • Bakery & Frozen
        • Sauces & Dressings
      • Rest of the World Natural Additives by Origin
        • Plants
        • Animals
        • Insects
      • Middle East Outlook (USD Billion, 2018-2032)

      • Middle East Natural Additives by Type
        • Organic
        • Conventional
      • Middle East Natural Additives by End Use
        • Food & Beverage
        • Dairy & Confectionery
        • Bakery & Frozen
        • Sauces & Dressings
      • Middle East Natural Additives by Origin
        • Plants
        • Animals
        • Insects
      • Africa Outlook (USD Billion, 2018-2032)

      • Africa Natural Additives by Type
        • Organic
        • Conventional
      • Africa Natural Additives by End Use
        • Food & Beverage
        • Dairy & Confectionery
        • Bakery & Frozen
        • Sauces & Dressings
      • Africa Natural Additives by Origin
        • Plants
        • Animals
        • Insects
      • Latin America Outlook (USD Billion, 2018-2032)

      • Latin America Natural Additives by Type
        • Organic
        • Conventional
      • Latin America Natural Additives by End Use
        • Food & Beverage
        • Dairy & Confectionery
        • Bakery & Frozen
        • Sauces & Dressings
      • Latin America Natural Additives by Origin
        • Plants
        • Animals
        • Insects
    Report Infographic
    Free Sample Request

    Kindly complete the form below to receive a free sample of this Report

    Customer Strories

    “I am very pleased with how market segments have been defined in a relevant way for my purposes (such as "Portable Freezers & refrigerators" and "last-mile"). In general the report is well structured. Thanks very much for your efforts.”

    Victoria Milne Founder
    Case Study

    Chemicals and Materials