• Cat-intel
  • MedIntelliX
  • Resources
  • About Us
  • Hero Background
    English
    Chinese
    French
    Japanese
    Korean
    German
    Spanish

    Multimodal UI Market Analysis

    ID: MRFR/ICT/10710-HCR
    215 Pages
    Aarti Dhapte
    October 2025

    Multimodal UI Market Research Report Information By Component (Hardware, Software and Services), By Technology (Voice Recognition, Text Input, Gesture Recognition, Visual, Others), By End User Vertical (Automotive, Healthcare, Entertainment, IT & Telecommunication, Retail, and Others) By Region (North America, Europe, Asia-Pacific, Middle East and Africa and South America) - Forecast Till 2035

    Share:
    Download PDF ×

    We do not share your information with anyone. However, we may send you emails based on your report interest from time to time. You may contact us at any time to opt-out.

    Multimodal UI Market Infographic
    $ 4,950.0
    $ 5,950.0
    $ 7,250.0

    Market Analysis

    In-depth Analysis of Multimodal UI Market Industry Landscape

    The Multimodal User Interface (UI) Market is a dynamic and influential sector shaped by various market factors that collectively contribute to its growth and impact across a wide range of applications. One of the key drivers in this market is the growing need for improved user experiences across devices and applications. Multimodal UI, characterized by its ability to integrate multiple modes of interaction, such as voice, touch, and gestures, emerges as a key enabler for intuitive and immersive user interfaces in smartphones, smart home devices, automotive systems, and other digital platforms.

    Technological innovation is a cornerstone in the Multimodal UI Market. The rise of intelligent UI solutions capable of recognizing and interpreting user inputs through various modalities has been facilitated by advancements in natural language processing, computer vision, sensor technologies etc. Innovations like gesture recognition itself or voice-controlled interfaces or even touch-based interactions are thus driving businesses as well as device manufacturers towards more engaging user-friendly experiences.

    Global economic conditions play a significant role in shaping the Multimodal UI Market. Economic factors can impact investment decisions made by technology companies on multimodal UI technologies. During periods of economic growth there tends to be increased funding for research & development leading to the emergence of innovative UI solutions designed for diverse applications. On the contrary, during economic recessions organizations may take conservative stance resulting into slow investment tempo within the Multimodal UI sector.

    Regulatory turbulence and privacy concerns are important aspects of the Multimodal UI Market. As user experience solutions tend to include processing of client data, legal frameworks that deal with issues of data protection, information security and morality become very critical. Compliance with regulations and manifestation of responsible and privacy-sensitive practices in UI become key for multimodal UI solutions developers.

    Competitive dynamics represent a trend in the Multimodal UI Market. With several firms providing solutions on multimodal UI competing for market share, differentiation factors like precision, timeliness, flexibility and integration abilities become vital considerations. The market is known for its continued innovations which cater to the needs of different industries.

    Market Summary

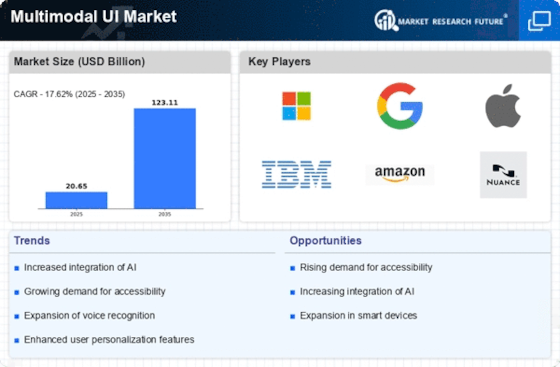
    The Global Multimodal UI Market is projected to experience substantial growth from 20.65 USD Billion in 2024 to 123.11 USD Billion by 2035.

    Key Market Trends & Highlights

    Multimodal UI Key Trends and Highlights

    • The market is expected to grow at a compound annual growth rate of 17.54 percent from 2025 to 2035.
    • By 2035, the market valuation is anticipated to reach 123.1 USD Billion, indicating robust expansion.
    • in 2024, the market is valued at 20.65 USD Billion, reflecting a strong foundation for future growth.
    • Growing adoption of advanced technologies due to increasing demand for user-friendly interfaces is a major market driver.

    Market Size & Forecast

    2024 Market Size 20.65 (USD Billion)
    2035 Market Size 123.11 (USD Billion)
    CAGR (2025-2035) 17.62%
    Largest Regional Market Share in 2024 latin_america)

    Major Players

    Amazon, Google, Apple, Microsoft, Leap Motion, IBM, Jina AI, Appen, OpenAI, Siemens

    Market Trends

    Increasing demand in human centered design

    Human-centered design is a creative approach to issue resolution that begins with a thorough grasp of the end-users' wants and contexts. It encourages the development of products that are in line with human qualities, requirements, and interests. Human-centered design, when applied to multimodal UI, can assure the development of interfaces that are not only functional but also intuitive, accessible, and enjoyable to use. Designers can approach multimodal UI creation using human-centered design by addressing the various ways people engage with technology. For example, one person may prefer voice commands for hands-free control, but another may prefer touch interactions for precision.

    Designers can create more diverse and inclusive interfaces by considering these distinct preferences and limits. User research, persona development, and usability testing, all key aspects of the human-centered design process, can be utilized to better understand user demands, validate design decisions, and iteratively optimize the multimodal UI.

    The integration of voice, touch, and gesture interfaces in user experience design is reshaping the landscape of technology, fostering a more intuitive interaction between humans and machines.

    U.S. Department of Commerce

    Multimodal UI Market Market Drivers

    Market Growth Projections

    The Global Multimodal UI Market Industry is poised for substantial growth, with projections indicating a market size of 20.8 USD Billion in 2024 and a remarkable increase to 123.1 USD Billion by 2035. This growth trajectory suggests a compound annual growth rate (CAGR) of 17.54% from 2025 to 2035. Such figures underscore the increasing importance of multimodal interfaces across various sectors, driven by technological advancements and evolving consumer expectations. The market's expansion reflects a broader trend towards more integrated and user-friendly technology solutions.

    Increased Adoption of Smart Devices

    The proliferation of smart devices is significantly influencing the Global Multimodal UI Market Industry. With the rise of smartphones, tablets, and smart home devices, users are increasingly interacting with technology through various modalities. This trend necessitates the development of interfaces that can seamlessly integrate voice, touch, and visual inputs. For instance, smart speakers equipped with multimodal capabilities allow users to interact through voice commands while receiving visual feedback on connected screens. As the number of connected devices continues to grow, the demand for sophisticated multimodal interfaces is expected to rise, further propelling market growth.

    Advancements in AI and Machine Learning

    Advancements in artificial intelligence and machine learning are pivotal drivers of the Global Multimodal UI Market Industry. These technologies enable systems to understand and process multiple forms of input, enhancing the functionality of multimodal interfaces. For example, AI-driven voice recognition systems can now accurately interpret diverse accents and dialects, making technology more accessible. As organizations leverage these advancements to create more responsive and adaptive user interfaces, the market is expected to grow substantially. The anticipated growth trajectory suggests a market size reaching 123.1 USD Billion by 2035, reflecting the transformative impact of AI on user interaction.

    Rising Demand for Seamless User Experiences

    The Global Multimodal UI Market Industry is witnessing a surge in demand for seamless user experiences across various platforms. As consumers increasingly expect intuitive interactions, companies are investing in multimodal interfaces that integrate voice, touch, and gesture controls. This trend is particularly evident in sectors such as e-commerce and healthcare, where user engagement is paramount. For instance, the integration of voice commands in mobile applications has shown to enhance user satisfaction significantly. This growing expectation for cohesive experiences is projected to drive the market's expansion, contributing to its valuation of 20.8 USD Billion in 2024.

    Growing Focus on Accessibility and Inclusivity

    A growing focus on accessibility and inclusivity is shaping the Global Multimodal UI Market Industry. Organizations are recognizing the importance of designing interfaces that cater to diverse user needs, including those with disabilities. Multimodal UIs provide alternative interaction methods, such as voice commands for individuals with mobility challenges. This emphasis on inclusive design not only enhances user experience but also expands market reach. As regulatory frameworks increasingly mandate accessibility standards, companies are compelled to adopt multimodal solutions, thereby driving market growth. This trend is likely to contribute to the projected CAGR of 17.54% from 2025 to 2035.

    Integration of Multimodal Interfaces in Automotive Sector

    The automotive sector is increasingly integrating multimodal interfaces, significantly impacting the Global Multimodal UI Market Industry. Modern vehicles are equipped with advanced infotainment systems that utilize voice, touch, and gesture controls to enhance driver and passenger experiences. For example, voice-activated navigation systems allow drivers to maintain focus on the road while accessing information. As the automotive industry continues to innovate, the demand for multimodal interfaces is expected to rise, reflecting a broader trend towards smart mobility solutions. This integration not only improves safety but also enhances user satisfaction, further driving market growth.

    Market Segment Insights

    Global Multimodal UI Technology Insights

    The global Multimodal UI market, in this report, has been segmented on the basis of Technology into voice recognition, text input, gesture recognition, visual, and others.

    Voice recognition holds the largest share of the total share. Voice-activated gadgets provide customers with greater convenience and a more natural way to interact with technology. Speaking to a gadget feels natural and involves little effort, making it appealing to a wide spectrum of users, even people who are not tech-savvy. For people with disabilities, voice recognition is a game changer. Voice-activated gadgets are more inclusive and empowering for those with mobility challenges, vision impairments, or disorders that affect dexterity. It gives individuals the ability to control and engage with technology on their own.

    Natural language processing and machine learning advancements have greatly increased the accuracy and reliability of speech recognition systems. These technologies are capable of better understanding and interpreting a wide range of accents, dialects, and languages, making voice interaction more reliable. Voice-activated gadgets have permeated many facets of daily living, from controlling smart home devices to doing web searches and organizing appointments. Voice technology's adaptability helps to its widespread use.

    The global Multimodal UI market, in this report, has been segmented based on End User into automotive, healthcare, entertainment, IT & telecommunication, retail, and others.

    The automotive segment holds the largest share of the total market share while. The increasing demand for advanced driver assistance systems (ADAS) and entertainment systems in automobiles is driving the expansion of this segment. In ADAS systems, multimodal UI solutions are employed to allow drivers to interface with the car via speech, gesture, and touch. These solutions also contribute to increased driving safety and convenience. Multimodal UI solutions are used in infotainment systems to allow passengers to engage with the system via speech, gesture, and touch. These ideas contribute to increased passenger pleasure and convenience.

    Get more detailed insights about Multimodal UI Market Research Report—Global Forecast till 2034

    Regional Insights

    Based on Region, the global Multimodal UI is segmented into North America, Europe, Asia-Pacific, Middle East & Africa, and South America. Further, the major countries studied in the market report are the U.S., Canada, Germany, UK, Italy, Spain, China, Japan, India, Australia, UAE, and Brazil.

    The North America Multimodal UI market is a growing region. North America has a strong technology infrastructure, including high-speed internet access and extensive smartphone use. This makes it easier to integrate multimodal user interface solutions, which frequently rely on data transfer and processing, as well as mobile device compatibility. Additionally, customers have demonstrated a significant preference for ease and user-friendly interfaces. Multimodal user interfaces, with their natural and intuitive interaction modes such as voice recognition and touch, are well suited to these preferences.

    Smart speakers, cellphones, and in-car infotainment systems have all acquired great acceptability among North American customers because to multimodal UI. The regulatory environment in the region has been generally favorable of technology innovation, particularly multimodal UI. To assure the safety and accessibility of these technologies, standards and regulations have been created, providing businesses and consumers confidence in their use. The versatility of multimodal UI extends across multiple industries, from healthcare and automobile to entertainment and smart home gadgets. North American corporations have applied these technology across industries, expanding their market reach.

    The Asia Pacific Multimodal UI market is having highest growth rate for global Multimodal UI industry, focused on Wearable technologies such as smartwatches and fitness trackers are becoming increasingly popular throughout Asia Pacific. These gadgets frequently employ multimodal user interfaces that allow users to interact with them via voice, gesture, and touch. Smart home products are also growing more popular in the region, and many of these gadgets feature multimodal user interfaces. In Asia Pacific, the gaming and virtual reality sectors are also expanding rapidly.

    These industries are pushing the demand for multimodal user interfaces capable of providing immersive and engaging experiences. Asia Pacific governments are rapidly enacting legislation requiring firms to employ multimodal UIs to improve the safety and security of their products and services. For example, the Indian government has ordered that all new cars sold in the country include ADAS systems with multimodal user interfaces.

    FIGURE 3: GLOBAL MULTIMODAL UI MARKET SIZE BY REGION 2022 VS 2032, (USD BILLION)

    MULTIMODAL UI MARKET SIZE BY REGION 2022 VS 2032

    Source: Secondary Research, Primary Research, MRFR Database, and Analyst Review

    Key Players and Competitive Insights

    The Multimodal UI market is a highly competitive industry, as numerous companies offer highly sophisticated service and offering across the globe. The market is characterized by the presence of established and large Multimodal UI companies, as well as many smaller and emerging players. These companies are focused on developing innovative technologies and processes to improve efficiency, reduce costs, and enhance the quality of multimodal user interface. They also prioritize meeting the increasingly stringent environmental and safety regulations that govern the user interface industry.

    The competition in the Multimodal UI market is driven by various factors, including pricing, quality, delivery time, and the ability to offer customized solutions to customers. Moreover, partnerships and collaborations with other players in the industry, such as OEMs and suppliers, are crucial for companies to remain competitive in the market. Mergers and acquisitions are also common in the Multimodal UI market, as companies seek to expand their reach and capabilities. Additionally, companies are investing heavily in research and development to develop new offerings and technologies that can improve the performance, durability, and safety of stamped metal parts and components.

    Key Companies in the Multimodal UI Market market include

    Industry Developments

    March 2023 Microsoft introduced Kosmos-1 which is a multimodal large language model that can perceive general modalities, follow instructions, and perform in-context learning. The objective is to enable LLMs to see and speak by coordinating perception with those models. To be more precise, they train the KOSMOS-1 model using METALM.

    Future Outlook

    Multimodal UI Market Future Outlook

    The Global Multimodal UI Market is projected to grow at a 17.62% CAGR from 2025 to 2035, driven by advancements in AI, increased demand for user-centric design, and the proliferation of smart devices.

    New opportunities lie in:

    • Develop AI-driven interfaces to enhance user engagement and personalization.
    • Invest in cross-platform solutions to streamline user experiences across devices.
    • Leverage data analytics to optimize UI design based on user behavior patterns.

    By 2035, the Multimodal UI Market is expected to be robust, reflecting substantial growth and innovation.

    Market Segmentation

    Global Multimodal UI Market- Regional Outlook

    • US
    • Canada
    • Mexico

    Global Multimodal UI Market- Component Outlook

    • Hardware
    • Software
    • Services

    Global Multimodal UI Market- Technology Outlook

    • Voice Recognition
    • Text Input
    • Gesture Recognition
    • Visual
    • Others

    Global Multimodal UI Market- End Use Vertical Outlook

    • Automotive
    • Healthcare
    • Entertainment
    • IT & Telecommunication
    • Retail
    • others

    Report Scope

    Report Attribute/Metric Details
    Market Size 2024 20.65 (USD Billion)
    Market Size 2025 24.29 (USD Billion)
    Market Size 2035 123.11 (USD Billion)
    Compound Annual Growth Rate (CAGR) 17.62% (2025 - 2035)
    Report Coverage Revenue Forecast, Competitive Landscape, Growth Factors, and Trends
    Base Year 2024
    Market Forecast Period 2025 - 2035
    Historical Data 2019 - 2023
    Market Forecast Units USD Billion
    Segments Covered Component, Technology, End User Vertical
    Geographies Covered Europe, North America, Asia-Pacific, Middle East & Africa, and South America
    Countries Covered US, Canada, Mexico, Germany, France, UK, Italy, Spain, China, Japan, India, South Korea, Australia, Saudi Arabia, UAE, South Africa, Brazil, Argentina, Chile, and others.
    Key Companies Profiled Amazon, Google, Apple, Microsoft, Leap Motion, IBM, Jina AI, Appen, OpenAI and Siemens
    Key Market Opportunities ·       Recent development in IoT and NLP
    Key Market Dynamics ·       High penetration rate of smart devices ·       Growing popularity of virtual assistance

    Market Highlights

    Author

    Aarti Dhapte
    Team Lead - Research

    She holds an experience of about 6+ years in market research and business consulting, working under the spectrum of information communication technology, telecommunications and semiconductor domains. aarti conceptualizes and implements a scalable business strategy and provides strategic leadership to the clients. her expertise lies in market estimation, competitive intelligence, pipeline analysis, customer assessment, etc.

    Leave a Comment

    Latest Comments

    John Doe
    john@example.com

    This is a great article! Really helped me understand the topic better.

    Posted on July 23, 2025, 10:15 AM
    Jane Smith
    jane@domain.com

    Thanks for sharing this. I’ve bookmarked it for later reference.

    Posted on July 22, 2025, 7:45 PM

    FAQs

    How much is the Multimodal UI market?

    The global Multimodal UI market was valued at USD 20.65 Billion in 2024.

    What is the growth rate of the Multimodal UI market?

    The global market is projected to grow at a CAGR of 17.62% during the forecast period, 2025-2034.

    Which region held the largest market share in the Multimodal UI market?

    North America had the largest share of the global market.

    Who are the key players in the Multimodal UI market?

    The key players in the market are Amazon, Google, Apple, Microsoft, Leap Motion, IBM, Jina AI, Appen, OpenAI and Siemens.

    1. EXECUTIVE SUMMARY
      1. 1.1.
      2. Market Attractiveness Analysis
      3. By Technology
      4. 1.1.3.
    2. Global Multimodal UI Market, By Component
    3. Global Multimodal UI Market,
    4. Global Multimodal UI Market, By End Use Vertical
    5. Global Multimodal UI Market, by Region
    6. MARKET INTRODUCTION
      1. Definition
      2. Scope of the Study
      3. Market Structure
      4. Key Buying Criteria
      5. Macro Factor Indicator
      6. Analysis
      7. 3.
    7. RESEARCH METHODOLOGY
      1. 3.1.
      2. Research Process
      3. 3.2.
      4. Primary Research
      5. 3.3.
      6. Secondary Research
      7. 3.4.
      8. Market Size Estimation
      9. 3.5.
      10. Forecast Model
      11. 3.6.
      12. List of Assumptions
      13. 4.
    8. MARKET DYNAMICS
      1. 4.1.
      2. Introduction
      3. 4.2.
      4. Drivers
      5. 4.2.1.
      6. High penetration rate of smart devices
      7. analysis
      8. 4.3.
      9. Restraints
      10. 4.3.1.
      11. Technical complexity with respect to interference
      12. development in IoT and NLP
    9. Growing popularity of virtual assistance
    10. Driver impact
    11. Variation in user experience
    12. Restraint impact analysis
      1. Opportunities
        1. Recent
      2. Covid-19 Impact Analysis
        1. Covid 1
        2. Covid 2
        3. Covid 3
    13. COVID-19 IMPACT ON SUPPLY CHAIN DELAYSMARKET FACTOR
      1. ANALYSIS
      2. 5.1.
      3. Value Chain Analysis/Supply Chain Analysis
      4. Porter’s Five Forces Model
        1. Bargaining Power of Suppliers
        2. Bargaining Power
      5. of Buyers
      6. 5.2.3.
      7. Threat of New Entrants
      8. 5.2.4.
      9. Threat of Substitutes
      10. 5.2.5.
      11. Intensity of Rivalry
      12. 6.
    14. GLOBAL MULTIMODAL UI MARKET, BY COMPONENT
      1. Introduction
      2. Hardware
        1. Microphone
        2. Sensor
        3. Camera
        4. Others
      3. Software
      4. Service
    15. GLOBAL MULTIMODAL UI MARKET, BY TECHNOLOGY
      1. Introduction
      2. Voice Recognition
      3. Text Input
      4. Gesture Recognition
      5. Visual
      6. Others
    16. GLOBAL MULTIMODAL
    17. UI MARKET, BY END USE VERTICAL
      1. Introduction
      2. Automotive
      3. Healthcare
      4. Entertainment
      5. IT & Telecommunication
      6. Consumer Electronics
      7. Education
      8. Retail
      9. Others
    18. GLOBAL MULTIMODAL UI MARKET SIZE ESTIMATION &
      1. FORECAST, BY REGION
      2. 9.1.
      3. Introduction
      4. 9.2.
      5. North America
      6. 9.2.1.
    19. Market Estimates & Forecast, by Country, 2019-2032
      1. 9.2.3.
    20. Market Estimates & Forecast, By Component,
    21. Market Estimates & Forecast, By Technology, 2019-2032
      1. Vertical, 2019-2032
      2. 9.2.5.
      3. US
      4. 9.2.5.1.
    22. Market Estimates & Forecast, By End Use
    23. Market Estimates & Forecast, By Component, 2019-2032
      1. 9.2.5.3.
    24. Market Estimates & Forecast, By Technology,
    25. Market Estimates & Forecast, By End Use Vertical, 2019-2032
      1. Forecast, By Component, 2019-2032
      2. & Forecast, By End Use Vertical, 2019-2032
      3. 9.2.7.2.
    26. Canada
    27. Market Estimates &
    28. Market Estimates & Forecast, By Technology, 2019-2032
    29. Market Estimates
    30. Mexico
    31. Market Estimates & Forecast, By Component,
    32. Market Estimates & Forecast, By Technology, 2019-2032
      1. Use Vertical, 2019-2032
      2. & Forecast, By Component, 2019-2032
      3. & Forecast, By End Use Vertical, 2019-2032
      4. 9.3.5.2.
    33. Market Estimates & Forecast, By End
      1. Europe
        1. Market Estimates & Forecast, by Country, 2019-2032
        2. Market Estimates
        3. Market Estimates & Forecast, By Technology, 2019-2032
        4. Market Estimates
        5. UK
    34. Market Estimates & Forecast, By Technology, 2019-2032
      1. Use Vertical, 2019-2032
      2. & Forecast, By Technology, 2019-2032
      3. 9.3.7.
      4. France
      5. 9.3.7.1.
    35. Market Estimates & Forecast, By End
    36. Germany
    37. Market Estimates & Forecast, By Component, 2019-2032
    38. Market Estimates
    39. Market Estimates & Forecast, By End Use Vertical,
    40. Market Estimates & Forecast, By Component, 2019-2032
      1. 9.3.7.3.
    41. Market Estimates & Forecast, By Technology,
    42. Market Estimates & Forecast, By End Use Vertical, 2019-2032
      1. Forecast, By Component, 2019-2032
      2. & Forecast, By End Use Vertical, 2019-2032
      3. 9.3.9.2.
    43. Italy
    44. Market Estimates &
    45. Market Estimates & Forecast, By Technology, 2019-2032
    46. Market Estimates
    47. Spain
    48. Market Estimates & Forecast, By Component,
    49. Market Estimates & Forecast, By Technology, 2019-2032
      1. Use Vertical, 2019-2032
      2. 9.3.10.2.
    50. Market Estimates & Forecast, By End
    51. Rest of Europe
    52. Market Estimates & Forecast, By Component,
    53. Market Estimates & Forecast, By Technology, 2019-2032
      1. Use Vertical, 2019-2032
      2. & Forecast, By Component, 2019-2032
      3. & Forecast, By End Use Vertical, 2019-2032
      4. 9.4.5.2.
    54. Market Estimates & Forecast, By End
      1. Asia-Pacific
        1. Market Estimates & Forecast, by Country, 2019-2032
        2. Market Estimates
        3. Market Estimates & Forecast, By Technology, 2019-2032
        4. Market Estimates
        5. China
    55. Market Estimates & Forecast, By Technology, 2019-2032
      1. Use Vertical, 2019-2032
      2. & Forecast, By Technology, 2019-2032
      3. 9.4.7.
      4. India
      5. 9.4.7.1.
    56. Market Estimates & Forecast, By End
    57. Japan
    58. Market Estimates & Forecast, By Component, 2019-2032
    59. Market Estimates
    60. Market Estimates & Forecast, By End Use Vertical,
    61. Market Estimates & Forecast, By Component, 2019-2032
      1. 9.4.7.3.
    62. Market Estimates & Forecast, By Technology,
    63. Market Estimates & Forecast, By End Use Vertical, 2019-2032
      1. Forecast, By Component, 2019-2032
      2. & Forecast, By End Use Vertical, 2019-2032
      3. 9.4.9.2.
    64. Australia
    65. Market Estimates &
    66. Market Estimates & Forecast, By Technology, 2019-2032
    67. Market Estimates
    68. Rest of Asia-Pacific
    69. Market Estimates & Forecast, By Component,
    70. Market Estimates & Forecast, By Technology, 2019-2032
      1. Use Vertical, 2019-2032
      2. & Forecast, By Technology, 2019-2032
      3. 9.5.4.
      4. Middle East
      5. 9.5.4.1.
    71. Market Estimates & Forecast, By End
      1. Rest of the World
        1. Market Estimates & Forecast, By Component, 2019-2032
        2. Market Estimates
        3. Market Estimates & Forecast, By End Use Vertical,
    72. Market Estimates & Forecast, By Component, 2019-2032
      1. 9.5.4.3.
    73. Market Estimates & Forecast, By Technology,
    74. Market Estimates & Forecast, By End Use Vertical, 2019-2032
      1. Forecast, By Component, 2019-2032
      2. & Forecast, By End Use Vertical, 2019-2032
      3. 9.5.6.2.
    75. Africa
    76. Market Estimates &
    77. Market Estimates & Forecast, By Technology, 2019-2032
    78. Market Estimates
    79. Latin America
    80. Market Estimates & Forecast, By Component,
    81. Market Estimates & Forecast, By Technology, 2019-2032
      1. Use Vertical, 2019-2032
    82. Market Estimates & Forecast, By End
    83. COMPETITIVE LANDSCAPE
      1. Introduction
      2. Key Developments & Growth Strategies
      3. Competitor Benchmarking
      4. Vendor Share Analysis,
      5. 11.
      6. COMPANY PROFILES
      7. 11.1.
      8. Amazon
      9. 11.2.
      10. Google
      11. 11.3.
      12. Apple
      13. 11.4.
      14. Microsoft
      15. 11.5.
      16. Leap Motion
      17. 11.6.
      18. IBM
      19. Jina
      20. AI
      21. Appen
      22. OpenAI
      23. Siemens
      24. Company 11
      25. Company 12
      26. Company 13
      27. Company 14
      28. Company 15
        1. Company Overview
        2. Financial Overview
        3. Solution/Services
      29. Offered
      30. 11.15.4.
      31. Key Developments
      32. 11.15.5.
      33. SWOT Analysis
      34. 11.15.6.
      35. Key Strategies
      36. LIST
    84. OF TABLES
      1. TABLE
    85. GLOBAL MULTIMODAL UI MARKET, BY COMPONENT, 2018–2032 (USD MILLION)
    86. GLOBAL MULTIMODAL
    87. UI MARKET, BY TECHNOLOGY, 2018–2032 (USD MILLION)
    88. GLOBAL MULTIMODAL UI MARKET, BY END USE VERTICAL,
    89. GLOBAL MULTIMODAL UI MARKET, BY REGION, 2018–2032 (USD
      1. MILLION)
      2. TABLE
    90. NORTH AMERICA MULTIMODAL UI MARKET, BY COUNTRY, 2018–2032 (USD MILLION)
    91. NORTH
    92. AMERICA MULTIMODAL UI MARKET, BY COMPONENT, 2018–2032 (USD MILLION)
    93. NORTH AMERICA
    94. MULTIMODAL UI MARKET, BY TECHNOLOGY, 2018–2032 (USD MILLION)
    95. NORTH AMERICA MULTIMODAL
    96. UI MARKET, BY END USE VERTICAL, 2018–2032 (USD MILLION)
    97. US MULTIMODAL UI MARKET,
      1. BY COMPONENT, 2018–2032 (USD MILLION)
    98. US MULTIMODAL UI MARKET, BY TECHNOLOGY,
    99. US MULTIMODAL UI MARKET, BY END USE VERTICAL, 2018–2032
      1. (USD MILLION)
      2. TABLE
    100. CANADA MULTIMODAL UI MARKET, BY COMPONENT, 2018–2032 (USD MILLION)
    101. CANADA MULTIMODAL
    102. UI MARKET, BY TECHNOLOGY, 2018–2032 (USD MILLION)
    103. CANADA MULTIMODAL UI MARKET, BY END USE
      1. VERTICAL, 2018–2032 (USD MILLION)
    104. MEXICO MULTIMODAL UI MARKET, BY COMPONENT, 2018–2032
      1. (USD MILLION)
      2. TABLE
    105. MEXICO MULTIMODAL UI MARKET, BY TECHNOLOGY, 2018–2032 (USD MILLION)
    106. MEXICO MULTIMODAL
    107. UI MARKET, BY END USE VERTICAL, 2018–2032 (USD MILLION)
    108. EUROPE MULTIMODAL UI
    109. MARKET, BY COUNTRY, 2018–2032 (USD MILLION)
    110. EUROPE MULTIMODAL UI MARKET, BY COMPONENT,
    111. EUROPE MULTIMODAL UI MARKET, BY TECHNOLOGY, 2018–2032
      1. (USD MILLION)
      2. TABLE
    112. EUROPE MULTIMODAL UI MARKET, BY END USE VERTICAL, 2018–2032 (USD MILLION)
    113. GERMANY
    114. MULTIMODAL UI MARKET, BY COMPONENT, 2018–2032 (USD MILLION)
    115. GERMANY MULTIMODAL UI
    116. MARKET, BY TECHNOLOGY, 2018–2032 (USD MILLION)
    117. GERMANY MULTIMODAL UI MARKET, BY END USE
      1. VERTICAL, 2018–2032 (USD MILLION)
    118. UK MULTIMODAL UI MARKET, BY COMPONENT, 2018–2032
      1. (USD MILLION)
      2. TABLE
    119. UK MULTIMODAL UI MARKET, BY TECHNOLOGY, 2018–2032 (USD MILLION)
    120. UK MULTIMODAL
    121. UI MARKET, BY END USE VERTICAL, 2018–2032 (USD MILLION)
    122. FRANCE MULTIMODAL UI
    123. MARKET, BY COMPONENT, 2018–2032 (USD MILLION)
    124. FRANCE MULTIMODAL UI MARKET, BY TECHNOLOGY,
    125. FRANCE MULTIMODAL UI MARKET, BY END USE VERTICAL, 2018–2032
      1. (USD MILLION)
      2. TABLE
    126. ITALY MULTIMODAL UI MARKET, BY COMPONENT, 2018–2032 (USD MILLION)
    127. ITALY MULTIMODAL
    128. UI MARKET, BY TECHNOLOGY, 2018–2032 (USD MILLION)
    129. ITALY MULTIMODAL UI MARKET, BY END USE VERTICAL,
    130. SPAIN MULTIMODAL UI MARKET, BY COMPONENT, 2018–2032
      1. (USD MILLION)
      2. TABLE
    131. SPAIN MULTIMODAL UI MARKET, BY TECHNOLOGY, 2018–2032 (USD MILLION)
    132. SPAIN MULTIMODAL
    133. UI MARKET, BY END USE VERTICAL, 2018–2032 (USD MILLION)
    134. REST OF EUROPE MULTIMODAL
    135. UI MARKET, BY COMPONENT, 2018–2032 (USD MILLION)
    136. REST OF EUROPE MULTIMODAL UI MARKET, BY
      1. TECHNOLOGY, 2018–2032 (USD MILLION)
    137. REST OF EUROPE MULTIMODAL UI MARKET, BY
      1. END USE VERTICAL, 2018–2032 (USD MILLION)
    138. ASIA PACIFIC MULTIMODAL UI MARKET, BY COUNTRY,
    139. ASIA PACIFIC MULTIMODAL UI MARKET, BY COMPONENT, 2018–2032
      1. (USD MILLION)
      2. TABLE
    140. ASIA PACIFIC MULTIMODAL UI MARKET, BY TECHNOLOGY, 2018–2032 (USD MILLION)
    141. ASIA
    142. PACIFIC MULTIMODAL UI MARKET, BY END USE VERTICAL, 2018–2032 (USD MILLION)
    143. CHINA
    144. MULTIMODAL UI MARKET, BY COMPONENT, 2018–2032 (USD MILLION)
    145. CHINA MULTIMODAL UI
    146. MARKET, BY TECHNOLOGY, 2018–2032 (USD MILLION)
    147. CHINA MULTIMODAL UI MARKET, BY END USE VERTICAL,
    148. INDIA MULTIMODAL UI MARKET, BY COMPONENT, 2018–2032
      1. (USD MILLION)
      2. TABLE
    149. INDIA MULTIMODAL UI MARKET, BY TECHNOLOGY, 2018–2032 (USD MILLION)
    150. INDIA MULTIMODAL
    151. UI MARKET, BY END USE VERTICAL, 2018–2032 (USD MILLION)
    152. JAPAN MULTIMODAL UI
    153. MARKET, BY COMPONENT, 2018–2032 (USD MILLION)
    154. JAPAN MULTIMODAL UI MARKET, BY TECHNOLOGY,
    155. JAPAN MULTIMODAL UI MARKET, BY END USE VERTICAL, 2018–2032
      1. (USD MILLION)
      2. TABLE
    156. AUSTRALIA MULTIMODAL UI MARKET, BY COMPONENT, 2018–2032 (USD MILLION)
    157. AUSTRALIA MULTIMODAL
    158. UI MARKET, BY TECHNOLOGY, 2018–2032 (USD MILLION)
    159. AUSTRALIA MULTIMODAL UI MARKET, BY END USE
      1. VERTICAL, 2018–2032 (USD MILLION)
    160. REST FO ASIA PACIFIC MULTIMODAL UI MARKET, BY COMPONENT,
    161. REST FO ASIA PACIFIC MULTIMODAL UI MARKET, BY TECHNOLOGY,
    162. REST FO ASIA PACIFIC MULTIMODAL UI MARKET, BY END USE VERTICAL,
    163. REST FO THE WORLD MULTIMODAL UI MARKET, BY COMPONENT, 2018–2032
      1. (USD MILLION)
      2. TABLE
    164. REST FO THE WORLD MULTIMODAL UI MARKET, BY TECHNOLOGY, 2018–2032 (USD MILLION)
    165. REST
    166. FO THE WORLD MULTIMODAL UI MARKET, BY END USE VERTICAL, 2018–2032 (USD MILLION)
    167. MIDDLE
    168. EAST MULTIMODAL UI MARKET, BY COMPONENT, 2018–2032 (USD MILLION)
    169. MIDDLE EAST
    170. MULTIMODAL UI MARKET, BY TECHNOLOGY, 2018–2032 (USD MILLION)
    171. MIDDLE EAST MULTIMODAL
    172. UI MARKET, BY END USE VERTICAL, 2018–2032 (USD MILLION)
    173. AFRICA MULTIMODAL UI
    174. MARKET, BY COMPONENT, 2018–2032 (USD MILLION)
    175. AFRICA MULTIMODAL UI MARKET, BY TECHNOLOGY,
    176. AFRICA MULTIMODAL UI MARKET, BY END USE VERTICAL, 2018–2032
      1. (USD MILLION)
      2. TABLE
    177. SOUTH AMERICA MULTIMODAL UI MARKET, BY COMPONENT, 2018–2032 (USD MILLION)
    178. SOUTH
    179. AMERICA MULTIMODAL UI MARKET, BY TECHNOLOGY, 2018–2032 (USD MILLION)
    180. SOUTH AMERICA
    181. MULTIMODAL UI MARKET, BY END USE VERTICAL, 2018–2032 (USD MILLION)
    182. PARTNERSHIPS/AGREEMENTS/CONTRACTS/COLLABORATIONS
    183. BUSINESS
      1. EXPANSIONS/ACQUISITIONS
    184. PRODUCT LAUNCHES/DEVELOPMENTS
    185. AMAZON: PRODUCTS OFFERED
    186. AMAZON: KEY DEVELOPMENT
    187. GOOGLE: PRODUCTS
      1. OFFERED
      2. TABLE
    188. GOOGLE: KEY DEVELOPMENT
    189. APPLE: PRODUCTS OFFERED
    190. APPLE: KEY DEVELOPMENT
    191. MICROSOFT: PRODUCTS
      1. OFFERED
      2. TABLE
    192. MICROSOFT: KEY DEVELOPMENT
    193. LEAP MOTION: PRODUCTS OFFERED
    194. LEAP MOTION: KEY DEVELOPMENT
    195. IBM: PRODUCTS OFFERED
    196. IBM:
      1. KEY DEVELOPMENT
      2. TABLE
    197. JINA AI: PRODUCTS OFFERED
    198. JINA AI: KEY DEVELOPMENT
    199. APPEN: PRODUCTS OFFERED
    200. APPEN: KEY DEVELOPMENT
    201. OPENAI: PRODUCTS
      1. OFFERED
      2. TABLE
    202. OPENAI: KEY DEVELOPMENT
    203. SIEMENS: PRODUCTS OFFERED
    204. SIEMENS: KEY DEVELOPMENT
    205. COMPANY 11: PRODUCTS
      1. OFFERED
      2. TABLE
    206. COMPANY 11: KEY DEVELOPMENT
    207. COMPANY 12: PRODUCTS OFFERED
    208. COMPANY 12: KEY DEVELOPMENT
    209. COMPANY 13: PRODUCTS
      1. OFFERED
      2. TABLE
    210. COMPANY 13: KEY DEVELOPMENT
    211. COMPANY 14: PRODUCTS OFFERED
    212. COMPANY 14: KEY DEVELOPMENT
    213. COMPANY 15: PRODUCTS
      1. OFFERED
      2. TABLE
    214. COMPANY 15: KEY DEVELOPMENT
      1. LIST
    215. OF FIGURES
      1. FIGURE
    216. MARKET SYNOPSIS
      1. FIGURE
    217. MARKET STRUCTURE: GLOBAL MULTIMODAL UI MARKET
    218. BOTTOM-UP AND TOP-DOWN APPROACHES
    219. MARKET DYNAMIC
    220. ANALYSIS OF THE GLOBAL MULTIMODAL UI MARKET
    221. DRIVER IMPACT ANALYSIS
    222. RESTRAINTS IMPACT ANALYSIS
    223. GLOBAL
      1. MULTIMODAL UI MARKET: VALUE CHAIN
    224. GLOBAL MULTIMODAL UI MARKET, BY COMPONENT, 2022 (% SHARE)
    225. GLOBAL
    226. MULTIMODAL UI MARKET, BY COMPONENT, 2022 VS 2032 (USD MILLION)
    227. GLOBAL MULTIMODAL UI
    228. MARKET, BY TECHNOLOGY, 2022 (% SHARE)
    229. GLOBAL MULTIMODAL UI MARKET, BY TECHNOLOGY, 2022
      1. VS 2032 (USD MILLION)
      2. FIGURE
    230. GLOBAL MULTIMODAL UI MARKET, BY END USE VERTICAL, 2022 (% SHARE)
    231. GLOBAL MULTIMODAL UI
    232. MARKET, BY END USE VERTICAL, 2022 VS 2032 (USD MILLION)
    233. GLOBAL MULTIMODAL UI MARKET, BY REGION,
      1. FIGURE
    234. GLOBAL MULTIMODAL UI MARKET, BY REGION, 2022 VS 2032 (USD MILLION)
    235. NORTH AMERICA
    236. MULTIMODAL UI MARKET, BY COUNTRY, 2022 (% SHARE)
    237. NORTH AMERICA MULTIMODAL UI MARKET, BY
      1. COUNTRY, 2022 VS 2032 (USD MILLION)
    238. NORTH AMERICA MULTIMODAL UI MARKET, BY COMPONENT,
    239. NORTH AMERICA MULTIMODAL UI MARKET, BY TECHNOLOGY, 2019-2032
      1. (USD MILLION)
      2. FIGURE
    240. NORTH AMERICA MULTIMODAL UI MARKET, BY END USE VERTICAL, 2019-2032 (USD MILLION)
      1. FIGURE 21
    241. EUROPE MULTIMODAL UI MARKET, BY COUNTRY, 2022 (% SHARE)
    242. EUROPE MULTIMODAL UI MARKET, BY COUNTRY,
    243. EUROPE MULTIMODAL UI MARKET, BY COMPONENT, 2019-2032 (USD
      1. MILLION)
      2. FIGURE
    244. EUROPE MULTIMODAL UI MARKET, BY TECHNOLOGY, 2019-2032 (USD MILLION)
    245. EUROPE MULTIMODAL
    246. UI MARKET, BY END USE VERTICAL, 2019-2032 (USD MILLION)
    247. ASIA PACIFIC MULTIMODAL UI MARKET, BY COUNTRY,
      1. FIGURE
    248. ASIA PACIFIC MULTIMODAL UI MARKET, BY COUNTRY, 2022 VS 2032 (USD MILLION)
    249. ASIA PACIFIC
    250. MULTIMODAL UI MARKET, BY COMPONENT, 2019-2032 (USD MILLION)
    251. ASIA PACIFIC MULTIMODAL UI MARKET, BY TECHNOLOGY,
    252. ASIA PACIFIC MULTIMODAL UI MARKET, BY END USE VERTICAL, 2019-2032
      1. (USD MILLION)
      2. FIGURE
    253. REST OF THE WORLD MULTIMODAL UI MARKET, BY COMPONENT, 2019-2032 (USD MILLION)
      1. FIGURE 32
    254. REST OF THE WORLD MULTIMODAL UI MARKET, BY TECHNOLOGY, 2019-2032 (USD MILLION)
    255. REST OF THE
    256. WORLD MULTIMODAL UI MARKET, BY END USE VERTICAL, 2019-2032 (USD MILLION)
    257. MIDDLE EAST
    258. MULTIMODAL UI MARKET, BY COMPONENT, 2019-2032 (USD MILLION)
    259. MIDDLE EAST MULTIMODAL UI MARKET, BY TECHNOLOGY,
    260. MIDDLE EAST MULTIMODAL UI MARKET, BY END USE VERTICAL, 2019-2032
      1. (USD MILLION)
      2. FIGURE
    261. AFRICA MULTIMODAL UI MARKET, BY COMPONENT, 2019-2032 (USD MILLION)
    262. AFRICA MULTIMODAL
    263. UI MARKET, BY TECHNOLOGY, 2019-2032 (USD MILLION)
    264. AFRICA MULTIMODAL UI MARKET, BY END USE
      1. VERTICAL, 2019-2032 (USD MILLION)
    265. SOUTH AMERICA MULTIMODAL UI MARKET, BY COMPONENT,
    266. SOUTH AMERICA MULTIMODAL UI MARKET, BY TECHNOLOGY, 2019-2032
      1. (USD MILLION)
      2. FIGURE
    267. SOUTH AMERICA MULTIMODAL UI MARKET, BY END USE VERTICAL, 2019-2032 (USD MILLION)
      1. FIGURE 43
      2. GLOBAL MULTIMODAL UI MARKET: COMPETITIVE BENCHMARKING
    268. VENDOR SHARE ANALYSIS, 2022 (%)
    269. AMAZON: FINANCIAL
      1. OVERVIEW SNAPSHOT
      2. FIGURE
    270. AMAZON: SWOT ANALYSIS
    271. GOOGLE: FINANCIAL OVERVIEW SNAPSHOT
    272. GOOGLE: SWOT ANALYSIS
    273. APPLE: FINANCIAL OVERVIEW
      1. SNAPSHOT
      2. FIGURE
    274. APPLE: SWOT ANALYSIS
    275. MICROSOFT: FINANCIAL OVERVIEW SNAPSHOT
    276. MICROSOFT: SWOT ANALYSIS
    277. LEAP MOTION:
      1. FINANCIAL OVERVIEW SNAPSHOT
    278. LEAP MOTION: SWOT ANALYSIS
    279. IBM: FINANCIAL OVERVIEW SNAPSHOT
    280. IBM: SWOT ANALYSIS
    281. JINA AI: FINANCIAL
      1. OVERVIEW SNAPSHOT
      2. FIGURE
    282. JINA AI: SWOT ANALYSIS
    283. APPEN: FINANCIAL OVERVIEW SNAPSHOT
    284. APPEN: SWOT ANALYSIS
    285. OPENAI: FINANCIAL OVERVIEW
      1. SNAPSHOT
      2. FIGURE
    286. OPENAI: SWOT ANALYSIS
    287. SIEMENS: FINANCIAL OVERVIEW SNAPSHOT
    288. COMPANY 11 : FINANCIAL OVERVIEW SNAPSHOT
    289. COMPANY 11:
    290. SWOT ANALYSIS
      1. FIGURE
    291. COMPANY 12: FINANCIAL OVERVIEW SNAPSHOT
    292. COMPANY 12: SWOT ANALYSIS
    293. COMPANY 13: FINANCIAL
      1. OVERVIEW SNAPSHOT
      2. FIGURE
    294. COMPANY 13: SWOT ANALYSIS
    295. COMPANY 14: FINANCIAL OVERVIEW SNAPSHOT
    296. COMPANY 14: SWOT ANALYSIS
    297. COMPANY 15:
      1. FINANCIAL OVERVIEW SNAPSHOT
    298. COMPANY 15: SWOT ANALYSIS
      1. NOTE:
      2. This table of content is tentative and subject to change
      3. as the research progresses.
      4.  In section 15, only the top 15 companies will be profiled. Each company
      5. will be profiled based on the Market Overview, Financials, Service Portfolio, Business
      6. Strategies, and Recent Developments parameters.
      7.  The companies are selected based on two broad criteria¬–
      8. strength of product portfolio and excellence in business strategies.
      9.  Key parameters considered for
      10. evaluating strength of the vendor’s product portfolio are industry experience,
      11. product capabilities/features, innovations/R&D investment, flexibility to customize
      12. the product, ability to integrate with other systems, pre- and post-sale services,
      13. and customer ratings/feedback.
      14.  Key parameters considered for evaluating a vendor’s excellence
      15. in business strategy are its market share, global presence, customer base, partner
      16. ecosystem (technology alliances/resellers/distributors), acquisitions, and marketing
      17. strategies/investments.
      18.  The financial details of the company cannot be provided if the information
      19. is not available in the public domain and or from reliable sources.  

    Multimodal UI Market Segmentation

    Market Segmentation Overview

    • Detailed segmentation data will be available in the full report
    • Comprehensive analysis by multiple parameters
    • Regional and country-level breakdowns
    • Market size forecasts by segment
    Infographic

    Free Sample Request

    Kindly complete the form below to receive a free sample of this Report

    Get Free Sample

    Customer Strories

    “I am very pleased with how market segments have been defined in a relevant way for my purposes (such as "Portable Freezers & refrigerators" and "last-mile"). In general the report is well structured. Thanks very much for your efforts.”

    Victoria Milne

    Founder
    Case Study
    Chemicals and Materials