• Cat-intel
  • MedIntelliX
  • Resources
  • About Us
  • Hero Background
    English
    Chinese
    French
    Japanese
    Korean
    German
    Spanish

    Multi Layer Cryogenic Insulation Market Size

    ID: MRFR/CnM/9308-HCR
    100 Pages
    Anshula Mandaokar
    October 2025

    Multi-Layer Cryogenic Insulation Market Research Report Information By PU & PIR, Cellular Glass, Polystrene, Fiberglass, Perlite, Others) End Use (Energy & Power, Chemicals, Metallurgical, Electronics, Shipping Others) Forecast till 2035

    Share:
    Download PDF ×

    We do not share your information with anyone. However, we may send you emails based on your report interest from time to time. You may contact us at any time to opt-out.

    Multi Layer Cryogenic Insulation Market Infographic
    $ 4,950.0
    $ 5,950.0
    $ 7,250.0

    Multi Layer Cryogenic Insulation Size

    Multi Layer Cryogenic Insulation Market Growth Projections and Opportunities

    The Multi-layer cryogenic insulation market is projected to be worth USD 1,522.78 million by 2028, registering a CAGR of 6.70% during the forecast period (2020–2028). The market was valued at USD 924.43 million in 2020.

    The Multi-Layer Cryogenic Insulation Market is influenced by a variety of factors that together shape its growth and dynamics. A key factor here is the growth in demand for advanced insulation solutions in industries such as energy, aerospace and health care where there are high usage of cryogenic applications. Multilayer cryogenic insulations systems made up of foam materials, reflective foils and vacuum layers are significant because they have highest degree of thermal performance which maintains very low temperatures.

    In spacecraft design, satellites and space probes where cryogenic propellants and components are necessary for their preservation, these insulation systems find application. This has increased interest in research on space development; satellite launching as well as other space activities hence leading to multiplicity of uses for multi-layered insulators.

    Moreover the multi-layer cryogenic insulation market is heavily driven by the energy sector especially with regards to storing and moving around liquified natural gas (LNG) among other chemicals. Heat ingress prevention is one of the critical roles played by insulation so as to maintain low temperatures necessary for storing and transporting cryogenic liquids. As LNG industry grows in response to increasing clean energy sources demand so does need for efficient and dependable cryogenics insulations systems.

    Another major player shaping multi-layer cryogenic insulation market is healthcare industry. In medical applications, an adequate level of protection must guarantee safe transportation or maximum temperature control which includes biological samples and vaccines that can easily be affected by extreme conditions used during their storage process known as “cryopreservation”. For biological materials safety maintenance purposes modernized freezing devices like ultra-low temperature freezers or even just cryogenic containers heavily rely on cutting-edge insulation technologies. Development in medical research, pharmaceuticals and biotechnology entities are some of the reasons why these areas are contributing to a very high demand of highly efficient cryogenics insulations.

    However, cost factors, material selection issues and safety laws might hinder the multi-layer cryogenic insulation industry. Cryogenic insulation requires specialized materials and designs which make it more expensive compared to conventional insulation systems. In consideration of total lifecycle costs against performance advantages associated with advanced cooling materials the manufacturers or end-users make informed choices about investing into sophisticated cryogenic insulations. Furthermore, when choosing multilayered cryogenics for example it is important to ensure that they are compatible with the fluids used at extreme cold temperatures in addition to meeting strict safety regulations.
    Multi Layer Cryogenic Insulation Market Size Graph

    Market Summary

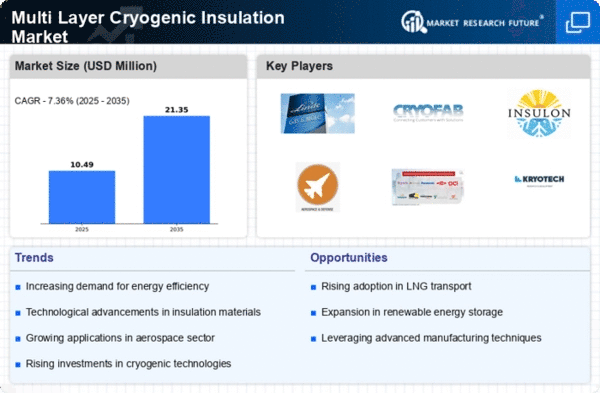
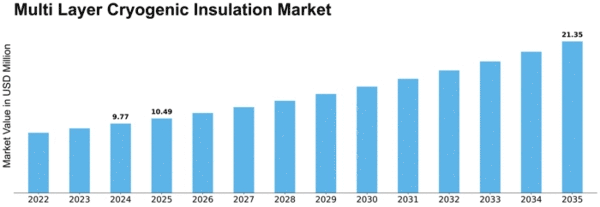
    The Global Multi-layer cryogenic insulation market is projected to grow from 1.01 USD Billion in 2024 to 2.11 USD Billion by 2035.

    Key Market Trends & Highlights

    Multi-layer cryogenic insulation market Key Trends and Highlights

    • The market is expected to witness a compound annual growth rate (CAGR) of 6.91% from 2025 to 2035.
    • By 2035, the market valuation is anticipated to reach 2.11 USD Billion, indicating robust growth.
    • In 2024, the market is valued at 1.01 USD Billion, reflecting a strong starting point for future expansion.
    • Growing adoption of multi-layer cryogenic insulation due to increasing demand for energy-efficient solutions is a major market driver.

    Market Size & Forecast

    2024 Market Size 1.01 (USD Million)
    2035 Market Size 2.11 (USD Million)
    CAGR (2025-2035) 6.91%
    Largest Regional Market Share in 2024 latin_america)

    Major Players

    Armacell International Holding GmbH, Lydall Inc., Cabot Corporation, Technifab Products, Dunmore Corporation, NICHIAS Corporation, Aspen Aerogels, Owens Corning, Isolatie Combinatie Beverwijk B.V., Abhijit Enterprises

    Market Trends

    The increasing demand for energy-efficient solutions in various industries appears to drive the adoption of multi-layer cryogenic insulation technologies, which may enhance thermal performance and reduce energy consumption.

    U.S. Department of Energy

    Multi Layer Cryogenic Insulation Market Market Drivers

    Growth in Cryogenic Applications

    The expansion of cryogenic applications in sectors like healthcare, aerospace, and energy is propelling the Global Multi-layer cryogenic insulation market Industry forward. For instance, the use of cryogenic technology in medical applications, such as the storage of biological samples, necessitates reliable insulation to maintain low temperatures. Additionally, the aerospace sector increasingly relies on cryogenic fuels, which require robust insulation systems to ensure safety and efficiency. This growing reliance on cryogenic applications is expected to contribute to the market's growth, with projections indicating a rise to 2.11 USD Billion by 2035.

    Rising Demand for Energy Efficiency

    The Global Multi-layer cryogenic insulation market Industry is experiencing a surge in demand driven by the increasing focus on energy efficiency across various sectors. Industries such as aerospace, liquefied natural gas, and cryogenic storage are adopting advanced insulation technologies to minimize energy losses. This trend is particularly evident as companies seek to comply with stringent energy regulations and reduce operational costs. The market is projected to reach 1.01 USD Billion in 2024, reflecting a growing recognition of the importance of effective insulation solutions in enhancing energy efficiency.

    Increasing Investments in LNG Infrastructure

    The Global Multi-layer cryogenic insulation market Industry is being bolstered by rising investments in liquefied natural gas (LNG) infrastructure. As countries aim to transition to cleaner energy sources, the demand for LNG is escalating, necessitating advanced insulation solutions for storage and transportation. The construction of new LNG terminals and expansion of existing facilities require effective cryogenic insulation to ensure safety and efficiency. This trend is expected to drive market growth, as investments in LNG infrastructure continue to rise, aligning with global energy transition goals.

    Regulatory Support for Cryogenic Technologies

    Government regulations promoting the use of cryogenic technologies are playing a crucial role in the Global Multi-layer cryogenic insulation market Industry. Policies aimed at reducing greenhouse gas emissions and enhancing energy efficiency are encouraging industries to adopt advanced insulation solutions. For example, regulations in the energy sector are pushing companies to implement better insulation in cryogenic applications to comply with environmental standards. This regulatory support is likely to foster market growth, as industries seek to align with governmental initiatives and invest in innovative insulation technologies.

    Technological Advancements in Insulation Materials

    Innovations in insulation materials are significantly influencing the Global Multi-layer cryogenic insulation market Industry. The development of advanced materials, such as aerogels and vacuum insulation panels, enhances thermal performance and reduces weight, making them ideal for cryogenic applications. These technological advancements not only improve insulation efficiency but also expand the range of applications across various industries. As manufacturers continue to invest in research and development, the market is likely to benefit from these innovations, potentially leading to a compound annual growth rate of 6.91% from 2025 to 2035.

    Market Segment Insights

    Regional Insights

    Key Companies in the Multi Layer Cryogenic Insulation Market market include

    Industry Developments

    Future Outlook

    Multi Layer Cryogenic Insulation Market Future Outlook

    The Multi-layer cryogenic insulation market is projected to grow at a 6.91% CAGR from 2024 to 2035, driven by advancements in aerospace applications, energy efficiency demands, and increased LNG transportation.

    New opportunities lie in:

    • Develop innovative insulation materials for aerospace applications to enhance performance.
    • Expand production capabilities to meet rising demand in LNG transport sectors.
    • Invest in R&D for sustainable insulation solutions to capture eco-conscious markets.

    By 2035, the Multi-layer cryogenic insulation market is expected to achieve robust growth, reflecting evolving industry needs.

    Market Segmentation

    Report Overview:

    Intended Audience
    • Energy & Power Companies
    • Metallurgical Companies
    • Shipping Companies
    • Space Companies
    • Research Institutes
    • Academic Institutes
    • Government Organizations
    Objectives of the Study
    • To get a comprehensive overview of the global Multi-layer cryogenic insulation market
    • To get wide-ranging information about the key factors driving the market and market opportunities
    • To gain information regarding the key players in the industry, their product portfolio, strategies, and key developments
    • To gain insights about the key country/region in which the market is growing

    Report Scope

    Report Attribute/Metric Details
      Market Size   2030: USD 1,522.78 Million
      CAGR   6.70% CAGR (2022-2030)
      Base Year   2021
      Forecast Period   2022-2030
      Historical Data   2018
      Forecast Units    Value (USD Million)
      Report Coverage  Revenue Forecast, Competitive Landscape, Growth Factors, and Trends
      Segments Covered   Type and End-use
      Geographies Covered   North America, Europe, Asia-Pacific, Latin America, and the Middle East and Africa
      Key Vendors   Armacell International Holding GmbH (Germany), Lydall Inc. (US), Cabot Corporation (US), Technifab Products (US), Dunmore Corporation (US), NICHIAS Corporation (Japan), Aspen Aerogels (US), Owens Corning (US), Isolatie Combinatie Beverwijk B.V. (Netherland), and Abhijit Enterprises (India)
      Key Market Opportunities   • Increasing use of cryogenic insulation in space application
      Key Market Drivers   • Rising demand for LNG as fuel • Use of superinsulation in storage and transportation of gases such as oxygen and nitrogen • Use of cryogenic insulation in the shipping industry Increasing environmental regulations • Degrading quality of crude oil

    Market Highlights

    Author

    Anshula Mandaokar
    Team Lead - Research

    She holds an experience of about 6+ years in market research and business consulting, working under the spectrum of information communication technology, telecommunications and semiconductor domains. aarti conceptualizes and implements a scalable business strategy and provides strategic leadership to the clients. her expertise lies in market estimation, competitive intelligence, pipeline analysis, customer assessment, etc.

    Leave a Comment

    Latest Comments

    John Doe
    john@example.com

    This is a great article! Really helped me understand the topic better.

    Posted on July 23, 2025, 10:15 AM
    Jane Smith
    jane@domain.com

    Thanks for sharing this. I’ve bookmarked it for later reference.

    Posted on July 22, 2025, 7:45 PM

    FAQs

    What growth rate global Multi-layer cryogenic insulation market would register in the future?

    The global Multi-layer cryogenic insulation market would register a growth of 6.70%.

    Which industry will play a crucial role in taking the Multi-layer cryogenic insulation market ahead??

    The energy & power industry will play a prominent role in taking the market forward.

    What is the key restraining factor for the global Multi-layer cryogenic insulation market?

    Volatile raw material prices could restrain the market.

    Which region would enjoy the upper hand in the Multi-layer cryogenic insulation market?

    North America would enjoy the upper hand in the Multi-layer cryogenic insulation market.

    Which Asia-Pacific country would set the trend in the Multi-layer cryogenic insulation market?

    China, as the largest consumer, would set the trend.

    1. EXECUTIVE SUMMARY 16
      1. MARKET ATTRACTIVENESS
        1. GLOBAL MULTI-LAYER CRYOGENIC INSULATION MARKET, BY TYPE 19
        2. GLOBAL MULTI-LAYER CRYOGENIC INSULATION MARKET, BY END USE 20
      2. ANALYSIS 18
      3. 1.1.3
    2. GLOBAL MULTI-LAYER CRYOGENIC INSULATION MARKET, BY REGION 21
    3. MARKET INTRODUCTION
      1. 22
      2. DEFINITION 22
      3. SCOPE OF THE STUDY 22
      4. MARKET STRUCTURE
      5. 23
    4. RESEARCH METHODOLOGY 24
      1. RESEARCH PROCESS 24
      2. PRIMARY
      3. RESEARCH 25
      4. SECONDARY RESEARCH 26
      5. MARKET SIZE ESTIMATION 27
      6. TOP-DOWN AND BOTTOM-UP APPROACH 27
      7. FORECAST MODEL 28
      8. LIST
      9. OF ASSUMPTIONS & LIMITATIONS 29
    5. MARKET DYNAMICS 30
      1. INTRODUCTION
      2. 30
      3. DRIVERS 31
        1. RISING DEMAND FOR LNG AS FUEL 31
        2. USE
        3. USE OF CRYOGENIC INSULATION IN THE SHIPPING INDUSTRY 32
      4. OF SUPERINSULATION IN STORAGE AND TRANSPORTATION OF GASES SUCH AS OXYGEN AND NITROGEN
      5. 31
      6. RESTRAINTS
        1. VOLATILE RAW MATERIAL PRICES 33
      7. 33
      8. OPPORTUNITIES 34
      9. 4.4.1
      10. INCREASING USE OF CRYOGENIC INSULATION IN SPACE APPLICATIONS 34
      11. TREND 35
        1. APPLICATIONS IN SUPERCONDUCTING DEVICES 35
    6. MARKET FACTOR
      1. ANALYSIS 36
      2. SUPPLY CHAIN ANALYSIS 36
        1. RAW MATERIAL SUPPLIERS
        2. MULTI-LAYER CRYOGENIC INSULATION PRODUCERS 38
        3. DISTRIBUTION
        4. END USE 38
      3. 37
      4. GLASS 37
      5. 5.1.1.6
      6. PERLITE 38
      7. & SALES CHANNEL 38
      8. PORTER'S FIVE FORCES ANALYSIS
        1. THREAT OF NEW ENTRANTS 41
        2. BARGAINING POWER OF SUPPLIERS
        3. THREAT OF SUBSTITUTES 41
        4. BARGAINING POWER OF BUYERS 41
        5. INTENSITY OF RIVALRY 41
      9. 40
      10. 41
      11. AVERAGE SELLING PRICING OVERVIEW, 2019-2021
        1. AVERAGE SELLING PRICING OVERVIEW, BY REGION 42
      12. (USD/SQ. METERS) 42
      13. IMPACT OF COVID 19 OUTBREAK ON GLOBAL MULTI-LAYER CRYOGENIC INSULATION MARKET
        1. IMPACT ON GLOBAL ECONOMY 42
        2. IMPACT ON SUPPLY CHAIN OF MULTI-LAYER
        3. MAJOR GOVERNMENT POLICIES TO COUNTER THE
        4. QUALITATIVE
      14. 42
      15. CRYOGENIC INSULATION MARKET 42
      16. IMPACT OF COVID-19 43
      17. ANALYSIS ON CHANGES IN DEMAND FROM END USERS 47
      18. 47
      19. 48
    7. GLOBAL MULTI-LAYER CRYOGENIC INSULATION MARKET,
      1. BY TYPE 49
      2. INTRODUCTION 49
      3. PU & PIR 52
      4. CELLULAR GLASS
      5. 54
      6. POLYSTYRENE 55
      7. FIBERGLASS 56
      8. PERLITE 57
      9. OTHERS
      10. 58
    8. GLOBAL MULTI-LAYER CRYOGENIC INSULATION MARKET, BY END USE 59
      1. 7.1
      2. INTRODUCTION 59
      3. ENERGY & POWER 62
      4. CHEMICALS 64
      5. METALLURGICAL
      6. 65
      7. ELECTRONICS 66
      8. SHIPPING 67
      9. OTHERS 68
    9. GLOBAL
    10. MULTI-LAYER CRYOGENIC INSULATION MARKET, BY REGION 69
      1. INTRODUCTION 69
      2. NORTH AMERICA 73
        1. US 77
        2. CANADA 79
      3. EUROPE 81
        1. GERMANY 85
        2. UK 87
        3. FRANCE 89
        4. SPAIN 91
        5. ITALY 93
        6. REST OF EUROPE 95
      4. ASIA-PACIFIC 97
        1. JAPAN 103
        2. INDIA 105
        3. SOUTH KOREA 107
        4. AUSTRALIA & NEW ZEALAND 109
        5. REST OF ASIA-PACIFIC 111
        6. BRAZIL 117
        7. MEXICO 119
        8. ARGENTINA
        9. REST OF LATIN AMERICA 123
      5. 8.4.1
      6. CHINA 101
      7. 8.5
      8. LATIN AMERICA 113
      9. 121
      10. MIDDLE EAST &
        1. GCC COUNTRIES 129
        2. SOUTH AFRICA 131
        3. REST
      11. AFRICA 125
      12. OF THE MIDDLE EAST & AFRICA 133
    11. COMPETITIVE LANDSCAPE 135
      1. COMPETITIVE
      2. OVERVIEW 135
      3. MARKET STRATEGY ANALYSIS 135
      4. KEY DEVELOPMENTS 136
      5. COMPETITIVE BENCHMARKING 137
    12. COMPANY PROFILES 138
      1. ARMACELL
        1. COMPANY OVERVIEW 138
        2. FINANCIAL
        3. PRODUCTS OFFERED 139
        4. KEY DEVELOPMENTS 140
        5. SWOT ANALYSIS 140
        6. KEY STRATEGIES 140
      2. INTERNATIONAL HOLDING GMBH 138
      3. OVERVIEW 139
      4. LYDALL INC.
        1. COMPANY OVERVIEW 141
        2. FINANCIAL OVERVIEW 142
        3. KEY DEVELOPMENTS 143
        4. SWOT ANALYSIS
        5. KEY STRATEGIES 143
      5. 141
      6. 10.2.3
      7. PRODUCTS OFFERED 142
      8. 143
      9. CABOT CORPORATION 144
        1. COMPANY
        2. FINANCIAL OVERVIEW 145
        3. PRODUCTS OFFERED 145
        4. KEY DEVELOPMENTS 146
        5. SWOT ANALYSIS 146
        6. KEY STRATEGIES
      10. OVERVIEW 144
      11. 146
      12. TECHNIFAB PRODUCTS 147
        1. COMPANY OVERVIEW 147
        2. PRODUCTS OFFERED 147
        3. KEY DEVELOPMENTS
        4. SWOT ANALYSIS 148
        5. KEY STRATEGIES 148
      13. 10.4.2
      14. FINANCIAL OVERVIEW 147
      15. 148
      16. OWENS
        1. COMPANY OVERVIEW 149
        2. FINANCIAL OVERVIEW 150
        3. PRODUCTS OFFERED 151
        4. KEY DEVELOPMENTS 151
        5. SWOT
        6. KEY STRATEGIES 152
      17. CORNING 149
      18. ANALYSIS 151
      19. NICHIA CORPORATION 153
        1. COMPANY OVERVIEW 153
        2. FINANCIAL OVERVIEW 153
        3. PRODUCT
        4. KEY DEVELOPMENTS 153
        5. SWOT ANALYSIS 154
        6. KEY STRATEGIES 154
      20. OFFERINGS 153
      21. DUNMORE 155
        1. COMPANY OVERVIEW 155
        2. FINANCIAL OVERVIEW 156
        3. PRODUCT OFFERINGS 157
        4. KEY
        5. SWOT ANALYSIS 158
        6. KEY STRATEGIES 158
      22. DEVELOPMENTS 157
      23. ASPEN AEROGELS 159
        1. COMPANY OVERVIEW 159
        2. FINANCIAL
        3. PRODUCT OFFERINGS 160
        4. KEY DEVELOPMENTS 161
        5. SWOT ANALYSIS 161
        6. KEY STRATEGIES 161
      24. OVERVIEW 160
      25. ISOLATIE COMBINATIE
        1. COMPANY OVERVIEW 162
        2. FINANCIAL OVERVIEW
        3. PRODUCT OFFERINGS 162
        4. KEY DEVELOPMENTS 162
        5. KEY STRATEGIES 163
      26. BEVERWIJK B.V. 162
      27. 162
      28. 10.9.5
      29. SWOT ANALYSIS 163
      30. ABHIJIT
        1. COMPANY OVERVIEW 164
        2. FINANCIAL OVERVIEW
        3. PRODUCT OFFERINGS 164
        4. KEY DEVELOPMENTS 164
        5. KEY STRATEGIES 165
      31. ENTERPRISES 164
      32. 164
      33. 10.10.5
      34. SWOT ANALYSIS 165
    13. APPENDIX 166
      1. 11.1
      2. REFERENCES 166
      3. RELATED REPORTS 167
    14. LIST OF TABLES
    15. LIST OF ASSUMPTIONS & LIMITATIONS 29
    16. LIST OF END USES,
      1. BY REGION 39
    17. PRICING OVERVIEW, BY REGION 42
    18. GLOBAL MULTI-LAYER
      1. CRYOGENIC INSULATION, BY TYPE, 2019–2028 (USD MILLION) 50
    19. GLOBAL
    20. MULTI-LAYER CRYOGENIC INSULATION MARKET, BY TYPE, 2019–2028 (MILLION SQ. METERS)
      1. 51
    21. GLOBAL MULTI-LAYER CRYOGENIC INSULATION MARKET FOR PU & PIR,
      1. BY REGION, 2019–2028 (USD MILLION) 52
    22. GLOBAL MULTI-LAYER CRYOGENIC
    23. INSULATION MARKET FOR PU & PIR, BY REGION, 2019–2028 (MILLION SQ. METERS)
      1. 53
    24. GLOBAL MULTI-LAYER CRYOGENIC INSULATION MARKET FOR CELLULAR GLASS,
      1. BY REGION, 2019–2028 (USD MILLION) 54
    25. GLOBAL MULTI-LAYER CRYOGENIC
    26. INSULATION MARKET FOR CELLULAR GLASS, BY REGION, 2019–2028
      1. (MILLION
      2. SQ. METERS) 54
    27. GLOBAL MULTI-LAYER CRYOGENIC INSULATION MARKET FOR
      1. POLYSTYRENE, BY REGION, 2019–2028 (USD MILLION) 55
    28. GLOBAL MULTI-LAYER
    29. CRYOGENIC INSULATION MARKET FOR POLYSTYRENE, BY REGION, 2019–2028 (MILLION
      1. SQ. METERS) 55
    30. GLOBAL MULTI-LAYER CRYOGENIC INSULATION MARKET FOR
      1. FIBERGLASS, BY REGION, 2019–2028 (USD MILLION) 56
    31. GLOBAL MULTI-LAYER
    32. CRYOGENIC INSULATION MARKET FOR FIBERGLASS, BY REGION, 2019–2028 (MILLION
      1. SQ. METERS) 56
    33. GLOBAL MULTI-LAYER CRYOGENIC INSULATION MARKET FOR
      1. PERLITE, BY REGION, 2019–2028 (USD MILLION) 57
    34. GLOBAL MULTI-LAYER
    35. CRYOGENIC INSULATION MARKET FOR PERLITE, BY REGION, 2019–2028 (MILLION SQ.
      1. METERS) 57
    36. GLOBAL MULTI-LAYER CRYOGENIC INSULATION MARKET FOR OTHERS,
      1. BY REGION, 2019–2028 (USD MILLION) 58
    37. GLOBAL MULTI-LAYER CRYOGENIC
    38. INSULATION MARKET FOR OTHERS, BY REGION, 2019–2028 (MILLION SQ. METERS) 58
    39. GLOBAL MULTI-LAYER CRYOGENIC INSULATION, BY END USE, 2019–2028
      1. (USD MILLION) 60
    40. GLOBAL MULTI-LAYER CRYOGENIC INSULATION MARKET, BY
      1. END USE, 2019–2028 (MILLION SQ. METERS) 61
    41. GLOBAL MULTI-LAYER
    42. CRYOGENIC INSULATION MARKET FOR ENERGY & POWER, BY REGION, 2019–2028 (USD
      1. MILLION) 62
    43. GLOBAL MULTI-LAYER CRYOGENIC INSULATION MARKET FOR ENERGY
      1. & POWER, BY REGION, 2019–2028
      2. (MILLION SQ. METERS) 63
      3. TABLE
    44. GLOBAL MULTI-LAYER CRYOGENIC INSULATION MARKET FOR CHEMICALS, BY REGION, 2019–2028
      1. (USD MILLION) 64
    45. GLOBAL MULTI-LAYER CRYOGENIC INSULATION MARKET FOR
      1. CHEMICALS, BY REGION, 2019–2028 (MILLION SQ. METERS) 64
    46. GLOBAL
    47. MULTI-LAYER CRYOGENIC INSULATION MARKET FOR METALLURGICAL, BY REGION, 2019–2028
      1. (USD MILLION) 65
    48. GLOBAL MULTI-LAYER CRYOGENIC INSULATION MARKET FOR
      1. METALLURGICAL, BY REGION, 2019–2028
      2. (MILLION SQ. METERS) 65
      3. TABLE
    49. GLOBAL MULTI-LAYER CRYOGENIC INSULATION MARKET FOR ELECTRONICS, BY REGION, 2019–2028
      1. (USD MILLION) 66
    50. GLOBAL MULTI-LAYER CRYOGENIC INSULATION MARKET FOR
      1. ELECTRONICS, BY REGION, 2019–2028 (MILLION SQ. METERS) 66
    51. GLOBAL
    52. MULTI-LAYER CRYOGENIC INSULATION MARKET FOR SHIPPING, BY REGION, 2019–2028
      1. (USD MILLION) 67
    53. GLOBAL MULTI-LAYER CRYOGENIC INSULATION MARKET FOR
      1. SHIPPING, BY REGION, 2019–2028 (MILLION SQ. METERS) 67
    54. GLOBAL
    55. MULTI-LAYER CRYOGENIC INSULATION MARKET FOR OTHERS, BY REGION, 2019–2028 (USD
      1. MILLION) 68
    56. GLOBAL MULTI-LAYER CRYOGENIC INSULATION MARKET FOR OTHERS,
      1. BY REGION, 2019–2028 (MILLION SQ. METERS) 68
    57. GLOBAL MULTI-LAYER
    58. CRYOGENIC INSULATION MARKET, BY REGION, 2019–2028 (USD MILLION) 71
      1. TABLE
    59. GLOBAL MULTI-LAYER CRYOGENIC INSULATION MARKET, BY REGION, 2019–2028 (MILLION
      1. SQ. METERS) 72
    60. NORTH AMERICA MULTI-LAYER CRYOGENIC INSULATION MARKET,
      1. BY COUNTRY, 2019–2028 (USD MILLION) 74
    61. NORTH AMERICA MULTI-LAYER
    62. CRYOGENIC INSULATION MARKET, BY COUNTRY, 2019–2028 (MILLION SQ. METERS) 74
    63. NORTH AMERICA MULTI-LAYER CRYOGENIC INSULATION MARKET, BY TYPE, 2019–2028
      1. (USD MILLION) 75
    64. NORTH AMERICA MULTI-LAYER CRYOGENIC INSULATION MARKET,
      1. BY TYPE, 2019–2028 (MILLION SQ. METERS) 75
    65. NORTH AMERICA MULTI-LAYER
    66. CRYOGENIC INSULATION MARKET, BY END USE, 2019–2028 (USD MILLION) 76
      1. TABLE
    67. NORTH AMERICA MULTI-LAYER CRYOGENIC INSULATION MARKET, BY END USE, 2019–2028
      1. (MILLION SQ. METERS) 76
    68. US MULTI-LAYER CRYOGENIC INSULATION MARKET,
      1. BY TYPE, 2019–2028 (USD MILLION) 77
    69. US MULTI-LAYER CRYOGENIC
    70. INSULATION MARKET, BY TYPE, 2019–2028 (MILLION SQ. METERS) 77
      1. TABLE 42
    71. US MULTI-LAYER CRYOGENIC INSULATION MARKET, BY END USE, 2019–2028 (USD MILLION)
      1. 78
    72. US MULTI-LAYER CRYOGENIC INSULATION MARKET, BY END USE, 2019–2028
      1. (MILLION SQ. METERS) 78
    73. CANADA MULTI-LAYER CRYOGENIC INSULATION MARKET,
      1. BY TYPE, 2019–2028 (USD MILLION) 79
    74. CANADA MULTI-LAYER CRYOGENIC
    75. INSULATION MARKET, BY TYPE, 2019–2028 (MILLION SQ. METERS) 79
      1. TABLE 46
    76. CANADA MULTI-LAYER CRYOGENIC INSULATION MARKET, BY END USE, 2019–2028 (USD
      1. MILLION) 80
    77. CANADA MULTI-LAYER CRYOGENIC INSULATION MARKET, BY END
      1. USE, 2019–2028 (MILLION SQ. METERS) 80
    78. EUROPE MULTI-LAYER CRYOGENIC
    79. INSULATION MARKET, BY COUNTRY, 2019–2028 (USD MILLION) 82
    80. EUROPE
    81. MULTI-LAYER CRYOGENIC INSULATION MARKET, BY COUNTRY, 2019–2028 (MILLION SQ.
      1. METERS) 82
    82. EUROPE MULTI-LAYER CRYOGENIC INSULATION MARKET, BY TYPE,
    83. EUROPE MULTI-LAYER CRYOGENIC INSULATION
    84. MARKET, BY TYPE, 2019–2028 (MILLION SQ. METERS) 83
    85. EUROPE MULTI-LAYER
    86. CRYOGENIC INSULATION MARKET, BY END USE, 2019–2028 (USD MILLION) 84
      1. TABLE
    87. EUROPE MULTI-LAYER CRYOGENIC INSULATION MARKET, BY END USE, 2019–2028 (MILLION
      1. SQ. METERS) 84
    88. GERMANY MULTI-LAYER CRYOGENIC INSULATION MARKET, BY
      1. TYPE, 2019–2028 (USD MILLION) 85
    89. GERMANY MULTI-LAYER CRYOGENIC
    90. INSULATION MARKET, BY TYPE, 2019–2028 (MILLION SQ. METERS) 85
      1. TABLE 56
    91. GERMANY MULTI-LAYER CRYOGENIC INSULATION MARKET, BY END USE, 2019–2028 (USD
      1. MILLION) 86
    92. GERMANY MULTI-LAYER CRYOGENIC INSULATION MARKET, BY END
      1. USE, 2019–2028 (MILLION SQ. METERS) 86
    93. UK MULTI-LAYER CRYOGENIC
    94. INSULATION MARKET, BY TYPE, 2019–2028 (USD MILLION) 87
    95. UK MULTI-LAYER
    96. CRYOGENIC INSULATION MARKET, BY TYPE, 2019–2028 (MILLION SQ. METERS) 87
    97. UK MULTI-LAYER CRYOGENIC INSULATION MARKET, BY END USE, 2019–2028
      1. (USD MILLION) 88
    98. UK MULTI-LAYER CRYOGENIC INSULATION MARKET, BY END
      1. USE, 2019–2028 (MILLION SQ. METERS) 88
    99. FRANCE MULTI-LAYER CRYOGENIC
    100. INSULATION MARKET, BY TYPE, 2019–2028 (USD MILLION) 89
    101. FRANCE
    102. MULTI-LAYER CRYOGENIC INSULATION MARKET, BY TYPE, 2019–2028 (MILLION SQ. METERS)
      1. 89
    103. FRANCE MULTI-LAYER CRYOGENIC INSULATION MARKET, BY END USE, 2019–2028
      1. (USD MILLION) 90
    104. FRANCE MULTI-LAYER CRYOGENIC INSULATION MARKET, BY
      1. END USE, 2019–2028 (MILLION SQ. METERS) 90
    105. SPAIN MULTI-LAYER
    106. CRYOGENIC INSULATION MARKET, BY TYPE, 2019–2028 (USD MILLION) 91
      1. TABLE
    107. SPAIN MULTI-LAYER CRYOGENIC INSULATION MARKET, BY TYPE, 2019–2028 (MILLION
      1. SQ. METERS) 91
    108. SPAIN MULTI-LAYER CRYOGENIC INSULATION MARKET, BY END
      1. USE, 2019–2028 (USD MILLION) 92
    109. SPAIN MULTI-LAYER CRYOGENIC
    110. INSULATION MARKET, BY END USE, 2019–2028 (MILLION SQ. METERS) 92
      1. TABLE
    111. ITALY MULTI-LAYER CRYOGENIC INSULATION MARKET, BY TYPE, 2019–2028 (USD
      1. MILLION) 93
    112. ITALY MULTI-LAYER CRYOGENIC INSULATION MARKET, BY TYPE,
    113. ITALY MULTI-LAYER CRYOGENIC
    114. INSULATION MARKET, BY END USE, 2019–2028 (USD MILLION) 94
    115. ITALY
    116. MULTI-LAYER CRYOGENIC INSULATION MARKET, BY END USE, 2019–2028 (MILLION SQ.
      1. METERS) 94
    117. REST OF EUROPE MULTI-LAYER CRYOGENIC INSULATION MARKET,
      1. BY TYPE, 2019–2028 (USD MILLION) 95
    118. REST OF EUROPE MULTI-LAYER
    119. CRYOGENIC INSULATION MARKET, BY TYPE, 2019–2028 (MILLION SQ. METERS) 95
    120. REST OF EUROPE MULTI-LAYER CRYOGENIC INSULATION MARKET, BY END USE, 2019–2028
      1. (USD MILLION) 96
    121. REST OF EUROPE MULTI-LAYER CRYOGENIC INSULATION MARKET,
      1. BY END USE, 2019–2028 (MILLION SQ. METERS) 96
    122. ASIA-PACIFIC MULTI-LAYER
    123. CRYOGENIC INSULATION MARKET, BY COUNTRY, 2019–2028 (USD MILLION) 98
      1. TABLE
    124. ASIA-PACIFIC MULTI-LAYER CRYOGENIC INSULATION MARKET, BY COUNTRY, 2019–2028
      1. (MILLION SQ. METERS) 98
    125. ASIA-PACIFIC MULTI-LAYER CRYOGENIC INSULATION
    126. MARKET, BY TYPE, 2019–2028 (USD MILLION) 99
    127. ASIA-PACIFIC MULTI-LAYER
    128. CRYOGENIC INSULATION MARKET, BY TYPE, 2019–2028 (MILLION SQ. METERS) 99
    129. ASIA-PACIFIC MULTI-LAYER CRYOGENIC INSULATION MARKET, BY END USE, 2019–2028
      1. (USD MILLION) 100
    130. ASIA-PACIFIC MULTI-LAYER CRYOGENIC INSULATION MARKET,
      1. BY END USE, 2019–2028 (MILLION SQ. METERS) 100
    131. CHINA MULTI-LAYER
    132. CRYOGENIC INSULATION MARKET, BY TYPE, 2019–2028 (USD MILLION) 101
      1. TABLE
    133. CHINA MULTI-LAYER CRYOGENIC INSULATION MARKET, BY TYPE, 2019–2028 (MILLION
      1. SQ. METERS) 101
    134. CHINA MULTI-LAYER CRYOGENIC INSULATION MARKET, BY
      1. END USE, 2019–2028 (USD MILLION) 102
    135. CHINA MULTI-LAYER CRYOGENIC
    136. INSULATION MARKET, BY END USE, 2019–2028 (MILLION SQ. METERS) 102
      1. TABLE
    137. JAPAN MULTI-LAYER CRYOGENIC INSULATION MARKET, BY TYPE, 2019–2028 (USD
      1. MILLION) 103
    138. JAPAN MULTI-LAYER CRYOGENIC INSULATION MARKET, BY TYPE,
    139. JAPAN MULTI-LAYER CRYOGENIC
    140. INSULATION MARKET, BY END USE, 2019–2028 (USD MILLION) 104
    141. JAPAN
    142. MULTI-LAYER CRYOGENIC INSULATION MARKET, BY END USE, 2019–2028 (MILLION SQ.
      1. METERS) 104
    143. INDIA MULTI-LAYER CRYOGENIC INSULATION MARKET, BY TYPE,
    144. INDIA MULTI-LAYER CRYOGENIC INSULATION
    145. MARKET, BY TYPE, 2019–2028 (MILLION SQ. METERS) 105
    146. INDIA MULTI-LAYER
    147. CRYOGENIC INSULATION MARKET, BY END USE, 2019–2028 (USD MILLION) 106
      1. TABLE
    148. INDIA MULTI-LAYER CRYOGENIC INSULATION MARKET, BY END USE, 2019–2028 (MILLION
      1. SQ. METERS) 106
    149. SOUTH KOREA MULTI-LAYER CRYOGENIC INSULATION MARKET,
      1. BY TYPE, 2019–2028 (USD MILLION) 107
    150. SOUTH KOREA MULTI-LAYER
    151. CRYOGENIC INSULATION MARKET, BY TYPE, 2019–2028 (MILLION SQ. METERS) 107
    152. SOUTH KOREA MULTI-LAYER CRYOGENIC INSULATION MARKET, BY END USE, 2019–2028
      1. (USD MILLION) 108
    153. SOUTH KOREA MULTI-LAYER CRYOGENIC INSULATION MARKET,
      1. BY END USE, 2019–2028 (MILLION SQ. METERS) 108
    154. AUSTRALIA &
    155. NEW ZEALAND MULTI-LAYER CRYOGENIC INSULATION MARKET, BY TYPE, 2019–2028 (USD
      1. MILLION) 109
    156. AUSTRALIA & NEW ZEALAND MULTI-LAYER CRYOGENIC INSULATION
    157. MARKET, BY TYPE, 2019–2028 (MILLION SQ. METERS) 109
    158. AUSTRALIA
    159. & NEW ZEALAND MULTI-LAYER CRYOGENIC INSULATION MARKET, BY END USE, 2019–2028
      1. (USD MILLION) 110
    160. AUSTRALIA & NEW ZEALAND MULTI-LAYER CRYOGENIC
    161. INSULATION MARKET, BY END USE, 2019–2028 (MILLION SQ. METERS) 110
      1. TABLE
    162. REST OF ASIA-PACIFIC MULTI-LAYER CRYOGENIC INSULATION MARKET, BY TYPE, 2019–2028
      1. (USD MILLION) 111
    163. REST OF ASIA-PACIFIC MULTI-LAYER CRYOGENIC INSULATION
    164. MARKET, BY TYPE, 2019–2028 (MILLION SQ. METERS) 111
    165. REST OF
    166. ASIA-PACIFIC MULTI-LAYER CRYOGENIC INSULATION MARKET, BY END USE, 2019–2028
      1. (USD MILLION) 112
    167. REST OF ASIA-PACIFIC MULTI-LAYER CRYOGENIC INSULATION
    168. MARKET, BY END USE, 2019–2028 (MILLION SQ. METERS) 112
    169. LATIN
    170. AMERICA MULTI-LAYER CRYOGENIC INSULATION MARKET, BY COUNTRY, 2019–2028 (USD
      1. MILLION) 114
    171. LATIN AMERICA MULTI-LAYER CRYOGENIC INSULATION MARKET,
      1. BY COUNTRY, 2019–2028 (MILLION SQ. METERS) 114
    172. LATIN AMERICA
    173. MULTI-LAYER CRYOGENIC INSULATION MARKET, BY TYPE, 2019–2028 (USD MILLION)
      1. 115
    174. LATIN AMERICA MULTI-LAYER CRYOGENIC INSULATION MARKET, BY TYPE,
    175. LATIN AMERICA MULTI-LAYER
    176. CRYOGENIC INSULATION MARKET, BY END USE, 2019–2028 (USD MILLION) 116
      1. TABLE
    177. LATIN AMERICA MULTI-LAYER CRYOGENIC INSULATION MARKET, BY END USE, 2019–2028
      1. (MILLION SQ. METERS) 116
    178. BRAZIL MULTI-LAYER CRYOGENIC INSULATION
    179. MARKET, BY TYPE, 2019–2028 (USD MILLION) 117
    180. BRAZIL MULTI-LAYER
    181. CRYOGENIC INSULATION MARKET, BY TYPE, 2019–2028 (MILLION SQ. METERS) 117
    182. BRAZIL MULTI-LAYER CRYOGENIC INSULATION MARKET, BY END USE, 2019–2028
      1. (USD MILLION) 118
    183. BRAZIL MULTI-LAYER CRYOGENIC INSULATION MARKET,
      1. BY END USE, 2019–2028 (MILLION SQ. METERS) 118
    184. MEXICO MULTI-LAYER
    185. CRYOGENIC INSULATION MARKET, BY TYPE, 2019–2028 (USD MILLION) 119
      1. TABLE
    186. MEXICO MULTI-LAYER CRYOGENIC INSULATION MARKET, BY TYPE, 2019–2028 (MILLION
      1. SQ. METERS) 119
    187. MEXICO MULTI-LAYER CRYOGENIC INSULATION MARKET, BY
      1. END USE, 2019–2028 (USD MILLION) 120
    188. MEXICO MULTI-LAYER CRYOGENIC
    189. INSULATION MARKET, BY END USE, 2019–2028 (MILLION SQ. METERS) 120
      1. TABLE
    190. ARGENTINA MULTI-LAYER CRYOGENIC INSULATION MARKET, BY TYPE, 2019–2028
      1. (USD MILLION) 121
    191. ARGENTINA MULTI-LAYER CRYOGENIC INSULATION MARKET,
      1. BY TYPE, 2019–2028 (MILLION SQ. METERS) 121
    192. ARGENTINA MULTI-LAYER
    193. CRYOGENIC INSULATION MARKET, BY END USE, 2019–2028 (USD MILLION) 122
      1. TABLE
    194. ARGENTINA MULTI-LAYER CRYOGENIC INSULATION MARKET, BY END USE, 2019–2028
      1. (MILLION SQ. METERS) 122
    195. REST OF LATIN AMERICA MULTI-LAYER CRYOGENIC
    196. INSULATION MARKET, BY TYPE, 2019–2028 (USD MILLION) 123
    197. REST
    198. OF LATIN AMERICA MULTI-LAYER CRYOGENIC INSULATION MARKET, BY TYPE, 2019–2028
      1. (MILLION SQ. METERS) 123
    199. REST OF LATIN AMERICA MULTI-LAYER CRYOGENIC
    200. INSULATION MARKET, BY END USE, 2019–2028 (USD MILLION) 124
      1. TABLE 129
    201. REST OF LATIN AMERICA MULTI-LAYER CRYOGENIC INSULATION MARKET, BY END USE, 2019–2028
      1. (MILLION SQ. METERS) 124
    202. MIDDLE EAST & AFRICA MULTI-LAYER CRYOGENIC
    203. INSULATION MARKET, BY COUNTRY, 2019–2028 (USD MILLION) 126
      1. TABLE 131
    204. MIDDLE EAST & AFRICA MULTI-LAYER CRYOGENIC INSULATION MARKET, BY COUNTRY, 2019–2028
      1. (MILLION SQ. METERS) 126
    205. MIDDLE EAST & AFRICA MULTI-LAYER CRYOGENIC
    206. INSULATION MARKET, BY TYPE, 2019–2028 (USD MILLION) 127
    207. MIDDLE
    208. EAST & AFRICA MULTI-LAYER CRYOGENIC INSULATION MARKET, BY TYPE, 2019–2028
      1. (MILLION SQ. METERS) 127
    209. MIDDLE EAST & AFRICA MULTI-LAYER CRYOGENIC
    210. INSULATION MARKET, BY END USE, 2019–2028 (USD MILLION) 128
      1. TABLE 135
    211. MIDDLE EAST & AFRICA MULTI-LAYER CRYOGENIC INSULATION MARKET, BY END USE, 2019–2028
      1. (MILLION SQ. METERS) 128
    212. GCC COUNTRIES MULTI-LAYER CRYOGENIC INSULATION
    213. MARKET, BY TYPE, 2019–2028 (USD MILLION) 129
    214. GCC COUNTRIES
    215. MULTI-LAYER CRYOGENIC INSULATION MARKET, BY TYPE, 2019–2028 (MILLION SQ. METERS)
      1. 129
    216. GCC COUNTRIES MULTI-LAYER CRYOGENIC INSULATION MARKET, BY END
      1. USE, 2019–2028 (USD MILLION) 130
    217. GCC COUNTRIES MULTI-LAYER
    218. CRYOGENIC INSULATION MARKET, BY END USE, 2019–2028 (MILLION SQ. METERS) 130
    219. SOUTH AFRICA MULTI-LAYER CRYOGENIC INSULATION MARKET, BY TYPE, 2019–2028
      1. (USD MILLION) 131
    220. SOUTH AFRICA MULTI-LAYER CRYOGENIC INSULATION MARKET,
      1. BY TYPE, 2019–2028 (MILLION SQ. METERS) 131
    221. SOUTH AFRICA MULTI-LAYER
    222. CRYOGENIC INSULATION MARKET, BY END USE, 2019–2028 (USD MILLION) 132
      1. TABLE
    223. SOUTH AFRICA MULTI-LAYER CRYOGENIC INSULATION MARKET, BY END USE, 2019–2028
      1. (MILLION SQ. METERS) 132
    224. REST OF THE MIDDLE EAST & AFRICA MULTI-LAYER
    225. CRYOGENIC INSULATION MARKET, BY TYPE, 2019–2028 (USD MILLION) 133
      1. TABLE
    226. REST OF THE MIDDLE EAST & AFRICA MULTI-LAYER CRYOGENIC INSULATION MARKET,
      1. BY TYPE, 2019–2028
      2. (MILLION SQ. METERS) 133
    227. REST OF THE
    228. MIDDLE EAST & AFRICA MULTI-LAYER CRYOGENIC INSULATION MARKET, BY END USE, 2019–2028
      1. (USD MILLION) 134
    229. REST OF THE MIDDLE EAST & AFRICA MULTI-LAYER
    230. CRYOGENIC INSULATION MARKET, BY END USE, 2019–2028
      1. (MILLION SQ. METERS)
      2. 134
    231. KEY DEVELOPMENTS 136
    232. ARMACELL INTERNATIONAL HOLDING
      1. GMBHS: PRODUCTS OFFERED 139
    233. ARMACELL INTERNATIONAL HOLDING GMBH:
      1. KEY DEVELOPMENTS 140
    234. LYDALL INC.: PRODUCTS OFFERED 142
      1. TABLE
    235. CABOT CORPORATION: PRODUCTS OFFERED 145
    236. TECHNIFAB PRODUCTS: PRODUCTS
      1. OFFERED 147
    237. TECHNIFAB PRODUCTS: KEY DEVELOPMENTS 148
      1. TABLE 155
      2. OWENS CORNING: PRODUCTS OFFERED 151
    238. NICHIA CORPORATION: PRODUCT OFFERINGS
      1. 153
    239. DUNMORE: PRODUCT OFFERINGS 157
    240. ASPEN AEROGELS:
      1. PRODUCT OFFERINGS 160
    241. ASPEN AEROGELS: KEY DEVELOPMENTS 161
      1. TABLE
    242. ISOLATIE COMBINATIE BEVERWIJK B.V.: PRODUCT OFFERINGS 162
    243. ABHIJIT
      1. ENTERPRISES: PRODUCT OFFERINGS 164
    244. LIST OF FIGURES
      1. FIGURE
    245. MARKET SYNOPSIS 17
    246. MARKET ATTRACTIVENESS ANALYSIS: GLOBAL MULTI-LAYER
      1. CRYOGENIC INSULATION MARKET, 2020 18
    247. GLOBAL MULTI-LAYER CRYOGENIC
      1. INSULATION MARKET ANALYSIS BY TYPE 19
    248. GLOBAL MULTI-LAYER CRYOGENIC
      1. INSULATION MARKET ANALYSIS BY END USE 20
    249. GLOBAL MULTI-LAYER CRYOGENIC
      1. INSULATION MARKET ANALYSIS BY REGION 21
    250. GLOBAL MULTI-LAYER CRYOGENIC
      1. INSULATION MARKET: MARKET STRUCTURE 23
    251. RESEARCH PROCESS OF MRFR 24
    252. MARKET DYNAMICS OVERVIEW 30
    253. DRIVERS IMPACT ANALYSIS 33
    254. RESTRAINTS IMPACT ANALYSIS 34
    255. SUPPLY CHAIN ANALYSIS FOR
      1. GLOBAL MULTI-LAYER CRYOGENIC INSULATION MARKET 36
    256. PORTER'S FIVE FORCES
      1. ANALYSIS OF THE GLOBAL MULTI-LAYER CRYOGENIC INSULATION MARKET 40
      2. FIGURE 13
    257. GLOBAL MULTI-LAYER CRYOGENIC INSULATION MARKET, BY TYPE, 2019–2028 (USD MILLION)
      1. 49
    258. GLOBAL MULTI-LAYER CRYOGENIC INSULATION MARKET, BY TYPE, 2019–2028
      1. (MILLION SQ. METERS) 51
    259. GLOBAL MULTI-LAYER CRYOGENIC INSULATION MARKET,
      1. BY END USE, 2019–2028 (USD MILLION) 59
    260. GLOBAL MULTI-LAYER CRYOGENIC
    261. INSULATION MARKET, BY END USE, 2019–2028 (MILLION SQ. METERS) 61
      1. FIGURE
    262. GLOBAL MULTI-LAYER CRYOGENIC INSULATION MARKET BY REGION, 2019–2028 (USD
      1. MILLION) 70
    263. GLOBAL MULTI-LAYER CRYOGENIC INSULATION MARKET BY REGION,
    264. NORTH AMERICA MULTI-LAYER
    265. CRYOGENIC INSULATION MARKET, BY COUNTRY, 2020 (%SHARE) 73
    266. EUROPE
    267. MULTI-LAYER CRYOGENIC INSULATION MARKET, BY COUNTRY, 2020 (%SHARE) 81
      1. FIGURE
    268. ASIA-PACIFIC MULTI-LAYER CRYOGENIC INSULATION MARKET, BY COUNTRY, 2020 (%SHARE)
      1. 97
    269. LATIN AMERICA MULTI-LAYER CRYOGENIC INSULATION MARKET, BY COUNTRY,
    270. MIDDLE EAST & AFRICA MULTI-LAYER CRYOGENIC
    271. INSULATION MARKET, BY COUNTRY, 2020 (%SHARE) 125
    272. BENCHMARKING OF
      1. MAJOR COMPETITORS 137
    273. ARMACELL INTERNATIONAL HOLDING GMBH: FINANCIAL
      1. OVERVIEW SNAPSHOT 139
    274. ARMACELL INTERNATIONAL HOLDING GMBHS: SWOT
      1. ANALYSIS 140
    275. LYDALL INC.: FINANCIAL OVERVIEW SNAPSHOT 142
      1. FIGURE
    276. LYDALL INC.: SWOT ANALYSIS 143
    277. CABOT CORPORATION: FINANCIAL OVERVIEW
      1. SNAPSHOT 145
    278. CABOT CORPORATION: SWOT ANALYSIS 146
      1. FIGURE 31
      2. TECHNIFAB PRODUCTS: SWOT ANALYSIS 148
    279. OWENS CORNING: FINANCIAL OVERVIEW
      1. SNAPSHOT 150
    280. OWENS CORNING: SWOT ANALYSIS 151
    281. NICHIA
      1. CORPORATION: SWOT ANALYSIS 154
    282. DUNMORE: FINANCIAL OVERVIEW SNAPSHOT
      1. 156
    283. DUNMORE: SWOT ANALYSIS 158
    284. ASPEN AEROGELS: FINANCIAL
      1. OVERVIEW SNAPSHOT 160
    285. ASPEN AEROGELS: SWOT ANALYSIS 161
      1. FIGURE
    286. ISOLATIE COMBINATIE BEVERWIJK B.V.: SWOT ANALYSIS 163
    287. ABHIJIT
      1. ENTERPRISES: SWOT ANALYSIS 165

    Multi-Layer Cryogenic Insulation Market Segmentation

    Market Segmentation Overview

    • Detailed segmentation data will be available in the full report
    • Comprehensive analysis by multiple parameters
    • Regional and country-level breakdowns
    • Market size forecasts by segment
    Infographic

    Free Sample Request

    Kindly complete the form below to receive a free sample of this Report

    Get Free Sample

    Customer Strories

    “I am very pleased with how market segments have been defined in a relevant way for my purposes (such as "Portable Freezers & refrigerators" and "last-mile"). In general the report is well structured. Thanks very much for your efforts.”

    Victoria Milne

    Founder
    Case Study
    Chemicals and Materials