• Cat-intel
  • MedIntelliX
  • Resources
  • About Us
  • Request Free Sample ×

    Kindly complete the form below to receive a free sample of this Report

    Leading companies partner with us for data-driven Insights

    clients tt-cursor

    Molecular Modelling Market

    ID: MRFR/LS/2944-CR
    110 Pages
    Kinjoll Dey
    February 2021

    Molecular Modelling Market Research Report Information by Product (Software and Services), by Application (Drug Development, Drug Discovery, and Others), by End-user (Pharmaceutical & Biotechnology Companies, Research & Academic Centers), And By Region (North America, Europe, Asia-Pacific, And Rest Of The World) –Market Forecast Till 2032

    Share:
    Download PDF ×

    We do not share your information with anyone. However, we may send you emails based on your report interest from time to time. You may contact us at any time to opt-out.

    Molecular Modelling Market Research Report-Forecast till 2032 Infographic
    Purchase Options
    $ 4,950.0
    $ 5,950.0
    $ 7,250.0
    Table of Contents

    Molecular Modelling Market Summary

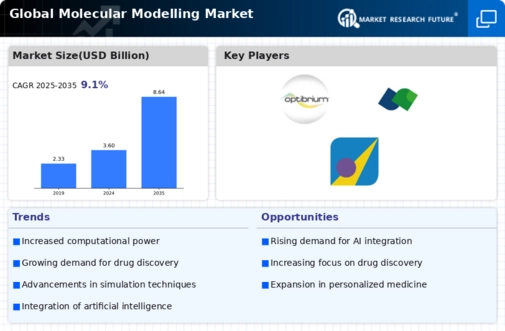
    As per Market Research Future Analysis, the Global Molecular Modelling Market was valued at USD 3.3 billion in 2023 and is projected to reach USD 6.65 billion by 2032, growing at a CAGR of 9.10% from 2023 to 2032. The market is driven by increasing investments in R&D from biotech and pharmaceutical sectors, with a focus on enhancing medication efficacy. Notable advancements include Sandbox AQ's AQBioSim platform and Huawei's AI-assisted drug design, which significantly reduce R&D costs and time. The rising prevalence of chronic diseases and the growing elderly population further fuel market demand.

    Key Market Trends & Highlights

    Key trends driving the Molecular Modelling Market include advancements in technology and increasing demand for effective drug development.

    • Molecular Modelling market projected to grow from USD 3.6 billion in 2024 to USD 6.65 billion by 2032.
    • Software segment accounted for 51% of market revenue (USD 2.60 billion) in 2022.
    • Drug Development application generated the highest revenue of about 56% (USD 2.9 billion) in 2022.
    • Pharmaceutical & Biotechnology companies dominated the market with 74% share (USD 3.8 billion) in 2022.

    Market Size & Forecast

    2023 Market Size USD 3.3 Billion
    2032 Market Size USD 6.65 Billion
    CAGR 9.10%

    Major Players

    Key players include Cresset Acellera Ltd, Schrodinger LLC, Optibrium, Biosolve-IT, Simulations Plus Inc, Chemical Computing Group, Centera LP, OpenEye Scientific Software, Dassault Systems, and Cambridge Crystallographic Data Centre.

    Molecular Modelling Market Trends

    Growing use in medication efficacy is driving the market growth

    The rising use of medication efficacy drives market CAGR for Molecular Modelling. Researchers and scientists are increasingly employing molecular modeling tools to evaluate therapeutic effectiveness. They believe this is a more cost-effective and safer method of bringing novel medications to the market sooner. Another reason supporting development in the molecular modeling sector is that an increasing number of individuals worldwide struggle with persistent long-term diseases. Only potent and effective pharmaceutical medications can adequately cure them. This has been a primary driver for development in the molecular modeling sector in the past few years.

    Additionally, the worldwide molecular modeling sector has a rapid growth rate attracting organizations in the pharmaceutical and biotech industries to invest extensively in R&D. As a result, an entirely novel class of potent pharmaceuticals has emerged that is far more efficient than their counterparts and can command greater costs. The growing elderly population, more public knowledge of illnesses and treatments, increased research and development efforts, improved healthcare infrastructure, and increased healthcare expenditure all favorably impact the molecular modeling industry.

    COVID-19 has a negative impact as certain individuals who got it must be hospitalized, and only a small fraction died. Furthermore, because the antibodies were brief, people who healed from it may contract it again. They may also have long-term negative effects, such as diabetes and severe damage to the brain. COVID-19 has to be stated and governments realized. That is why lockdowns and quarantines were instituted. This was rather successful. However, the virus had a significant impact on numerous businesses. The worldwide marketplace for molecular modeling was no exception.

    The molecular modeling industry is predicted to increase rapidly in the next years. Many companies needed help to obtain the ingredients and programmers required to create molecular modeling software.   

    The ongoing advancements in computational techniques and increased demand for drug discovery are likely to propel the growth of the molecular modelling market, as it plays a crucial role in understanding complex biological interactions.

    U.S. National Institutes of Health

    Molecular Modelling Market Drivers

    Rising Demand for Drug Discovery

    The Global Global Molecular Modelling Market Industry experiences heightened demand driven by the pharmaceutical sector's need for innovative drug discovery methods. As the industry evolves, molecular modelling techniques facilitate the identification and optimization of drug candidates, significantly reducing time and costs associated with traditional methods. In 2024, the market is valued at 3.6 USD Billion, reflecting the increasing reliance on computational approaches to streamline research and development processes. This trend is expected to continue, with projections indicating a market growth to 8.64 USD Billion by 2035, suggesting a robust compound annual growth rate of 8.28% from 2025 to 2035.

    Market Segment Insights

    Molecular Modelling Product Insights

    Based on Product, the  Molecular Modelling market segmentation includes Software and Services. The software category dominated the market, accounting for 51% of market revenue (USD 2.60 Billion) in 2022. Instead of testing treatments on laboratory animals, these corporations may utilize molecular modeling software to determine whether these drugs interact with one another and with the bodies of humans.

    Molecular Modelling Application Insights

    The  Molecular Modelling market segmentation, based on Applications, includes Drug Development, Drug Discovery, and Others. The drug development category generated the highest market revenue of about 56% (USD 2.9 billion) in 2022. Because the average cost of developing new medicine molecules and the period required to progress technological advances are so high, most pharmaceutical firms utilize molecular modeling techniques to create new pharmaceuticals, resulting in industry growth.

    Molecular Modelling End-user Insights

    Based on End-user, the  Molecular Modelling market segmentation includes Pharmaceutical & Biotechnology Companies, Research & Academic Centers. Pharmaceutical & biotechnology companies dominated the market, accounting for 74% of market revenue (USD 3.8 Billion) in 2022. The usage of molecular modeling by biotechnology and pharmaceutical firms is increasing due to increased R&D activities in the development and discovery of drugs.

    Figure 1  Molecular Modelling Market, by End-user, 2022 & 2032 (USD Billion)

    Source Secondary Research, Primary Research, MRFR Database, and Analyst Review

    News

    ASU researchers can create streaming technologies for simulations of molecules thanks to NSF funding, and they can also create a software platform that makes it easier to analyze simulated molecular events with a range of time resolutions. Molecular simulations are becoming a more potent tool for studying chemical, biochemical, and biological processes in atomic-level detail due to advancements in computer hardware. The complicated movements of millions of atoms in complex systems are modeled by all-atom molecular dynamics simulations, which also provide microscopic interpretations for measurements from experiments.

    Get more detailed insights about Molecular Modelling Market Research Report-Forecast till 2032

    Regional Insights

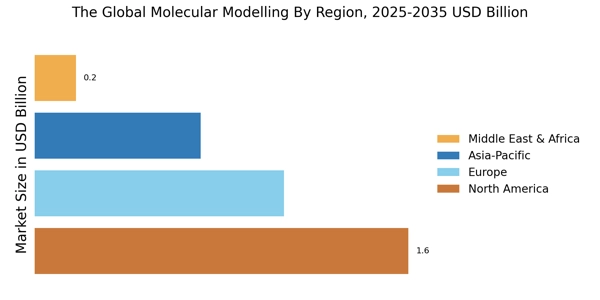
    By region, the research provides market insights into North America, Europe, Asia-Pacific, and the Rest of the World. The North American Molecular Modelling market area will dominate this market during the projected timeframe, owing to famous universities and educational organizations advocating freedom of access for scientists conducting research, which will boost the market growth in North America.

    Furthermore, the major countries studied in the market report are the US, Canada, German, France, the UK, Italy, Spain, China, Japan, India, Australia, South Korea, and Brazil.

    Figure 2  Molecular Modelling Market Share by Region 2022 (USD Billion)Molecular Modelling Market Share by Region

    Source Secondary Research, Primary Research, MRFR Database, and Analyst Review

    Europe region’s Molecular Modelling market accounts for the second-highest market share due to the Additional clinical trials for the investigation of amino acid structures, Biotech & Pharmaceuticals, and biological computation that have been conducted, which will boost market demand. Further, the German Molecular Modelling market holds the largest market share, and the UK Molecular Modelling market is expected to grow and expand significantly in the European region during the projected timeframe.

    The Asia-Pacific Molecular Modelling Market is expected to grow quickly during the projected timeframe. This is due to increasing disposable money, growth in research contract firms, advancements in healthcare infrastructure, and a rise in academic institutes. Moreover, China’s Molecular Modelling market dominates the market share, and the Indian Molecular Modelling market is expected to expand and grow steadily in the Asia-Pacific region during the projected timeframe.

    Key Players and Competitive Insights

    Leading market players invested heavily in research and Development (R&D) to scale up their manufacturing units and develop technologically advanced solutions, which will help the Molecular Modelling market grow worldwide. Market participants are also undertaking various organic or inorganic strategic approaches to strengthen and expand their  footprint, with significant market developments including new product portfolios, contractual deals, mergers and acquisitions, capital expenditure, higher investments, and strategic alliances with other organizations. Businesses are also coming up with marketing strategies such as digital marketing, social media influencing, and content marketing to increase their scope of profit earnings.

    The Molecular Modelling industry must offer cost-effective and sustainable options to survive in a highly fragmented and dynamic market climate.

    Manufacturing locally to minimize operational expenses and offer aftermarket services to customers is one of the critical business strategies organizations use in the  Molecular Modelling industry to benefit customers and capture untapped market share and revenue. The Molecular Modelling industry has recently offered significant advantages to the Life Sciences industry. Moreover, more industry participants are utilizing and adopting cutting-edge Technology has grown substantially.

    Major players in the Molecular Modelling market, including Cresset Acellera Ltd, Schrodinger LLC (Germany), Optibrium (United Kingdom), Biosolve-IT (Germany), Simulations Plus Inc (USA), Chemical computing group (Canada), Centera LP, OpenEye Scientific Software (USA), Dassault Systems (USA), and Cambridge Crystallographic Data Centre (United Kingdom), are attempting to expand market share and demand by investing in R&D operations to produce sustainable and affordable solutions.

    Cadence is a key innovator in electrical system development, with over 30 years of software development experience. SDA Technologies and ECAD, Inc. merged to form it in 1988, headquartered in San Jose, California. It is a renowned EDA and Smart System Design company offering software, hardware, and intellectual property (IP) for electrical design. Cadence Design Systems purchased OpenEye Scientific Software in July 2022 to capitalize on Cadence's analytical software competencies in molecular modeling and prediction.

    PerkinElmer, Inc. provides testing, nourishment, ecological, life sciences, and industrial sectors with goods, services, and solutions. Richard S. Perkins & Charles Elmer formed the corporation on April 19, 1937, and it has its headquarters in Waltham, Massachusetts. It works in two divisions Discovery and Analytic Solutions and Diagnostics. It manufactured analytical equipment, genetic screening and diagnostic devices, imaging equipment parts, software, and supplies for various end markets. PerkinElmer released ChemDraw V21 technology in March 2022, allowing academics to quickly develop scientifically sophisticated MS PowerPoint presentations with a single click.

    Key Companies in the Molecular Modelling Market market include

    Industry Developments

    July 2022 Cadence Design Systems purchased OpenEye Scientific Software in July 2022 to capitalize on Cadence's analytical software competencies in molecular modeling and prediction.

    March 2022 PerkinElmer released ChemDraw V21 technology in March 2022, allowing academics to quickly develop scientifically sophisticated MS PowerPoint presentations with a single click.

    April 2021 Accelera Ltd released a new edition of its chemical dynamics modeling program, ACEMD, in April 2021.

    Future Outlook

    Molecular Modelling Market Future Outlook

    The Global Molecular Modelling Market is poised for growth at 8.28% CAGR from 2024 to 2035, driven by advancements in computational technologies and increasing demand in drug discovery.

    New opportunities lie in:

    • Invest in AI-driven molecular simulation tools to enhance predictive accuracy.
    • Develop cloud-based platforms for collaborative molecular modelling solutions.
    • Focus on partnerships with pharmaceutical companies for tailored modelling services.

    By 2035, the market is expected to achieve substantial growth, reflecting its critical role in scientific innovation.

    Market Segmentation

    Molecular Modelling Product Outlook

    • Software
    • Services

    Molecular Modelling End-User Outlook

    • Pharmaceutical & Biotechnology Companies
    • Research & Academic Centers

    Molecular Modelling Regional Outlook

    North America
    • US
    • Canada

    Molecular Modelling Application Outlook

    • Drug Development
    • Drug Discovery
    • Others

    Report Scope

    Molecular Modelling Report Scope

    Attribute/Metric Details
    Market Size 2023 USD 3.3 Billion
    Market Size 2024 USD 3.60 Billion
    Market Size 2032 USD 6.64 Billion
    Compound Annual Growth Rate (CAGR) 9.1% (2023-2032)
    Base Year 2022
    Market Forecast Period 2023-2032
    Historical Data 2018- 2022
    Market Forecast Units Value (USD Billion)
    Report Coverage Revenue Forecast, Market Competitive Landscape, Growth Factors, and Trends
    Segments Covered Product, Application, End-Use, and Region
    Geographies Covered North America, Europe, Asia Pacific, and the Rest of the World
    Countries Covered The US, Canada, German, France, UK, Italy, Spain, China, Japan, India, Australia, South Korea, and Brazil
    Key Companies Profiled  Cresset Acellera Ltd, Schrodinger LLC (Germany), Optibrium (United Kingdom), Biosolve-IT (Germany), Simulations Plus Inc (USA), Chemical computing group (Canada), Centera LP, OpenEye Scientific Software (USA), Dassault Systems (USA), and Cambridge Crystallographic Data Centre (United Kingdom)
    Key Market Opportunities The rapidly increasing CAGR of this market is attracting organizations in the biotech and pharmaceutical sectors to invest extensively in development and research.
    Key Market Dynamics Researchers and scientists use molecular modeling software to examine the efficacy of medications. As it is a cost-effective and less hazardous method of bringing novel medicines to market sooner

    Market Highlights

    Author
    Kinjoll Dey
    Research Analyst Level I

    He is an extremely curious individual currently working in Healthcare and Medical Devices Domain. Kinjoll is comfortably versed in data centric research backed by healthcare educational background. He leverages extensive data mining and analytics tools such as Primary and Secondary Research, Statistical Analysis, Machine Learning, Data Modelling. His key role also involves Technical Sales Support, Client Interaction and Project management within the Healthcare team. Lastly, he showcases extensive affinity towards learning new skills and remain fascinated in implementing them.

    Leave a Comment

    FAQs

    How much is the Molecular Modelling market?

    The  Molecular Modelling market size was valued at USD 3.3 Billion in 2023.

    What is the growth rate of the Molecular Modelling market?

    The  market is projected to grow at a CAGR of 9.1% during the forecast period, 2023-2032.

    Which region holds the largest market share in the Molecular Modelling market?

    North America had the largest share of the  market

    Who are the key players in the Molecular Modelling market?

    The key players in the market are Cresset Acellera Ltd, Schrodinger LLC (Germany), Optibrium (United Kingdom), Biosolve-IT (Germany), Simulations Plus Inc (USA), Chemical computing group (Canada), Centera LP, OpenEye Scientific Software (USA), Dassault Systems (USA), and Cambridge Crystallographic Data Centre (United Kingdom).

    Which Product led the Molecular Modelling market?

    The Software category dominated the market in 2022.

    Which Application has the largest market share in the Molecular Modelling market?

    Drug Development had the largest share of the market.

    1. Report Prologue
    2. Market Introduction
    3. Definition 15
      1. Scope Of The Study 15
      2. List Of Assumptions
      3. Market Structure 17
    4. Research Methodology
      1. Research Process 19
      2. Primary Research 20
      3. Secondary
    5. Research 21
      1. Market Size Estimation 21
      2. Forecast Model
    6. Market Dynamics
      1. Introduction 24
      2. Drivers
        1. Increasing Prevalence Of Various Chronic Diseases Leading To
    7. Drug Development 24
      1. Technological Advancements In Drug Design 24
        1. Increasing Investments In Research & Development By Pharmaceutical
    8. And Biotechnology Companies 24
      1. Restraints 25
        1. Higher
    9. Cost Of Molecular Modelling Software 25
      1. Lack Of Skilled Healthcare
    10. IT Professionals In Low And Middle-Income Economies 25
      1. Opportunities
        1. Introduction Of Molecular Modelling Software And Services In
    11. Developing Economies 25
    12. Market Factor Analysis
      1. Porter’s
    13. Five Forces Model 27
      1. Threat Of New Entrants 28
    14. Bargaining Power Of Suppliers 28
      1. Bargaining Power Of Buyers 28
        1. Threat Of Substitutes 28
        2. Intensity Of Rivalry 28
      2. Value Chain Analysis 29
        1. Inputs 30
    15. Software Development Processes 30
      1. Output 30
        1. Marketing
    16. And Distribution 30
      1. Post-Selling Services 30
      2. Investment
    17. Opportunity Analysis 30
      1. Price Analysis 31
    18. Global Molecular
    19. Modelling Market By Product
      1. Introduction 33
      2. Software
      3. Services 35
    20. Global Molecular Modelling Market By
    21. Application
      1. Introduction 37
      2. Drug Development 38
      3. Drug Discovery 39
      4. Others 39
    22. Global Molecular
    23. Modelling Market By End User
      1. Introduction 41
      2. Pharmaceutical
    24. & Biotechnology Companies 42
      1. Research & Academic Centers
      2. Others 43
    25. Global Molecular Modelling Market By Region
      1. Introduction 45
      2. Americas 46
        1. North America
        2. South
    26. America 52
      1. Europe 54
        1. Western Europe 56
    27. Europe 64
      1. Eastern Europe 66
      2. Asia Pacific 68
        1. Japan 70
        2. China 71
        3. India 72
    28. Australia 74
      1. South Korea 75
        1. Rest Of Asia Pacific
      2. Middle East & Africa 78
        1. Middle East 80
        2. Africa 81
    29. Competitive Landscape
      1. Introduction
      2. Company Ranking 84
    30. Company Profiles
    31. Simulations Plus, Inc. 86
      1. Company Overview 86
    32. Financial Overview 86
      1. Products Offering 87
        1. Key
    33. Developments 87
      1. SWOT Analysis 87
        1. Key Strategy
      2. Cambridge Crystallographic Data Centre 88
        1. Company
    34. Overview 88
      1. Financial Overview 88
        1. Products Offering
        2. Key Developments 88
        3. SWOT Analysis 88
        4. Key Strategy 88
      2. Optibrium 89
        1. Company
    35. Overview 89
      1. Financial Overview 89
        1. Products Offering
        2. Key Developments 89
        3. SWOT Analysis 89
        4. Key Strategy 90
      2. Cresset 91
        1. Company Overview
        2. Financial Overview 91
        3. Products Offering 91
        4. Key Developments 91
        5. SWOT Analysis 92
    36. Key Strategy 92
      1. BioSolveIT GmbH 93
        1. Company Overview
        2. Financial Overview 93
        3. Products Offering 93
        4. Key Developments 93
        5. SWOT Analysis 93
    37. Key Strategy 94
      1. OpenEye Scientific Software 95
    38. Company Overview 95
      1. Financial Overview 95
        1. Products
    39. Offering 95
      1. Key Developments 95
        1. SWOT Analysis
        2. Key Strategy 96
      2. Chemical Computing Group 97
        1. Company Overview 97
        2. Financial Overview 97
        3. Products Offering 97
        4. Key Developments 97
    40. SWOT Analysis 97
      1. Key Strategy 98
      2. Acellera Ltd.
        1. Company Overview 99
        2. Financial Overview 99
        3. Products Offering 99
        4. Key Developments 99
        5. SWOT Analysis 99
        6. Key Strategy 100
      3. Dassault
    41. Systèmes 101
      1. Company Overview 101
        1. Financial
    42. Overview 101
      1. Products Offering 102
        1. Key Developments
        2. SWOT Analysis 102
        3. Key Strategy 102
      2. Schrödinger, LLC 103
        1. Company Overview 103
        2. Financial Overview 103
        3. Products Offering 103
        4. Key Developments 103
        5. SWOT Analysis 104
    43. Key Strategy 104
      1. Certara, L.P 105
        1. Company Overview
        2. Financial Overview 105
        3. Products Offering
        4. Key Developments 105
        5. SWOT Analysis 106
        6. Key Strategy 106
    44. Appendix
      1. Discussion
    45. Blue Print 108
    46. List Of Tables
    47. 2032 (USD MILLION) 33
    48. FOR SOFTWARE BY REGION, 2023-2032 (USD MILLION) 34
    49. MODELLING MARKET FOR SERVICES BY REGION, 2023-2032 (USD MILLION) 35
    50. GLOBAL MOLECULAR MODELLING MARKET BY APPLICATION, 2023-2032 (USD MILLION) 37
    51. 2032 (USD MILLION) 38
    52. FOR DRUG DISCOVERY BY REGION, 2023-2032 (USD MILLION) 39
    53. MOLECULAR MODELLING MARKET FOR DRUG DISCOVERY BY TYPE, 2023-2032 (USD MILLION) 39
    54. BIOTECHNOLOGY BY REGION, 2023-2032 (USD MILLION) 42
    55. MODELLING MARKET FOR RESEARCH & ACADEMIC CENTERS BY REGION, 2023-2032 (USD MILLION)
    56. MILLION) 45
    57. (USD MILLION) 46
    58. 2032 (USD MILLION) 46
    59. BY APPLICATION, 2023-2032 (USD MILLION) 47
    60. MODELLING MARKET FOR DRUG DISCOVERY BY TYPE, 2023-2032 (USD MILLION) 47
    61. (USD MILLION) 48
    62. PRODUCT, 2023-2032 (USD MILLION) 48
    63. MODELLING MARKET BY APPLICATION, 2023-2032 (USD MILLION) 49
    64. NORTH AMERICA MOLECULAR MODELLING MARKET FOR DRUG DISCOVERY BY TYPE, 2023-2032 (USD
    65. MILLION) 49
    66. USER, 2023-2032 (USD MILLION) 49
    67. BY PRODUCT, 2023-2032 (USD MILLION) 50
    68. MARKET BY APPLICATION, 2023-2032 (USD MILLION) 50
    69. MODELLING MARKET FOR DRUG DISCOVERY BY TYPE, 2023-2032 (USD MILLION) 50
    70. (USD MILLION) 51
    71. DISCOVERY BY TYPE, 2023-2032 (USD MILLION) 52
    72. MODELLING MARKET BY END USER, 2023-2032 (USD MILLION) 52
    73. AMERICA MOLECULAR MODELLING MARKET BY PRODUCT, 2023-2032 (USD MILLION) 52
    74. MILLION) 53
    75. DISCOVERY BY TYPE, 2023-2032 (USD MILLION) 53
    76. MOLECULAR MODELLING MARKET BY END USER, 2023-2032 (USD MILLION) 53
    77. EUROPE MOLECULAR MODELLING MARKET BY REGION, 2023-2032 (USD MILLION) 54
    78. (USD MILLION) 55
    79. DISCOVERY BY TYPE, 2023-2032 (USD MILLION) 55
    80. MODELLING MARKET BY END USER, 2023-2032 (USD MILLION) 55
    81. EUROPE MOLECULAR MODELLING MARKET BY COUNTRY, 2023-2032 (USD MILLION) 56
    82. MILLION) 56
    83. 2032 (USD MILLION) 57
    84. MARKET FOR DRUG DISCOVERY BY TYPE, 2023-2032 (USD MILLION) 57
    85. WESTERN EUROPE MOLECULAR MODELLING MARKET BY END USER, 2023-2032 (USD MILLION) 57
    86. (USD MILLION) 58
    87. DISCOVERY BY TYPE, 2023-2032 (USD MILLION) 58
    88. MODELLING MARKET BY END USER, 2023-2032 (USD MILLION) 59
    89. MOLECULAR MODELLING MARKET BY PRODUCT, 2023-2032 (USD MILLION) 59
    90. FRANCE MOLECULAR MODELLING MARKET BY APPLICATION, 2023-2032 (USD MILLION) 59
    91. (USD MILLION) 60
    92. 2032 (USD MILLION) 60
    93. PRODUCT, 2023-2032 (USD MILLION) 60
    94. MARKET BY APPLICATION, 2023-2032 (USD MILLION) 61
    95. MODELLING MARKET FOR DRUG DISCOVERY BY TYPE, 2023-2032 (USD MILLION) 61
    96. (USD MILLION) 62
    97. BY TYPE, 2023-2032 (USD MILLION) 62
    98. MARKET BY END USER, 2023-2032 (USD MILLION) 63
    99. MODELLING MARKET BY PRODUCT, 2023-2032 (USD MILLION) 63
    100. MOLECULAR MODELLING MARKET BY APPLICATION, 2023-2032 (USD MILLION) 63
    101. SPAIN MOLECULAR MODELLING MARKET FOR DRUG DISCOVERY BY TYPE, 2023-2032 (USD MILLION)
    102. MILLION) 64
    103. BY PRODUCT, 2023-2032 (USD MILLION) 64
    104. MOLECULAR MODELLING MARKET BY APPLICATION, 2023-2032 (USD MILLION) 65
    105. REST OF WESTERN EUROPE MOLECULAR MODELLING MARKET FOR DRUG DISCOVERY BY TYPE,
    106. 2032 (USD MILLION) 65
    107. MODELLING MARKET BY END USER, 2023-2032 (USD MILLION) 65
    108. EUROPE MOLECULAR MODELLING MARKET BY PRODUCT, 2023-2032 (USD MILLION) 66
    109. MILLION) 66
    110. DISCOVERY BY TYPE, 2023-2032 (USD MILLION) 66
    111. MOLECULAR MODELLING MARKET BY END USER, 2023-2032 (USD MILLION) 67
    112. ASIA PACIFIC MOLECULAR MODELLING MARKET BY COUNTRY, 2023-2032 (USD MILLION) 68
    113. MILLION) 68
    114. 2032 (USD MILLION) 69
    115. MARKET FOR DRUG DISCOVERY BY TYPE, 2023-2032 (USD MILLION) 69
    116. ASIA PACIFIC MOLECULAR MODELLING MARKET BY END USER, 2023-2032 (USD MILLION) 69
    117. (USD MILLION) 70
    118. BY TYPE, 2023-2032 (USD MILLION) 70
    119. MARKET BY END USER, 2023-2032 (USD MILLION) 71
    120. MODELLING MARKET BY PRODUCT, 2023-2032 (USD MILLION) 71
    121. MOLECULAR MODELLING MARKET BY APPLICATION, 2023-2032 (USD MILLION) 71
    122. CHINA MOLECULAR MODELLING MARKET FOR DRUG DISCOVERY BY TYPE, 2023-2032 (USD MILLION)
    123. MILLION) 72
    124. (USD MILLION) 72
    125. 2032 (USD MILLION) 73
    126. FOR DRUG DISCOVERY BY TYPE, 2023-2032 (USD MILLION) 73
    127. MOLECULAR MODELLING MARKET BY END USER, 2023-2032 (USD MILLION) 73
    128. AUSTRALIA MOLECULAR MODELLING MARKET BY PRODUCT, 2023-2032 (USD MILLION) 74
    129. (USD MILLION) 74
    130. DISCOVERY BY TYPE, 2023-2032 (USD MILLION) 74
    131. MODELLING MARKET BY END USER, 2023-2032 (USD MILLION) 75
    132. KOREA MOLECULAR MODELLING MARKET BY PRODUCT, 2023-2032 (USD MILLION) 75
    133. MILLION) 75
    134. DISCOVERY BY TYPE, 2023-2032 (USD MILLION) 76
    135. MODELLING MARKET BY END USER, 2023-2032 (USD MILLION) 76
    136. OF ASIA PACIFIC MOLECULAR MODELLING MARKET BY PRODUCT, 2023-2032 (USD MILLION) 76
    137. 2032 (USD MILLION) 77
    138. MARKET FOR DRUG DISCOVERY BY TYPE, 2023-2032 (USD MILLION) 77
    139. REST OF ASIA PACIFIC MOLECULAR MODELLING MARKET BY END USER, 2023-2032 (USD MILLION)
    140. 2032 (USD MILLION) 78
    141. MODELLING MARKET BY PRODUCT, 2023-2032 (USD MILLION) 78
    142. EAST & AFRICA MOLECULAR MODELLING MARKET BY APPLICATION, 2023-2032 (USD MILLION)
    143. DRUG DISCOVERY BY TYPE, 2023-2032 (USD MILLION) 79
    144. & AFRICA MOLECULAR MODELLING MARKET BY END USER, 2023-2032 (USD MILLION) 79
    145. MILLION) 80
    146. 2032 (USD MILLION) 80
    147. MARKET FOR DRUG DISCOVERY BY TYPE, 2023-2032 (USD MILLION) 80
    148. MIDDLE EAST MOLECULAR MODELLING MARKET BY END USER, 2023-2032 (USD MILLION) 81
    149. (USD MILLION) 81
    150. DISCOVERY BY TYPE, 2023-2032 (USD MILLION) 82
    151. MODELLING MARKET BY END USER, 2023-2032 (USD MILLION) 82
    152. List Of Figures
    153. STRUCTURE 17
    154. TOP DOWN & BOTTOM-UP APPROACH 22
    155. OF THE GLOBAL MOLECULAR MODELLING MARKET 27
    156. MODELLING MARKET 29
    157. 2032 (USD MILLION) 33
    158. BY APPLICATION, 2023-2032 (USD MILLION) 37
    159. MODELLING MARKET BY END USER, 2023-2032 (USD MILLION) 41
    160. MOLECULAR MODELLING MARKET BY REGION, 2023-2032 (USD MILLION) 45
    161. AMERICAS MOLECULAR MODELLING MARKET SHARE BY REGION, 2020 (%) 46
    162. NORTH AMERICA MOLECULAR MODELLING MARKET SHARE BY COUNTRY, 2020 (%) 48
    163. SHARE BY REGION, 2020 (%) 78

    Molecular Modelling Market Segmentation

    Molecular Modelling Product Outlook (USD Billion, 2018-2032)

    • Software
    • Services

    Molecular Modelling Application Outlook (USD Billion, 2018-2032)

    • Drug Development
    • Drug Discovery
    • Others

    Molecular Modelling End-User Outlook (USD Billion, 2018-2032)

    • Pharmaceutical & Biotechnology Companies
    • Research & Academic Centers

    Molecular Modelling Regional Outlook (USD Billion, 2018-2032)

    • North America Outlook (USD Billion, 2018-2032)

      • North America Molecular Modelling by Product
        • Software
        • Services
      • North America Molecular Modelling by Application
        • Drug Development
        • Drug Discovery
        • Others
      • North America Molecular Modelling by End-User
        • Pharmaceutical & Biotechnology Companies
        • Research & Academic Centers
      • US Outlook (USD Billion, 2018-2032)

      • US Molecular Modelling by Product
        • Software
        • Services
      • US Molecular Modelling by Application
        • Drug Development
        • Drug Discovery
        • Others
      • US Molecular Modelling by End-User
        • Pharmaceutical & Biotechnology Companies
        • Research & Academic Centers
      • Canada Outlook (USD Billion, 2018-2032)

      • Canada Molecular Modelling by Product
        • Software
        • Services
      • Canada Molecular Modelling by Application
        • Drug Development
        • Drug Discovery
        • Others
      • Canada Molecular Modelling by End-User
        • Pharmaceutical & Biotechnology Companies
        • Research & Academic Centers
    • Europe Outlook (USD Billion, 2018-2032)

      • Europe Molecular Modelling by Product
        • Software
        • Services
      • Europe Molecular Modelling by Application
        • Drug Development
        • Drug Discovery
        • Others
      • Europe Molecular Modelling by End-User
        • Pharmaceutical & Biotechnology Companies
        • Research & Academic Centers
      • Germany Outlook (USD Billion, 2018-2032)

      • Germany Molecular Modelling by Product
        • Software
        • Services
      • Germany Molecular Modelling by Application
        • Drug Development
        • Drug Discovery
        • Others
      • Germany Molecular Modelling by End-User
        • Pharmaceutical & Biotechnology Companies
        • Research & Academic Centers
      • France Outlook (USD Billion, 2018-2032)

      • France Molecular Modelling by Product
        • Software
        • Services
      • France Molecular Modelling by Application
        • Drug Development
        • Drug Discovery
        • Others
      • France Molecular Modelling by End-User
        • Pharmaceutical & Biotechnology Companies
        • Research & Academic Centers
        • UK Outlook (USD Billion, 2018-2032)

      • UK Molecular Modelling by Product
        • Software
        • Services
      • UK Molecular Modelling by Application
        • Drug Development
        • Drug Discovery
        • Others
      • UK Molecular Modelling by End-User
        • Pharmaceutical & Biotechnology Companies
        • Research & Academic Centers
      • Italy Outlook (USD Billion, 2018-2032)

      • Italy Molecular Modelling by Product
        • Software
        • Services
      • Italy Molecular Modelling by Application
        • Drug Development
        • Drug Discovery
        • Others
      • Italy Molecular Modelling by End-User
        • Pharmaceutical & Biotechnology Companies
        • Research & Academic Centers
      • Spain Outlook (USD Billion, 2018-2032)

      • Spain Molecular Modelling by Product
        • Software
        • Services
      • Spain Molecular Modelling by Application
        • Drug Development
        • Drug Discovery
        • Others
      • Spain Molecular Modelling by End-User

        • Pharmaceutical & Biotechnology Companies
        • Research & Academic Centers
      • Rest Of Europe Outlook (USD Billion, 2018-2032)

      • Rest Of Europe Molecular Modelling by Product
        • Software
        • Services
      • Rest Of Europe Molecular Modelling by Application
        • Drug Development
        • Drug Discovery
        • Others
      • Rest Of Europe Molecular Modelling by End-User
        • Pharmaceutical & Biotechnology Companies
        • Research & Academic Centers
    • Asia-Pacific Outlook (USD Billion, 2018-2032)

      • Asia-Pacific Molecular Modelling by Product
        • Food
        • Beverages
        • Supplements
      • Asia-Pacific Molecular Modelling by Application
        • Drug Development
        • Drug Discovery
        • Others
      • Asia-Pacific Molecular Modelling by End-User
        • Pharmaceutical & Biotechnology Companies
        • Research & Academic Centers
      • China Outlook (USD Billion, 2018-2032)

      • China Molecular Modelling by Product
        • Software
        • Services
      • China Molecular Modelling by Application
        • Drug Development
        • Drug Discovery
        • Others
      • China Molecular Modelling by End-User
        • Pharmaceutical & Biotechnology Companies
        • Research & Academic Centers
      • Japan Outlook (USD Billion, 2018-2032)

      • Japan Molecular Modelling by Product
        • Software
        • Services
      • Japan Molecular Modelling by Application
        • Drug Development
        • Drug Discovery
        • Others
      • Japan Molecular Modelling by End-User
        • Pharmaceutical & Biotechnology Companies
        • Research & Academic Centers
      • India Outlook (USD Billion, 2018-2032)

      • India Molecular Modelling by Product
        • Software
        • Services
      • India Molecular Modelling by Application
        • Drug Development
        • Drug Discovery
        • Others
      • India Molecular Modelling by End-User
        • Pharmaceutical & Biotechnology Companies
        • Research & Academic Centers
      • Australia Outlook (USD Billion, 2018-2032)

      • Australia Molecular Modelling by Product
        • Software
        • Services
      • Australia Molecular Modelling by Application
        • Drug Development
        • Drug Discovery
        • Others
      • Australia Molecular Modelling by End-User
        • Pharmaceutical & Biotechnology Companies
        • Research & Academic Centers
      • Rest of Asia-Pacific Outlook (USD Billion, 2018-2032)

      • Rest of Asia-Pacific Molecular Modelling by Product
        • Software
        • Services
      • Rest of Asia-Pacific Molecular Modelling by Application
        • Drug Development
        • Drug Discovery
        • Others
      • Rest of Asia-Pacific Molecular Modelling by End-User
        • Pharmaceutical & Biotechnology Companies
        • Research & Academic Centers
    • Rest of the World Outlook (USD Billion, 2018-2032)

      • Rest of the World Molecular Modelling by Product
        • Software
        • Services
      • Rest of the World Molecular Modelling by Application
        • Drug Development
        • Drug Discovery
        • Others
      • Rest of the World Molecular Modelling by End-User
        • Pharmaceutical & Biotechnology Companies
        • Research & Academic Centers
      • Middle East Outlook (USD Billion, 2018-2032)

      • Middle East Molecular Modelling by Product
        • Software
        • Services
      • Middle East Molecular Modelling by Application
        • Drug Development
        • Drug Discovery
        • Others
      • Middle East Molecular Modelling by End-User
        • Pharmaceutical & Biotechnology Companies
        • Research & Academic Centers
      • Africa Outlook (USD Billion, 2018-2032)

      • Africa Molecular Modelling by Product
        • Software
        • Services
      • Africa Molecular Modelling by Application
        • Drug Development
        • Drug Discovery
        • Others
      • Africa Molecular Modelling by End-User
        • Pharmaceutical & Biotechnology Companies
        • Research & Academic Centers
      • Latin America Outlook (USD Billion, 2018-2032)

      • Latin America Molecular Modelling by Product
        • Software
        • Services
      • Latin America Molecular Modelling by Application
        • Drug Development
        • Drug Discovery
        • Others
      • Latin America Molecular Modelling by End-User
        • Pharmaceutical & Biotechnology Companies
        • Research & Academic Centers
    Molecular Modelling Market Research Report-Forecast till 2032 Infographic
    Free Sample Request

    Kindly complete the form below to receive a free sample of this Report

    Customer Strories

    “I am very pleased with how market segments have been defined in a relevant way for my purposes (such as "Portable Freezers & refrigerators" and "last-mile"). In general the report is well structured. Thanks very much for your efforts.”

    Victoria Milne Founder
    Case Study

    Chemicals and Materials