• Cat-intel
  • MedIntelliX
  • Resources
  • About Us
  • Hero Background
    English
    Chinese
    French
    Japanese
    Korean
    German
    Spanish

    Low Carbon Hydrogen Market Size

    ID: MRFR/CnM/14615-HCR
    200 Pages
    Chitranshi Jaiswal
    October 2025

    Low Carbon Hydrogen Market Research Report By Process (Steam Methane Reforming (SMR), Autothermal Reforming, Biomass Reforming, Electrolysis, Photo Electric Chemical (PEC) Water Splitting, Thermochemical Water Splitting, Biomass Gasification, Coal Gasification, Methane Pyrolysis), By Energy Source (Natural Gas, Solar, Wind, Hybrid, Biomass, Geothermal, Hydro Energy, Tidal), By End-Product (Hydr...

    Share:
    Download PDF ×

    We do not share your information with anyone. However, we may send you emails based on your report interest from time to time. You may contact us at any time to opt-out.

    Low Carbon Hydrogen Market Infographic
    $ 4,950.0
    $ 5,950.0
    $ 7,250.0

    Low Carbon Hydrogen Size

    Low Carbon Hydrogen Market Growth Projections and Opportunities

    The low carbon hydrogen market is shaped by a convergence of factors that collectively influence its growth and dynamics within the global economy. Economic conditions, environmental goals, technological advancements, and energy transition initiatives play pivotal roles in determining the trajectory of the low carbon hydrogen industry. Economic stability is a fundamental driver for the low carbon hydrogen market, as industries seek cost-effective and sustainable energy solutions. Low carbon hydrogen, produced with minimized carbon emissions, aligns with the growing demand for clean energy alternatives. During periods of economic growth, increased investments in renewable energy projects and decarbonization efforts contribute to higher demand for low carbon hydrogen. Conversely, economic downturns may impact the pace of such investments.

    Environmental considerations are a primary force shaping the low carbon hydrogen market. With a focus on reducing carbon emissions and combating climate change, governments, industries, and consumers are increasingly embracing low carbon hydrogen as a clean and versatile energy carrier. The transition toward renewable energy sources, such as wind and solar, for hydrogen production aligns with global sustainability goals. Initiatives like the Green Hydrogen Economy are driving the market, aiming to replace conventional hydrogen production methods with environmentally friendly alternatives.

    Technological advancements in hydrogen production, storage, and transportation contribute to the efficiency and scalability of the low carbon hydrogen market. Innovations in electrolysis, particularly using renewable electricity to split water into hydrogen and oxygen, play a crucial role in producing green hydrogen. Advanced storage and transportation technologies address the challenges associated with handling and distributing hydrogen. Research and development in fuel cells and hydrogen-based applications further enhance the overall value chain of low carbon hydrogen, making it increasingly competitive with conventional hydrogen production methods.

    Energy transition initiatives and policy frameworks significantly impact the low carbon hydrogen market. Governments worldwide are implementing strategies to accelerate the adoption of low carbon hydrogen, offering financial incentives, subsidies, and regulatory support. The European Union's Hydrogen Strategy, for example, aims to establish a robust hydrogen economy, while countries like Japan and South Korea are investing heavily in hydrogen infrastructure and research. Policy measures, such as carbon pricing and emission reduction targets, create a conducive environment for the growth of the low carbon hydrogen market.

    Global energy demand trends and the need for decarbonization influence the market for low carbon hydrogen. As industries, transportation, and power sectors seek alternatives to reduce their carbon footprint, low carbon hydrogen emerges as a versatile solution. Its application extends to sectors such as manufacturing, transportation, and power generation, contributing to a diversified and growing market demand. The shift toward hydrogen-based solutions in heavy industries like steel and chemical manufacturing further propels the market forward.

    Market competition in the low carbon hydrogen industry is shaped by factors such as production costs, technological efficiency, and policy alignment. Companies involved in hydrogen production, storage, and distribution compete based on the cost-effectiveness of their solutions and the environmental impact of their processes. Innovations in electrolysis technology, coupled with economies of scale, contribute to cost competitiveness. Companies that align with government policies, support energy transition goals, and demonstrate sustainability in their operations are likely to gain a competitive edge in the evolving low carbon hydrogen market.
    Low Carbon Hydrogen Market Size Graph

    Market Summary

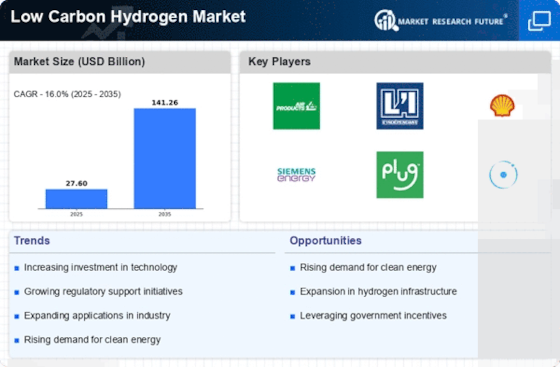
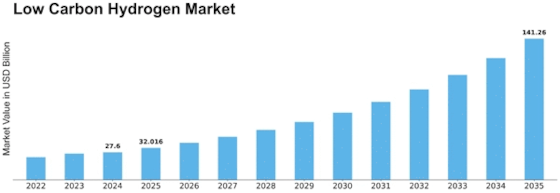
    As per Market Research Future Analysis, the Global Low Carbon Hydrogen Market was valued at USD 27.60 Billion in 2024 and is projected to grow to USD 141.26 Billion by 2035, with a CAGR of 16.00% from 2025 to 2035. The market is driven by the increasing focus on decarbonization and sustainable energy solutions, with significant demand anticipated from industrial applications such as ammonia production and petrochemical refining. The emphasis on hydrogen hubs and the development of over 415 large-scale low-carbon hydrogen projects worldwide further support market growth.

    Key Market Trends & Highlights

    Key trends driving the low carbon hydrogen market include technological advancements and regional initiatives.

    • Demand for hydrogen is expected to increase by 40% to 130 million metric tons by 2035, with over 25% from low-carbon sources.
    • Green hydrogen projects constitute about 95% of the low-carbon project pipeline, highlighting a shift towards sustainable production.
    • North America is projected to dominate the market due to significant investments and regulatory support for low carbon hydrogen technologies.
    • The Asia-Pacific region is expected to grow at the fastest CAGR from 2025 to 2035, driven by government policies and initiatives.

    Market Size & Forecast

    2024 Market Size USD 27.60 Billion
    2035 Market Size USD 141.26 Billion
    CAGR (2025-2035) 16.00%
    Largest Regional Market Share in 2024 North America

    Major Players

    Key companies in the low carbon hydrogen market include Green Hydrogen International, Intercontinental Energy Corp, H2 Clean Energy, and Fortescue Future Industries Pty Ltd.

    Market Trends

    Additionally, recent developments suggest that there is a growing emphasis on research and development projects that investigate novel methods for hydrogen production and utilization, as well as initiatives to integrate hydrogen into existing energy systems.Major economies are prioritizing hydrogen fuel cell technologies for electric vehicles and public transport solutions, highlighting a shift towards cleaner transportation methods. In general, the trajectory of the  Low Carbon Hydrogen Market indicates a robust growth landscape as countries endeavor to adopt sustainable energy solutions.

    The global transition towards low carbon hydrogen is poised to reshape energy systems, driven by increasing policy support and technological advancements that enhance production efficiency and reduce emissions.

    U.S. Department of Energy

    Low Carbon Hydrogen Market Market Drivers

    Market Growth Projections

    The Global Low Carbon Hydrogen Market Industry is projected to experience remarkable growth, with estimates indicating a market value of 27.1 USD Billion in 2024 and a staggering 170.4 USD Billion by 2035. This growth trajectory suggests a compound annual growth rate of 18.21% from 2025 to 2035, driven by increasing investments, technological advancements, and supportive government policies. The market's expansion reflects a broader shift towards sustainable energy solutions, positioning low carbon hydrogen as a cornerstone of future energy systems. As stakeholders recognize the potential of low carbon hydrogen, the industry is likely to evolve rapidly.

    Rising Demand for Clean Energy

    The Global Low Carbon Hydrogen Market Industry experiences a surge in demand for clean energy solutions as countries strive to meet climate targets. Governments worldwide are implementing policies to reduce greenhouse gas emissions, which drives the adoption of low carbon hydrogen as a viable alternative to fossil fuels. For instance, the European Union aims to produce 10 million tons of renewable hydrogen by 2030, indicating a robust commitment to this sector. This growing demand is projected to elevate the market value to 27.1 USD Billion in 2024, highlighting the increasing recognition of low carbon hydrogen's role in achieving sustainability goals.

    Growing Industrial Applications

    The Global Low Carbon Hydrogen Market Industry is witnessing an expansion in industrial applications, particularly in sectors such as steel manufacturing, refining, and chemical production. Industries are increasingly adopting low carbon hydrogen to decarbonize their processes and meet stringent environmental regulations. For example, major steel producers are exploring hydrogen-based direct reduction processes to replace traditional methods reliant on coal. This shift not only reduces carbon emissions but also aligns with global sustainability objectives. The increasing adoption of low carbon hydrogen in various industries is expected to drive market growth significantly in the coming years.

    Government Incentives and Support

    Government incentives play a crucial role in fostering the Global Low Carbon Hydrogen Market Industry. Various nations are introducing subsidies, tax breaks, and funding for research and development to stimulate investment in low carbon hydrogen technologies. For instance, the United States has allocated substantial funding through the Infrastructure Investment and Jobs Act to support hydrogen initiatives. Such financial backing not only encourages private sector participation but also enhances the overall market landscape. As a result, the market is anticipated to grow significantly, reaching an estimated value of 170.4 USD Billion by 2035.

    International Collaboration and Partnerships

    International collaboration is emerging as a key driver for the Global Low Carbon Hydrogen Market Industry. Countries are forming partnerships to share knowledge, technology, and resources to accelerate the development of hydrogen economies. Initiatives such as the Hydrogen Energy Ministerial Meetings facilitate dialogue and cooperation among nations, promoting best practices and investment opportunities. These collaborative efforts are likely to enhance the global supply chain for low carbon hydrogen, making it more accessible and affordable. As countries work together, the market is poised for substantial growth, reflecting the collective commitment to a sustainable energy future.

    Technological Advancements in Hydrogen Production

    Technological innovations in hydrogen production methods, such as electrolysis and steam methane reforming with carbon capture, are pivotal for the Global Low Carbon Hydrogen Market Industry. These advancements enhance efficiency and reduce costs, making low carbon hydrogen more competitive against traditional energy sources. For example, advancements in electrolyzer technology have led to a significant reduction in the cost of green hydrogen production. As these technologies mature, they are expected to contribute to a compound annual growth rate of 18.21% from 2025 to 2035, further solidifying the market's growth trajectory.

    Market Segment Insights

    Low Carbon Hydrogen Market Segment Insights

    Low Carbon Hydrogen Market Segment Insights

    Low Carbon Hydrogen Market Process Insights

    Low Carbon Hydrogen Market Process Insights

    The  Low Carbon Hydrogen Market, particularly within the Process segment, is shaping up to be a vital area of interest as the market evolves. The Process segment encompasses various methodologies for low carbon hydrogen production, each playing a crucial role in meeting  energy demands while reducing carbon emissions. In 2024, significant methods include Steam Methane Reforming (SMR), leading with a valuation of 10.0 USD Billion, indicative of its majority holding in the market, demonstrating its efficiency in hydrogen generation.

    Close behind, Autothermal Reforming holds a valuation of 5.0 USD Billion, showcasing its importance for balancing economic and environmental objectives through the reforming of hydrocarbons.

    Electrolysis, valued at 6.56 USD Billion in 2024, plays a significant role as a renewable energy player, tapping into water resources for hydrogen production and set for notable growth in the coming years with its expected increase to 40.0 USD Billion by 2035, driven by advancements in renewable energy technologies. Biomass Reforming, with a starting valuation of 3.5 USD Billion, reflects a sustainable avenue, leveraging organic materials while forecasted to reach 20.0 USD Billion, thus enhancing the market's sustainability narrative.

    Moreover, Photo Electric Chemical (PEC) Water Splitting is emerging with a value of 2.0 USD Billion in 2024, and aims to harness sunlight effectively, contributing to the broader portfolio of renewable hydrogen solutions. As the  community leans towards cleaner technologies, each of these processes offers unique advantages, addressing energy security and minimizing environmental footprints. Thermochemical Water Splitting alongside Biomass Gasification, Coal Gasification, and Methane Pyrolysis, while less dominant in immediate market valuations, are increasingly receiving attention as complementary pathways to enhance hydrogen production avenues.

    Low Carbon Hydrogen Market Energy Source Insights  

    Low Carbon Hydrogen Market Energy Source Insights  

    The  Low Carbon Hydrogen Market is expanding significantly, driven primarily by the diverse Energy Source segment, which plays a critical role in achieving sustainable energy goals. By 2024, this overall market is valued at 27.06 USD Billion, showcasing the growing investment in low carbon technologies. As industries shift towards greener sources, Natural Gas emerges as a significant contributor to hydrogen production while minimizing carbon emissions. Solar and Wind energy are experiencing remarkable adoption rates, harnessing renewable resources for clean hydrogen generation.Hybrid approaches are gaining traction, synergizing multiple energy sources to improve efficiency and reliability.

    Additionally, Biomass and Geothermal are seen as sustainable methods that can complement low carbon hydrogen initiatives. Hydro Energy is crucial, given its ability to produce hydrogen with low environmental impact, while Tidal energy presents a unique opportunity, leveraging ocean currents for hydrogen production. The  Low Carbon Hydrogen Market segmentation reveals that these diverse Energy Sources collectively enhance energy security, reduce carbon footprints, and accelerate the transition to a low carbon economy.Such a dynamic structure underscores the importance of aligning investments in various energy sources to ensure a balanced and sustainable market growth trajectory.

    Low Carbon Hydrogen Market End-Product Insights  

    Low Carbon Hydrogen Market End-Product Insights  

    The  Low Carbon Hydrogen Market is poised for significant growth, with the overall market expected to reach a value of 27.06 billion USD in 2024. Within this market, various end-products have gained prominence, particularly Hydrogen, Ammonia, Liquified Hydrogen, Methane, and Methanol. Hydrogen is emerging as a key player due to its versatility in energy applications and potential in decarbonizing industries, while Ammonia serves as a crucial hydrogen carrier and is increasingly utilized in fertilizers.

    Liquified Hydrogen is significant for storage and transport efficiency, making it an essential part of the market dynamics.Furthermore, Methane and Methanol are gaining traction due to their ability to serve as low-carbon fuels and chemical feedstocks, contributing to sustained demand. The market is driven by  initiatives to reduce carbon emissions, technological advancements, and supportive policies encouraging the adoption of low carbon alternatives. As industries seek cleaner energy solutions, the  Low Carbon Hydrogen Market segmentation reveals a landscape rich with opportunities, highlighting the importance of these end-products in achieving sustainability goals worldwide.

    Many industries are turning to blue hydrogen as a cleaner alternative to traditional fossil fuels, helping reduce carbon emissions while maintaining energy security.

    Get more detailed insights about Low Carbon Hydrogen Market Research Report - Global Forecast by 2035

    Regional Insights

    The  Low Carbon Hydrogen Market is experiencing significant growth across various regions, with Europe leading the way, valued at 9.0 USD Billion in 2024 and projected to reach 55.0 USD Billion by 2035. Following closely is the Asia Pacific region, with an initial value of 7.0 USD Billion in 2024, expanding to 41.5 USD Billion by 2035. North America holds a substantial position as well, starting at 6.0 USD Billion in 2024 and growing to 36.25 USD Billion by 2035.

    South America, although smaller, has a noteworthy trajectory with a value of 3.0 USD Billion in 2024, anticipated to increase to 20.0 USD Billion in 2035.Meanwhile, the Middle East and Africa, with a valuation of 2.06 USD Billion in 2024, is expected to grow to 17.7 USD Billion, showcasing rising interest in low carbon initiatives and energy diversification strategies. The substantial market figures in Europe and Asia Pacific underscore their commitment to sustainable energy solutions, with Europe dominating due to strong policy frameworks and investment in green technology.

    Emerging economies in Asia Pacific present opportunities for rapid market growth, driven by increasing industrial applications and government incentives for clean energy transitions.Each region's unique landscape and regulatory environments contribute to the overall dynamics and potential of the  Low Carbon Hydrogen Market.

    Low Carbon Hydrogen Market Regional

    Source: Primary Research, Secondary Research, Market Research Future Database and Analyst Review

    Key Players and Competitive Insights

    The  Low Carbon Hydrogen Market is experiencing significant momentum as countries and industries increasingly prioritize reducing carbon emissions and transitioning towards sustainable energy sources. Competitive insights within this market reveal a landscape characterized by both established players and emerging companies, each striving to innovate and capture a share of the growing demand for low carbon hydrogen solutions. Factors such as technological advancements, government policies promoting clean energy, and collaboration between public and private sectors contribute to a dynamic competitive environment.

    Companies are focusing on scalable production techniques, cost reductions, and enhanced efficiency to establish themselves as market leaders while navigating the complexities of regulatory frameworks and environmental standards.ITM Power stands out in the  Low Carbon Hydrogen Market due to its advanced electrolyzer technology, which facilitates the production of hydrogen through renewable energy sources. The company's focus on innovation has positioned it as a leader in the sector, offering systems that are crucial for the efficient generation of low carbon hydrogen.

    ITM Power's strong presence in various projects worldwide showcases its ability to collaborate with key stakeholders and participate in large-scale developments aimed at decarbonization. The company's strengths lie in its cutting-edge research and development capabilities, a robust portfolio of patents, and a commitment to sustainability, which resonates with  efforts towards achieving net-zero emissions.

    ITM Power's strategic partnerships and joint ventures further enhance its competitive edge, enabling it to maintain a favorable position in the market.Siemens has carved out a prominent role in the  Low Carbon Hydrogen Market by leveraging its technological expertise and comprehensive suite of products and services tailored for hydrogen generation and infrastructure. The company offers advanced solutions such as electrolysis systems and power-to-gas technologies that cater to the growing need for low carbon hydrogen across various industries.

    Siemens' longstanding commitment to sustainability and innovation has led to several strategic mergers and acquisitions that bolster its capabilities and expand its market reach ly. With a strong footprint in multiple regions, Siemens capitalizes on its established industrial network to enhance its project execution and customer relationships. The company's focus on providing end-to-end solutions empowers clients to integrate low carbon hydrogen production into their operations, reinforcing its position as a key player within this evolving market.

    Key Companies in the Low Carbon Hydrogen Market market include

    Industry Developments

    Recent developments in the  Low Carbon Hydrogen Market indicate a significant shift towards renewable energy solutions. In October 2023, ITM Power announced a strategic partnership with Air Products and Chemicals to expand hydrogen production capacity, aligning with  decarbonization goals. Siemens is actively investing in technologies for hydrogen generation, working on projects that explore the integration of low carbon hydrogen in industrial processes.

    In September 2023, TotalEnergies and Engie unveiled plans for a joint venture aimed at developing a large-scale hydrogen facility in France, showcasing an industry trend towards collaboration.Acwa Power continues to invest in sustainable solutions with its recent announcement of a mega hydrogen plant in Saudi Arabia, promising substantial emissions reductions. Notably, in August 2023, Linde and Thyssenkrupp formed a partnership to advance hydrogen production technologies, significantly bolstering their market positions. This progression is reflected in the growth valuations of companies like Plug Power and Shell, indicating robust investor interest.

    The market's expansion is further evidenced by enhanced cooperation among key players, indicating a collaborative spirit in achieving a low carbon future.


    Future Outlook

    Low Carbon Hydrogen Market Future Outlook

    The Low Carbon Hydrogen Market is projected to grow at an 16.00% CAGR from 2025 to 2035, driven by technological advancements, regulatory support, and increasing demand for clean energy solutions.

    New opportunities lie in:

    • Invest in electrolyzer technology to enhance hydrogen production efficiency.
    • Develop hydrogen storage solutions to address supply chain challenges.
    • Explore partnerships with renewable energy firms to secure sustainable hydrogen sources.

    By 2035, the Low Carbon Hydrogen Market is expected to be a pivotal component of the global energy landscape.

    Market Segmentation

    Low Carbon Hydrogen Market Process Outlook

    • Steam Methane Reforming (SMR)
    • Autothermal Reforming
    • Biomass Reforming
    • Electrolysis
    • Photo Electric Chemical (PEC) Water Splitting
    • Thermochemical Water Splitting
    • Biomass Gasification
    • Coal Gasification
    • Methane Pyrolysis

    Low Carbon Hydrogen Market Regional Outlook

    • North America
    • Europe
    • South America
    • Asia Pacific
    • Middle East and Africa

    Low Carbon Hydrogen Market End-Product Outlook

    • Hydrogen
    • Ammonia
    • Liquified Hydrogen
    • Methane
    • Methanol

    Low Carbon Hydrogen Market Energy Source Outlook

    • Natural Gas
    • Solar
    • Wind
    • Hybrid
    • Biomass
    • Geothermal
    • Hydro Energy
    • Tidal

    Report Scope

    Report Attribute/Metric Details
    Market Size 2024 27.06(USD Billion)
    Market Size 2035 141.26 (USD Billion)
    Compound Annual Growth Rate (CAGR) 16.00% (2025 - 2035)
    Report Coverage Revenue Forecast, Competitive Landscape, Growth Factors, and Trends
    Base Year 2024
    Market Forecast Period 2025 - 2035
    Historical Data 2019 - 2024
    Market Forecast Units USD Billion
    Key Companies Profiled ITM Power, Siemens, Acwa Power, TotalEnergies, Air Products and Chemicals, Thyssenkrupp, Plug Power, Linde, Nel Asa, Engie, Element Energy, Shell, BP, Hydrogenics, Chart Industries
    Segments Covered Process, Energy Source, End-Product, Regional
    Key Market Opportunities Increased government incentives, Emerging industrial applications, Growing demand for clean energy, Advancements in hydrogen production technologies, Expansion of transportation fuel market
    Key Market Dynamics increasing demand for clean energy, government incentives and regulations, technological advancements in production, growing investment in infrastructure, rising carbon emission reduction targets
    Countries Covered North America, Europe, APAC, South America, MEA
    Market Size 2025 32.02 (USD Billion)

    Market Highlights

    Author

    Chitranshi Jaiswal
    Research Analyst Level I

    She holds an experience of about 6+ years in market research and business consulting, working under the spectrum of information communication technology, telecommunications and semiconductor domains. aarti conceptualizes and implements a scalable business strategy and provides strategic leadership to the clients. her expertise lies in market estimation, competitive intelligence, pipeline analysis, customer assessment, etc.

    Leave a Comment

    Latest Comments

    John Doe
    john@example.com

    This is a great article! Really helped me understand the topic better.

    Posted on July 23, 2025, 10:15 AM
    Jane Smith
    jane@domain.com

    Thanks for sharing this. I’ve bookmarked it for later reference.

    Posted on July 22, 2025, 7:45 PM

    FAQs

    What is the expected market size of the Low Carbon Hydrogen Market in 2024?

    The Low Carbon Hydrogen Market is expected to be valued at 27.06 USD Billion in 2024.

    What is the expected compound annual growth rate (CAGR) for the Low Carbon Hydrogen Market from 2025 to 2035?

    Low Carbon Hydrogen Market is expected to grow with a CAGR of 16% in the period 2025-2035

    Which region is expected to dominate the Low Carbon Hydrogen Market by 2035?

    Europe is expected to dominate the market with an anticipated value of 55.0 USD Billion by 2035.

    Who are the key players in the Low Carbon Hydrogen Market?

    Key players in the market include ITM Power, Siemens, Acwa Power, TotalEnergies, and Air Products and Chemicals.

    What is the expected market value of the Asia Pacific region in the Low Carbon Hydrogen Market by 2035?

    The Asia Pacific region is anticipated to be valued at 41.5 USD Billion by 2035.

    How much is the Biomass Reforming market expected to grow by 2035?

    The Biomass Reforming market is projected to increase to 20.0 USD Billion by 2035.

    What are the growth opportunities in the Low Carbon Hydrogen Market?

    The market presents growth opportunities driven by increased demand for low carbon energy solutions and technological advancements.

    1. . EXECUTIVE SUMMARY
    2. . Market Overview
    3. . Key Findings
    4. . Market Segmentation
    5. . Competitive Landscape
    6. . Challenges and Opportunities
    7. . Future Outlook
    8. . MARKET INTRODUCTION
    9. . Definition
    10. . Scope of the study
    11. . Research Objective
    12. . Assumption
    13. . Limitations
    14. . RESEARCH METHODOLOGY
    15. . Overview
    16. . Data Mining
    17. . Secondary Research
    18. . Primary Research
    19. . Primary Interviews and Information Gathering Process
    20. . Breakdown of Primary Respondents
    21. . Forecasting Model
    22. . Market Size Estimation
    23. . Bottom-Up Approach
    24. . Top-Down Approach
    25. . Data Triangulation
    26. . Validation
    27. . MARKET DYNAMICS
    28. . Overview
    29. . Drivers
    30. . Restraints
    31. . Opportunities
    32. . MARKET FACTOR ANALYSIS
    33. . Value chain Analysis
    34. . Porter's Five Forces Analysis
    35. . Bargaining Power of Suppliers
    36. . Bargaining Power of Buyers
    37. . Threat of New Entrants
    38. . Threat of Substitutes
    39. . Intensity of Rivalry
    40. . COVID-19 Impact Analysis
    41. . Market Impact Analysis
    42. . Regional Impact
    43. . Opportunity and Threat Analysis
    44. . LOW CARBON HYDROGEN MARKET, BY PROCESS (USD BILLION)
    45. . Steam Methane Reforming (SMR)
    46. . Autothermal Reforming
    47. . Biomass Reforming
    48. . Electrolysis
    49. . Photo Electric Chemical (PEC) Water Splitting
    50. . Thermochemical Water Splitting
    51. . Biomass Gasification
    52. . Coal Gasification
    53. . Methane Pyrolysis
    54. . LOW CARBON HYDROGEN MARKET, BY ENERGY SOURCE (USD BILLION)
    55. . Natural Gas
    56. . Solar
    57. . Wind
    58. . Hybrid
    59. . Biomass
    60. . Geothermal
    61. . Hydro Energy
    62. . Tidal
    63. . LOW CARBON HYDROGEN MARKET, BY END-PRODUCT (USD BILLION)
    64. . Hydrogen
    65. . Ammonia
    66. . Liquified Hydrogen
    67. . Methane
    68. . Methanol
    69. . LOW CARBON HYDROGEN MARKET, BY REGIONAL (USD BILLION)
    70. . North America
    71. . US
    72. . Canada
    73. . Europe
    74. . Germany
    75. . UK
    76. . France
    77. . Russia
    78. . Italy
    79. . Spain
    80. . Rest of Europe
    81. . APAC
    82. . China
    83. . India
    84. . Japan
    85. . South Korea
    86. . Malaysia
    87. . Thailand
    88. . Indonesia
    89. . Rest of APAC
    90. . South America
    91. . Brazil
    92. . Mexico
    93. . Argentina
    94. . Rest of South America
    95. . MEA
    96. . GCC Countries
    97. . South Africa
    98. . Rest of MEA
    99. . COMPETITIVE LANDSCAPE
    100. . Overview
    101. . Competitive Analysis
    102. . Market share Analysis
    103. . Major Growth Strategy in the Low Carbon Hydrogen Market
    104. . Competitive Benchmarking
    105. . Leading Players in Terms of Number of Developments in the Low Carbon Hydrogen Market
    106. . Key developments and growth strategies
    107. . New Product Launch/Service Deployment
    108. . Merger & Acquisitions
    109. . Joint Ventures
    110. . Major Players Financial Matrix
    111. . Sales and Operating Income
    112. . Major Players R&D Expenditure. 2023
    113. . COMPANY PROFILES
    114. . ITM Power
    115. . Financial Overview
    116. . Products Offered
    117. . Key Developments
    118. . SWOT Analysis
    119. . Key Strategies
    120. . Siemens
    121. . Financial Overview
    122. . Products Offered
    123. . Key Developments
    124. . SWOT Analysis
    125. . Key Strategies
    126. . Acwa Power
    127. . Financial Overview
    128. . Products Offered
    129. . Key Developments
    130. . SWOT Analysis
    131. . Key Strategies
    132. . TotalEnergies
    133. . Financial Overview
    134. . Products Offered
    135. . Key Developments
    136. . SWOT Analysis
    137. . Key Strategies
    138. . Air Products and Chemicals
    139. . Financial Overview
    140. . Products Offered
    141. . Key Developments
    142. . SWOT Analysis
    143. . Key Strategies
    144. . Thyssenkrupp
    145. . Financial Overview
    146. . Products Offered
    147. . Key Developments
    148. . SWOT Analysis
    149. . Key Strategies
    150. . Plug Power
    151. . Financial Overview
    152. . Products Offered
    153. . Key Developments
    154. . SWOT Analysis
    155. . Key Strategies
    156. . Linde
    157. . Financial Overview
    158. . Products Offered
    159. . Key Developments
    160. . SWOT Analysis
    161. . Key Strategies
    162. . Nel Asa
    163. . Financial Overview
    164. . Products Offered
    165. . Key Developments
    166. . SWOT Analysis
    167. . Key Strategies
    168. . Engie
    169. . Financial Overview
    170. . Products Offered
    171. . Key Developments
    172. . SWOT Analysis
    173. . Key Strategies
    174. . Element Energy
    175. . Financial Overview
    176. . Products Offered
    177. . Key Developments
    178. . SWOT Analysis
    179. . Key Strategies
    180. . Shell
    181. . Financial Overview
    182. . Products Offered
    183. . Key Developments
    184. . SWOT Analysis
    185. . Key Strategies
    186. . BP
    187. . Financial Overview
    188. . Products Offered
    189. . Key Developments
    190. . SWOT Analysis
    191. . Key Strategies
    192. . Hydrogenics
    193. . Financial Overview
    194. . Products Offered
    195. . Key Developments
    196. . SWOT Analysis
    197. . Key Strategies
    198. . Chart Industries
    199. . Financial Overview
    200. . Products Offered
    201. . Key Developments
    202. . SWOT Analysis
    203. . Key Strategies
    204. . APPENDIX
    205. . References
    206. . Related Reports LIST OF TABLES TABLE
    207. . LIST OF ASSUMPTIONS TABLE
    208. . NORTH AMERICA LOW CARBON HYDROGEN MARKET SIZE ESTIMATES & FORECAST, BY PROCESS, 2019-2035 (USD BILLIONS) TABLE
    209. . NORTH AMERICA LOW CARBON HYDROGEN MARKET SIZE ESTIMATES & FORECAST, BY ENERGY SOURCE, 2019-2035 (USD BILLIONS) TABLE
    210. . NORTH AMERICA LOW CARBON HYDROGEN MARKET SIZE ESTIMATES & FORECAST, BY END-PRODUCT, 2019-2035 (USD BILLIONS) TABLE
    211. . NORTH AMERICA LOW CARBON HYDROGEN MARKET SIZE ESTIMATES & FORECAST, BY REGIONAL, 2019-2035 (USD BILLIONS) TABLE
    212. . US LOW CARBON HYDROGEN MARKET SIZE ESTIMATES & FORECAST, BY PROCESS, 2019-2035 (USD BILLIONS) TABLE
    213. . US LOW CARBON HYDROGEN MARKET SIZE ESTIMATES & FORECAST, BY ENERGY SOURCE, 2019-2035 (USD BILLIONS) TABLE
    214. . US LOW CARBON HYDROGEN MARKET SIZE ESTIMATES & FORECAST, BY END-PRODUCT, 2019-2035 (USD BILLIONS) TABLE
    215. . US LOW CARBON HYDROGEN MARKET SIZE ESTIMATES & FORECAST, BY REGIONAL, 2019-2035 (USD BILLIONS) TABLE
    216. . CANADA LOW CARBON HYDROGEN MARKET SIZE ESTIMATES & FORECAST, BY PROCESS, 2019-2035 (USD BILLIONS) TABLE
    217. . CANADA LOW CARBON HYDROGEN MARKET SIZE ESTIMATES & FORECAST, BY ENERGY SOURCE, 2019-2035 (USD BILLIONS) TABLE
    218. . CANADA LOW CARBON HYDROGEN MARKET SIZE ESTIMATES & FORECAST, BY END-PRODUCT, 2019-2035 (USD BILLIONS) TABLE
    219. . CANADA LOW CARBON HYDROGEN MARKET SIZE ESTIMATES & FORECAST, BY REGIONAL, 2019-2035 (USD BILLIONS) TABLE
    220. . EUROPE LOW CARBON HYDROGEN MARKET SIZE ESTIMATES & FORECAST, BY PROCESS, 2019-2035 (USD BILLIONS) TABLE
    221. . EUROPE LOW CARBON HYDROGEN MARKET SIZE ESTIMATES & FORECAST, BY ENERGY SOURCE, 2019-2035 (USD BILLIONS) TABLE
    222. . EUROPE LOW CARBON HYDROGEN MARKET SIZE ESTIMATES & FORECAST, BY END-PRODUCT, 2019-2035 (USD BILLIONS) TABLE
    223. . EUROPE LOW CARBON HYDROGEN MARKET SIZE ESTIMATES & FORECAST, BY REGIONAL, 2019-2035 (USD BILLIONS) TABLE
    224. . GERMANY LOW CARBON HYDROGEN MARKET SIZE ESTIMATES & FORECAST, BY PROCESS, 2019-2035 (USD BILLIONS) TABLE
    225. . GERMANY LOW CARBON HYDROGEN MARKET SIZE ESTIMATES & FORECAST, BY ENERGY SOURCE, 2019-2035 (USD BILLIONS) TABLE
    226. . GERMANY LOW CARBON HYDROGEN MARKET SIZE ESTIMATES & FORECAST, BY END-PRODUCT, 2019-2035 (USD BILLIONS) TABLE
    227. . GERMANY LOW CARBON HYDROGEN MARKET SIZE ESTIMATES & FORECAST, BY REGIONAL, 2019-2035 (USD BILLIONS) TABLE
    228. . UK LOW CARBON HYDROGEN MARKET SIZE ESTIMATES & FORECAST, BY PROCESS, 2019-2035 (USD BILLIONS) TABLE
    229. . UK LOW CARBON HYDROGEN MARKET SIZE ESTIMATES & FORECAST, BY ENERGY SOURCE, 2019-2035 (USD BILLIONS) TABLE
    230. . UK LOW CARBON HYDROGEN MARKET SIZE ESTIMATES & FORECAST, BY END-PRODUCT, 2019-2035 (USD BILLIONS) TABLE
    231. . UK LOW CARBON HYDROGEN MARKET SIZE ESTIMATES & FORECAST, BY REGIONAL, 2019-2035 (USD BILLIONS) TABLE
    232. . FRANCE LOW CARBON HYDROGEN MARKET SIZE ESTIMATES & FORECAST, BY PROCESS, 2019-2035 (USD BILLIONS) TABLE
    233. . FRANCE LOW CARBON HYDROGEN MARKET SIZE ESTIMATES & FORECAST, BY ENERGY SOURCE, 2019-2035 (USD BILLIONS) TABLE
    234. . FRANCE LOW CARBON HYDROGEN MARKET SIZE ESTIMATES & FORECAST, BY END-PRODUCT, 2019-2035 (USD BILLIONS) TABLE
    235. . FRANCE LOW CARBON HYDROGEN MARKET SIZE ESTIMATES & FORECAST, BY REGIONAL, 2019-2035 (USD BILLIONS) TABLE
    236. . RUSSIA LOW CARBON HYDROGEN MARKET SIZE ESTIMATES & FORECAST, BY PROCESS, 2019-2035 (USD BILLIONS) TABLE
    237. . RUSSIA LOW CARBON HYDROGEN MARKET SIZE ESTIMATES & FORECAST, BY ENERGY SOURCE, 2019-2035 (USD BILLIONS) TABLE
    238. . RUSSIA LOW CARBON HYDROGEN MARKET SIZE ESTIMATES & FORECAST, BY END-PRODUCT, 2019-2035 (USD BILLIONS) TABLE
    239. . RUSSIA LOW CARBON HYDROGEN MARKET SIZE ESTIMATES & FORECAST, BY REGIONAL, 2019-2035 (USD BILLIONS) TABLE
    240. . ITALY LOW CARBON HYDROGEN MARKET SIZE ESTIMATES & FORECAST, BY PROCESS, 2019-2035 (USD BILLIONS) TABLE
    241. . ITALY LOW CARBON HYDROGEN MARKET SIZE ESTIMATES & FORECAST, BY ENERGY SOURCE, 2019-2035 (USD BILLIONS) TABLE
    242. . ITALY LOW CARBON HYDROGEN MARKET SIZE ESTIMATES & FORECAST, BY END-PRODUCT, 2019-2035 (USD BILLIONS) TABLE
    243. . ITALY LOW CARBON HYDROGEN MARKET SIZE ESTIMATES & FORECAST, BY REGIONAL, 2019-2035 (USD BILLIONS) TABLE
    244. . SPAIN LOW CARBON HYDROGEN MARKET SIZE ESTIMATES & FORECAST, BY PROCESS, 2019-2035 (USD BILLIONS) TABLE
    245. . SPAIN LOW CARBON HYDROGEN MARKET SIZE ESTIMATES & FORECAST, BY ENERGY SOURCE, 2019-2035 (USD BILLIONS) TABLE
    246. . SPAIN LOW CARBON HYDROGEN MARKET SIZE ESTIMATES & FORECAST, BY END-PRODUCT, 2019-2035 (USD BILLIONS) TABLE
    247. . SPAIN LOW CARBON HYDROGEN MARKET SIZE ESTIMATES & FORECAST, BY REGIONAL, 2019-2035 (USD BILLIONS) TABLE
    248. . REST OF EUROPE LOW CARBON HYDROGEN MARKET SIZE ESTIMATES & FORECAST, BY PROCESS, 2019-2035 (USD BILLIONS) TABLE
    249. . REST OF EUROPE LOW CARBON HYDROGEN MARKET SIZE ESTIMATES & FORECAST, BY ENERGY SOURCE, 2019-2035 (USD BILLIONS) TABLE
    250. . REST OF EUROPE LOW CARBON HYDROGEN MARKET SIZE ESTIMATES & FORECAST, BY END-PRODUCT, 2019-2035 (USD BILLIONS) TABLE
    251. . REST OF EUROPE LOW CARBON HYDROGEN MARKET SIZE ESTIMATES & FORECAST, BY REGIONAL, 2019-2035 (USD BILLIONS) TABLE
    252. . APAC LOW CARBON HYDROGEN MARKET SIZE ESTIMATES & FORECAST, BY PROCESS, 2019-2035 (USD BILLIONS) TABLE
    253. . APAC LOW CARBON HYDROGEN MARKET SIZE ESTIMATES & FORECAST, BY ENERGY SOURCE, 2019-2035 (USD BILLIONS) TABLE
    254. . APAC LOW CARBON HYDROGEN MARKET SIZE ESTIMATES & FORECAST, BY END-PRODUCT, 2019-2035 (USD BILLIONS) TABLE
    255. . APAC LOW CARBON HYDROGEN MARKET SIZE ESTIMATES & FORECAST, BY REGIONAL, 2019-2035 (USD BILLIONS) TABLE
    256. . CHINA LOW CARBON HYDROGEN MARKET SIZE ESTIMATES & FORECAST, BY PROCESS, 2019-2035 (USD BILLIONS) TABLE
    257. . CHINA LOW CARBON HYDROGEN MARKET SIZE ESTIMATES & FORECAST, BY ENERGY SOURCE, 2019-2035 (USD BILLIONS) TABLE
    258. . CHINA LOW CARBON HYDROGEN MARKET SIZE ESTIMATES & FORECAST, BY END-PRODUCT, 2019-2035 (USD BILLIONS) TABLE
    259. . CHINA LOW CARBON HYDROGEN MARKET SIZE ESTIMATES & FORECAST, BY REGIONAL, 2019-2035 (USD BILLIONS) TABLE
    260. . INDIA LOW CARBON HYDROGEN MARKET SIZE ESTIMATES & FORECAST, BY PROCESS, 2019-2035 (USD BILLIONS) TABLE
    261. . INDIA LOW CARBON HYDROGEN MARKET SIZE ESTIMATES & FORECAST, BY ENERGY SOURCE, 2019-2035 (USD BILLIONS) TABLE
    262. . INDIA LOW CARBON HYDROGEN MARKET SIZE ESTIMATES & FORECAST, BY END-PRODUCT, 2019-2035 (USD BILLIONS) TABLE
    263. . INDIA LOW CARBON HYDROGEN MARKET SIZE ESTIMATES & FORECAST, BY REGIONAL, 2019-2035 (USD BILLIONS) TABLE
    264. . JAPAN LOW CARBON HYDROGEN MARKET SIZE ESTIMATES & FORECAST, BY PROCESS, 2019-2035 (USD BILLIONS) TABLE
    265. . JAPAN LOW CARBON HYDROGEN MARKET SIZE ESTIMATES & FORECAST, BY ENERGY SOURCE, 2019-2035 (USD BILLIONS) TABLE
    266. . JAPAN LOW CARBON HYDROGEN MARKET SIZE ESTIMATES & FORECAST, BY END-PRODUCT, 2019-2035 (USD BILLIONS) TABLE
    267. . JAPAN LOW CARBON HYDROGEN MARKET SIZE ESTIMATES & FORECAST, BY REGIONAL, 2019-2035 (USD BILLIONS) TABLE
    268. . SOUTH KOREA LOW CARBON HYDROGEN MARKET SIZE ESTIMATES & FORECAST, BY PROCESS, 2019-2035 (USD BILLIONS) TABLE
    269. . SOUTH KOREA LOW CARBON HYDROGEN MARKET SIZE ESTIMATES & FORECAST, BY ENERGY SOURCE, 2019-2035 (USD BILLIONS) TABLE
    270. . SOUTH KOREA LOW CARBON HYDROGEN MARKET SIZE ESTIMATES & FORECAST, BY END-PRODUCT, 2019-2035 (USD BILLIONS) TABLE
    271. . SOUTH KOREA LOW CARBON HYDROGEN MARKET SIZE ESTIMATES & FORECAST, BY REGIONAL, 2019-2035 (USD BILLIONS) TABLE
    272. . MALAYSIA LOW CARBON HYDROGEN MARKET SIZE ESTIMATES & FORECAST, BY PROCESS, 2019-2035 (USD BILLIONS) TABLE
    273. . MALAYSIA LOW CARBON HYDROGEN MARKET SIZE ESTIMATES & FORECAST, BY ENERGY SOURCE, 2019-2035 (USD BILLIONS) TABLE
    274. . MALAYSIA LOW CARBON HYDROGEN MARKET SIZE ESTIMATES & FORECAST, BY END-PRODUCT, 2019-2035 (USD BILLIONS) TABLE
    275. . MALAYSIA LOW CARBON HYDROGEN MARKET SIZE ESTIMATES & FORECAST, BY REGIONAL, 2019-2035 (USD BILLIONS) TABLE
    276. . THAILAND LOW CARBON HYDROGEN MARKET SIZE ESTIMATES & FORECAST, BY PROCESS, 2019-2035 (USD BILLIONS) TABLE
    277. . THAILAND LOW CARBON HYDROGEN MARKET SIZE ESTIMATES & FORECAST, BY ENERGY SOURCE, 2019-2035 (USD BILLIONS) TABLE
    278. . THAILAND LOW CARBON HYDROGEN MARKET SIZE ESTIMATES & FORECAST, BY END-PRODUCT, 2019-2035 (USD BILLIONS) TABLE
    279. . THAILAND LOW CARBON HYDROGEN MARKET SIZE ESTIMATES & FORECAST, BY REGIONAL, 2019-2035 (USD BILLIONS) TABLE
    280. . INDONESIA LOW CARBON HYDROGEN MARKET SIZE ESTIMATES & FORECAST, BY PROCESS, 2019-2035 (USD BILLIONS) TABLE
    281. . INDONESIA LOW CARBON HYDROGEN MARKET SIZE ESTIMATES & FORECAST, BY ENERGY SOURCE, 2019-2035 (USD BILLIONS) TABLE
    282. . INDONESIA LOW CARBON HYDROGEN MARKET SIZE ESTIMATES & FORECAST, BY END-PRODUCT, 2019-2035 (USD BILLIONS) TABLE
    283. . INDONESIA LOW CARBON HYDROGEN MARKET SIZE ESTIMATES & FORECAST, BY REGIONAL, 2019-2035 (USD BILLIONS) TABLE
    284. . REST OF APAC LOW CARBON HYDROGEN MARKET SIZE ESTIMATES & FORECAST, BY PROCESS, 2019-2035 (USD BILLIONS) TABLE
    285. . REST OF APAC LOW CARBON HYDROGEN MARKET SIZE ESTIMATES & FORECAST, BY ENERGY SOURCE, 2019-2035 (USD BILLIONS) TABLE
    286. . REST OF APAC LOW CARBON HYDROGEN MARKET SIZE ESTIMATES & FORECAST, BY END-PRODUCT, 2019-2035 (USD BILLIONS) TABLE
    287. . REST OF APAC LOW CARBON HYDROGEN MARKET SIZE ESTIMATES & FORECAST, BY REGIONAL, 2019-2035 (USD BILLIONS) TABLE
    288. . SOUTH AMERICA LOW CARBON HYDROGEN MARKET SIZE ESTIMATES & FORECAST, BY PROCESS, 2019-2035 (USD BILLIONS) TABLE
    289. . SOUTH AMERICA LOW CARBON HYDROGEN MARKET SIZE ESTIMATES & FORECAST, BY ENERGY SOURCE, 2019-2035 (USD BILLIONS) TABLE
    290. . SOUTH AMERICA LOW CARBON HYDROGEN MARKET SIZE ESTIMATES & FORECAST, BY END-PRODUCT, 2019-2035 (USD BILLIONS) TABLE
    291. . SOUTH AMERICA LOW CARBON HYDROGEN MARKET SIZE ESTIMATES & FORECAST, BY REGIONAL, 2019-2035 (USD BILLIONS) TABLE
    292. . BRAZIL LOW CARBON HYDROGEN MARKET SIZE ESTIMATES & FORECAST, BY PROCESS, 2019-2035 (USD BILLIONS) TABLE
    293. . BRAZIL LOW CARBON HYDROGEN MARKET SIZE ESTIMATES & FORECAST, BY ENERGY SOURCE, 2019-2035 (USD BILLIONS) TABLE
    294. . BRAZIL LOW CARBON HYDROGEN MARKET SIZE ESTIMATES & FORECAST, BY END-PRODUCT, 2019-2035 (USD BILLIONS) TABLE
    295. . BRAZIL LOW CARBON HYDROGEN MARKET SIZE ESTIMATES & FORECAST, BY REGIONAL, 2019-2035 (USD BILLIONS) TABLE
    296. . MEXICO LOW CARBON HYDROGEN MARKET SIZE ESTIMATES & FORECAST, BY PROCESS, 2019-2035 (USD BILLIONS) TABLE
    297. . MEXICO LOW CARBON HYDROGEN MARKET SIZE ESTIMATES & FORECAST, BY ENERGY SOURCE, 2019-2035 (USD BILLIONS) TABLE
    298. . MEXICO LOW CARBON HYDROGEN MARKET SIZE ESTIMATES & FORECAST, BY END-PRODUCT, 2019-2035 (USD BILLIONS) TABLE
    299. . MEXICO LOW CARBON HYDROGEN MARKET SIZE ESTIMATES & FORECAST, BY REGIONAL, 2019-2035 (USD BILLIONS) TABLE
    300. . ARGENTINA LOW CARBON HYDROGEN MARKET SIZE ESTIMATES & FORECAST, BY PROCESS, 2019-2035 (USD BILLIONS) TABLE
    301. . ARGENTINA LOW CARBON HYDROGEN MARKET SIZE ESTIMATES & FORECAST, BY ENERGY SOURCE, 2019-2035 (USD BILLIONS) TABLE
    302. . ARGENTINA LOW CARBON HYDROGEN MARKET SIZE ESTIMATES & FORECAST, BY END-PRODUCT, 2019-2035 (USD BILLIONS) TABLE
    303. . ARGENTINA LOW CARBON HYDROGEN MARKET SIZE ESTIMATES & FORECAST, BY REGIONAL, 2019-2035 (USD BILLIONS) TABLE
    304. . REST OF SOUTH AMERICA LOW CARBON HYDROGEN MARKET SIZE ESTIMATES & FORECAST, BY PROCESS, 2019-2035 (USD BILLIONS) TABLE
    305. . REST OF SOUTH AMERICA LOW CARBON HYDROGEN MARKET SIZE ESTIMATES & FORECAST, BY ENERGY SOURCE, 2019-2035 (USD BILLIONS) TABLE
    306. . REST OF SOUTH AMERICA LOW CARBON HYDROGEN MARKET SIZE ESTIMATES & FORECAST, BY END-PRODUCT, 2019-2035 (USD BILLIONS) TABLE
    307. . REST OF SOUTH AMERICA LOW CARBON HYDROGEN MARKET SIZE ESTIMATES & FORECAST, BY REGIONAL, 2019-2035 (USD BILLIONS) TABLE
    308. . MEA LOW CARBON HYDROGEN MARKET SIZE ESTIMATES & FORECAST, BY PROCESS, 2019-2035 (USD BILLIONS) TABLE
    309. . MEA LOW CARBON HYDROGEN MARKET SIZE ESTIMATES & FORECAST, BY ENERGY SOURCE, 2019-2035 (USD BILLIONS) TABLE
    310. . MEA LOW CARBON HYDROGEN MARKET SIZE ESTIMATES & FORECAST, BY END-PRODUCT, 2019-2035 (USD BILLIONS) TABLE
    311. . MEA LOW CARBON HYDROGEN MARKET SIZE ESTIMATES & FORECAST, BY REGIONAL, 2019-2035 (USD BILLIONS) TABLE
    312. . GCC COUNTRIES LOW CARBON HYDROGEN MARKET SIZE ESTIMATES & FORECAST, BY PROCESS, 2019-2035 (USD BILLIONS) TABLE
    313. . GCC COUNTRIES LOW CARBON HYDROGEN MARKET SIZE ESTIMATES & FORECAST, BY ENERGY SOURCE, 2019-2035 (USD BILLIONS) TABLE
    314. . GCC COUNTRIES LOW CARBON HYDROGEN MARKET SIZE ESTIMATES & FORECAST, BY END-PRODUCT, 2019-2035 (USD BILLIONS) TABLE
    315. . GCC COUNTRIES LOW CARBON HYDROGEN MARKET SIZE ESTIMATES & FORECAST, BY REGIONAL, 2019-2035 (USD BILLIONS) TABLE
    316. . SOUTH AFRICA LOW CARBON HYDROGEN MARKET SIZE ESTIMATES & FORECAST, BY PROCESS, 2019-2035 (USD BILLIONS) TABLE
    317. . SOUTH AFRICA LOW CARBON HYDROGEN MARKET SIZE ESTIMATES & FORECAST, BY ENERGY SOURCE, 2019-2035 (USD BILLIONS) TABLE
    318. . SOUTH AFRICA LOW CARBON HYDROGEN MARKET SIZE ESTIMATES & FORECAST, BY END-PRODUCT, 2019-2035 (USD BILLIONS) TABLE
    319. . SOUTH AFRICA LOW CARBON HYDROGEN MARKET SIZE ESTIMATES & FORECAST, BY REGIONAL, 2019-2035 (USD BILLIONS) TABLE
    320. . REST OF MEA LOW CARBON HYDROGEN MARKET SIZE ESTIMATES & FORECAST, BY PROCESS, 2019-2035 (USD BILLIONS) TABLE
    321. . REST OF MEA LOW CARBON HYDROGEN MARKET SIZE ESTIMATES & FORECAST, BY ENERGY SOURCE, 2019-2035 (USD BILLIONS) TABLE
    322. . REST OF MEA LOW CARBON HYDROGEN MARKET SIZE ESTIMATES & FORECAST, BY END-PRODUCT, 2019-2035 (USD BILLIONS) TABLE
    323. . REST OF MEA LOW CARBON HYDROGEN MARKET SIZE ESTIMATES & FORECAST, BY REGIONAL, 2019-2035 (USD BILLIONS) TABLE
    324. . PRODUCT LAUNCH/PRODUCT DEVELOPMENT/APPROVAL TABLE
    325. . ACQUISITION/PARTNERSHIP LIST OF FIGURES FIGURE
    326. . MARKET SYNOPSIS FIGURE
    327. . NORTH AMERICA LOW CARBON HYDROGEN MARKET ANALYSIS FIGURE
    328. . US LOW CARBON HYDROGEN MARKET ANALYSIS BY PROCESS FIGURE
    329. . US LOW CARBON HYDROGEN MARKET ANALYSIS BY ENERGY SOURCE FIGURE
    330. . US LOW CARBON HYDROGEN MARKET ANALYSIS BY END-PRODUCT FIGURE
    331. . US LOW CARBON HYDROGEN MARKET ANALYSIS BY REGIONAL FIGURE
    332. . CANADA LOW CARBON HYDROGEN MARKET ANALYSIS BY PROCESS FIGURE
    333. . CANADA LOW CARBON HYDROGEN MARKET ANALYSIS BY ENERGY SOURCE FIGURE
    334. . CANADA LOW CARBON HYDROGEN MARKET ANALYSIS BY END-PRODUCT FIGURE
    335. . CANADA LOW CARBON HYDROGEN MARKET ANALYSIS BY REGIONAL FIGURE
    336. . EUROPE LOW CARBON HYDROGEN MARKET ANALYSIS FIGURE
    337. . GERMANY LOW CARBON HYDROGEN MARKET ANALYSIS BY PROCESS FIGURE
    338. . GERMANY LOW CARBON HYDROGEN MARKET ANALYSIS BY ENERGY SOURCE FIGURE
    339. . GERMANY LOW CARBON HYDROGEN MARKET ANALYSIS BY END-PRODUCT FIGURE
    340. . GERMANY LOW CARBON HYDROGEN MARKET ANALYSIS BY REGIONAL FIGURE
    341. . UK LOW CARBON HYDROGEN MARKET ANALYSIS BY PROCESS FIGURE
    342. . UK LOW CARBON HYDROGEN MARKET ANALYSIS BY ENERGY SOURCE FIGURE
    343. . UK LOW CARBON HYDROGEN MARKET ANALYSIS BY END-PRODUCT FIGURE
    344. . UK LOW CARBON HYDROGEN MARKET ANALYSIS BY REGIONAL FIGURE
    345. . FRANCE LOW CARBON HYDROGEN MARKET ANALYSIS BY PROCESS FIGURE
    346. . FRANCE LOW CARBON HYDROGEN MARKET ANALYSIS BY ENERGY SOURCE FIGURE
    347. . FRANCE LOW CARBON HYDROGEN MARKET ANALYSIS BY END-PRODUCT FIGURE
    348. . FRANCE LOW CARBON HYDROGEN MARKET ANALYSIS BY REGIONAL FIGURE
    349. . RUSSIA LOW CARBON HYDROGEN MARKET ANALYSIS BY PROCESS FIGURE
    350. . RUSSIA LOW CARBON HYDROGEN MARKET ANALYSIS BY ENERGY SOURCE FIGURE
    351. . RUSSIA LOW CARBON HYDROGEN MARKET ANALYSIS BY END-PRODUCT FIGURE
    352. . RUSSIA LOW CARBON HYDROGEN MARKET ANALYSIS BY REGIONAL FIGURE
    353. . ITALY LOW CARBON HYDROGEN MARKET ANALYSIS BY PROCESS FIGURE
    354. . ITALY LOW CARBON HYDROGEN MARKET ANALYSIS BY ENERGY SOURCE FIGURE
    355. . ITALY LOW CARBON HYDROGEN MARKET ANALYSIS BY END-PRODUCT FIGURE
    356. . ITALY LOW CARBON HYDROGEN MARKET ANALYSIS BY REGIONAL FIGURE
    357. . SPAIN LOW CARBON HYDROGEN MARKET ANALYSIS BY PROCESS FIGURE
    358. . SPAIN LOW CARBON HYDROGEN MARKET ANALYSIS BY ENERGY SOURCE FIGURE
    359. . SPAIN LOW CARBON HYDROGEN MARKET ANALYSIS BY END-PRODUCT FIGURE
    360. . SPAIN LOW CARBON HYDROGEN MARKET ANALYSIS BY REGIONAL FIGURE
    361. . REST OF EUROPE LOW CARBON HYDROGEN MARKET ANALYSIS BY PROCESS FIGURE
    362. . REST OF EUROPE LOW CARBON HYDROGEN MARKET ANALYSIS BY ENERGY SOURCE FIGURE
    363. . REST OF EUROPE LOW CARBON HYDROGEN MARKET ANALYSIS BY END-PRODUCT FIGURE
    364. . REST OF EUROPE LOW CARBON HYDROGEN MARKET ANALYSIS BY REGIONAL FIGURE
    365. . APAC LOW CARBON HYDROGEN MARKET ANALYSIS FIGURE
    366. . CHINA LOW CARBON HYDROGEN MARKET ANALYSIS BY PROCESS FIGURE
    367. . CHINA LOW CARBON HYDROGEN MARKET ANALYSIS BY ENERGY SOURCE FIGURE
    368. . CHINA LOW CARBON HYDROGEN MARKET ANALYSIS BY END-PRODUCT FIGURE
    369. . CHINA LOW CARBON HYDROGEN MARKET ANALYSIS BY REGIONAL FIGURE
    370. . INDIA LOW CARBON HYDROGEN MARKET ANALYSIS BY PROCESS FIGURE
    371. . INDIA LOW CARBON HYDROGEN MARKET ANALYSIS BY ENERGY SOURCE FIGURE
    372. . INDIA LOW CARBON HYDROGEN MARKET ANALYSIS BY END-PRODUCT FIGURE
    373. . INDIA LOW CARBON HYDROGEN MARKET ANALYSIS BY REGIONAL FIGURE
    374. . JAPAN LOW CARBON HYDROGEN MARKET ANALYSIS BY PROCESS FIGURE
    375. . JAPAN LOW CARBON HYDROGEN MARKET ANALYSIS BY ENERGY SOURCE FIGURE
    376. . JAPAN LOW CARBON HYDROGEN MARKET ANALYSIS BY END-PRODUCT FIGURE
    377. . JAPAN LOW CARBON HYDROGEN MARKET ANALYSIS BY REGIONAL FIGURE
    378. . SOUTH KOREA LOW CARBON HYDROGEN MARKET ANALYSIS BY PROCESS FIGURE
    379. . SOUTH KOREA LOW CARBON HYDROGEN MARKET ANALYSIS BY ENERGY SOURCE FIGURE
    380. . SOUTH KOREA LOW CARBON HYDROGEN MARKET ANALYSIS BY END-PRODUCT FIGURE
    381. . SOUTH KOREA LOW CARBON HYDROGEN MARKET ANALYSIS BY REGIONAL FIGURE
    382. . MALAYSIA LOW CARBON HYDROGEN MARKET ANALYSIS BY PROCESS FIGURE
    383. . MALAYSIA LOW CARBON HYDROGEN MARKET ANALYSIS BY ENERGY SOURCE FIGURE
    384. . MALAYSIA LOW CARBON HYDROGEN MARKET ANALYSIS BY END-PRODUCT FIGURE
    385. . MALAYSIA LOW CARBON HYDROGEN MARKET ANALYSIS BY REGIONAL FIGURE
    386. . THAILAND LOW CARBON HYDROGEN MARKET ANALYSIS BY PROCESS FIGURE
    387. . THAILAND LOW CARBON HYDROGEN MARKET ANALYSIS BY ENERGY SOURCE FIGURE
    388. . THAILAND LOW CARBON HYDROGEN MARKET ANALYSIS BY END-PRODUCT FIGURE
    389. . THAILAND LOW CARBON HYDROGEN MARKET ANALYSIS BY REGIONAL FIGURE
    390. . INDONESIA LOW CARBON HYDROGEN MARKET ANALYSIS BY PROCESS FIGURE
    391. . INDONESIA LOW CARBON HYDROGEN MARKET ANALYSIS BY ENERGY SOURCE FIGURE
    392. . INDONESIA LOW CARBON HYDROGEN MARKET ANALYSIS BY END-PRODUCT FIGURE
    393. . INDONESIA LOW CARBON HYDROGEN MARKET ANALYSIS BY REGIONAL FIGURE
    394. . REST OF APAC LOW CARBON HYDROGEN MARKET ANALYSIS BY PROCESS FIGURE
    395. . REST OF APAC LOW CARBON HYDROGEN MARKET ANALYSIS BY ENERGY SOURCE FIGURE
    396. . REST OF APAC LOW CARBON HYDROGEN MARKET ANALYSIS BY END-PRODUCT FIGURE
    397. . REST OF APAC LOW CARBON HYDROGEN MARKET ANALYSIS BY REGIONAL FIGURE
    398. . SOUTH AMERICA LOW CARBON HYDROGEN MARKET ANALYSIS FIGURE
    399. . BRAZIL LOW CARBON HYDROGEN MARKET ANALYSIS BY PROCESS FIGURE
    400. . BRAZIL LOW CARBON HYDROGEN MARKET ANALYSIS BY ENERGY SOURCE FIGURE
    401. . BRAZIL LOW CARBON HYDROGEN MARKET ANALYSIS BY END-PRODUCT FIGURE
    402. . BRAZIL LOW CARBON HYDROGEN MARKET ANALYSIS BY REGIONAL FIGURE
    403. . MEXICO LOW CARBON HYDROGEN MARKET ANALYSIS BY PROCESS FIGURE
    404. . MEXICO LOW CARBON HYDROGEN MARKET ANALYSIS BY ENERGY SOURCE FIGURE
    405. . MEXICO LOW CARBON HYDROGEN MARKET ANALYSIS BY END-PRODUCT FIGURE
    406. . MEXICO LOW CARBON HYDROGEN MARKET ANALYSIS BY REGIONAL FIGURE
    407. . ARGENTINA LOW CARBON HYDROGEN MARKET ANALYSIS BY PROCESS FIGURE
    408. . ARGENTINA LOW CARBON HYDROGEN MARKET ANALYSIS BY ENERGY SOURCE FIGURE
    409. . ARGENTINA LOW CARBON HYDROGEN MARKET ANALYSIS BY END-PRODUCT FIGURE
    410. . ARGENTINA LOW CARBON HYDROGEN MARKET ANALYSIS BY REGIONAL FIGURE
    411. . REST OF SOUTH AMERICA LOW CARBON HYDROGEN MARKET ANALYSIS BY PROCESS FIGURE
    412. . REST OF SOUTH AMERICA LOW CARBON HYDROGEN MARKET ANALYSIS BY ENERGY SOURCE FIGURE
    413. . REST OF SOUTH AMERICA LOW CARBON HYDROGEN MARKET ANALYSIS BY END-PRODUCT FIGURE
    414. . REST OF SOUTH AMERICA LOW CARBON HYDROGEN MARKET ANALYSIS BY REGIONAL FIGURE
    415. . MEA LOW CARBON HYDROGEN MARKET ANALYSIS FIGURE
    416. . GCC COUNTRIES LOW CARBON HYDROGEN MARKET ANALYSIS BY PROCESS FIGURE
    417. . GCC COUNTRIES LOW CARBON HYDROGEN MARKET ANALYSIS BY ENERGY SOURCE FIGURE
    418. . GCC COUNTRIES LOW CARBON HYDROGEN MARKET ANALYSIS BY END-PRODUCT FIGURE
    419. . GCC COUNTRIES LOW CARBON HYDROGEN MARKET ANALYSIS BY REGIONAL FIGURE
    420. . SOUTH AFRICA LOW CARBON HYDROGEN MARKET ANALYSIS BY PROCESS FIGURE
    421. . SOUTH AFRICA LOW CARBON HYDROGEN MARKET ANALYSIS BY ENERGY SOURCE FIGURE
    422. . SOUTH AFRICA LOW CARBON HYDROGEN MARKET ANALYSIS BY END-PRODUCT FIGURE
    423. . SOUTH AFRICA LOW CARBON HYDROGEN MARKET ANALYSIS BY REGIONAL FIGURE
    424. . REST OF MEA LOW CARBON HYDROGEN MARKET ANALYSIS BY PROCESS FIGURE
    425. . REST OF MEA LOW CARBON HYDROGEN MARKET ANALYSIS BY ENERGY SOURCE FIGURE
    426. . REST OF MEA LOW CARBON HYDROGEN MARKET ANALYSIS BY END-PRODUCT FIGURE
    427. . REST OF MEA LOW CARBON HYDROGEN MARKET ANALYSIS BY REGIONAL FIGURE
    428. . KEY BUYING CRITERIA OF LOW CARBON HYDROGEN MARKET FIGURE
    429. . RESEARCH PROCESS OF MRFR FIGURE
    430. . DRO ANALYSIS OF LOW CARBON HYDROGEN MARKET FIGURE
    431. . DRIVERS IMPACT ANALYSIS: LOW CARBON HYDROGEN MARKET FIGURE
    432. . RESTRAINTS IMPACT ANALYSIS: LOW CARBON HYDROGEN MARKET FIGURE
    433. . SUPPLY / VALUE CHAIN: LOW CARBON HYDROGEN MARKET FIGURE
    434. . LOW CARBON HYDROGEN MARKET, BY PROCESS, 2025 (% SHARE) FIGURE
    435. . LOW CARBON HYDROGEN MARKET, BY PROCESS, 2019 TO 2035 (USD Billions) FIGURE
    436. . LOW CARBON HYDROGEN MARKET, BY ENERGY SOURCE, 2025 (% SHARE) FIGURE
    437. . LOW CARBON HYDROGEN MARKET, BY ENERGY SOURCE, 2019 TO 2035 (USD Billions) FIGURE
    438. . LOW CARBON HYDROGEN MARKET, BY END-PRODUCT, 2025 (% SHARE) FIGURE
    439. . LOW CARBON HYDROGEN MARKET, BY END-PRODUCT, 2019 TO 2035 (USD Billions) FIGURE
    440. . LOW CARBON HYDROGEN MARKET, BY REGIONAL, 2025 (% SHARE) FIGURE
    441. . LOW CARBON HYDROGEN MARKET, BY REGIONAL, 2019 TO 2035 (USD Billions) FIGURE
    442. . BENCHMARKING OF MAJOR COMPETITORS
    443. List of Tables and Figures
      1. Table FIGURE 1. MARKET SYNOPSIS FIGURE 2. NORTH AMERICA LOW CARBON HYDROGEN MARKET ANALYSIS FIGURE 3. US LOW CARBON HYDROGEN MARKET ANALYSIS BY PROCESS FIGURE 4. US LOW CARBON HYDROGEN MARKET ANALYSIS BY ENERGY SOURCE FIGURE 5. US LOW CARBON HYDROGEN MARKET ANALYSIS BY END-PRODUCT FIGURE 6. US LOW CARBON HYDROGEN MARKET ANALYSIS BY REGIONAL FIGURE 7. CANADA LOW CARBON HYDROGEN MARKET ANALYSIS BY PROCESS FIGURE 8. CANADA LOW CARBON HYDROGEN MARKET ANALYSIS BY ENERGY SOURCE FIGURE 9. CANADA LOW CARBON HYDROGEN MARKET ANALYSIS BY END-PRODUCT FIGURE 10. CANADA LOW CARBON HYDROGEN MARKET ANALYSIS BY REGIONAL FIGURE 11. EUROPE LOW CARBON HYDROGEN MARKET ANALYSIS FIGURE 12. GERMANY LOW CARBON HYDROGEN MARKET ANALYSIS BY PROCESS FIGURE 13. GERMANY LOW CARBON HYDROGEN MARKET ANALYSIS BY ENERGY SOURCE FIGURE 14. GERMANY LOW CARBON HYDROGEN MARKET ANALYSIS BY END-PRODUCT FIGURE 15. GERMANY LOW CARBON HYDROGEN MARKET ANALYSIS BY REGIONAL FIGURE 16. UK LOW CARBON HYDROGEN MARKET ANALYSIS BY PROCESS FIGURE 17. UK LOW CARBON HYDROGEN MARKET ANALYSIS BY ENERGY SOURCE FIGURE 18. UK LOW CARBON HYDROGEN MARKET ANALYSIS BY END-PRODUCT FIGURE 19. UK LOW CARBON HYDROGEN MARKET ANALYSIS BY REGIONAL FIGURE 20. FRANCE LOW CARBON HYDROGEN MARKET ANALYSIS BY PROCESS FIGURE 21. FRANCE LOW CARBON HYDROGEN MARKET ANALYSIS BY ENERGY SOURCE FIGURE 22. FRANCE LOW CARBON HYDROGEN MARKET ANALYSIS BY END-PRODUCT FIGURE 23. FRANCE LOW CARBON HYDROGEN MARKET ANALYSIS BY REGIONAL FIGURE 24. RUSSIA LOW CARBON HYDROGEN MARKET ANALYSIS BY PROCESS FIGURE 25. RUSSIA LOW CARBON HYDROGEN MARKET ANALYSIS BY ENERGY SOURCE FIGURE 26. RUSSIA LOW CARBON HYDROGEN MARKET ANALYSIS BY END-PRODUCT FIGURE 27. RUSSIA LOW CARBON HYDROGEN MARKET ANALYSIS BY REGIONAL FIGURE 28. ITALY LOW CARBON HYDROGEN MARKET ANALYSIS BY PROCESS FIGURE 29. ITALY LOW CARBON HYDROGEN MARKET ANALYSIS BY ENERGY SOURCE FIGURE 30. ITALY LOW CARBON HYDROGEN MARKET ANALYSIS BY END-PRODUCT FIGURE 31. ITALY LOW CARBON HYDROGEN MARKET ANALYSIS BY REGIONAL FIGURE 32. SPAIN LOW CARBON HYDROGEN MARKET ANALYSIS BY PROCESS FIGURE 33. SPAIN LOW CARBON HYDROGEN MARKET ANALYSIS BY ENERGY SOURCE FIGURE 34. SPAIN LOW CARBON HYDROGEN MARKET ANALYSIS BY END-PRODUCT FIGURE 35. SPAIN LOW CARBON HYDROGEN MARKET ANALYSIS BY REGIONAL FIGURE 36. REST OF EUROPE LOW CARBON HYDROGEN MARKET ANALYSIS BY PROCESS FIGURE 37. REST OF EUROPE LOW CARBON HYDROGEN MARKET ANALYSIS BY ENERGY SOURCE FIGURE 38. REST OF EUROPE LOW CARBON HYDROGEN MARKET ANALYSIS BY END-PRODUCT FIGURE 39. REST OF EUROPE LOW CARBON HYDROGEN MARKET ANALYSIS BY REGIONAL FIGURE 40. APAC LOW CARBON HYDROGEN MARKET ANALYSIS FIGURE 41. CHINA LOW CARBON HYDROGEN MARKET ANALYSIS BY PROCESS FIGURE 42. CHINA LOW CARBON HYDROGEN MARKET ANALYSIS BY ENERGY SOURCE FIGURE 43. CHINA LOW CARBON HYDROGEN MARKET ANALYSIS BY END-PRODUCT FIGURE 44. CHINA LOW CARBON HYDROGEN MARKET ANALYSIS BY REGIONAL FIGURE 45. INDIA LOW CARBON HYDROGEN MARKET ANALYSIS BY PROCESS FIGURE 46. INDIA LOW CARBON HYDROGEN MARKET ANALYSIS BY ENERGY SOURCE FIGURE 47. INDIA LOW CARBON HYDROGEN MARKET ANALYSIS BY END-PRODUCT FIGURE 48. INDIA LOW CARBON HYDROGEN MARKET ANALYSIS BY REGIONAL FIGURE 49. JAPAN LOW CARBON HYDROGEN MARKET ANALYSIS BY PROCESS FIGURE 50. JAPAN LOW CARBON HYDROGEN MARKET ANALYSIS BY ENERGY SOURCE FIGURE 51. JAPAN LOW CARBON HYDROGEN MARKET ANALYSIS BY END-PRODUCT FIGURE 52. JAPAN LOW CARBON HYDROGEN MARKET ANALYSIS BY REGIONAL FIGURE 53. SOUTH KOREA LOW CARBON HYDROGEN MARKET ANALYSIS BY PROCESS FIGURE 54. SOUTH KOREA LOW CARBON HYDROGEN MARKET ANALYSIS BY ENERGY SOURCE FIGURE 55. SOUTH KOREA LOW CARBON HYDROGEN MARKET ANALYSIS BY END-PRODUCT FIGURE 56. SOUTH KOREA LOW CARBON HYDROGEN MARKET ANALYSIS BY REGIONAL FIGURE 57. MALAYSIA LOW CARBON HYDROGEN MARKET ANALYSIS BY PROCESS FIGURE 58. MALAYSIA LOW CARBON HYDROGEN MARKET ANALYSIS BY ENERGY SOURCE FIGURE 59. MALAYSIA LOW CARBON HYDROGEN MARKET ANALYSIS BY END-PRODUCT FIGURE 60. MALAYSIA LOW CARBON HYDROGEN MARKET ANALYSIS BY REGIONAL FIGURE 61. THAILAND LOW CARBON HYDROGEN MARKET ANALYSIS BY PROCESS FIGURE 62. THAILAND LOW CARBON HYDROGEN MARKET ANALYSIS BY ENERGY SOURCE FIGURE 63. THAILAND LOW CARBON HYDROGEN MARKET ANALYSIS BY END-PRODUCT FIGURE 64. THAILAND LOW CARBON HYDROGEN MARKET ANALYSIS BY REGIONAL FIGURE 65. INDONESIA LOW CARBON HYDROGEN MARKET ANALYSIS BY PROCESS FIGURE 66. INDONESIA LOW CARBON HYDROGEN MARKET ANALYSIS BY ENERGY SOURCE FIGURE 67. INDONESIA LOW CARBON HYDROGEN MARKET ANALYSIS BY END-PRODUCT FIGURE 68. INDONESIA LOW CARBON HYDROGEN MARKET ANALYSIS BY REGIONAL FIGURE 69. REST OF APAC LOW CARBON HYDROGEN MARKET ANALYSIS BY PROCESS FIGURE 70. REST OF APAC LOW CARBON HYDROGEN MARKET ANALYSIS BY ENERGY SOURCE FIGURE 71. REST OF APAC LOW CARBON HYDROGEN MARKET ANALYSIS BY END-PRODUCT FIGURE 72. REST OF APAC LOW CARBON HYDROGEN MARKET ANALYSIS BY REGIONAL FIGURE 73. SOUTH AMERICA LOW CARBON HYDROGEN MARKET ANALYSIS FIGURE 74. BRAZIL LOW CARBON HYDROGEN MARKET ANALYSIS BY PROCESS FIGURE 75. BRAZIL LOW CARBON HYDROGEN MARKET ANALYSIS BY ENERGY SOURCE FIGURE 76. BRAZIL LOW CARBON HYDROGEN MARKET ANALYSIS BY END-PRODUCT FIGURE 77. BRAZIL LOW CARBON HYDROGEN MARKET ANALYSIS BY REGIONAL FIGURE 78. MEXICO LOW CARBON HYDROGEN MARKET ANALYSIS BY PROCESS FIGURE 79. MEXICO LOW CARBON HYDROGEN MARKET ANALYSIS BY ENERGY SOURCE FIGURE 80. MEXICO LOW CARBON HYDROGEN MARKET ANALYSIS BY END-PRODUCT FIGURE 81. MEXICO LOW CARBON HYDROGEN MARKET ANALYSIS BY REGIONAL FIGURE 82. ARGENTINA LOW CARBON HYDROGEN MARKET ANALYSIS BY PROCESS FIGURE 83. ARGENTINA LOW CARBON HYDROGEN MARKET ANALYSIS BY ENERGY SOURCE FIGURE 84. ARGENTINA LOW CARBON HYDROGEN MARKET ANALYSIS BY END-PRODUCT FIGURE 85. ARGENTINA LOW CARBON HYDROGEN MARKET ANALYSIS BY REGIONAL FIGURE 86. REST OF SOUTH AMERICA LOW CARBON HYDROGEN MARKET ANALYSIS BY PROCESS FIGURE 87. REST OF SOUTH AMERICA LOW CARBON HYDROGEN MARKET ANALYSIS BY ENERGY SOURCE FIGURE 88. REST OF SOUTH AMERICA LOW CARBON HYDROGEN MARKET ANALYSIS BY END-PRODUCT FIGURE 89. REST OF SOUTH AMERICA LOW CARBON HYDROGEN MARKET ANALYSIS BY REGIONAL FIGURE 90. MEA LOW CARBON HYDROGEN MARKET ANALYSIS FIGURE 91. GCC COUNTRIES LOW CARBON HYDROGEN MARKET ANALYSIS BY PROCESS FIGURE 92. GCC COUNTRIES LOW CARBON HYDROGEN MARKET ANALYSIS BY ENERGY SOURCE FIGURE 93. GCC COUNTRIES LOW CARBON HYDROGEN MARKET ANALYSIS BY END-PRODUCT FIGURE 94. GCC COUNTRIES LOW CARBON HYDROGEN MARKET ANALYSIS BY REGIONAL FIGURE 95. SOUTH AFRICA LOW CARBON HYDROGEN MARKET ANALYSIS BY PROCESS FIGURE 96. SOUTH AFRICA LOW CARBON HYDROGEN MARKET ANALYSIS BY ENERGY SOURCE FIGURE 97. SOUTH AFRICA LOW CARBON HYDROGEN MARKET ANALYSIS BY END-PRODUCT FIGURE 98. SOUTH AFRICA LOW CARBON HYDROGEN MARKET ANALYSIS BY REGIONAL FIGURE 99. REST OF MEA LOW CARBON HYDROGEN MARKET ANALYSIS BY PROCESS FIGURE 100. REST OF MEA LOW CARBON HYDROGEN MARKET ANALYSIS BY ENERGY SOURCE FIGURE 101. REST OF MEA LOW CARBON HYDROGEN MARKET ANALYSIS BY END-PRODUCT FIGURE 102. REST OF MEA LOW CARBON HYDROGEN MARKET ANALYSIS BY REGIONAL FIGURE 103. KEY BUYING CRITERIA OF LOW CARBON HYDROGEN MARKET FIGURE 104. RESEARCH PROCESS OF MRFR FIGURE 105. DRO ANALYSIS OF LOW CARBON HYDROGEN MARKET FIGURE 106. DRIVERS IMPACT ANALYSIS: LOW CARBON HYDROGEN MARKET FIGURE 107. RESTRAINTS IMPACT ANALYSIS: LOW CARBON HYDROGEN MARKET FIGURE 108. SUPPLY / VALUE CHAIN: LOW CARBON HYDROGEN MARKET FIGURE 109. LOW CARBON HYDROGEN MARKET, BY PROCESS, 2025 (% SHARE) FIGURE 110. LOW CARBON HYDROGEN MARKET, BY PROCESS, 2019 TO 2035 (USD Billions) FIGURE 111. LOW CARBON HYDROGEN MARKET, BY ENERGY SOURCE, 2025 (% SHARE) FIGURE 112. LOW CARBON HYDROGEN MARKET, BY ENERGY SOURCE, 2019 TO 2035 (USD Billions) FIGURE 113. LOW CARBON HYDROGEN MARKET, BY END-PRODUCT, 2025 (% SHARE) FIGURE 114. LOW CARBON HYDROGEN MARKET, BY END-PRODUCT, 2019 TO 2035 (USD Billions) FIGURE 115. LOW CARBON HYDROGEN MARKET, BY REGIONAL, 2025 (% SHARE) FIGURE 116. LOW CARBON HYDROGEN MARKET, BY REGIONAL, 2019 TO 2035 (USD Billions) FIGURE 117. BENCHMARKING OF MAJOR COMPETITORS
    444. Table FIGURE 1. MARKET SYNOPSIS FIGURE 2. NORTH AMERICA LOW CARBON HYDROGEN MARKET ANALYSIS FIGURE 3. US LOW CARBON HYDROGEN MARKET ANALYSIS BY PROCESS FIGURE 4. US LOW CARBON HYDROGEN MARKET ANALYSIS BY ENERGY SOURCE FIGURE 5. US LOW CARBON HYDROGEN MARKET ANALYSIS BY END-PRODUCT FIGURE 6. US LOW CARBON HYDROGEN MARKET ANALYSIS BY REGIONAL FIGURE 7. CANADA LOW CARBON HYDROGEN MARKET ANALYSIS BY PROCESS FIGURE 8. CANADA LOW CARBON HYDROGEN MARKET ANALYSIS BY ENERGY SOURCE FIGURE 9. CANADA LOW CARBON HYDROGEN MARKET ANALYSIS BY END-PRODUCT FIGURE 10. CANADA LOW CARBON HYDROGEN MARKET ANALYSIS BY REGIONAL FIGURE 11. EUROPE LOW CARBON HYDROGEN MARKET ANALYSIS FIGURE 12. GERMANY LOW CARBON HYDROGEN MARKET ANALYSIS BY PROCESS FIGURE 13. GERMANY LOW CARBON HYDROGEN MARKET ANALYSIS BY ENERGY SOURCE FIGURE 14. GERMANY LOW CARBON HYDROGEN MARKET ANALYSIS BY END-PRODUCT FIGURE 15. GERMANY LOW CARBON HYDROGEN MARKET ANALYSIS BY REGIONAL FIGURE 16. UK LOW CARBON HYDROGEN MARKET ANALYSIS BY PROCESS FIGURE 17. UK LOW CARBON HYDROGEN MARKET ANALYSIS BY ENERGY SOURCE FIGURE 18. UK LOW CARBON HYDROGEN MARKET ANALYSIS BY END-PRODUCT FIGURE 19. UK LOW CARBON HYDROGEN MARKET ANALYSIS BY REGIONAL FIGURE 20. FRANCE LOW CARBON HYDROGEN MARKET ANALYSIS BY PROCESS FIGURE 21. FRANCE LOW CARBON HYDROGEN MARKET ANALYSIS BY ENERGY SOURCE FIGURE 22. FRANCE LOW CARBON HYDROGEN MARKET ANALYSIS BY END-PRODUCT FIGURE 23. FRANCE LOW CARBON HYDROGEN MARKET ANALYSIS BY REGIONAL FIGURE 24. RUSSIA LOW CARBON HYDROGEN MARKET ANALYSIS BY PROCESS FIGURE 25. RUSSIA LOW CARBON HYDROGEN MARKET ANALYSIS BY ENERGY SOURCE FIGURE 26. RUSSIA LOW CARBON HYDROGEN MARKET ANALYSIS BY END-PRODUCT FIGURE 27. RUSSIA LOW CARBON HYDROGEN MARKET ANALYSIS BY REGIONAL FIGURE 28. ITALY LOW CARBON HYDROGEN MARKET ANALYSIS BY PROCESS FIGURE 29. ITALY LOW CARBON HYDROGEN MARKET ANALYSIS BY ENERGY SOURCE FIGURE 30. ITALY LOW CARBON HYDROGEN MARKET ANALYSIS BY END-PRODUCT FIGURE 31. ITALY LOW CARBON HYDROGEN MARKET ANALYSIS BY REGIONAL FIGURE 32. SPAIN LOW CARBON HYDROGEN MARKET ANALYSIS BY PROCESS FIGURE 33. SPAIN LOW CARBON HYDROGEN MARKET ANALYSIS BY ENERGY SOURCE FIGURE 34. SPAIN LOW CARBON HYDROGEN MARKET ANALYSIS BY END-PRODUCT FIGURE 35. SPAIN LOW CARBON HYDROGEN MARKET ANALYSIS BY REGIONAL FIGURE 36. REST OF EUROPE LOW CARBON HYDROGEN MARKET ANALYSIS BY PROCESS FIGURE 37. REST OF EUROPE LOW CARBON HYDROGEN MARKET ANALYSIS BY ENERGY SOURCE FIGURE 38. REST OF EUROPE LOW CARBON HYDROGEN MARKET ANALYSIS BY END-PRODUCT FIGURE 39. REST OF EUROPE LOW CARBON HYDROGEN MARKET ANALYSIS BY REGIONAL FIGURE 40. APAC LOW CARBON HYDROGEN MARKET ANALYSIS FIGURE 41. CHINA LOW CARBON HYDROGEN MARKET ANALYSIS BY PROCESS FIGURE 42. CHINA LOW CARBON HYDROGEN MARKET ANALYSIS BY ENERGY SOURCE FIGURE 43. CHINA LOW CARBON HYDROGEN MARKET ANALYSIS BY END-PRODUCT FIGURE 44. CHINA LOW CARBON HYDROGEN MARKET ANALYSIS BY REGIONAL FIGURE 45. INDIA LOW CARBON HYDROGEN MARKET ANALYSIS BY PROCESS FIGURE 46. INDIA LOW CARBON HYDROGEN MARKET ANALYSIS BY ENERGY SOURCE FIGURE 47. INDIA LOW CARBON HYDROGEN MARKET ANALYSIS BY END-PRODUCT FIGURE 48. INDIA LOW CARBON HYDROGEN MARKET ANALYSIS BY REGIONAL FIGURE 49. JAPAN LOW CARBON HYDROGEN MARKET ANALYSIS BY PROCESS FIGURE 50. JAPAN LOW CARBON HYDROGEN MARKET ANALYSIS BY ENERGY SOURCE FIGURE 51. JAPAN LOW CARBON HYDROGEN MARKET ANALYSIS BY END-PRODUCT FIGURE 52. JAPAN LOW CARBON HYDROGEN MARKET ANALYSIS BY REGIONAL FIGURE 53. SOUTH KOREA LOW CARBON HYDROGEN MARKET ANALYSIS BY PROCESS FIGURE 54. SOUTH KOREA LOW CARBON HYDROGEN MARKET ANALYSIS BY ENERGY SOURCE FIGURE 55. SOUTH KOREA LOW CARBON HYDROGEN MARKET ANALYSIS BY END-PRODUCT FIGURE 56. SOUTH KOREA LOW CARBON HYDROGEN MARKET ANALYSIS BY REGIONAL FIGURE 57. MALAYSIA LOW CARBON HYDROGEN MARKET ANALYSIS BY PROCESS FIGURE 58. MALAYSIA LOW CARBON HYDROGEN MARKET ANALYSIS BY ENERGY SOURCE FIGURE 59. MALAYSIA LOW CARBON HYDROGEN MARKET ANALYSIS BY END-PRODUCT FIGURE 60. MALAYSIA LOW CARBON HYDROGEN MARKET ANALYSIS BY REGIONAL FIGURE 61. THAILAND LOW CARBON HYDROGEN MARKET ANALYSIS BY PROCESS FIGURE 62. THAILAND LOW CARBON HYDROGEN MARKET ANALYSIS BY ENERGY SOURCE FIGURE 63. THAILAND LOW CARBON HYDROGEN MARKET ANALYSIS BY END-PRODUCT FIGURE 64. THAILAND LOW CARBON HYDROGEN MARKET ANALYSIS BY REGIONAL FIGURE 65. INDONESIA LOW CARBON HYDROGEN MARKET ANALYSIS BY PROCESS FIGURE 66. INDONESIA LOW CARBON HYDROGEN MARKET ANALYSIS BY ENERGY SOURCE FIGURE 67. INDONESIA LOW CARBON HYDROGEN MARKET ANALYSIS BY END-PRODUCT FIGURE 68. INDONESIA LOW CARBON HYDROGEN MARKET ANALYSIS BY REGIONAL FIGURE 69. REST OF APAC LOW CARBON HYDROGEN MARKET ANALYSIS BY PROCESS FIGURE 70. REST OF APAC LOW CARBON HYDROGEN MARKET ANALYSIS BY ENERGY SOURCE FIGURE 71. REST OF APAC LOW CARBON HYDROGEN MARKET ANALYSIS BY END-PRODUCT FIGURE 72. REST OF APAC LOW CARBON HYDROGEN MARKET ANALYSIS BY REGIONAL FIGURE 73. SOUTH AMERICA LOW CARBON HYDROGEN MARKET ANALYSIS FIGURE 74. BRAZIL LOW CARBON HYDROGEN MARKET ANALYSIS BY PROCESS FIGURE 75. BRAZIL LOW CARBON HYDROGEN MARKET ANALYSIS BY ENERGY SOURCE FIGURE 76. BRAZIL LOW CARBON HYDROGEN MARKET ANALYSIS BY END-PRODUCT FIGURE 77. BRAZIL LOW CARBON HYDROGEN MARKET ANALYSIS BY REGIONAL FIGURE 78. MEXICO LOW CARBON HYDROGEN MARKET ANALYSIS BY PROCESS FIGURE 79. MEXICO LOW CARBON HYDROGEN MARKET ANALYSIS BY ENERGY SOURCE FIGURE 80. MEXICO LOW CARBON HYDROGEN MARKET ANALYSIS BY END-PRODUCT FIGURE 81. MEXICO LOW CARBON HYDROGEN MARKET ANALYSIS BY REGIONAL FIGURE 82. ARGENTINA LOW CARBON HYDROGEN MARKET ANALYSIS BY PROCESS FIGURE 83. ARGENTINA LOW CARBON HYDROGEN MARKET ANALYSIS BY ENERGY SOURCE FIGURE 84. ARGENTINA LOW CARBON HYDROGEN MARKET ANALYSIS BY END-PRODUCT FIGURE 85. ARGENTINA LOW CARBON HYDROGEN MARKET ANALYSIS BY REGIONAL FIGURE 86. REST OF SOUTH AMERICA LOW CARBON HYDROGEN MARKET ANALYSIS BY PROCESS FIGURE 87. REST OF SOUTH AMERICA LOW CARBON HYDROGEN MARKET ANALYSIS BY ENERGY SOURCE FIGURE 88. REST OF SOUTH AMERICA LOW CARBON HYDROGEN MARKET ANALYSIS BY END-PRODUCT FIGURE 89. REST OF SOUTH AMERICA LOW CARBON HYDROGEN MARKET ANALYSIS BY REGIONAL FIGURE 90. MEA LOW CARBON HYDROGEN MARKET ANALYSIS FIGURE 91. GCC COUNTRIES LOW CARBON HYDROGEN MARKET ANALYSIS BY PROCESS FIGURE 92. GCC COUNTRIES LOW CARBON HYDROGEN MARKET ANALYSIS BY ENERGY SOURCE FIGURE 93. GCC COUNTRIES LOW CARBON HYDROGEN MARKET ANALYSIS BY END-PRODUCT FIGURE 94. GCC COUNTRIES LOW CARBON HYDROGEN MARKET ANALYSIS BY REGIONAL FIGURE 95. SOUTH AFRICA LOW CARBON HYDROGEN MARKET ANALYSIS BY PROCESS FIGURE 96. SOUTH AFRICA LOW CARBON HYDROGEN MARKET ANALYSIS BY ENERGY SOURCE FIGURE 97. SOUTH AFRICA LOW CARBON HYDROGEN MARKET ANALYSIS BY END-PRODUCT FIGURE 98. SOUTH AFRICA LOW CARBON HYDROGEN MARKET ANALYSIS BY REGIONAL FIGURE 99. REST OF MEA LOW CARBON HYDROGEN MARKET ANALYSIS BY PROCESS FIGURE 100. REST OF MEA LOW CARBON HYDROGEN MARKET ANALYSIS BY ENERGY SOURCE FIGURE 101. REST OF MEA LOW CARBON HYDROGEN MARKET ANALYSIS BY END-PRODUCT FIGURE 102. REST OF MEA LOW CARBON HYDROGEN MARKET ANALYSIS BY REGIONAL FIGURE 103. KEY BUYING CRITERIA OF LOW CARBON HYDROGEN MARKET FIGURE 104. RESEARCH PROCESS OF MRFR FIGURE 105. DRO ANALYSIS OF LOW CARBON HYDROGEN MARKET FIGURE 106. DRIVERS IMPACT ANALYSIS: LOW CARBON HYDROGEN MARKET FIGURE 107. RESTRAINTS IMPACT ANALYSIS: LOW CARBON HYDROGEN MARKET FIGURE 108. SUPPLY / VALUE CHAIN: LOW CARBON HYDROGEN MARKET FIGURE 109. LOW CARBON HYDROGEN MARKET, BY PROCESS, 2025 (% SHARE) FIGURE 110. LOW CARBON HYDROGEN MARKET, BY PROCESS, 2019 TO 2035 (USD Billions) FIGURE 111. LOW CARBON HYDROGEN MARKET, BY ENERGY SOURCE, 2025 (% SHARE) FIGURE 112. LOW CARBON HYDROGEN MARKET, BY ENERGY SOURCE, 2019 TO 2035 (USD Billions) FIGURE 113. LOW CARBON HYDROGEN MARKET, BY END-PRODUCT, 2025 (% SHARE) FIGURE 114. LOW CARBON HYDROGEN MARKET, BY END-PRODUCT, 2019 TO 2035 (USD Billions) FIGURE 115. LOW CARBON HYDROGEN MARKET, BY REGIONAL, 2025 (% SHARE) FIGURE 116. LOW CARBON HYDROGEN MARKET, BY REGIONAL, 2019 TO 2035 (USD Billions) FIGURE 117. BENCHMARKING OF MAJOR COMPETITORS

    Low Carbon Hydrogen Market Segmentation


    • Low Carbon Hydrogen Market By Process (USD Billion, 2019-2035)

      • Steam Methane Reforming (SMR)
      • Autothermal Reforming
      • Biomass Reforming
      • Electrolysis
      • Photo Electric Chemical (PEC) Water Splitting
      • Thermochemical Water Splitting
      • Biomass Gasification
      • Coal Gasification
      • Methane Pyrolysis


    • Low Carbon Hydrogen Market By Energy Source (USD Billion, 2019-2035)

      • Natural Gas
      • Solar
      • Wind
      • Hybrid
      • Biomass
      • Geothermal
      • Hydro Energy
      • Tidal


    • Low Carbon Hydrogen Market By End-Product (USD Billion, 2019-2035)

      • Hydrogen
      • Ammonia
      • Liquified Hydrogen
      • Methane
      • Methanol


    • Low Carbon Hydrogen Market By Regional (USD Billion, 2019-2035)

      • North America
      • Europe
      • South America
      • Asia Pacific
      • Middle East and Africa


    Low Carbon Hydrogen Market Regional Outlook (USD Billion, 2019-2035)


    • North America Outlook (USD Billion, 2019-2035)

      • North America Low Carbon Hydrogen Market by Process Type

        • Steam Methane Reforming (SMR)
        • Autothermal Reforming
        • Biomass Reforming
        • Electrolysis
        • Photo Electric Chemical (PEC) Water Splitting
        • Thermochemical Water Splitting
        • Biomass Gasification
        • Coal Gasification
        • Methane Pyrolysis
      • North America Low Carbon Hydrogen Market by Energy Source Type

        • Natural Gas
        • Solar
        • Wind
        • Hybrid
        • Biomass
        • Geothermal
        • Hydro Energy
        • Tidal
      • North America Low Carbon Hydrogen Market by End-Product Type

        • Hydrogen
        • Ammonia
        • Liquified Hydrogen
        • Methane
        • Methanol
      • North America Low Carbon Hydrogen Market by Regional Type

        • US
        • Canada
      • US Outlook (USD Billion, 2019-2035)
      • US Low Carbon Hydrogen Market by Process Type

        • Steam Methane Reforming (SMR)
        • Autothermal Reforming
        • Biomass Reforming
        • Electrolysis
        • Photo Electric Chemical (PEC) Water Splitting
        • Thermochemical Water Splitting
        • Biomass Gasification
        • Coal Gasification
        • Methane Pyrolysis
      • US Low Carbon Hydrogen Market by Energy Source Type

        • Natural Gas
        • Solar
        • Wind
        • Hybrid
        • Biomass
        • Geothermal
        • Hydro Energy
        • Tidal
      • US Low Carbon Hydrogen Market by End-Product Type

        • Hydrogen
        • Ammonia
        • Liquified Hydrogen
        • Methane
        • Methanol
      • CANADA Outlook (USD Billion, 2019-2035)
      • CANADA Low Carbon Hydrogen Market by Process Type

        • Steam Methane Reforming (SMR)
        • Autothermal Reforming
        • Biomass Reforming
        • Electrolysis
        • Photo Electric Chemical (PEC) Water Splitting
        • Thermochemical Water Splitting
        • Biomass Gasification
        • Coal Gasification
        • Methane Pyrolysis
      • CANADA Low Carbon Hydrogen Market by Energy Source Type

        • Natural Gas
        • Solar
        • Wind
        • Hybrid
        • Biomass
        • Geothermal
        • Hydro Energy
        • Tidal
      • CANADA Low Carbon Hydrogen Market by End-Product Type

        • Hydrogen
        • Ammonia
        • Liquified Hydrogen
        • Methane
        • Methanol
    • Europe Outlook (USD Billion, 2019-2035)

      • Europe Low Carbon Hydrogen Market by Process Type

        • Steam Methane Reforming (SMR)
        • Autothermal Reforming
        • Biomass Reforming
        • Electrolysis
        • Photo Electric Chemical (PEC) Water Splitting
        • Thermochemical Water Splitting
        • Biomass Gasification
        • Coal Gasification
        • Methane Pyrolysis
      • Europe Low Carbon Hydrogen Market by Energy Source Type

        • Natural Gas
        • Solar
        • Wind
        • Hybrid
        • Biomass
        • Geothermal
        • Hydro Energy
        • Tidal
      • Europe Low Carbon Hydrogen Market by End-Product Type

        • Hydrogen
        • Ammonia
        • Liquified Hydrogen
        • Methane
        • Methanol
      • Europe Low Carbon Hydrogen Market by Regional Type

        • Germany
        • UK
        • France
        • Russia
        • Italy
        • Spain
        • Rest of Europe
      • GERMANY Outlook (USD Billion, 2019-2035)
      • GERMANY Low Carbon Hydrogen Market by Process Type

        • Steam Methane Reforming (SMR)
        • Autothermal Reforming
        • Biomass Reforming
        • Electrolysis
        • Photo Electric Chemical (PEC) Water Splitting
        • Thermochemical Water Splitting
        • Biomass Gasification
        • Coal Gasification
        • Methane Pyrolysis
      • GERMANY Low Carbon Hydrogen Market by Energy Source Type

        • Natural Gas
        • Solar
        • Wind
        • Hybrid
        • Biomass
        • Geothermal
        • Hydro Energy
        • Tidal
      • GERMANY Low Carbon Hydrogen Market by End-Product Type

        • Hydrogen
        • Ammonia
        • Liquified Hydrogen
        • Methane
        • Methanol
      • UK Outlook (USD Billion, 2019-2035)
      • UK Low Carbon Hydrogen Market by Process Type

        • Steam Methane Reforming (SMR)
        • Autothermal Reforming
        • Biomass Reforming
        • Electrolysis
        • Photo Electric Chemical (PEC) Water Splitting
        • Thermochemical Water Splitting
        • Biomass Gasification
        • Coal Gasification
        • Methane Pyrolysis
      • UK Low Carbon Hydrogen Market by Energy Source Type

        • Natural Gas
        • Solar
        • Wind
        • Hybrid
        • Biomass
        • Geothermal
        • Hydro Energy
        • Tidal
      • UK Low Carbon Hydrogen Market by End-Product Type

        • Hydrogen
        • Ammonia
        • Liquified Hydrogen
        • Methane
        • Methanol
      • FRANCE Outlook (USD Billion, 2019-2035)
      • FRANCE Low Carbon Hydrogen Market by Process Type

        • Steam Methane Reforming (SMR)
        • Autothermal Reforming
        • Biomass Reforming
        • Electrolysis
        • Photo Electric Chemical (PEC) Water Splitting
        • Thermochemical Water Splitting
        • Biomass Gasification
        • Coal Gasification
        • Methane Pyrolysis
      • FRANCE Low Carbon Hydrogen Market by Energy Source Type

        • Natural Gas
        • Solar
        • Wind
        • Hybrid
        • Biomass
        • Geothermal
        • Hydro Energy
        • Tidal
      • FRANCE Low Carbon Hydrogen Market by End-Product Type

        • Hydrogen
        • Ammonia
        • Liquified Hydrogen
        • Methane
        • Methanol
      • RUSSIA Outlook (USD Billion, 2019-2035)
      • RUSSIA Low Carbon Hydrogen Market by Process Type

        • Steam Methane Reforming (SMR)
        • Autothermal Reforming
        • Biomass Reforming
        • Electrolysis
        • Photo Electric Chemical (PEC) Water Splitting
        • Thermochemical Water Splitting
        • Biomass Gasification
        • Coal Gasification
        • Methane Pyrolysis
      • RUSSIA Low Carbon Hydrogen Market by Energy Source Type

        • Natural Gas
        • Solar
        • Wind
        • Hybrid
        • Biomass
        • Geothermal
        • Hydro Energy
        • Tidal
      • RUSSIA Low Carbon Hydrogen Market by End-Product Type

        • Hydrogen
        • Ammonia
        • Liquified Hydrogen
        • Methane
        • Methanol
      • ITALY Outlook (USD Billion, 2019-2035)
      • ITALY Low Carbon Hydrogen Market by Process Type

        • Steam Methane Reforming (SMR)
        • Autothermal Reforming
        • Biomass Reforming
        • Electrolysis
        • Photo Electric Chemical (PEC) Water Splitting
        • Thermochemical Water Splitting
        • Biomass Gasification
        • Coal Gasification
        • Methane Pyrolysis
      • ITALY Low Carbon Hydrogen Market by Energy Source Type

        • Natural Gas
        • Solar
        • Wind
        • Hybrid
        • Biomass
        • Geothermal
        • Hydro Energy
        • Tidal
      • ITALY Low Carbon Hydrogen Market by End-Product Type

        • Hydrogen
        • Ammonia
        • Liquified Hydrogen
        • Methane
        • Methanol
      • SPAIN Outlook (USD Billion, 2019-2035)
      • SPAIN Low Carbon Hydrogen Market by Process Type

        • Steam Methane Reforming (SMR)
        • Autothermal Reforming
        • Biomass Reforming
        • Electrolysis
        • Photo Electric Chemical (PEC) Water Splitting
        • Thermochemical Water Splitting
        • Biomass Gasification
        • Coal Gasification
        • Methane Pyrolysis
      • SPAIN Low Carbon Hydrogen Market by Energy Source Type

        • Natural Gas
        • Solar
        • Wind
        • Hybrid
        • Biomass
        • Geothermal
        • Hydro Energy
        • Tidal
      • SPAIN Low Carbon Hydrogen Market by End-Product Type

        • Hydrogen
        • Ammonia
        • Liquified Hydrogen
        • Methane
        • Methanol
      • REST OF EUROPE Outlook (USD Billion, 2019-2035)
      • REST OF EUROPE Low Carbon Hydrogen Market by Process Type

        • Steam Methane Reforming (SMR)
        • Autothermal Reforming
        • Biomass Reforming
        • Electrolysis
        • Photo Electric Chemical (PEC) Water Splitting
        • Thermochemical Water Splitting
        • Biomass Gasification
        • Coal Gasification
        • Methane Pyrolysis
      • REST OF EUROPE Low Carbon Hydrogen Market by Energy Source Type

        • Natural Gas
        • Solar
        • Wind
        • Hybrid
        • Biomass
        • Geothermal
        • Hydro Energy
        • Tidal
      • REST OF EUROPE Low Carbon Hydrogen Market by End-Product Type

        • Hydrogen
        • Ammonia
        • Liquified Hydrogen
        • Methane
        • Methanol
    • APAC Outlook (USD Billion, 2019-2035)

      • APAC Low Carbon Hydrogen Market by Process Type

        • Steam Methane Reforming (SMR)
        • Autothermal Reforming
        • Biomass Reforming
        • Electrolysis
        • Photo Electric Chemical (PEC) Water Splitting
        • Thermochemical Water Splitting
        • Biomass Gasification
        • Coal Gasification
        • Methane Pyrolysis
      • APAC Low Carbon Hydrogen Market by Energy Source Type

        • Natural Gas
        • Solar
        • Wind
        • Hybrid
        • Biomass
        • Geothermal
        • Hydro Energy
        • Tidal
      • APAC Low Carbon Hydrogen Market by End-Product Type

        • Hydrogen
        • Ammonia
        • Liquified Hydrogen
        • Methane
        • Methanol
      • APAC Low Carbon Hydrogen Market by Regional Type

        • China
        • India
        • Japan
        • South Korea
        • Malaysia
        • Thailand
        • Indonesia
        • Rest of APAC
      • CHINA Outlook (USD Billion, 2019-2035)
      • CHINA Low Carbon Hydrogen Market by Process Type

        • Steam Methane Reforming (SMR)
        • Autothermal Reforming
        • Biomass Reforming
        • Electrolysis
        • Photo Electric Chemical (PEC) Water Splitting
        • Thermochemical Water Splitting
        • Biomass Gasification
        • Coal Gasification
        • Methane Pyrolysis
      • CHINA Low Carbon Hydrogen Market by Energy Source Type

        • Natural Gas
        • Solar
        • Wind
        • Hybrid
        • Biomass
        • Geothermal
        • Hydro Energy
        • Tidal
      • CHINA Low Carbon Hydrogen Market by End-Product Type

        • Hydrogen
        • Ammonia
        • Liquified Hydrogen
        • Methane
        • Methanol
      • INDIA Outlook (USD Billion, 2019-2035)
      • INDIA Low Carbon Hydrogen Market by Process Type

        • Steam Methane Reforming (SMR)
        • Autothermal Reforming
        • Biomass Reforming
        • Electrolysis
        • Photo Electric Chemical (PEC) Water Splitting
        • Thermochemical Water Splitting
        • Biomass Gasification
        • Coal Gasification
        • Methane Pyrolysis
      • INDIA Low Carbon Hydrogen Market by Energy Source Type

        • Natural Gas
        • Solar
        • Wind
        • Hybrid
        • Biomass
        • Geothermal
        • Hydro Energy
        • Tidal
      • INDIA Low Carbon Hydrogen Market by End-Product Type

        • Hydrogen
        • Ammonia
        • Liquified Hydrogen
        • Methane
        • Methanol
      • JAPAN Outlook (USD Billion, 2019-2035)
      • JAPAN Low Carbon Hydrogen Market by Process Type

        • Steam Methane Reforming (SMR)
        • Autothermal Reforming
        • Biomass Reforming
        • Electrolysis
        • Photo Electric Chemical (PEC) Water Splitting
        • Thermochemical Water Splitting
        • Biomass Gasification
        • Coal Gasification
        • Methane Pyrolysis
      • JAPAN Low Carbon Hydrogen Market by Energy Source Type

        • Natural Gas
        • Solar
        • Wind
        • Hybrid
        • Biomass
        • Geothermal
        • Hydro Energy
        • Tidal
      • JAPAN Low Carbon Hydrogen Market by End-Product Type

        • Hydrogen
        • Ammonia
        • Liquified Hydrogen
        • Methane
        • Methanol
      • SOUTH KOREA Outlook (USD Billion, 2019-2035)
      • SOUTH KOREA Low Carbon Hydrogen Market by Process Type

        • Steam Methane Reforming (SMR)
        • Autothermal Reforming
        • Biomass Reforming
        • Electrolysis
        • Photo Electric Chemical (PEC) Water Splitting
        • Thermochemical Water Splitting
        • Biomass Gasification
        • Coal Gasification
        • Methane Pyrolysis
      • SOUTH KOREA Low Carbon Hydrogen Market by Energy Source Type

        • Natural Gas
        • Solar
        • Wind
        • Hybrid
        • Biomass
        • Geothermal
        • Hydro Energy
        • Tidal
      • SOUTH KOREA Low Carbon Hydrogen Market by End-Product Type

        • Hydrogen
        • Ammonia
        • Liquified Hydrogen
        • Methane
        • Methanol
      • MALAYSIA Outlook (USD Billion, 2019-2035)
      • MALAYSIA Low Carbon Hydrogen Market by Process Type

        • Steam Methane Reforming (SMR)
        • Autothermal Reforming
        • Biomass Reforming
        • Electrolysis
        • Photo Electric Chemical (PEC) Water Splitting
        • Thermochemical Water Splitting
        • Biomass Gasification
        • Coal Gasification
        • Methane Pyrolysis
      • MALAYSIA Low Carbon Hydrogen Market by Energy Source Type

        • Natural Gas
        • Solar
        • Wind
        • Hybrid
        • Biomass
        • Geothermal
        • Hydro Energy
        • Tidal
      • MALAYSIA Low Carbon Hydrogen Market by End-Product Type

        • Hydrogen
        • Ammonia
        • Liquified Hydrogen
        • Methane
        • Methanol
      • THAILAND Outlook (USD Billion, 2019-2035)
      • THAILAND Low Carbon Hydrogen Market by Process Type

        • Steam Methane Reforming (SMR)
        • Autothermal Reforming
        • Biomass Reforming
        • Electrolysis
        • Photo Electric Chemical (PEC) Water Splitting
        • Thermochemical Water Splitting
        • Biomass Gasification
        • Coal Gasification
        • Methane Pyrolysis
      • THAILAND Low Carbon Hydrogen Market by Energy Source Type

        • Natural Gas
        • Solar
        • Wind
        • Hybrid
        • Biomass
        • Geothermal
        • Hydro Energy
        • Tidal
      • THAILAND Low Carbon Hydrogen Market by End-Product Type

        • Hydrogen
        • Ammonia
        • Liquified Hydrogen
        • Methane
        • Methanol
      • INDONESIA Outlook (USD Billion, 2019-2035)
      • INDONESIA Low Carbon Hydrogen Market by Process Type

        • Steam Methane Reforming (SMR)
        • Autothermal Reforming
        • Biomass Reforming
        • Electrolysis
        • Photo Electric Chemical (PEC) Water Splitting
        • Thermochemical Water Splitting
        • Biomass Gasification
        • Coal Gasification
        • Methane Pyrolysis
      • INDONESIA Low Carbon Hydrogen Market by Energy Source Type

        • Natural Gas
        • Solar
        • Wind
        • Hybrid
        • Biomass
        • Geothermal
        • Hydro Energy
        • Tidal
      • INDONESIA Low Carbon Hydrogen Market by End-Product Type

        • Hydrogen
        • Ammonia
        • Liquified Hydrogen
        • Methane
        • Methanol
      • REST OF APAC Outlook (USD Billion, 2019-2035)
      • REST OF APAC Low Carbon Hydrogen Market by Process Type

        • Steam Methane Reforming (SMR)
        • Autothermal Reforming
        • Biomass Reforming
        • Electrolysis
        • Photo Electric Chemical (PEC) Water Splitting
        • Thermochemical Water Splitting
        • Biomass Gasification
        • Coal Gasification
        • Methane Pyrolysis
      • REST OF APAC Low Carbon Hydrogen Market by Energy Source Type

        • Natural Gas
        • Solar
        • Wind
        • Hybrid
        • Biomass
        • Geothermal
        • Hydro Energy
        • Tidal
      • REST OF APAC Low Carbon Hydrogen Market by End-Product Type

        • Hydrogen
        • Ammonia
        • Liquified Hydrogen
        • Methane
        • Methanol
    • South America Outlook (USD Billion, 2019-2035)

      • South America Low Carbon Hydrogen Market by Process Type

        • Steam Methane Reforming (SMR)
        • Autothermal Reforming
        • Biomass Reforming
        • Electrolysis
        • Photo Electric Chemical (PEC) Water Splitting
        • Thermochemical Water Splitting
        • Biomass Gasification
        • Coal Gasification
        • Methane Pyrolysis
      • South America Low Carbon Hydrogen Market by Energy Source Type

        • Natural Gas
        • Solar
        • Wind
        • Hybrid
        • Biomass
        • Geothermal
        • Hydro Energy
        • Tidal
      • South America Low Carbon Hydrogen Market by End-Product Type

        • Hydrogen
        • Ammonia
        • Liquified Hydrogen
        • Methane
        • Methanol
      • South America Low Carbon Hydrogen Market by Regional Type

        • Brazil
        • Mexico
        • Argentina
        • Rest of South America
      • BRAZIL Outlook (USD Billion, 2019-2035)
      • BRAZIL Low Carbon Hydrogen Market by Process Type

        • Steam Methane Reforming (SMR)
        • Autothermal Reforming
        • Biomass Reforming
        • Electrolysis
        • Photo Electric Chemical (PEC) Water Splitting
        • Thermochemical Water Splitting
        • Biomass Gasification
        • Coal Gasification
        • Methane Pyrolysis
      • BRAZIL Low Carbon Hydrogen Market by Energy Source Type

        • Natural Gas
        • Solar
        • Wind
        • Hybrid
        • Biomass
        • Geothermal
        • Hydro Energy
        • Tidal
      • BRAZIL Low Carbon Hydrogen Market by End-Product Type

        • Hydrogen
        • Ammonia
        • Liquified Hydrogen
        • Methane
        • Methanol
      • MEXICO Outlook (USD Billion, 2019-2035)
      • MEXICO Low Carbon Hydrogen Market by Process Type

        • Steam Methane Reforming (SMR)
        • Autothermal Reforming
        • Biomass Reforming
        • Electrolysis
        • Photo Electric Chemical (PEC) Water Splitting
        • Thermochemical Water Splitting
        • Biomass Gasification
        • Coal Gasification
        • Methane Pyrolysis
      • MEXICO Low Carbon Hydrogen Market by Energy Source Type

        • Natural Gas
        • Solar
        • Wind
        • Hybrid
        • Biomass
        • Geothermal
        • Hydro Energy
        • Tidal
      • MEXICO Low Carbon Hydrogen Market by End-Product Type

        • Hydrogen
        • Ammonia
        • Liquified Hydrogen
        • Methane
        • Methanol
      • ARGENTINA Outlook (USD Billion, 2019-2035)
      • ARGENTINA Low Carbon Hydrogen Market by Process Type

        • Steam Methane Reforming (SMR)
        • Autothermal Reforming
        • Biomass Reforming
        • Electrolysis
        • Photo Electric Chemical (PEC) Water Splitting
        • Thermochemical Water Splitting
        • Biomass Gasification
        • Coal Gasification
        • Methane Pyrolysis
      • ARGENTINA Low Carbon Hydrogen Market by Energy Source Type

        • Natural Gas
        • Solar
        • Wind
        • Hybrid
        • Biomass
        • Geothermal
        • Hydro Energy
        • Tidal
      • ARGENTINA Low Carbon Hydrogen Market by End-Product Type

        • Hydrogen
        • Ammonia
        • Liquified Hydrogen
        • Methane
        • Methanol
      • REST OF SOUTH AMERICA Outlook (USD Billion, 2019-2035)
      • REST OF SOUTH AMERICA Low Carbon Hydrogen Market by Process Type

        • Steam Methane Reforming (SMR)
        • Autothermal Reforming
        • Biomass Reforming
        • Electrolysis
        • Photo Electric Chemical (PEC) Water Splitting
        • Thermochemical Water Splitting
        • Biomass Gasification
        • Coal Gasification
        • Methane Pyrolysis
      • REST OF SOUTH AMERICA Low Carbon Hydrogen Market by Energy Source Type

        • Natural Gas
        • Solar
        • Wind
        • Hybrid
        • Biomass
        • Geothermal
        • Hydro Energy
        • Tidal
      • REST OF SOUTH AMERICA Low Carbon Hydrogen Market by End-Product Type

        • Hydrogen
        • Ammonia
        • Liquified Hydrogen
        • Methane
        • Methanol
    • MEA Outlook (USD Billion, 2019-2035)

      • MEA Low Carbon Hydrogen Market by Process Type

        • Steam Methane Reforming (SMR)
        • Autothermal Reforming
        • Biomass Reforming
        • Electrolysis
        • Photo Electric Chemical (PEC) Water Splitting
        • Thermochemical Water Splitting
        • Biomass Gasification
        • Coal Gasification
        • Methane Pyrolysis
      • MEA Low Carbon Hydrogen Market by Energy Source Type

        • Natural Gas
        • Solar
        • Wind
        • Hybrid
        • Biomass
        • Geothermal
        • Hydro Energy
        • Tidal
      • MEA Low Carbon Hydrogen Market by End-Product Type

        • Hydrogen
        • Ammonia
        • Liquified Hydrogen
        • Methane
        • Methanol
      • MEA Low Carbon Hydrogen Market by Regional Type

        • GCC Countries
        • South Africa
        • Rest of MEA
      • GCC COUNTRIES Outlook (USD Billion, 2019-2035)
      • GCC COUNTRIES Low Carbon Hydrogen Market by Process Type

        • Steam Methane Reforming (SMR)
        • Autothermal Reforming
        • Biomass Reforming
        • Electrolysis
        • Photo Electric Chemical (PEC) Water Splitting
        • Thermochemical Water Splitting
        • Biomass Gasification
        • Coal Gasification
        • Methane Pyrolysis
      • GCC COUNTRIES Low Carbon Hydrogen Market by Energy Source Type

        • Natural Gas
        • Solar
        • Wind
        • Hybrid
        • Biomass
        • Geothermal
        • Hydro Energy
        • Tidal
      • GCC COUNTRIES Low Carbon Hydrogen Market by End-Product Type

        • Hydrogen
        • Ammonia
        • Liquified Hydrogen
        • Methane
        • Methanol
      • SOUTH AFRICA Outlook (USD Billion, 2019-2035)
      • SOUTH AFRICA Low Carbon Hydrogen Market by Process Type

        • Steam Methane Reforming (SMR)
        • Autothermal Reforming
        • Biomass Reforming
        • Electrolysis
        • Photo Electric Chemical (PEC) Water Splitting
        • Thermochemical Water Splitting
        • Biomass Gasification
        • Coal Gasification
        • Methane Pyrolysis
      • SOUTH AFRICA Low Carbon Hydrogen Market by Energy Source Type

        • Natural Gas
        • Solar
        • Wind
        • Hybrid
        • Biomass
        • Geothermal
        • Hydro Energy
        • Tidal
      • SOUTH AFRICA Low Carbon Hydrogen Market by End-Product Type

        • Hydrogen
        • Ammonia
        • Liquified Hydrogen
        • Methane
        • Methanol
      • REST OF MEA Outlook (USD Billion, 2019-2035)
      • REST OF MEA Low Carbon Hydrogen Market by Process Type

        • Steam Methane Reforming (SMR)
        • Autothermal Reforming
        • Biomass Reforming
        • Electrolysis
        • Photo Electric Chemical (PEC) Water Splitting
        • Thermochemical Water Splitting
        • Biomass Gasification
        • Coal Gasification
        • Methane Pyrolysis
      • REST OF MEA Low Carbon Hydrogen Market by Energy Source Type

        • Natural Gas
        • Solar
        • Wind
        • Hybrid
        • Biomass
        • Geothermal
        • Hydro Energy
        • Tidal
      • REST OF MEA Low Carbon Hydrogen Market by End-Product Type

        • Hydrogen
        • Ammonia
        • Liquified Hydrogen
        • Methane
        • Methanol
    Infographic

    Free Sample Request

    Kindly complete the form below to receive a free sample of this Report

    Get Free Sample

    Customer Strories

    “I am very pleased with how market segments have been defined in a relevant way for my purposes (such as "Portable Freezers & refrigerators" and "last-mile"). In general the report is well structured. Thanks very much for your efforts.”

    Victoria Milne

    Founder
    Case Study
    Chemicals and Materials