• Cat-intel
  • MedIntelliX
  • Resources
  • About Us
  • Request Free Sample ×

    Kindly complete the form below to receive a free sample of this Report

    Leading companies partner with us for data-driven Insights

    clients tt-cursor

    Live Cell Imaging Market

    ID: MRFR/MED/4617-HCR
    100 Pages
    Kinjoll Dey
    September 2025

    Live Cell Imaging Market Research Report Information By Products (Equipment, Consumables, Software), By Technology {Fluorescence Recovery After Photobleaching (FRAP), Total Internal Reflection Fluorescence Microscopy (TRIF), High-content analysis, Fluorescence in situ hybridization}, By Application (Drug Discovery, Cell Biology, Others), By End-user (Pharmaceutical companies, Hospitals and Biotechnological companies), and By Region (North America, Europe, Asia-Pacific, And Rest Of The World) – Market Forecast Till 2032

    Share:
    Download PDF ×

    We do not share your information with anyone. However, we may send you emails based on your report interest from time to time. You may contact us at any time to opt-out.

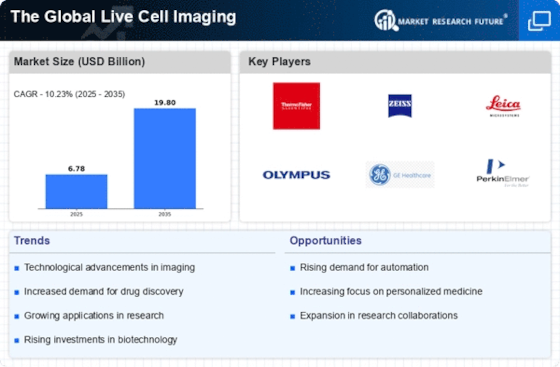
    Live Cell Imaging Market Research Report – Forecast to 2032 Infographic
    Purchase Options
    $ 4,950.0
    $ 5,950.0
    $ 7,250.0
    Table of Contents

    Live Cell Imaging Market Summary

    The Global Live Cell Imaging Market is projected to grow from 12.5 USD Billion in 2024 to 30 USD Billion by 2035, reflecting a robust CAGR of 8.28%.

    Key Market Trends & Highlights

    Global Live Cell Imaging Key Trends and Highlights

    • The market is expected to expand significantly, reaching 30 USD Billion by 2035.
    • From 2025 to 2035, the market is anticipated to grow at a CAGR of 8.28%.
    • In 2024, the market valuation stands at 12.5 USD Billion, indicating a strong foundation for future growth.
    • Growing adoption of advanced imaging technologies due to increased research funding is a major market driver.

    Market Size & Forecast

    2024 Market Size 12.5 (USD Billion)
    2035 Market Size 30 (USD Billion)
    CAGR (2025 - 2035) 8.28%

    Major Players

    Apple Inc (US), Microsoft Corp (US), Amazon.com Inc (US), Alphabet Inc (US), Berkshire Hathaway Inc (US), Tesla Inc (US), Meta Platforms Inc (US), Johnson & Johnson (US), Visa Inc (US), Procter & Gamble Co (US)

    Live Cell Imaging Market Trends

      • Growing Target Patient Population and an increase in funding for advances and newer cell therapy will boost market growth

    A crucial tool in the study of cancer biology is live cell imaging. Live cell imaging is crucial for a deeper comprehension of the function and disease processes, even though high-resolution imaging is necessary for analyzing genetic and cell signaling alterations in the underlying malignancy. Every year, almost 400,000 kids are diagnosed with cancer. Communicable illnesses impact both developed and developing nations. Most emerging nations are exposed due to several variables, including demographic, socioeconomic, and geographic circumstances. Thus, the market for live cell imaging is driven by the rising mortality toll and the prevalence of chronic diseases.

    Artificial intelligence's (A.I.) place in biological sciences is growing quickly and has a lot of promise for microscopy. The ability of microscopy to confirm or refute scientific ideas in the past was scale-restricted, and the time required to measure, capture, and analyze many pictures were frequently prohibitive. Recently, A.I. has quickly impacted several scientific disciplines, including microscopy. Self-learning microscopy powered by A.I. can deliver high throughput image analysis quicker and easier. Better long-term viewing of unlabeled living cells is made possible by more recent A.I. technologies. . Thus, this factor drives the market CAGR.

    The need for regenerative medicine has expanded in industrialized nations, and recent years have seen a sharp surge in spending on cell and gene therapy. Developers of cell and gene therapies are receiving financing from both the public and private sectors. Recent years have seen a significant increase in the funding of biotech start-ups and research institutions that work on developing new cell and gene therapy products for several public and commercial entities. The Alliance for Regenerative Medicines reports that funding for cell and gene therapy increased by 164% in 2022 compared to 2020

    Live cell imaging results from scientific curiosity and imaging and labeling technology advancements. Live cell imaging has many additional applications for scientists when different technical breakthroughs and biological interests are combined. An extensive range of nucleic acids, proteins, glycans, lipids, ions, metabolites, and other targets may now be tagged, especially thanks to significant advancements in probe creation. Several recent developments in microscopic Technology use software that improves quantitative image analysis of label-free pictures. Thus, this aspect will accelerate the Live Cell Imaging market revenue globally.

    The ongoing advancements in imaging technologies are poised to enhance the capabilities of live cell imaging, thereby facilitating unprecedented insights into cellular dynamics and interactions.

    National Institutes of Health (NIH)

    Live Cell Imaging Market Drivers

    Technological Advancements

    The Global Live Cell Imaging Market Industry is experiencing rapid growth driven by technological advancements in imaging techniques. Innovations such as high-resolution microscopy and advanced fluorescent probes enhance the ability to visualize cellular processes in real-time. These developments enable researchers to conduct more precise experiments, leading to better insights into cellular behavior. As a result, the market is projected to reach 12.5 USD Billion in 2024, with a compound annual growth rate (CAGR) of 8.28% anticipated from 2025 to 2035. This growth reflects the increasing demand for sophisticated imaging tools in various fields, including drug discovery and cancer research.

    Market Growth Visualization

    Increased Funding for Research

    Increased funding for research initiatives is a critical driver of the Global Live Cell Imaging Market Industry. Governments and private organizations are investing heavily in biomedical research, which often relies on advanced imaging techniques to explore cellular mechanisms. This influx of funding supports the development of new technologies and enhances the capabilities of existing systems. As research institutions adopt live cell imaging to gain insights into complex biological processes, the market is poised for substantial growth. The anticipated CAGR of 8.28% from 2025 to 2035 underscores the potential for continued investment in this area, reflecting a commitment to advancing scientific knowledge.

    Rising Demand in Drug Discovery

    The Global Live Cell Imaging Market Industry is significantly influenced by the rising demand for live cell imaging in drug discovery processes. Pharmaceutical companies are increasingly adopting these technologies to monitor cellular responses to drug candidates, thereby improving the efficiency of the drug development pipeline. The ability to visualize live cellular interactions allows for better assessment of drug efficacy and safety. This trend is expected to contribute to the market's expansion, with projections indicating a growth to 30 USD Billion by 2035. The integration of live cell imaging in preclinical studies is becoming a standard practice, further solidifying its importance in the industry.

    Emerging Markets and Global Expansion

    Emerging markets are playing a pivotal role in the growth of the Global Live Cell Imaging Market Industry. Countries in Asia-Pacific and Latin America are witnessing increased investments in healthcare infrastructure and research capabilities. This expansion is driven by a growing awareness of the importance of advanced imaging technologies in biomedical research. As these regions enhance their research facilities, the demand for live cell imaging solutions is expected to rise. The market's projected growth to 12.5 USD Billion in 2024 reflects the potential of these emerging markets to contribute significantly to the overall industry landscape.

    Growing Applications in Cancer Research

    The Global Live Cell Imaging Market Industry is witnessing a surge in applications within cancer research. Researchers utilize live cell imaging to study tumor behavior, cellular interactions, and the effects of therapeutic agents in real-time. This capability is crucial for understanding cancer progression and developing targeted therapies. As the global focus on cancer treatment intensifies, the demand for live cell imaging technologies is expected to rise significantly. The market's growth trajectory, aiming for 30 USD Billion by 2035, indicates the increasing reliance on these imaging techniques to facilitate breakthroughs in oncology research and treatment.

    Market Segment Insights

    Live Cell Imaging Products Insights

    Based on products, the Live Cell Imaging Market segmentation includes Equipment, Consumables, and Software. The consumables segment held the majority share in 2022 in the Live Cell Imaging Market data. During the projection period, the need for frequent purchases of consumables is anticipated to be a major factor in the market's expansion.

    Figure 1: Live Cell Imaging Market, by Products, 2023 & 2032 (USD Billion)Source: Secondary Research, Primary Research, Market Research Future Database and Analyst Review

    Live Cell Imaging End-user Insights

    Based on End-user, the Live Cell Imaging Market segmentation includes pharmaceutical companies, Hospitals and Biotechnological companies. The hospitals segment dominated the market growth in 2022 and is projected to be the faster-growing segment during the forecast period, 2022-2030. The significant market share of this sector can be ascribed to the expansion of R&D efforts and the patent expiration of several blockbuster medications.

    Live Cell Imaging Technology Insights

    Based on Technology, the Live Cell Imaging Market data includes Fluorescence Recovery After Photobleaching (FRAP), Total Internal Reflection Fluorescence Microscopy (TRIF), High-content analysis, and Fluorescence in situ hybridization. The fluorescence recovery after the photobleaching segment dominated the Live Cell Imaging market revenue in 2022 and is projected to be the faster-growing segment during the forecast period, 2022-2030, due to its several benefits in determining the protein levels' spatial closeness. Additionally, the increased use of genetic peptides has recently made this technique more well-known.

    Live Cell Imaging Application Insights

    Based on application, the Live Cell Imaging Market data includes Drug Discovery, Cell Biology, and Others. The cell imaging segment dominated the Live Cell Imaging market revenue in 2022 and is projected to be the faster-growing segment during the forecast period 2022-2030. Aside from this, other cutting-edge technologies that heavily influence the process include sophisticated lighting systems and filtration approaches.

    Get more detailed insights about Live Cell Imaging Market Research Report – Forecast to 2032

    Regional Insights

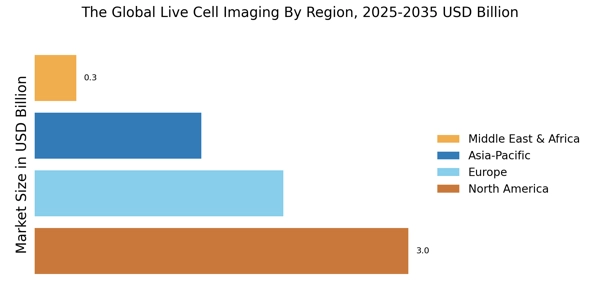
    By region, the study provides market insights into North America, Europe, Asia-Pacific and the Rest of the World. The North America Live Cell Imaging market accounted for USD 2.15 billion in 2022 with a share of around 45.80% and is expected to exhibit a significant CAGR growth during the study period. The presence of a bigger patient pool and an expanding senior population is said to account for the majority of the share. The main forces in this area are the significant funding and investment available for live-cell imaging research.

    Due to factors including an increase in chronic illnesses and the amount of research and development (R&D) programs in the nation, the United States now owns the greatest market share in the North American area. In the United States, around 34,800 new HIV infections were reported in 2020, according to the most recent estimates from the Centers for Disease Control and Prevention. According to the same source, 13% of Americans with HIV are unaware of their condition and urgently want a diagnosis.

    Further, the major countries studied in the market report are The U.S., Canada, Germany, France, the UK, Italy, Spain, China, Japan, India, Australia, South Korea, and Brazil.

    Figure 2: LIVE CELL IMAGING MARKET SHARE BY REGION 2023 (%)LIVE CELL IMAGING MARKET SHARE BY REGION 2022Source: Secondary Research, Primary Research, Market Research Future Database and Analyst Review

    The second-largest share in the world is held by Europe Live Cell Imaging market, which may be attributed to several factors, including a rising patient population in need of novel therapies like stem cell therapy and gene therapy, an increase in the number of drugs approved for precision medicine, government financing for research-based activities, quick developments in live cell imaging, and several others. Moreover, the U.K. Live Cell Imaging market held the largest market share, and the Germany Live Cell Imaging market was the fastest-growing market in the region.

    The Asia Pacific Live Cell Imaging market region has the significant anticipated growth rate. The government-sponsored research on stem cell therapy, the growing importance of regenerative medicine research, the expansion of preclinical and clinical research in China, the favorable changes in foreign direct investment (FDI) regulations in the pharmaceutical industry in India, and the expansion of the pharmaceutical and biopharmaceutical sectors in South Korea are the main causes of this region's high growth rate. Further, the China Live Cell Imaging market held the largest market share, and the India Live Cell Imaging market was the fastest-growing market in the region.

    Key Players and Competitive Insights

    Major industry companies are investing a lot of money in R&D to expand their product offerings, which will spur further market expansion for the Live Cell Imaging industry. With significant industry changes, including new product launches, mergers and acquisitions, contractual agreements, higher investments, and collaboration with other organizations, market developments are also undertaking various strategic activities to expand their global presence. To grow and remain in a market that is becoming more and more competitive, Live Cell Imaging industry competitors must provide affordable products.

    Manufacturing locally to cut operational costs is one of the producers' main business methods in the global Live Cell Imaging industry to benefit customers and increase the market sector. The Live Cell Imaging industry has recently given medicine some of the most important advantages. The Live Cell Imaging market major player such as Carl Zeiss AG (Germany),  Leica Microsystems (Germany),  Olympus Corporation (Japan),  Sigma-Aldrich Corporation (U.S.),  Nikon Corporation (Japan),  Molecular Devices,  LCC (U.S.),  PerkinElmer,  Inc. (U.S.), G.E. Healthcare (U.K.), Becton,  Dickinson and Company (U.S.),  Thermo Fisher Scientific,  Inc. (U.S.), Danaher Corporation (U.S.) and BioTek Instruments (U.S.).

    Time-lapse microscopy is used to analyze live cells in live-cell imaging. Scientists can get a deeper knowledge of biological functions by investigating cellular dynamics. The Lux3 FL Duo Kit and Multi Lux3 FL were two new fluorescence live-cell imaging systems introduced in June 2021 by CytoSMART Technologies BV, a prominent provider of intelligent solutions for live-cell imaging in cell culture facilities. The objective of this launch is to compare cell cultures side by side.

    A German firm that manufactures microscopes is called Leica Microsystems GmbH. It produces optical microscopes, tools for preparing microscopic specimens, and associated goods. Leica Microsystems GmbH, a well-known German manufacturer of microscopes, and the European Molecular Biology Laboratory reached an agreement in December 2019. (EMBL). This partnership will develop new imaging technologies that are useful in life science.

    Key Companies in the Live Cell Imaging Market market include

    Industry Developments

      • September 2021: PHC Holdings Corporation's subsidiary PHC Corporation, a market leader in the development, design, and production of lab equipment, has announced a cooperation with SCREEN Holdings Co. Ltd. The alliance aims to market live-cell imaging instruments from the SCREEN Cell3iMager line in North America.
      • April 2019: Nikon Corporation has unveiled two new silicone immersion objective lenses: the CFI Plan Apochromat Lambda S 40XC Sil and the CFI Plan Apochromat Lambda S 25XC Sil. The most recent microscopes to be released are confocal laser microscopy systems and Ti2 inverted research microscopes.
      • July 2018: Bruker Corporation, a producer of scientific equipment, has purchased JPK Instruments AG, a prominent maker of nano-analytical instruments. The purpose of this acquisition is to improve Bruker Corporation's microscopy capabilities.

    Future Outlook

    Live Cell Imaging Market Future Outlook

    The Global Live Cell Imaging Market is projected to grow at 8.28% CAGR from 2024 to 2035, driven by advancements in imaging technologies and increasing demand for drug discovery.

    New opportunities lie in:

    • Develop innovative imaging solutions for personalized medicine applications.
    • Expand product offerings to include AI-driven analysis tools for enhanced data interpretation.
    • Forge strategic partnerships with biotechnology firms to enhance research capabilities.

    By 2035, the market is expected to achieve substantial growth, reflecting its critical role in biomedical research.

    Market Segmentation

    Live Cell Imaging Product Outlook

    • Equipment
    • Consumables
    • Software

    Live Cell Imaging End-User Outlook

    • Pharmaceutical companies
    • Hospitals
    • Biotechnological companies

    Live Cell Imaging Technology Outlook

    • Fluorescence recovery after photobleaching (FRAP)
    • Total Internal Reflection Fluorescence Microscopy (TRIF)
    • High-content analysis
    • Fluorescence in situ hybridization

    Live Cell Imaging Application Outlook

    • Drug discovery
    • Cell Biology
    • Stem cells
    • Development biology
    • Others

    Live Cell Imaging Regional Outlook  

    North America
    • US
    • Canada

    Report Scope

    Report Attribute/Metric Details
    Market Size 2023 USD 5.12 billion
    Market Size 2024 USD 6.78 billion
    Market Size 2032 USD 8.70 billion
    Compound Annual Growth Rate (CAGR)  10.23% (2024-2032)
    Base Year 2023
    Market Forecast Period 202-2032
    Historical Data 2018 - 2021
    Market Forecast Units Value (USD Billion)
    Report Coverage Revenue Forecast, Market Competitive Landscape, Growth Factors, and Trends
    Segments Covered Variety, Form, Distribution Channel and Region
    Geographies Covered North America, Europe, Asia Pacific, and the Rest of the World
    Countries Covered Carl Zeiss AG (Germany), Leica Microsystems (Germany),  Olympus Corporation (Japan),  Sigma-Aldrich Corporation (U.S.),  Nikon Corporation (Japan),  Molecular Devices,  LCC (U.S.),  PerkinElmer,  Inc. (U.S.), G.E. Healthcare (U.K.), Becton,  Dickinson and Company (U.S.),  Thermo Fisher Scientific,  Inc. (U.S.), Danaher Corporation (U.S.) and BioTek Instruments (U.S.)
    Key Companies Profiled Nestle, JM Smucker Company, The Kraft Heinz Company and Starbucks Live Cell Imaging  Company
    Key Market Opportunities Use of high-content screening methods in cell biology and drug discovery
    Key Market Dynamics Increasing prevalence of chronic diseases Growing government funding in cell-based research

    Market Highlights

    Author
    Kinjoll Dey
    Research Analyst Level I

    He is an extremely curious individual currently working in Healthcare and Medical Devices Domain. Kinjoll is comfortably versed in data centric research backed by healthcare educational background. He leverages extensive data mining and analytics tools such as Primary and Secondary Research, Statistical Analysis, Machine Learning, Data Modelling. His key role also involves Technical Sales Support, Client Interaction and Project management within the Healthcare team. Lastly, he showcases extensive affinity towards learning new skills and remain fascinated in implementing them.

    Leave a Comment

    FAQs

    How much is the Live Cell Imaging market?

    The Live Cell Imaging Market size was valued at USD 5.12 Billion in 2023.

    What is the growth rate of the Live Cell Imaging market?

    The Live Cell Imaging Market is projected to grow at a CAGR of 10.23% during the forecast period, 2024-2032.

    Which region held the largest market share in the Live Cell Imaging market?

    North America had the largest share in the global Live Cell Imaging market

    Who are the key players in the Live Cell Imaging market?

    The key players in the market are Carl Zeiss AG (Germany), Leica Microsystems (Germany), Olympus Corporation (Japan),  Sigma-Aldrich Corporation (U.S.),  Nikon Corporation (Japan),  Molecular Devices,  LCC (U.S.),  PerkinElmer,  Inc. (U.S.), G.E. Healthcare (U.K.), Becton,  Dickinson and Company (U.S.),  Thermo Fisher Scientific,  Inc. (U.S.), Danaher Corporation (U.S.) and BioTek Instruments (U.S.) Company.

    Which product led the Live Cell Imaging market?

    The consumable category dominated the Live Cell Imaging market in 2022.

    Which End-user had the largest market share in the Live Cell Imaging market?

    The Pharmaceutical companies had the largest share in the global Live Cell Imaging market.

    1. 'Table Of Contents:
    2. Chapter 1. Report Prologue
    3. Chapter 2. Market Introduction
      1. Definition
      2. Scope Of The Study
        1. Research Objective
    4. Assumptions
      1. Limitations
    5. Chapter 3. Research Methodology
    6. Introduction
      1. Primary Research
      2. Secondary Research
      3. Market
    7. Size Estimation
    8. Chapter 4. Market Dynamics
      1. Drivers
      2. Restraints
      3. Opportunities
      4. Challenges
      5. Macroeconomic Indicators
    9. Technology Trends & Assessment
    10. Chapter 5. Market Factor Analysis
    11. Porter’s Five Forces Analysis
      1. Bargaining Power Of Suppliers
        1. Bargaining Power Of Buyers
        2. Threat Of New Entrants
    12. Threat Of Substitutes
      1. Intensity Of Rivalry
      2. Value Chain Analysis
      3. Investment Feasibility Analysis
      4. Pricing Analysis
    13. Chapter 6.
    14. Global Live Cell Imaging Market, By Product
      1. Introduction
      2. Equipment
        1. Microscopes
    15. Market Estimates
    16. & Forecast, By Region, 2023–2030
    17. Market Estimates & Forecast,
    18. By Country, 2023–2030
      1. Confocal Microscopes
    19. Market Estimates
    20. & Forecast, By Region, 2023–2030
    21. Market Estimates & Forecast,
    22. By Country, 2023–2030
      1. Advanced Fluorescence Microscopes
    23. Market
    24. Estimates & Forecast, By Region, 2023–2030
    25. Market Estimates &
    26. Forecast, By Country, 2023–2030
      1. Standalone Systems
    27. Market
    28. Estimates & Forecast, By Region, 2023–2030
    29. Market Estimates &
    30. Forecast, By Country, 2023–2030
      1. Cell Analyzers
    31. Market Estimates
    32. & Forecast, By Region, 2023–2030
    33. Market Estimates & Forecast,
    34. By Country, 2023–2030
      1. Image-Capturing Devices
    35. Market Estimates
    36. & Forecast, By Region, 2023–2030
    37. Market Estimates & Forecast,
    38. By Country, 2023–2030
      1. Consumables
        1. Assay Kits
    39. Market
    40. Estimates & Forecast, By Region, 2023–2030
    41. Market Estimates &
    42. Forecast, By Country, 2023–2030
      1. Reagents
    43. Market Estimates
    44. & Forecast, By Region, 2023–2030
    45. Market Estimates & Forecast,
    46. By Country, 2023–2030
      1. Media
    47. Market Estimates & Forecast,
    48. By Region, 2023–2030
    49. Market Estimates & Forecast, By Country, 2023–2030
      1. Others
      2. Software
    50. Market Estimates & Forecast, By Region,
    51. Market Estimates & Forecast, By Country, 2023–2030
    52. Chapter 7. Global Live Cell Imaging Market, By Technology
      1. Introduction
      2. Fluorescence Recovery After Photobleaching (FRAP)
    53. Market Estimates &
    54. Forecast, By Region, 2023–2030
    55. Market Estimates & Forecast, By Country,
      1. Fluorescence Resonance Energy Transfer (FRET)
    56. Market
    57. Estimates & Forecast, By Region, 2023–2030
    58. Market Estimates &
    59. Forecast, By Country, 2023–2030
      1. High-Content Analysis (HCA)
    60. Market
    61. Estimates & Forecast, By Region, 2023–2030
    62. Market Estimates &
    63. Forecast, By Country, 2023–2030
      1. Ratiometric Imaging
    64. Market Estimates
    65. & Forecast, By Region, 2023–2030
    66. Market Estimates & Forecast,
    67. By Country, 2023–2030
      1. Fluorescence In Situ Hydridization (FISH)
    68. Market Estimates & Forecast, By Region, 2023–2030
    69. Market Estimates
    70. & Forecast, By Country, 2023–2030
      1. Total Internal Reflection Fluorescence
    71. Microscopy (TRIF)
    72. Market Estimates & Forecast, By Region, 2023–2030
    73. Market Estimates & Forecast, By Country, 2023–2030
      1. Multiphoton
    74. Excitation Microscopy (MPE)
    75. Market Estimates & Forecast, By Region, 2023–2030
    76. Market Estimates & Forecast, By Country, 2023–2030
      1. Others
    77. Chapter 8. Global Live Cell Imaging Market, By Application
      1. Introduction
      2. Cell Biology
    78. Market Estimates & Forecast, By Region, 2023–2030
    79. Market Estimates & Forecast, By Country, 2023–2030
      1. Stem Cells
    80. Market Estimates & Forecast, By Region, 2023–2030
    81. Market Estimates
    82. & Forecast, By Country, 2023–2030
      1. Developmental Biology
    83. Market
    84. Estimates & Forecast, By Region, 2023–2030
    85. Market Estimates &
    86. Forecast, By Country, 2023–2030
      1. Drug Discovery
    87. Market Estimates
    88. & Forecast, By Region, 2023–2030
    89. Market Estimates & Forecast,
    90. By Country, 2023–2030
    91. Chapter 9. Global Live Cell Imaging Market, By
    92. End-User
      1. Introduction
      2. Pharmaceutical Companies
    93. Market Estimates
    94. & Forecast, By Region, 2023–2030
    95. Market Estimates & Forecast,
    96. By Country, 2023–2030
      1. Biotechnological Companies
    97. Market Estimates
    98. & Forecast, By Region, 2023–2030
    99. Market Estimates & Forecast,
    100. By Country, 2023–2030
      1. Hospitals
    101. Market Estimates & Forecast,
    102. By Region, 2023–2030
    103. Market Estimates & Forecast, By Country, 2023–2030
      1. Diagnostic Laboratories
    104. Market Estimates & Forecast, By Region, 2023–2030
    105. Market Estimates & Forecast, By Country, 2023–2030
      1. Others
    106. Chapter 10. Global Live Cell Imaging Market, By Region
      1. Introduction
      2. Americas
        1. North America
        2. South America
      3. Europe
        1. Western Europe
    107. Germany
      1. France
        1. Italy
    108. U.K.
      1. Rest Of Western Europe
        1. Eastern Europe
      2. Asia
    109. Pacific
      1. Japan
        1. China
        2. India
        3. Australia
        4. Republic Of Korea
        5. Rest Of Asia Pacific
      2. The Middle
    110. East & Africa
      1. The Middle East
        1. Africa
    111. Chapter 11.
    112. Company Landscape
      1. Introduction
      2. Market Share Analysis
    113. Key Development & Strategies
    114. Chapter 12. Company Profiles
      1. Carl
    115. Zeiss AG
      1. Company Overview
        1. Product Overview
        2. Financials
    116. Overview
      1. Key Developments
        1. SWOT Analysis
      2. Leica
    117. Microsystems
      1. Company Overview
        1. Product Overview
    118. Financial Overview
      1. Key Developments
        1. SWOT Analysis
    119. Nikon Corporation
      1. Company Overview
        1. Product Overview
    120. Financial Overview
      1. Key Development
        1. SWOT Analysis
    121. Molecular Devices, LCC
      1. Company Overview
        1. Technology/Business
    122. Segment Overview
      1. Financial Overview
        1. Key Development
    123. SWOT Analysis
      1. PerkinElmer, Inc.
        1. Company Overview
    124. Product Overview
      1. Financial Overview
        1. Key Developments
        2. SWOT Analysis
      2. GE Healthcare
        1. Company Overview
    125. Product Overview
      1. Financial Overview
        1. Key Developments
        2. SWOT Analysis
      2. Becton, Dickinson And Company
        1. Overview
        2. Product Overview
        3. Financial Overview
        4. Key Developments
        5. SWOT Analysis
      3. Olympus Corporation
        1. Overview
    126. Product/ Technology Overview
      1. Financials
        1. Key Developments
        2. SWOT Analysis
      2. Sigma-Aldrich Corporation
        1. Overview
        2. Product Overview
        3. Financials
        4. Key Developments
        5. SWOT Analysis
      3. Thermo Fischer Scientific, Inc.
        1. Overview
        2. Product Overview
        3. Financials
        4. Key Developments
        5. SWOT Analysis
      4. Danaher Corporation
        1. Overview
        2. Product Overview
        3. Financials
        4. Key Developments
        5. SWOT Analysis
      5. BioTek Instruments
        1. Overview
    127. Product Overview
      1. Financials
        1. Key Developments
    128. SWOT Analysis
    129. Chapter 13 MRFR Conclusion
      1. Key Findings
    130. From CEO’s View Point
      1. Unmet Needs Of The Market
      2. Key
    131. Companies To Watch
      1. Prediction Of The Arthroscopy Instruments Industry
    132. Chapter 14 Appendix
    133. Market Synopsis, 2023–2030
    134. And Forecast, 2023–2030, (USD Million)
    135. Market, By Region, 2023–2030, (USD Million)
    136. Imaging Market, By Product, 2023–2030, (USD Million)
    137. Cell Imaging Market, By Technology, 2023–2030, (USD Million)
    138. Global Live Cell Imaging Market, By Application, 2023–2030, (USD Million)
    139. (USD Million)
    140. –2030, (USD Million)
    141. Market, By Application, 2023–2030, (USD Million)
    142. Global Live Cell Imaging Market, By End-User, 2023–2030, (USD Million)
    143. Million)
    144. (USD Million)
    145. –2030, (USD Million)
    146. By End-User, 2023–2030, (USD Million)
    147. Imaging Market, By Product, 2023–2030, (USD Million)
    148. Global Live Cell Imaging Market, By Technology, 2023–2030, (USD Million)
    149. (USD Million)
    150. –2030, (USD Million)
    151. Market, By Product, 2023–2030, (USD Million)
    152. Live Cell Imaging Market, By Technology, 2023–2030, (USD Million)
    153. South America Global Live Cell Imaging Market, By Application, 2023–2030,
    154. (USD Million)
    155. –2030, (USD Million)
    156. By Product, 2023–2030, (USD Million)
    157. Imaging Market, By Technology, 2023–2030, (USD Million)
    158. Global Live Cell Imaging Market, By Application, 2023–2030, (USD Million)
    159. (USD Million)
    160. –2030, (USD Million)
    161. Market, By Technology, 2023–2030, (USD Million)
    162. Global Live Cell Imaging Market, By Application, 2023–2030, (USD Million)
    163. (USD Million)
    164. –2030, (USD Million)
    165. Market, By Technology, 2023–2030, (USD Million)
    166. Global Live Cell Imaging Market, By Application, 2023–2030, (USD Million)
    167. (USD Million)
    168. –2030, (USD Million)
    169. Market, By Technology, 2023–2030, (USD Million)
    170. Global Live Cell Imaging Market, By Application, 2023–2030, (USD Million)
    171. (USD Million)
    172. By Product, 2023–2030, (USD Million)
    173. Global Live Cell Imaging Market, By Technology, 2023–2030, (USD Million)
    174. –2030, (USD Million)
    175. Cell Imaging Market, By End-User, 2023–2030, (USD Million)
    176. Market
    177. Global Live Cell Imaging Market Share, By Technology, 2023
    178. Live Cell Imaging Market Share, By Application, 2023
    179. Imaging Market Share, By Region, 2023
    180. Imaging Market Share, By Country, 2023
    181. Market Share, By Country, 2023
    182. Market Share, By Country, 2023
    183. Cell Imaging Market Share, By Country, 2023
    184. Market: Company Share Analysis, 2023 (%)
    185. Revenue
    186. Segmental Revenue
    187. Nikon Corporation: Key Financials
    188. Revenue
    189. Devices, LLC: Key Financials
    190. Inc.: Key Financials
    191. PerkinElmer, Inc.: Geographical Revenue
    192. Revenue
    193. Becton, Dickinson And Company: Segmental Revenue
    194. And Company: Geographical Revenue
    195. Geographical Revenue
    196. Corporation: Geographical Revenue
    197. Key Financials
    198. Danaher Corporation: Key Financials
    199. Revenue
    200. BioTek Instruments: Key Financials
    201. Revenue

    Live Cell Imaging Market Segmentation

    Market Segmentation Overview

    • Detailed segmentation data will be available in the full report
    • Comprehensive analysis by multiple parameters
    • Regional and country-level breakdowns
    • Market size forecasts by segment
    Live Cell Imaging Market Research Report – Forecast to 2032 Infographic
    Free Sample Request

    Kindly complete the form below to receive a free sample of this Report

    Customer Strories

    “I am very pleased with how market segments have been defined in a relevant way for my purposes (such as "Portable Freezers & refrigerators" and "last-mile"). In general the report is well structured. Thanks very much for your efforts.”

    Victoria Milne Founder
    Case Study

    Chemicals and Materials