×
  • Cat-intel
  • MedIntelliX
  • Resources
  • About Us
  • Hero Background
    English
    Chinese
    French
    Japanese
    Korean
    German
    Spanish

    Lenticular Sheet Market Trends

    ID: MRFR/CnM/10662-HCR
    111 Pages
    Chitranshi Jaiswal
    October 2025

    Lenticular Sheet Market Research Report Information By Storage Option (Plastic, Glass and Others), By Application (Lenticular Printing, Corrective Lenses, Lenticular Screens and Others) And By Region (North America, Europe, Asia-Pacific, And Rest Of The World) –Market Forecast Till 2035

    Share:
    Download PDF ×

    We do not share your information with anyone. However, we may send you emails based on your report interest from time to time. You may contact us at any time to opt-out.

    Lenticular Sheet Market Infographic
    Purchase Options

    Market Trends

    Key Emerging Trends in the Lenticular Sheet Market

    The Lenticular Sheet market is undergoing significant shifts, driven by technological advancements and expanding applications across various industries. Increased Adoption in Printing and Packaging: One of the prominent trends in the Lenticular Sheet market is its growing adoption in the printing and packaging industry. Lenticular sheets are valued for their ability to create eye-catching 3D and animated effects on printed materials, making them attractive for product packaging, advertising, and promotional materials. This trend is fueled by the demand for visually appealing and interactive marketing solutions. Rising Popularity in Displays and Signage: Lenticular sheets are increasingly being used in displays and signage applications. The ability to create dynamic visual effects, such as changing images or depth perception, makes lenticular technology well-suited for attention-grabbing displays in retail environments, exhibitions, and public spaces. The versatility of lenticular sheets in creating engaging visual experiences is driving their adoption in this market segment. Advancements in Lenticular Printing Technology: Technological advancements in lenticular printing are contributing to the market's growth. Improved printing techniques and higher-resolution capabilities are enhancing the quality of lenticular images, allowing for more detailed and realistic effects. This has expanded the range of applications and increased the attractiveness of lenticular sheets for businesses seeking innovative visual solutions. Growing Demand in Promotional Products: Lenticular sheets have gained popularity in the production of promotional products, including merchandise, giveaways, and branded items. The ability to incorporate motion, depth, or multiple images on a single surface adds a unique and memorable element to promotional materials. This trend aligns with the marketing strategies of companies looking to create impactful and memorable brand experiences. Expansion into Virtual and Augmented Reality (VR/AR): The integration of lenticular technology with virtual and augmented reality applications is an emerging trend. Lenticular sheets are being utilized to enhance the visual experience in VR/AR displays, providing depth and realism to virtual environments. This convergence of lenticular technology with immersive technologies is opening new avenues for applications in gaming, simulations, and training. Demand for Eco-Friendly Lenticular Materials: As sustainability becomes a focal point in various industries, there is a growing demand for eco-friendly lenticular materials. Manufacturers are exploring recyclable and biodegradable options to align with environmental considerations. This trend reflects the broader shift towards sustainable practices in the printing and packaging sectors. Customization and Personalization: The demand for customized and personalized visual experiences is driving the trend of using lenticular sheets for tailored applications. Businesses are leveraging lenticular technology to create personalized promotional materials, event invitations, and packaging designs. The ability to customize lenticular effects based on specific requirements enhances the uniqueness of printed materials. Global Supply Chain Challenges Impacting Production: Similar to other industries, the Lenticular Sheet market is not immune to global supply chain challenges. Disruptions in the supply chain, including raw material shortages and logistics issues, can impact the production and availability of lenticular sheets. Companies are navigating these challenges through strategic sourcing and supply chain resilience measures.

    Author
    Chitranshi Jaiswal
    Research Analyst Level I

    In her 3 years of experience in the market research field, she has handled critical cross-domain projects. She has an in-depth knowledge of market estimation & analysis, problem-solving, primary as well as secondary research, and team management.She holds an engineering degree and is an MBA professional from a well-known university, capable of evaluating the market and competitive conditions. An exceptional strategist with excellent communication skills and a passion for delivering cutting-edge & practical insights for the market. Proficient in multi-tasking, and can successfully deal with competing demands, while maintaining complete confidentiality. Generated business through active client and project development, networking, and high-quality responses. Her knowledge and skills have helped in making solid business decisions, securing funding from investors, and avoiding business failures.

    Leave a Comment

    FAQs

    How much is the lenticular sheet market?

    The enticular sheet market size was valued at USD 3.30 Billion in 2022.

    What is the growth rate of the lenticular sheet market?

    Lenticular Sheet Market is projected to grow at a CAGR of 8.06% during the forecast period, 2025-2035

    Which region held the largest market share in the lenticular sheet market?

    North America had the largest share in the global market

    Who are the key players in the lenticular sheet market?

    The key players in the market are Micro Lens Technology, JacoTech, Pacur, Hangzhou Donghuang Chemical, Chengdu Kanglongxin Plastic, and Jiangmen Guangzhiyuan 3D Technology.

    Which Storage Option led the lenticular sheet market?

    The Plastic category dominated the market in 2022.

    Which Application had the largest market share in the lenticular sheet market?

    The Lenticular Printing had the largest share in the global market.

    Market Summary

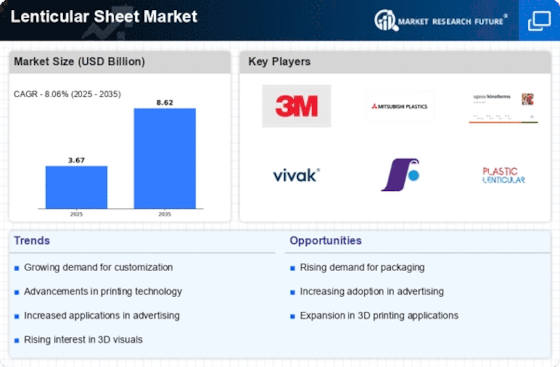
    As per MRFR analysis, the Lenticular Sheet Market Size was estimated at 3.674 USD Billion in 2024. The Lenticular Sheet industry is projected to grow from 3.97 USD Billion in 2025 to 8.621 USD Billion by 2035, exhibiting a compound annual growth rate (CAGR) of 8.06 during the forecast period 2025 - 2035.

    Key Market Trends & Highlights

    The Lenticular Sheet Market is poised for growth driven by technological advancements and diverse applications.

    • North America remains the largest market for lenticular sheets, driven by robust demand in advertising and marketing.
    • The Asia-Pacific region is emerging as the fastest-growing market, fueled by increasing investments in innovative applications.
    • Plastic lenticular sheets dominate the market, while glass lenticular sheets are witnessing rapid growth due to their unique properties.
    • Technological advancements and sustainability initiatives are key drivers, alongside a growing demand in the entertainment sector.

    Market Size & Forecast

    2024 Market Size 3.674 (USD Billion)
    2035 Market Size 8.621 (USD Billion)
    CAGR (2025 - 2035) 8.06%
    Largest Regional Market Share in 2024 North America

    Major Players

    <p>3M (US), Mitsubishi Plastics (JP), Kinoform (US), VIVAK (DE), Lenticular (US), Flexcon (US), Lenticular Technologies (US), Dai Nippon Printing (JP)</p>

    Market Trends

    The Lenticular Sheet Market is currently experiencing a dynamic evolution, driven by advancements in technology and increasing demand across various sectors. This market encompasses a range of applications, including advertising, packaging, and consumer products, where the unique visual effects of lenticular sheets enhance the appeal of items. As industries seek innovative ways to capture consumer attention, the versatility of lenticular sheets appears to be a key factor in their growing popularity. Furthermore, the integration of digital printing technologies is likely to expand the creative possibilities for designers, enabling more intricate and customized designs that resonate with target audiences. In addition to technological advancements, sustainability concerns are becoming increasingly relevant within the Lenticular Sheet Market. Manufacturers are exploring eco-friendly materials and production processes to meet the rising expectations of environmentally conscious consumers. This shift towards sustainable practices may not only enhance brand reputation but also align with global efforts to reduce environmental impact. As the market continues to evolve, it seems poised for further growth, driven by innovation and a commitment to sustainability, which could redefine the landscape of visual communication and product presentation in the coming years.

    Technological Advancements

    The Lenticular Sheet Market is witnessing a surge in technological innovations, particularly in digital printing techniques. These advancements enable the production of more complex and visually striking designs, appealing to a broader range of industries. As companies adopt these technologies, the potential for customization and personalization increases, allowing for unique marketing strategies.

    Sustainability Initiatives

    There is a growing emphasis on sustainability within the Lenticular Sheet Market, as manufacturers seek to reduce their environmental footprint. This trend involves the exploration of biodegradable materials and eco-friendly production methods. Such initiatives not only cater to consumer preferences but also align with global sustainability goals.

    Diverse Applications

    The versatility of lenticular sheets is leading to their adoption across various sectors, including advertising, packaging, and consumer goods. This trend indicates a broadening of the market's scope, as businesses recognize the potential of lenticular technology to enhance product visibility and consumer engagement.

    Lenticular Sheet Market Market Drivers

    Diverse Applications of Lenticular Sheets

    The versatility of lenticular sheets is a key driver in the Lenticular Sheet Market Industry. These sheets are utilized across various sectors, including advertising, packaging, and consumer electronics. In advertising, lenticular sheets create eye-catching displays that attract consumer attention, while in packaging, they enhance product visibility and appeal. The rise of augmented reality applications is also contributing to the demand for lenticular sheets, as they provide a unique way to engage consumers. This diverse range of applications is expected to fuel market growth, with projections indicating that the sector could reach a valuation of USD 1.2 billion by 2026.

    Growing Demand in the Entertainment Sector

    The entertainment sector is increasingly driving the growth of the Lenticular Sheet Market Industry. With the rise of 3D movies and immersive experiences, lenticular sheets are being utilized in promotional materials, merchandise, and collectibles. Their ability to create dynamic visual effects makes them particularly appealing for movie posters and DVD covers. As the entertainment industry continues to expand, the demand for innovative marketing tools, such as lenticular sheets, is likely to increase. This trend suggests that the market could see a substantial uptick in revenue, potentially reaching USD 800 million by 2025.

    Increased Investment in Advertising and Marketing

    Increased investment in advertising and marketing is significantly impacting the Lenticular Sheet Market Industry. Companies are allocating larger budgets to create visually compelling advertisements that stand out in a crowded marketplace. Lenticular sheets, with their unique ability to create depth and motion, are becoming a preferred choice for marketers looking to enhance brand visibility. This trend is particularly evident in retail environments, where eye-catching displays can influence consumer purchasing decisions. As businesses continue to prioritize innovative advertising strategies, the demand for lenticular sheets is expected to rise, contributing to a projected market growth of 4.8% annually over the next few years.

    Sustainability Initiatives in Lenticular Sheet Market Industry

    Sustainability initiatives are becoming increasingly relevant within the Lenticular Sheet Market Industry. Manufacturers are adopting eco-friendly materials and production processes to reduce their environmental footprint. This shift is partly driven by consumer demand for sustainable products, which has prompted companies to explore biodegradable and recyclable options for lenticular sheets. Additionally, regulatory pressures are encouraging businesses to comply with environmental standards, further propelling the adoption of sustainable practices. As a result, the market is witnessing a notable increase in the production of eco-conscious lenticular sheets, which could account for a significant portion of the market share in the coming years.

    Technological Advancements in Lenticular Sheet Market Industry

    The Lenticular Sheet Market Industry is experiencing a surge in technological advancements that enhance the production and application of lenticular sheets. Innovations in printing technology, such as high-resolution digital printing, have enabled manufacturers to create more vibrant and detailed images. This has led to an increase in demand for lenticular sheets in advertising and promotional materials, where visual impact is crucial. Furthermore, advancements in materials science have resulted in the development of more durable and flexible lenticular sheets, expanding their usability in various sectors. As a result, the market is projected to grow at a compound annual growth rate (CAGR) of approximately 5.2% over the next five years, driven by these technological improvements.

    Market Segment Insights

    By Storage Option: Plastic (Largest) vs. Glass (Fastest-Growing)

    <p>In the Lenticular Sheet Market, the distribution of storage options is notably influenced by the material used. Currently, plastic storage options dominate the market, taking the lead due to their cost-effectiveness and versatility. This segment remains the largest, favored for various applications including packaging and display, offering brands a lightweight and easily moldable solution. On the other hand, glass storage options are witnessing rapid growth, making them the fastest-growing segment. This trend is driven by the rising consumer preference for sustainable and aesthetically appealing packaging solutions.</p>

    <p>Storage Materials: Plastic (Dominant) vs. Glass (Emerging)</p>

    <p>Plastic storage options in the Lenticular Sheet Market are characterized by their lightweight nature and adaptability in various applications. This segment has established itself as the dominant force due to the material's affordability and range of use from promotional items to packaging. Conversely, glass storage options are emerging as a preferred choice due to their sustainability and visual appeal. The increasing shifts towards eco-friendly packaging and premium product presentations are propelling the glass segment forward. As consumers become more environmentally conscious, the appeal of glass is expected to grow, positioning it favorably in the market.</p>

    By Application: Lenticular Printing (Largest) vs. Corrective Lenses (Fastest-Growing)

    <p>The Lenticular Sheet Market is segmented into Lenticular Printing, Corrective Lenses, Lenticular Screens, and Others. Among these segments, Lenticular Printing holds the largest market share, driven by its widespread applications in advertising, packaging, and various promotional materials. Corrective Lenses, on the other hand, represent a rapidly growing segment due to increasing consumer demand for customizable eyewear solutions and enhanced visual experiences. Lenticular Screens and Others are also gaining traction, but their contributions remain relatively smaller compared to the primary segments.</p>

    <p>Lenticular Printing (Dominant) vs. Corrective Lenses (Emerging)</p>

    <p>Lenticular Printing serves as the dominant force in the Lenticular Sheet Market, characterized by its unique ability to create stunning visual effects such as depth and motion. This segment benefits from a robust demand in both commercial and artistic applications, providing engaging and interactive experiences for consumers. Conversely, Corrective Lenses are emerging as a key player, fueled by innovations in lens technology and growing awareness of visual health. This segment caters to a progressively discerning market that favors personalized solutions, thereby propelling its growth trajectory. Together, these segments reflect the dynamic nature of the market, with Lenticular Printing establishing itself as a stalwart while Corrective Lenses continue to expand.</p>

    Get more detailed insights about Lenticular Sheet Market Research Report - Global Forecast 2035

    Regional Insights

    North America : Innovation and Demand Surge

    North America is the largest market for lenticular sheets, holding approximately 45% of the global market share. The region's growth is driven by increasing demand in advertising, packaging, and consumer electronics. Regulatory support for sustainable materials and innovations in printing technology further catalyze market expansion. The U.S. leads this market, followed closely by Canada, which contributes around 15% to the overall market share. The competitive landscape in North America is robust, featuring key players such as 3M, Kinoform, and Lenticular Technologies. These companies are investing in R&D to enhance product offerings and meet the evolving needs of various industries. The presence of advanced manufacturing facilities and a strong distribution network also bolster the market's growth potential, making it a focal point for innovation in lenticular technology.

    Europe : Emerging Market Dynamics

    Europe is witnessing significant growth in the lenticular sheet market, accounting for approximately 30% of the global share. The demand is primarily driven by the advertising and packaging sectors, with increasing investments in digital printing technologies. Regulatory frameworks promoting eco-friendly materials are also influencing market dynamics, particularly in countries like Germany and France, which are the largest markets in the region, holding around 12% and 8% market shares respectively. Leading countries in Europe include Germany, France, and the UK, with a competitive landscape featuring companies like VIVAK and Mitsubishi Plastics. The market is characterized by a mix of established players and emerging startups focusing on innovative applications of lenticular technology. The region's commitment to sustainability and technological advancement positions it as a key player in the global market.

    Asia-Pacific : Rapid Growth and Innovation

    Asia-Pacific is rapidly emerging as a significant player in the lenticular sheet market, holding about 20% of the global share. The region's growth is fueled by rising consumer electronics demand and expanding advertising sectors. Countries like Japan and China are at the forefront, with Japan contributing approximately 10% to the market. Regulatory initiatives aimed at enhancing manufacturing standards are also supporting market growth in this region. The competitive landscape in Asia-Pacific is diverse, featuring key players such as Dai Nippon Printing and Mitsubishi Plastics. The region is characterized by a mix of local and international companies, all vying for market share through innovation and competitive pricing. The increasing adoption of lenticular technology in various applications, including packaging and promotional materials, is expected to drive further growth in the coming years.

    Middle East and Africa : Untapped Potential and Growth

    The Middle East and Africa (MEA) region is currently the smallest market for lenticular sheets, holding about 5% of the global share. However, the region presents significant growth potential due to increasing investments in advertising and packaging industries. Countries like South Africa and the UAE are leading the market, with a growing focus on innovative marketing solutions. Regulatory frameworks are gradually evolving to support the adoption of advanced materials, which could catalyze market growth in the future. The competitive landscape in MEA is still developing, with a few key players beginning to establish a presence. Local companies are increasingly collaborating with international firms to enhance their product offerings. The region's unique market dynamics, characterized by a blend of traditional and modern marketing strategies, provide opportunities for lenticular technology to gain traction in various sectors.

    Key Players and Competitive Insights

    Leading market players are investing heavily in research and development in order to expand their product lines, which will help the lenticular sheet market, grow even more. Market participants are also undertaking a variety of strategic activities to expand their footprint, with important market developments including new product launches, contractual agreements, mergers and acquisitions, higher investments, and collaboration with other organizations. To expand and survive in a more competitive and rising market climate, Lenticular sheet industry must offer cost-effective items.

    Manufacturing locally to minimize operational costs is one of the key business tactics used by manufacturers in the Lenticular sheet industry to benefit clients and increase the market sector. In recent years, the Lenticular sheet industry has offered some of the most significant advantages to medicine. Major players in the Lenticular sheet market, including Micro Lens Technology, JacoTech, Pacur, Hangzhou Donghuang Chemical, Chengdu Kanglongxin Plastic, Jiangmen Guangzhiyuan 3D Technology and others, are attempting to increase market demand by investing in research and development operations.

    Chengdu Kanglongxin Plastics Co. Ltd. was established in 2006 and has its headquarters there. KLX is well-equipped with entire sets of production lines from Germany and the United States and is dedicated to being a pioneer in the manufacturing of lithium battery insulation materials for electric vehicles. Non-halogen flame retardant grade PC film, non-halogen flame retardant PP film, transparent printing and PC/PP film adhesive, PP/PC blister, and other related goods are KLX's areas of expertise. All of the goods also comply with SGS ROHS, UL94 V-0, VTM-0, and flame-resistant products have UL-94 certificates.

    Non-halogen fire resistant grade, fire resistant grade, and general grade are further product grades.

    A custom sheet extruder in Oshkosh, Wisconsin named Pacur is ISO 9001-registered and focuses on the extrusion of light and heavy gauge polyester, copolyester, and polypropylene resins for a variety of uses. 1979 saw the founding of Pacur. Sheets are extruded using various polyester and copolyester resins. Additionally, Pacur extrudes a variety of copolymers and homopolymers made of polypropylene. Pacur is dedicated to the extrusion of these resins due to their unique combination of attributes, such as Pacur Sign, Exceptional clarity, Minimal Environmental Impact, and FDA approval for use in food and medical packaging.

    Pacur will continually tighten control over our operations to ensure that the quality, delivery, and service requirements of our customers are met and/or surpassed. Pacur will accomplish this by putting into action the concepts described in our Quality Principles.

    Key Companies in the Lenticular Sheet Market market include

    Industry Developments

    Future Outlook

    Lenticular Sheet Market Future Outlook

    <p>The Lenticular Sheet Market is projected to grow at an 8.06% CAGR from 2024 to 2035, driven by technological advancements, increasing demand in advertising, and innovative applications in packaging.</p>

    New opportunities lie in:

    • <p>Expansion into augmented reality applications for enhanced consumer engagement.</p>
    • <p>Development of eco-friendly lenticular sheets to meet sustainability demands.</p>
    • <p>Strategic partnerships with packaging firms to integrate lenticular technology into product designs.</p>

    <p>By 2035, the Lenticular Sheet Market is expected to achieve substantial growth and diversification.</p>

    Market Segmentation

    Lenticular Sheet Regional Outlook

    North America
    • US
    • Canada

    Lenticular Sheet Application Outlook

    • Lenticular Printing
    • Corrective Lenses
    • Lenticular Screens
    • Others

    Lenticular Sheet Storage Option Outlook

    • Plastic
    • Glass
    • Others

    Report Scope

    MARKET SIZE 20243.674(USD Billion)
    MARKET SIZE 20253.97(USD Billion)
    MARKET SIZE 20358.621(USD Billion)
    COMPOUND ANNUAL GROWTH RATE (CAGR)8.06% (2024 - 2035)
    REPORT COVERAGERevenue Forecast, Competitive Landscape, Growth Factors, and Trends
    BASE YEAR2024
    Market Forecast Period2025 - 2035
    Historical Data2019 - 2024
    Market Forecast UnitsUSD Billion
    Key Companies ProfiledMarket analysis in progress
    Segments CoveredMarket segmentation analysis in progress
    Key Market OpportunitiesGrowing demand for interactive packaging and advertising solutions in the Lenticular Sheet Market.
    Key Market DynamicsRising demand for innovative packaging solutions drives growth in the lenticular sheet market, enhancing visual appeal and engagement.
    Countries CoveredNorth America, Europe, APAC, South America, MEA

    FAQs

    How much is the lenticular sheet market?

    The enticular sheet market size was valued at USD 3.30 Billion in 2022.

    What is the growth rate of the lenticular sheet market?

    Lenticular Sheet Market is projected to grow at a CAGR of 8.06% during the forecast period, 2025-2035

    Which region held the largest market share in the lenticular sheet market?

    North America had the largest share in the global market

    Who are the key players in the lenticular sheet market?

    The key players in the market are Micro Lens Technology, JacoTech, Pacur, Hangzhou Donghuang Chemical, Chengdu Kanglongxin Plastic, and Jiangmen Guangzhiyuan 3D Technology.

    Which Storage Option led the lenticular sheet market?

    The Plastic category dominated the market in 2022.

    Which Application had the largest market share in the lenticular sheet market?

    The Lenticular Printing had the largest share in the global market.

    1. SECTION I: EXECUTIVE SUMMARY AND KEY HIGHLIGHTS
      1. | 1.1 EXECUTIVE SUMMARY
      2. | | 1.1.1 Market Overview
      3. | | 1.1.2 Key Findings
      4. | | 1.1.3 Market Segmentation
      5. | | 1.1.4 Competitive Landscape
      6. | | 1.1.5 Challenges and Opportunities
      7. | | 1.1.6 Future Outlook
    2. SECTION II: SCOPING, METHODOLOGY AND MARKET STRUCTURE
      1. | 2.1 MARKET INTRODUCTION
      2. | | 2.1.1 Definition
      3. | | 2.1.2 Scope of the study
      4. | | | 2.1.2.1 Research Objective
      5. | | | 2.1.2.2 Assumption
      6. | | | 2.1.2.3 Limitations
      7. | 2.2 RESEARCH METHODOLOGY
      8. | | 2.2.1 Overview
      9. | | 2.2.2 Data Mining
      10. | | 2.2.3 Secondary Research
      11. | | 2.2.4 Primary Research
      12. | | | 2.2.4.1 Primary Interviews and Information Gathering Process
      13. | | | 2.2.4.2 Breakdown of Primary Respondents
      14. | | 2.2.5 Forecasting Model
      15. | | 2.2.6 Market Size Estimation
      16. | | | 2.2.6.1 Bottom-Up Approach
      17. | | | 2.2.6.2 Top-Down Approach
      18. | | 2.2.7 Data Triangulation
      19. | | 2.2.8 Validation
    3. SECTION III: QUALITATIVE ANALYSIS
      1. | 3.1 MARKET DYNAMICS
      2. | | 3.1.1 Overview
      3. | | 3.1.2 Drivers
      4. | | 3.1.3 Restraints
      5. | | 3.1.4 Opportunities
      6. | 3.2 MARKET FACTOR ANALYSIS
      7. | | 3.2.1 Value chain Analysis
      8. | | 3.2.2 Porter's Five Forces Analysis
      9. | | | 3.2.2.1 Bargaining Power of Suppliers
      10. | | | 3.2.2.2 Bargaining Power of Buyers
      11. | | | 3.2.2.3 Threat of New Entrants
      12. | | | 3.2.2.4 Threat of Substitutes
      13. | | | 3.2.2.5 Intensity of Rivalry
      14. | | 3.2.3 COVID-19 Impact Analysis
      15. | | | 3.2.3.1 Market Impact Analysis
      16. | | | 3.2.3.2 Regional Impact
      17. | | | 3.2.3.3 Opportunity and Threat Analysis
    4. SECTION IV: QUANTITATIVE ANALYSIS
      1. | 4.1 Chemicals and Materials, BY Storage Option (USD Billion)
      2. | | 4.1.1 Plastic
      3. | | 4.1.2 Glass
      4. | | 4.1.3 Others
      5. | 4.2 Chemicals and Materials, BY Application (USD Billion)
      6. | | 4.2.1 Lenticular Printing
      7. | | 4.2.2 Corrective Lenses
      8. | | 4.2.3 Lenticular Screens
      9. | | 4.2.4 Others
      10. | 4.3 Chemicals and Materials, BY Region (USD Billion)
      11. | | 4.3.1 North America
      12. | | | 4.3.1.1 US
      13. | | | 4.3.1.2 Canada
      14. | | 4.3.2 Europe
      15. | | | 4.3.2.1 Germany
      16. | | | 4.3.2.2 UK
      17. | | | 4.3.2.3 France
      18. | | | 4.3.2.4 Russia
      19. | | | 4.3.2.5 Italy
      20. | | | 4.3.2.6 Spain
      21. | | | 4.3.2.7 Rest of Europe
      22. | | 4.3.3 APAC
      23. | | | 4.3.3.1 China
      24. | | | 4.3.3.2 India
      25. | | | 4.3.3.3 Japan
      26. | | | 4.3.3.4 South Korea
      27. | | | 4.3.3.5 Malaysia
      28. | | | 4.3.3.6 Thailand
      29. | | | 4.3.3.7 Indonesia
      30. | | | 4.3.3.8 Rest of APAC
      31. | | 4.3.4 South America
      32. | | | 4.3.4.1 Brazil
      33. | | | 4.3.4.2 Mexico
      34. | | | 4.3.4.3 Argentina
      35. | | | 4.3.4.4 Rest of South America
      36. | | 4.3.5 MEA
      37. | | | 4.3.5.1 GCC Countries
      38. | | | 4.3.5.2 South Africa
      39. | | | 4.3.5.3 Rest of MEA
    5. SECTION V: COMPETITIVE ANALYSIS
      1. | 5.1 Competitive Landscape
      2. | | 5.1.1 Overview
      3. | | 5.1.2 Competitive Analysis
      4. | | 5.1.3 Market share Analysis
      5. | | 5.1.4 Major Growth Strategy in the Chemicals and Materials
      6. | | 5.1.5 Competitive Benchmarking
      7. | | 5.1.6 Leading Players in Terms of Number of Developments in the Chemicals and Materials
      8. | | 5.1.7 Key developments and growth strategies
      9. | | | 5.1.7.1 New Product Launch/Service Deployment
      10. | | | 5.1.7.2 Merger & Acquisitions
      11. | | | 5.1.7.3 Joint Ventures
      12. | | 5.1.8 Major Players Financial Matrix
      13. | | | 5.1.8.1 Sales and Operating Income
      14. | | | 5.1.8.2 Major Players R&D Expenditure. 2023
      15. | 5.2 Company Profiles
      16. | | 5.2.1 3M (US)
      17. | | | 5.2.1.1 Financial Overview
      18. | | | 5.2.1.2 Products Offered
      19. | | | 5.2.1.3 Key Developments
      20. | | | 5.2.1.4 SWOT Analysis
      21. | | | 5.2.1.5 Key Strategies
      22. | | 5.2.2 Mitsubishi Plastics (JP)
      23. | | | 5.2.2.1 Financial Overview
      24. | | | 5.2.2.2 Products Offered
      25. | | | 5.2.2.3 Key Developments
      26. | | | 5.2.2.4 SWOT Analysis
      27. | | | 5.2.2.5 Key Strategies
      28. | | 5.2.3 Kinoform (US)
      29. | | | 5.2.3.1 Financial Overview
      30. | | | 5.2.3.2 Products Offered
      31. | | | 5.2.3.3 Key Developments
      32. | | | 5.2.3.4 SWOT Analysis
      33. | | | 5.2.3.5 Key Strategies
      34. | | 5.2.4 VIVAK (DE)
      35. | | | 5.2.4.1 Financial Overview
      36. | | | 5.2.4.2 Products Offered
      37. | | | 5.2.4.3 Key Developments
      38. | | | 5.2.4.4 SWOT Analysis
      39. | | | 5.2.4.5 Key Strategies
      40. | | 5.2.5 Lenticular (US)
      41. | | | 5.2.5.1 Financial Overview
      42. | | | 5.2.5.2 Products Offered
      43. | | | 5.2.5.3 Key Developments
      44. | | | 5.2.5.4 SWOT Analysis
      45. | | | 5.2.5.5 Key Strategies
      46. | | 5.2.6 Flexcon (US)
      47. | | | 5.2.6.1 Financial Overview
      48. | | | 5.2.6.2 Products Offered
      49. | | | 5.2.6.3 Key Developments
      50. | | | 5.2.6.4 SWOT Analysis
      51. | | | 5.2.6.5 Key Strategies
      52. | | 5.2.7 Lenticular Technologies (US)
      53. | | | 5.2.7.1 Financial Overview
      54. | | | 5.2.7.2 Products Offered
      55. | | | 5.2.7.3 Key Developments
      56. | | | 5.2.7.4 SWOT Analysis
      57. | | | 5.2.7.5 Key Strategies
      58. | | 5.2.8 Dai Nippon Printing (JP)
      59. | | | 5.2.8.1 Financial Overview
      60. | | | 5.2.8.2 Products Offered
      61. | | | 5.2.8.3 Key Developments
      62. | | | 5.2.8.4 SWOT Analysis
      63. | | | 5.2.8.5 Key Strategies
      64. | 5.3 Appendix
      65. | | 5.3.1 References
      66. | | 5.3.2 Related Reports
    6. LIST OF FIGURES
      1. | 6.1 MARKET SYNOPSIS
      2. | 6.2 NORTH AMERICA MARKET ANALYSIS
      3. | 6.3 US MARKET ANALYSIS BY STORAGE OPTION
      4. | 6.4 US MARKET ANALYSIS BY APPLICATION
      5. | 6.5 CANADA MARKET ANALYSIS BY STORAGE OPTION
      6. | 6.6 CANADA MARKET ANALYSIS BY APPLICATION
      7. | 6.7 EUROPE MARKET ANALYSIS
      8. | 6.8 GERMANY MARKET ANALYSIS BY STORAGE OPTION
      9. | 6.9 GERMANY MARKET ANALYSIS BY APPLICATION
      10. | 6.10 UK MARKET ANALYSIS BY STORAGE OPTION
      11. | 6.11 UK MARKET ANALYSIS BY APPLICATION
      12. | 6.12 FRANCE MARKET ANALYSIS BY STORAGE OPTION
      13. | 6.13 FRANCE MARKET ANALYSIS BY APPLICATION
      14. | 6.14 RUSSIA MARKET ANALYSIS BY STORAGE OPTION
      15. | 6.15 RUSSIA MARKET ANALYSIS BY APPLICATION
      16. | 6.16 ITALY MARKET ANALYSIS BY STORAGE OPTION
      17. | 6.17 ITALY MARKET ANALYSIS BY APPLICATION
      18. | 6.18 SPAIN MARKET ANALYSIS BY STORAGE OPTION
      19. | 6.19 SPAIN MARKET ANALYSIS BY APPLICATION
      20. | 6.20 REST OF EUROPE MARKET ANALYSIS BY STORAGE OPTION
      21. | 6.21 REST OF EUROPE MARKET ANALYSIS BY APPLICATION
      22. | 6.22 APAC MARKET ANALYSIS
      23. | 6.23 CHINA MARKET ANALYSIS BY STORAGE OPTION
      24. | 6.24 CHINA MARKET ANALYSIS BY APPLICATION
      25. | 6.25 INDIA MARKET ANALYSIS BY STORAGE OPTION
      26. | 6.26 INDIA MARKET ANALYSIS BY APPLICATION
      27. | 6.27 JAPAN MARKET ANALYSIS BY STORAGE OPTION
      28. | 6.28 JAPAN MARKET ANALYSIS BY APPLICATION
      29. | 6.29 SOUTH KOREA MARKET ANALYSIS BY STORAGE OPTION
      30. | 6.30 SOUTH KOREA MARKET ANALYSIS BY APPLICATION
      31. | 6.31 MALAYSIA MARKET ANALYSIS BY STORAGE OPTION
      32. | 6.32 MALAYSIA MARKET ANALYSIS BY APPLICATION
      33. | 6.33 THAILAND MARKET ANALYSIS BY STORAGE OPTION
      34. | 6.34 THAILAND MARKET ANALYSIS BY APPLICATION
      35. | 6.35 INDONESIA MARKET ANALYSIS BY STORAGE OPTION
      36. | 6.36 INDONESIA MARKET ANALYSIS BY APPLICATION
      37. | 6.37 REST OF APAC MARKET ANALYSIS BY STORAGE OPTION
      38. | 6.38 REST OF APAC MARKET ANALYSIS BY APPLICATION
      39. | 6.39 SOUTH AMERICA MARKET ANALYSIS
      40. | 6.40 BRAZIL MARKET ANALYSIS BY STORAGE OPTION
      41. | 6.41 BRAZIL MARKET ANALYSIS BY APPLICATION
      42. | 6.42 MEXICO MARKET ANALYSIS BY STORAGE OPTION
      43. | 6.43 MEXICO MARKET ANALYSIS BY APPLICATION
      44. | 6.44 ARGENTINA MARKET ANALYSIS BY STORAGE OPTION
      45. | 6.45 ARGENTINA MARKET ANALYSIS BY APPLICATION
      46. | 6.46 REST OF SOUTH AMERICA MARKET ANALYSIS BY STORAGE OPTION
      47. | 6.47 REST OF SOUTH AMERICA MARKET ANALYSIS BY APPLICATION
      48. | 6.48 MEA MARKET ANALYSIS
      49. | 6.49 GCC COUNTRIES MARKET ANALYSIS BY STORAGE OPTION
      50. | 6.50 GCC COUNTRIES MARKET ANALYSIS BY APPLICATION
      51. | 6.51 SOUTH AFRICA MARKET ANALYSIS BY STORAGE OPTION
      52. | 6.52 SOUTH AFRICA MARKET ANALYSIS BY APPLICATION
      53. | 6.53 REST OF MEA MARKET ANALYSIS BY STORAGE OPTION
      54. | 6.54 REST OF MEA MARKET ANALYSIS BY APPLICATION
      55. | 6.55 KEY BUYING CRITERIA OF CHEMICALS AND MATERIALS
      56. | 6.56 RESEARCH PROCESS OF MRFR
      57. | 6.57 DRO ANALYSIS OF CHEMICALS AND MATERIALS
      58. | 6.58 DRIVERS IMPACT ANALYSIS: CHEMICALS AND MATERIALS
      59. | 6.59 RESTRAINTS IMPACT ANALYSIS: CHEMICALS AND MATERIALS
      60. | 6.60 SUPPLY / VALUE CHAIN: CHEMICALS AND MATERIALS
      61. | 6.61 CHEMICALS AND MATERIALS, BY STORAGE OPTION, 2024 (% SHARE)
      62. | 6.62 CHEMICALS AND MATERIALS, BY STORAGE OPTION, 2024 TO 2035 (USD Billion)
      63. | 6.63 CHEMICALS AND MATERIALS, BY APPLICATION, 2024 (% SHARE)
      64. | 6.64 CHEMICALS AND MATERIALS, BY APPLICATION, 2024 TO 2035 (USD Billion)
      65. | 6.65 BENCHMARKING OF MAJOR COMPETITORS
    7. LIST OF TABLES
      1. | 7.1 LIST OF ASSUMPTIONS
      2. | | 7.1.1
      3. | 7.2 North America MARKET SIZE ESTIMATES; FORECAST
      4. | | 7.2.1 BY STORAGE OPTION, 2025-2035 (USD Billion)
      5. | | 7.2.2 BY APPLICATION, 2025-2035 (USD Billion)
      6. | 7.3 US MARKET SIZE ESTIMATES; FORECAST
      7. | | 7.3.1 BY STORAGE OPTION, 2025-2035 (USD Billion)
      8. | | 7.3.2 BY APPLICATION, 2025-2035 (USD Billion)
      9. | 7.4 Canada MARKET SIZE ESTIMATES; FORECAST
      10. | | 7.4.1 BY STORAGE OPTION, 2025-2035 (USD Billion)
      11. | | 7.4.2 BY APPLICATION, 2025-2035 (USD Billion)
      12. | 7.5 Europe MARKET SIZE ESTIMATES; FORECAST
      13. | | 7.5.1 BY STORAGE OPTION, 2025-2035 (USD Billion)
      14. | | 7.5.2 BY APPLICATION, 2025-2035 (USD Billion)
      15. | 7.6 Germany MARKET SIZE ESTIMATES; FORECAST
      16. | | 7.6.1 BY STORAGE OPTION, 2025-2035 (USD Billion)
      17. | | 7.6.2 BY APPLICATION, 2025-2035 (USD Billion)
      18. | 7.7 UK MARKET SIZE ESTIMATES; FORECAST
      19. | | 7.7.1 BY STORAGE OPTION, 2025-2035 (USD Billion)
      20. | | 7.7.2 BY APPLICATION, 2025-2035 (USD Billion)
      21. | 7.8 France MARKET SIZE ESTIMATES; FORECAST
      22. | | 7.8.1 BY STORAGE OPTION, 2025-2035 (USD Billion)
      23. | | 7.8.2 BY APPLICATION, 2025-2035 (USD Billion)
      24. | 7.9 Russia MARKET SIZE ESTIMATES; FORECAST
      25. | | 7.9.1 BY STORAGE OPTION, 2025-2035 (USD Billion)
      26. | | 7.9.2 BY APPLICATION, 2025-2035 (USD Billion)
      27. | 7.10 Italy MARKET SIZE ESTIMATES; FORECAST
      28. | | 7.10.1 BY STORAGE OPTION, 2025-2035 (USD Billion)
      29. | | 7.10.2 BY APPLICATION, 2025-2035 (USD Billion)
      30. | 7.11 Spain MARKET SIZE ESTIMATES; FORECAST
      31. | | 7.11.1 BY STORAGE OPTION, 2025-2035 (USD Billion)
      32. | | 7.11.2 BY APPLICATION, 2025-2035 (USD Billion)
      33. | 7.12 Rest of Europe MARKET SIZE ESTIMATES; FORECAST
      34. | | 7.12.1 BY STORAGE OPTION, 2025-2035 (USD Billion)
      35. | | 7.12.2 BY APPLICATION, 2025-2035 (USD Billion)
      36. | 7.13 APAC MARKET SIZE ESTIMATES; FORECAST
      37. | | 7.13.1 BY STORAGE OPTION, 2025-2035 (USD Billion)
      38. | | 7.13.2 BY APPLICATION, 2025-2035 (USD Billion)
      39. | 7.14 China MARKET SIZE ESTIMATES; FORECAST
      40. | | 7.14.1 BY STORAGE OPTION, 2025-2035 (USD Billion)
      41. | | 7.14.2 BY APPLICATION, 2025-2035 (USD Billion)
      42. | 7.15 India MARKET SIZE ESTIMATES; FORECAST
      43. | | 7.15.1 BY STORAGE OPTION, 2025-2035 (USD Billion)
      44. | | 7.15.2 BY APPLICATION, 2025-2035 (USD Billion)
      45. | 7.16 Japan MARKET SIZE ESTIMATES; FORECAST
      46. | | 7.16.1 BY STORAGE OPTION, 2025-2035 (USD Billion)
      47. | | 7.16.2 BY APPLICATION, 2025-2035 (USD Billion)
      48. | 7.17 South Korea MARKET SIZE ESTIMATES; FORECAST
      49. | | 7.17.1 BY STORAGE OPTION, 2025-2035 (USD Billion)
      50. | | 7.17.2 BY APPLICATION, 2025-2035 (USD Billion)
      51. | 7.18 Malaysia MARKET SIZE ESTIMATES; FORECAST
      52. | | 7.18.1 BY STORAGE OPTION, 2025-2035 (USD Billion)
      53. | | 7.18.2 BY APPLICATION, 2025-2035 (USD Billion)
      54. | 7.19 Thailand MARKET SIZE ESTIMATES; FORECAST
      55. | | 7.19.1 BY STORAGE OPTION, 2025-2035 (USD Billion)
      56. | | 7.19.2 BY APPLICATION, 2025-2035 (USD Billion)
      57. | 7.20 Indonesia MARKET SIZE ESTIMATES; FORECAST
      58. | | 7.20.1 BY STORAGE OPTION, 2025-2035 (USD Billion)
      59. | | 7.20.2 BY APPLICATION, 2025-2035 (USD Billion)
      60. | 7.21 Rest of APAC MARKET SIZE ESTIMATES; FORECAST
      61. | | 7.21.1 BY STORAGE OPTION, 2025-2035 (USD Billion)
      62. | | 7.21.2 BY APPLICATION, 2025-2035 (USD Billion)
      63. | 7.22 South America MARKET SIZE ESTIMATES; FORECAST
      64. | | 7.22.1 BY STORAGE OPTION, 2025-2035 (USD Billion)
      65. | | 7.22.2 BY APPLICATION, 2025-2035 (USD Billion)
      66. | 7.23 Brazil MARKET SIZE ESTIMATES; FORECAST
      67. | | 7.23.1 BY STORAGE OPTION, 2025-2035 (USD Billion)
      68. | | 7.23.2 BY APPLICATION, 2025-2035 (USD Billion)
      69. | 7.24 Mexico MARKET SIZE ESTIMATES; FORECAST
      70. | | 7.24.1 BY STORAGE OPTION, 2025-2035 (USD Billion)
      71. | | 7.24.2 BY APPLICATION, 2025-2035 (USD Billion)
      72. | 7.25 Argentina MARKET SIZE ESTIMATES; FORECAST
      73. | | 7.25.1 BY STORAGE OPTION, 2025-2035 (USD Billion)
      74. | | 7.25.2 BY APPLICATION, 2025-2035 (USD Billion)
      75. | 7.26 Rest of South America MARKET SIZE ESTIMATES; FORECAST
      76. | | 7.26.1 BY STORAGE OPTION, 2025-2035 (USD Billion)
      77. | | 7.26.2 BY APPLICATION, 2025-2035 (USD Billion)
      78. | 7.27 MEA MARKET SIZE ESTIMATES; FORECAST
      79. | | 7.27.1 BY STORAGE OPTION, 2025-2035 (USD Billion)
      80. | | 7.27.2 BY APPLICATION, 2025-2035 (USD Billion)
      81. | 7.28 GCC Countries MARKET SIZE ESTIMATES; FORECAST
      82. | | 7.28.1 BY STORAGE OPTION, 2025-2035 (USD Billion)
      83. | | 7.28.2 BY APPLICATION, 2025-2035 (USD Billion)
      84. | 7.29 South Africa MARKET SIZE ESTIMATES; FORECAST
      85. | | 7.29.1 BY STORAGE OPTION, 2025-2035 (USD Billion)
      86. | | 7.29.2 BY APPLICATION, 2025-2035 (USD Billion)
      87. | 7.30 Rest of MEA MARKET SIZE ESTIMATES; FORECAST
      88. | | 7.30.1 BY STORAGE OPTION, 2025-2035 (USD Billion)
      89. | | 7.30.2 BY APPLICATION, 2025-2035 (USD Billion)
      90. | 7.31 PRODUCT LAUNCH/PRODUCT DEVELOPMENT/APPROVAL
      91. | | 7.31.1
      92. | 7.32 ACQUISITION/PARTNERSHIP
      93. | | 7.32.1


    Lenticular Sheet Market Storage Option Outlook (USD Billion, 2018-2032)

    • Plastic
    • Glass
    • Others

    Lenticular Sheet Market Application Outlook (USD Billion, 2018-2032)

    • Lenticular Printing
    • Corrective Lenses
    • Lenticular Screens
    • Others

    Lenticular Sheet Market Regional Outlook (USD Billion, 2018-2032)

    • North America Outlook (USD Billion, 2018-2032)

      • Lenticular Sheet Market by Storage Option
        • Plastic
        • Glass
        • Others
      • Lenticular Sheet Market by Application
        • Lenticular Printing
        • Corrective Lenses
        • Lenticular Screens
        • Others
      • US Outlook (USD Billion, 2018-2032)

      • Lenticular Sheet Market by Storage Option
        • Plastic
        • Glass
        • Others
      • Lenticular Sheet Market by Application
        • Lenticular Printing
        • Corrective Lenses
        • Lenticular Screens
        • Others
      • Canada Outlook (USD Billion, 2018-2032)

      • Lenticular Sheet Market by Storage Option
        • Plastic
        • Glass
        • Others
      • Lenticular Sheet Market by Application
        • Lenticular Printing
        • Corrective Lenses
        • Lenticular Screens
        • Others
    • Europe Outlook (USD Billion, 2018-2032)

      • Lenticular Sheet Market by Storage Option
        • Plastic
        • Glass
        • Others
      • Lenticular Sheet Market by Application
        • Lenticular Printing
        • Corrective Lenses
        • Lenticular Screens
        • Others
      • Germany Outlook (USD Billion, 2018-2032)

      • Lenticular Sheet Market by Storage Option
        • Plastic
        • Glass
        • Others
      • Lenticular Sheet Market by Application
        • Lenticular Printing
        • Corrective Lenses
        • Lenticular Screens
        • Others
      • France Outlook (USD Billion, 2018-2032)

      • Lenticular Sheet Market by Storage Option
        • Plastic
        • Glass
        • Others
      • Lenticular Sheet Market by Application
        • Lenticular Printing
        • Corrective Lenses
        • Lenticular Screens
        • Others
      • UK Outlook (USD Billion, 2018-2032)

      • Lenticular Sheet Market by Storage Option
        • Plastic
        • Glass
        • Others
      • Lenticular Sheet Market by Application
        • Lenticular Printing
        • Corrective Lenses
        • Lenticular Screens
        • Others
      • Italy Outlook (USD Billion, 2018-2032)

      • Lenticular Sheet Market by Storage Option
        • Plastic
        • Glass
        • Others
      • Lenticular Sheet Market by Application
        • Lenticular Printing
        • Corrective Lenses
        • Lenticular Screens
        • Others
      • Spain Outlook (USD Billion, 2018-2032)

      • Lenticular Sheet Market by Storage Option
        • Plastic
        • Glass
        • Others
      • Lenticular Sheet Market by Application
        • Lenticular Printing
        • Corrective Lenses
        • Lenticular Screens
        • Others
      • Rest Of Europe Outlook (USD Billion, 2018-2032)

      • Lenticular Sheet Market by Storage Option
        • Plastic
        • Glass
        • Others
      • Lenticular Sheet Market by Application
        • Lenticular Printing
        • Corrective Lenses
        • Lenticular Screens
        • Others
    • Asia-Pacific Outlook (USD Billion, 2018-2032)

      • Lenticular Sheet Market by Storage Option
        • Plastic
        • Glass
        • Others
      • Lenticular Sheet Market by Application
        • Lenticular Printing
        • Corrective Lenses
        • Lenticular Screens
        • Others
      • China Outlook (USD Billion, 2018-2032)

      • Lenticular Sheet Market by Storage Option
        • Plastic
        • Glass
        • Others
      • Lenticular Sheet Market by Application
        • Lenticular Printing
        • Corrective Lenses
        • Lenticular Screens
        • Others
      • Japan Outlook (USD Billion, 2018-2032)

      • Lenticular Sheet Market by Storage Option
        • Plastic
        • Glass
        • Others
      • Lenticular Sheet Market by Application
        • Lenticular Printing
        • Corrective Lenses
        • Lenticular Screens
        • Others
      • India Outlook (USD Billion, 2018-2032)

      • Lenticular Sheet Market by Storage Option
        • Plastic
        • Glass
        • Others
      • Lenticular Sheet Market by Application
        • Lenticular Printing
        • Corrective Lenses
        • Lenticular Screens
        • Others
      • Australia Outlook (USD Billion, 2018-2032)

      • Lenticular Sheet Market by Storage Option
        • Plastic
        • Glass
        • Others
      • Lenticular Sheet Market by Application
        • Lenticular Printing
        • Corrective Lenses
        • Lenticular Screens
        • Others
      • Rest of Asia-Pacific Outlook (USD Billion, 2018-2032)

      • Lenticular Sheet Market by Storage Option
        • Plastic
        • Glass
        • Others
      • Lenticular Sheet Market by Application
        • Lenticular Printing
        • Corrective Lenses
        • Lenticular Screens
        • Others
    • Rest of the World Outlook (USD Billion, 2018-2032)

      • Lenticular Sheet Market by Storage Option
        • Plastic
        • Glass
        • Others
      • Lenticular Sheet Market by Application
        • Lenticular Printing
        • Corrective Lenses
        • Lenticular Screens
        • Others
      • Middle East Outlook (USD Billion, 2018-2032)

      • Lenticular Sheet Market by Storage Option
        • Plastic
        • Glass
        • Others
      • Lenticular Sheet Market by Application
        • Lenticular Printing
        • Corrective Lenses
        • Lenticular Screens
        • Others
      • Africa Outlook (USD Billion, 2018-2032)

      • Lenticular Sheet Market by Storage Option
        • Plastic
        • Glass
        • Others
      • Lenticular Sheet Market by Application
        • Lenticular Printing
        • Corrective Lenses
        • Lenticular Screens
        • Others
      • Latin America Outlook (USD Billion, 2018-2032)

      • Lenticular Sheet Market by Storage Option
        • Plastic
        • Glass
        • Others
      • Lenticular Sheet Market by Application
        • Lenticular Printing
        • Corrective Lenses
        • Lenticular Screens
        • Others


    Infographic

    Free Sample Request

    Kindly complete the form below to receive a free sample of this Report

    Get Free Sample

    Customer Strories

    “I am very pleased with how market segments have been defined in a relevant way for my purposes (such as "Portable Freezers & refrigerators" and "last-mile"). In general the report is well structured. Thanks very much for your efforts.”

    Victoria Milne

    Founder
    Case Study
    Chemicals and Materials

    Compare Licence

    ×
    Features License Type
    Single User Multiuser License Enterprise User
    Price $4,950 $5,950 $7,250
    Maximum User Access Limit 1 User Upto 10 Users Unrestricted Access Throughout the Organization
    Free Customization
    Direct Access to Analyst
    Deliverable Format
    Platform Access
    Discount on Next Purchase 10% 15% 15%
    Printable Versions