• Cat-intel
  • MedIntelliX
  • Resources
  • About Us
  • Request Free Sample ×

    Kindly complete the form below to receive a free sample of this Report

    Leading companies partner with us for data-driven Insights

    clients tt-cursor

    Kenya Used Car Market

    ID: MRFR/AM/26354-HCR
    128 Pages
    Sejal Akre
    September 2025

    Kenya Used Car Market Research Report By Car Body Type (Hatchbacks, Sedans, SUVs, MPVs), By Car Brand (Toyota, Nissan, Mitsubishi, Subaru, Honda), By Car Age (1-3 Years, 4-6 Years, 7-9 Years, 10 Years and Above), By Fuel Type (Petrol, Diesel, Hybrid, Electric), By Car Transmission (Manual, Automatic, CVT) and By Regional (North America, Europe, South America, Asia Pacific, Middle East and Africa) - Forecast to 2034

    Share:
    Download PDF ×

    We do not share your information with anyone. However, we may send you emails based on your report interest from time to time. You may contact us at any time to opt-out.

    Kenya Used Car Market Research Report- Forecast till 2034 Infographic
    Purchase Options
    $ 4,950.0
    $ 5,950.0
    $ 7,250.0
    Table of Contents

    Kenya Used Car Market Summary

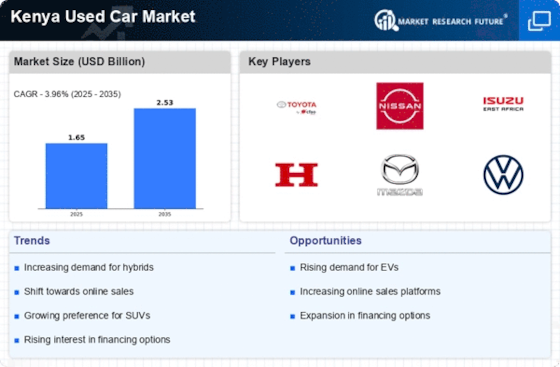
    The Kenya used car market is projected to grow from 1.65 USD billion in 2024 to 2.54 USD billion by 2035.

    Key Market Trends & Highlights

    Kenya Used Car Key Trends and Highlights

    • The market is expected to experience a compound annual growth rate (CAGR) of 3.99 percent from 2025 to 2035.
    • By 2035, the market valuation is anticipated to reach 2.54 USD billion, reflecting a robust growth trajectory.
    • In 2024, the market is valued at 1.65 USD billion, indicating a solid foundation for future expansion.
    • Growing adoption of used cars due to increasing urbanization is a major market driver.

    Market Size & Forecast

    2024 Market Size 1.65 (USD Billion)
    2035 Market Size 2.54 (USD Billion)
    CAGR (2025-2035) 3.99%

    Major Players

    Car General, Toyota Kenya, DT Dobie, Nissan Kenya, Isuzu East Africa, Simba Corp, Kia Kenya, MercedesBenz Kenya, BMW Kenya, Subaru Kenya, Ford Kenya, Honda Kenya, Hyundai Kenya, Mazda Kenya, Mitsubishi Kenya, Volkswagen Kenya

    Kenya Used Car Market Trends

    Key Market Drivers: Increasing population, rising disposable income, urbanization, and a growing middle class in Kenya are fueling the demand for used cars. Improved infrastructure and favorable government policies are also contributing to market growth. Opportunities to be Explored: The market presents opportunities for both local and international players to enter and establish a strong presence. Expansion into new market segments, such as electric and hybrid vehicles, could also drive growth. Recent Trends: Technology advancements have led to the emergence of online marketplaces and mobile applications, making it easier for buyers and sellers to connect.

    The rise of ride-hailing services has increased demand for used cars as vehicles for transportation.

    Source: Primary Research, Secondary Research, Market Research Future Database and Analyst Review

    The Kenyan used car market exhibits a dynamic interplay of supply and demand, driven by shifting consumer preferences and economic factors that influence purchasing power.

    Kenya National Bureau of Statistics

    Kenya Used Car Market Drivers

    Market Growth Trends

    Increased Vehicle Ownership Rates

    The Global Kenya Used Car Market Industry is likely to benefit from the increasing vehicle ownership rates across the country. As the economy expands, more households are acquiring vehicles, leading to a higher demand for used cars. This trend is supported by the rising middle class, which is becoming more financially capable of purchasing vehicles. The growth in ownership rates is expected to contribute to the market's expansion, with projections indicating a rise to 2.54 USD Billion by 2035. This increase in ownership not only boosts the used car market but also stimulates related sectors such as insurance and maintenance services, creating a ripple effect throughout the economy.

    Expansion of Online Car Sales Platforms

    The Global Kenya Used Car Market Industry is being transformed by the expansion of online car sales platforms. These digital marketplaces facilitate easier access to a wide range of used vehicles, allowing consumers to compare prices and features from the comfort of their homes. This shift towards online shopping is particularly appealing to tech-savvy younger generations who prefer digital solutions. The convenience of online transactions, coupled with the ability to conduct thorough research, is likely to drive increased sales in the used car sector. As more platforms emerge, competition will intensify, potentially leading to better deals for consumers and further stimulating market growth.

    Regulatory Support for Used Car Imports

    The Global Kenya Used Car Market Industry is positively influenced by regulatory support for used car imports. The Kenyan government has implemented policies that facilitate the importation of used vehicles, making it easier for consumers to access a variety of options. These regulations aim to promote affordable transportation while ensuring that imported vehicles meet safety and environmental standards. As a result, the influx of quality used cars from international markets is expected to bolster the local market. This supportive regulatory environment not only enhances consumer choice but also contributes to the overall growth of the used car market in Kenya.

    Growing Demand for Affordable Transportation

    The Global Kenya Used Car Market Industry is experiencing a notable surge in demand for affordable transportation options. As urbanization continues to rise, more individuals seek cost-effective means of mobility. The used car segment offers a viable solution, catering to budget-conscious consumers. In 2024, the market is projected to reach 1.65 USD Billion, reflecting the increasing preference for pre-owned vehicles. This trend is particularly evident among first-time buyers and young professionals who prioritize affordability without compromising on quality. The availability of diverse models and competitive pricing further enhances the appeal of used cars, driving growth in this sector.

    Technological Advancements in Vehicle Quality

    The Global Kenya Used Car Market Industry is witnessing improvements in vehicle quality due to technological advancements. Modern vehicles are designed to last longer and require less maintenance, which enhances their resale value. As a result, consumers are increasingly inclined to purchase used cars, knowing they can acquire reliable vehicles at lower prices. This trend is further supported by the availability of comprehensive vehicle history reports and inspection services, which provide buyers with confidence in their purchases. Consequently, the market is expected to grow at a CAGR of 3.99% from 2025 to 2035, as consumers recognize the benefits of investing in high-quality used vehicles.

    Market Segment Insights

    Kenya Used Car Market Car Body Type Insights

    In the Global Kenya Used Car Market, the Car Body Type segment plays a significant role in determining overall market dynamics, reflecting consumer preferences and driving market trends. As of 2023, the complete market valuation stands at 1.53 USD Billion, with notable contributions from various body types. The Hatchbacks segment has established a strong presence with a valuation of 0.45 USD Billion in 2023, expected to rise to 0.65 USD Billion by 2032, highlighting its popularity in urban settings for its compact size and efficiency.

    These vehicles are practical for everyday use, offering ease of maneuverability in city traffic, which contributes to their growth and majority holding in the market. Sedans, with a valuation of 0.38 USD Billion in 2023, are also essential, projected to grow to 0.52 USD Billion by 2032. 

    Their appeal lies in providing a balance between comfort and fuel efficiency, making them a preferred choice for families and business professionals alike, affirming their significant spot in Kenya's used car landscape. The SUV segment is anticipated to dominate with a current valuation of 0.5 USD Billion, growing to 0.8 USD Billion by 2032. This uptick is driven by consumer demand for larger vehicles that offer improved road presence, versatility, and features suited for both urban and rural driving conditions, showcasing their substantial importance in the market.

    MPVs currently hold a valuation of 0.2 USD Billion, stable for the foreseeable future, as they serve specific market needs for larger family transport but face competition from SUVs and Hatchbacks for popularity. 

    The Global Kenya Used Car Market segmentation illustrates the diverse preferences of consumers, with Hatchbacks and SUVs leading the way in popularity, driven by their adaptability and utility. The combination of rising economic factors, changing lifestyles, and increasing awareness of vehicle features promotes healthy growth opportunities across these body types, providing exciting prospects for stakeholders. Furthermore, market statistics indicate a trend towards compact cars and utility vehicles, driven by environmental concerns and fuel efficiency, thus shaping the future landscape of the market amid evolving challenges and preferences.

    Kenya Used Car Market Car Brand Insights

    Within this market, various car brands play a pivotal role in shaping its dynamics and consumer choices. Toyota remains a dominant player due to its reputation for reliability and strong resale value, capturing a large portion of the market. Nissan, known for its versatile range, offers consumers a blend of affordability and features, contributing significantly to market growth. Mitsubishi has carved out its niche with its focus on all-terrain vehicles, appealing to adventurous buyers. Meanwhile, Subaru is recognized for its all-wheel-drive technology that resonates well with consumers seeking safety and performance in diverse Kenyan terrains.

    Lastly, Honda garners attention for its fuel efficiency and innovative designs, making it a preferred choice among urban drivers. Overall, the insights into the Global Kenya Used Car Market segmentation reveal how these brands contribute uniquely to the evolving landscape, addressing various customer needs and preferences and driving the market forward.

    Kenya Used Car Market Car Age Insights

    The market segmentation by Car Age reveals interesting trends, with younger vehicles, particularly those aged 1-3 years, witnessing a rising demand due to their favorable balance of reliability and cost. The 4-6 years segment also sees significant interest, appealing to budget-conscious buyers looking for quality vehicles at reduced prices. Meanwhile, cars aged 7-9 years command a loyal customer base, often seen as value propositions with sufficient performance and history. Lastly, the 10 years and above category remains relevant as it attracts enthusiasts and buyers seeking classic vehicles.

    The diversity in age preferences highlights opportunities for dealers to cater effectively to different market segments and consumer needs. Overall, the Global Kenya Used Car Market statistics reflect not just the monetary value but also the evolving choices and preferences of Kenyan consumers navigating the used car landscape

    Kenya Used Car Market Fuel Type Insights

    The Fuel Type segment of the Global Kenya Used Car Market has been a crucial factor influencing consumer choices and overall market dynamics. Petrol vehicles have historically dominated this space, largely due to their affordability and widespread availability, catering to a broad audience. Diesel vehicles are also noteworthy, particularly for their efficiency and performance, making them popular among commercial users. The rise of Hybrid and Electric vehicles signifies a growing trend towards environmental consciousness, as these options present an opportunity for sustainable transportation solutions.

    Being relatively new entrants, the demand for Hybrid and Electric vehicles is increasing, driven by government incentives for green technologies and a shift in consumer preferences towards lower-emission options. Overall, the diverse Fuel Type landscape within the Global Kenya Used Car Market not only highlights how preferences are evolving but also sets the stage for future growth guided by technological advancements and shifting societal norms.

    Kenya Used Car Market Car Transmission Insights

    The Car Transmission segment within the Global Kenya Used Car Market is pivotal, reflecting not only consumer preferences but also technological advancements in the automotive sector. Among the different types, the automatic transmission format displays notable dominance due to its convenience in urban settings, allowing smooth driving in congested traffic conditions. The manual transmission retains a significant fan base owing to its control and fuel efficiency, appealing to a specific demographic of driving enthusiasts.

    Constantly evolving innovations also highlight the importance of Continuous Variable Transmission (CVT), providing seamless acceleration and improved fuel efficiency, which are highly valued in the modern market. 

    Overall, an understanding of the Global Kenya Used Car Market revenue, along with its segmentation and statistics, provides insights into the factors driving growth in this sector as user preferences shift toward more technologically advanced and fuel-efficient options. The market growth is influenced by various elements such as urbanization, economic development, and changing consumer behaviors, presenting considerable opportunities and challenges for stakeholders involved in the Global Kenya Used Car Market industry.

    Get more detailed insights about Kenya Used Car Market Research Report- Forecast till 2034

    Regional Insights

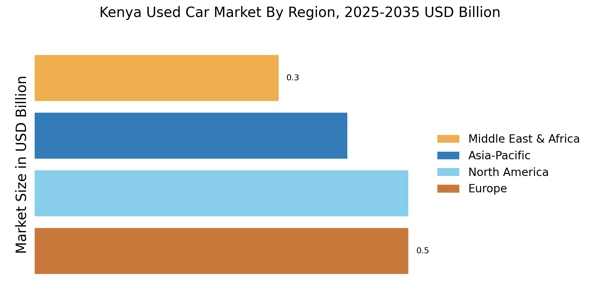
    North America holds a market value of 0.25 USD Billion, while Europe follows closely with a valuation of 0.3 USD Billion, highlighting their notable presence. The Asia Pacific region, commanding a significant share of 0.55 USD Billion, is vital for market growth due to its vast population and burgeoning middle-class driving car ownership. Meanwhile, the Middle East and Africa registered a valuation of 0.33 USD Billion, showcasing the growing demand for affordable vehicles amidst economic development. South America, although smaller in comparison with a value of 0.1 USD Billion, is evolving as a potential market.

    As the Global Kenya Used Car Market continues to develop, these regions underline the importance of the overall market dynamics, with particular emphasis on Asia Pacific as the major player contributing significantly to revenue growth. The varied regional landscape presents both challenges and opportunities, fostering competition among key players in the industry while driving innovations.

    Kenya Used Car Market Regional Insights

    Source: Primary Research, Secondary Research, Market Research Future Database and Analyst Review

    Key Players and Competitive Insights

    Kenya Used Car Market is highly competitive, with various players, both local and international, erring for a share of the market. Car General, Toyota Kenya and DT Dobie are the leading players in this market. These players have a vast presence in the market and have a wide range of used cars for their clients. The others include Nissan Kenya, Isuzu East Africa and Simba Corp, among others. The demand for used cars in Kenya is high, which means more players are bound to enter the market. 

    This is an indicator that the market is bound to be even more competitive in the future. Leading Kenya Used Car Market Players The leading car dealer in Kenya is Car General. The company has a large number of dealerships in the country. It deals in a wide variety of used cars of different makers. The company is recognized for its high quality cars that are insubstantial good shape at the time of purchase. The company has maintained a large share of the market and is considered a trusted brand by most clients. 

    Car General won the 2011 Dealer of the Year award from Isuzu EA and the Best in a Class award from the Global Quality Foundation. Major Competitor in Kenya's Used Car Market Toyota Kenya is a major competitor of Car General in Kenya's Used Car Market. The company is the official dealer of Toyota cars in the country. The company has a wide range of used Toyota vehicles. Toyota vehicles are known for the durability and reliability of their cars. The brand is one of the most recognized in the world.

    Toyota Kenya is set to become even more powerful after investing in its staff and facilities.

    Key Companies in the Kenya Used Car Market market include

    Industry Developments

    The Kenya Used Car Market is projected to reach USD 2.44 billion by 2034, exhibiting a CAGR of 3.96% during the forecast period (2025 -2034). The market growth is attributed to factors such as increasing urbanization, rising disposable income, and a growing preference for used cars over new vehicles due to affordability and availability. In terms of recent news developments, the Kenyan government has implemented a new policy that requires all used car imports to undergo a mandatory inspection to ensure compliance with safety and environmental standards. 

    This regulation is expected to positively impact the market by enhancing consumer confidence and promoting transparency. Additionally, the rise of digital platforms and online marketplaces has facilitated the buying and selling of used cars, providing greater convenience and access to a wider range of vehicles. Market players are also focusing on offering financing options and extended warranties to attract customers and drive sales.

    Future Outlook

    Kenya Used Car Market Future Outlook

    The Kenya Used Car Market is projected to grow at a 3.99% CAGR from 2024 to 2035, driven by increasing urbanization, rising disposable incomes, and enhanced digital platforms for vehicle sales.

    New opportunities lie in:

    • Develop online platforms for seamless vehicle transactions and financing options.
    • Expand after-sales services to enhance customer loyalty and retention.
    • Leverage data analytics for targeted marketing and inventory management strategies.

    By 2035, the Kenya Used Car Market is expected to exhibit robust growth, positioning itself as a competitive landscape.

    Market Segmentation

    Kenya Used Car Market Car Age Outlook

    • 1-3 Years
    • 4-6 Years
    • 7-9 Years
    • 10 Years and Above

    Kenya Used Car Market Regional Outlook

    • North America
    • Europe
    • South America
    • Asia Pacific
    • Middle East and Africa

    Kenya Used Car Market Car Brand Outlook

    • Toyota
    • Nissan
    • Mitsubishi
    • Subaru
    • Honda

    Kenya Used Car Market Fuel Type Outlook

    • Petrol
    • Diesel
    • Hybrid
    • Electric

    Kenya Used Car Market Car Body Type Outlook

    • Hatchbacks
    • Sedans
    • SUVs
    • MPVs

    Kenya Used Car Market Car Transmission Outlook

    • Manual
    • Automatic
    • CVT

    Report Scope

    Report Attribute/Metric Details
    Market Size 2024    1.65 (USD Billion)
    Market Size 2025    1.72 (USD Billion)
    Market Size 2034    2.44 (USD Billion)
    Compound Annual Growth Rate (CAGR)    3.96% (2025 - 2034)
    Report Coverage Revenue Forecast, Competitive Landscape, Growth Factors, and Trends
    Base Year 2024
    Market Forecast Period 2025 - 2034
    Historical Data 2019 - 2023
    Market Forecast Units USD Billion
    Key Companies Profiled Kia Kenya, Isuzu Kenya, Mercedes-Benz Kenya, BMW Kenya, Subaru Kenya, Ford Kenya, Toyota Kenya, Honda Kenya, Hyundai Kenya, Mazda Kenya, Nissan Kenya, Mitsubishi Kenya, Volkswagen Kenya
    Segments Covered Car Body Type, Car Brand, Car Age, Fuel Type, Car Transmission, Regional
    Key Market Opportunities 1.       Growing demand for affordable transportation 2.       Expanding used car financing options 3.       Increasing disposable income 4.       Surge in online used car marketplaces 5.       Rising preference for preowned luxury vehicles
    Key Market Dynamics 1.       Rising demand for affordable transportation 2.       Growing population and urbanization 3.       Government initiatives to support used car imports 4.       Increasing disposable income 5.       Expansion of online used car marketplaces
    Countries Covered North America, Europe, APAC, South America, MEA

    Market Highlights

    Author
    Sejal Akre
    Senior Research Analyst

    She has over 5 years of rich experience, in market research and consulting providing valuable market insights to client. Hands on expertise in management consulting, and extensive knowledge in domain including ICT, Automotive & Transportation and Aerospace & Defense. She is skilled in Go-to market strategy, industry analysis, market sizing, in depth company profiling, competitive intelligence & benchmarking and value chain amongst others.

    Leave a Comment

    FAQs

    What is the projected market size of the Global Kenya Used Car Market by 2034?

    The Global Kenya Used Car Market is expected to reach a valuation of 2.44 USD billion by 2034.

    What is the expected CAGR for the Global Kenya Used Car Market from 2025 to 2034?

    The market is anticipated to grow at a CAGR of 3.96% during the period from 2025 to 2034.

    Which car body type is anticipated to lead the market in 2034?

    SUVs are projected to have a significant market share and are expected to be valued at 0.8 USD billion in 2034.

    What are the key players operating in the Global Kenya Used Car Market?

    Key players include Kia Kenya, Isuzu Kenya, Mercedes-Benz Kenya, BMW Kenya, and Ford Kenya, among others.

    How does the market value for Hatchbacks change from 2023 to 2032?

    The market value for Hatchbacks is expected to increase from 0.45 USD billion in 2023 to 0.65 USD billion by 2032.

    What will be the market value for Sedans in 2032?

    The Sedans segment is projected to reach a market value of 0.52 USD billion by 2032.

    Which region is expected to show significant growth in the Global Kenya Used Car Market?

    The Asia Pacific region is projected to grow from 0.55 USD billion in 2023 to 0.8 USD billion in 2032.

    What is the estimated market value of the Middle East and Africa region for the Kenya Used Car Market in 2032?

    The Middle East and Africa region is expected to have a market value of 0.42 USD billion by 2032.

    What is the projected market value for MPVs from 2023 to 2032?

    The market value for MPVs is expected to remain stable at 0.2 USD billion from 2023 to 2032.

    What impacts are expected to affect the Global Kenya Used Car Market?

    The market may encounter challenges and opportunities arising from ongoing fluctuating economic conditions.

    1. EXECUTIVE SUMMARY
      1. Market Overview
      2. Key Findings
      3. Market Segmentation
      4. Competitive Landscape
      5. Challenges and Opportunities
      6. Future Outlook
    2. MARKET INTRODUCTION
      1. Definition
      2. Scope of the study
    3. Research Objective
      1. Assumption
        1. Limitations
    4. RESEARCH
    5. METHODOLOGY
      1. Overview
      2. Data Mining
      3. Secondary Research
      4. Primary Research
        1. Primary Interviews and Information Gathering
    6. Process
      1. Breakdown of Primary Respondents
      2. Forecasting Model
      3. Market Size Estimation
        1. Bottom-Up Approach
        2. Top-Down
    7. Approach
      1. Data Triangulation
      2. Validation
    8. MARKET
    9. DYNAMICS
      1. Overview
      2. Drivers
      3. Restraints
    10. Opportunities
    11. MARKET FACTOR ANALYSIS
      1. Value chain Analysis
      2. Porter's Five Forces Analysis
        1. Bargaining Power of Suppliers
        2. Bargaining Power of Buyers
        3. Threat of New Entrants
        4. Threat of Substitutes
        5. Intensity of Rivalry
      3. COVID-19
    12. Impact Analysis
      1. Market Impact Analysis
        1. Regional Impact
        2. Opportunity and Threat Analysis
    13. KENYA USED CAR MARKET,
    14. BY CAR BODY TYPE (USD BILLION)
      1. Hatchbacks
      2. Sedans
    15. SUVs
      1. MPVs
    16. KENYA USED CAR MARKET, BY CAR BRAND (USD BILLION)
      1. Toyota
      2. Nissan
      3. Mitsubishi
      4. Subaru
      5. Honda
    17. KENYA USED CAR MARKET, BY CAR AGE (USD BILLION)
    18. 3 Years
      1. 4-6 Years
      2. 7-9 Years
      3. 10 Years and Above
    19. KENYA USED CAR MARKET, BY FUEL TYPE (USD BILLION)
      1. Petrol
      2. Diesel
      3. Hybrid
      4. Electric
    20. KENYA USED CAR MARKET,
    21. BY CAR TRANSMISSION (USD BILLION)
      1. Manual
      2. Automatic
    22. CVT
    23. KENYA USED CAR MARKET, BY REGIONAL (USD BILLION)
      1. North
    24. America
      1. US
        1. Canada
      2. Europe
        1. Germany
        2. UK
        3. France
        4. Russia
        5. Italy
        6. Spain
        7. Rest of Europe
      3. APAC
        1. China
        2. India
        3. Japan
        4. South Korea
    25. Malaysia
      1. Thailand
        1. Indonesia
        2. Rest of APAC
      2. South America
        1. Brazil
        2. Mexico
    26. Argentina
      1. Rest of South America
      2. MEA
        1. GCC
    27. Countries
      1. South Africa
        1. Rest of MEA
    28. COMPETITIVE LANDSCAPE
      1. Overview
      2. Competitive Analysis
      3. Market share Analysis
      4. Major Growth Strategy in the Kenya
    29. Used Car Market
      1. Competitive Benchmarking
      2. Leading Players
    30. in Terms of Number of Developments in the Kenya Used Car Market
      1. Key
    31. developments and growth strategies
      1. New Product Launch/Service Deployment
        1. Merger & Acquisitions
        2. Joint Ventures
    32. Major Players Financial Matrix
      1. Sales and Operating Income
    33. Major Players R&D Expenditure. 2023
    34. COMPANY PROFILES
      1. Kia
    35. Kenya
      1. Financial Overview
        1. Products Offered
    36. Key Developments
      1. SWOT Analysis
        1. Key Strategies
    37. Isuzu Kenya
      1. Financial Overview
        1. Products Offered
        2. Key Developments
        3. SWOT Analysis
        4. Key Strategies
      2. MercedesBenz Kenya
        1. Financial Overview
        2. Products
    38. Offered
      1. Key Developments
        1. SWOT Analysis
    39. Key Strategies
      1. BMW Kenya
        1. Financial Overview
    40. Products Offered
      1. Key Developments
        1. SWOT Analysis
        2. Key Strategies
      2. Subaru Kenya
        1. Financial Overview
        2. Products Offered
        3. Key Developments
        4. SWOT
    41. Analysis
      1. Key Strategies
      2. Ford Kenya
        1. Financial
    42. Overview
      1. Products Offered
        1. Key Developments
    43. SWOT Analysis
      1. Key Strategies
      2. Toyota Kenya
    44. Financial Overview
      1. Products Offered
        1. Key Developments
        2. SWOT Analysis
        3. Key Strategies
      2. Honda Kenya
        1. Financial Overview
        2. Products Offered
        3. Key
    45. Developments
      1. SWOT Analysis
        1. Key Strategies
    46. Hyundai Kenya
      1. Financial Overview
        1. Products Offered
        2. Key Developments
        3. SWOT Analysis
        4. Key Strategies
      2. Mazda Kenya
        1. Financial Overview
        2. Products
    47. Offered
      1. Key Developments
        1. SWOT Analysis
    48. Key Strategies
      1. Nissan Kenya
        1. Financial Overview
    49. Products Offered
      1. Key Developments
        1. SWOT Analysis
        2. Key Strategies
      2. Mitsubishi Kenya
        1. Financial
    50. Overview
      1. Products Offered
        1. Key Developments
    51. SWOT Analysis
      1. Key Strategies
      2. Volkswagen Kenya
    52. Financial Overview
      1. Products Offered
        1. Key Developments
        2. SWOT Analysis
        3. Key Strategies
    53. APPENDIX
      1. References
      2. Related Reports
    54. LIST OF ASSUMPTIONS
    55. & FORECAST, BY CAR BODY TYPE, 2019-2032 (USD BILLIONS)
    56. AMERICA KENYA USED CAR MARKET SIZE ESTIMATES & FORECAST, BY CAR BRAND, 2019-2032
    57. (USD BILLIONS)
    58. & FORECAST, BY CAR AGE, 2019-2032 (USD BILLIONS)
    59. KENYA USED CAR MARKET SIZE ESTIMATES & FORECAST, BY FUEL TYPE, 2019-2032 (USD
    60. BILLIONS)
    61. FORECAST, BY CAR TRANSMISSION, 2019-2032 (USD BILLIONS)
    62. KENYA USED CAR MARKET SIZE ESTIMATES & FORECAST, BY REGIONAL, 2019-2032 (USD
    63. BILLIONS)
    64. BY CAR BODY TYPE, 2019-2032 (USD BILLIONS)
    65. SIZE ESTIMATES & FORECAST, BY CAR BRAND, 2019-2032 (USD BILLIONS)
    66. US KENYA USED CAR MARKET SIZE ESTIMATES & FORECAST, BY CAR AGE, 2019-2032
    67. (USD BILLIONS)
    68. BY FUEL TYPE, 2019-2032 (USD BILLIONS)
    69. SIZE ESTIMATES & FORECAST, BY CAR TRANSMISSION, 2019-2032 (USD BILLIONS)
    70. 2032 (USD BILLIONS)
    71. & FORECAST, BY CAR BODY TYPE, 2019-2032 (USD BILLIONS)
    72. KENYA USED CAR MARKET SIZE ESTIMATES & FORECAST, BY CAR BRAND, 2019-2032 (USD
    73. BILLIONS)
    74. BY CAR AGE, 2019-2032 (USD BILLIONS)
    75. SIZE ESTIMATES & FORECAST, BY FUEL TYPE, 2019-2032 (USD BILLIONS)
    76. CANADA KENYA USED CAR MARKET SIZE ESTIMATES & FORECAST, BY CAR TRANSMISSION,
    77. 2032 (USD BILLIONS)
    78. & FORECAST, BY REGIONAL, 2019-2032 (USD BILLIONS)
    79. USED CAR MARKET SIZE ESTIMATES & FORECAST, BY CAR BODY TYPE, 2019-2032 (USD
    80. BILLIONS)
    81. BY CAR BRAND, 2019-2032 (USD BILLIONS)
    82. SIZE ESTIMATES & FORECAST, BY CAR AGE, 2019-2032 (USD BILLIONS)
    83. EUROPE KENYA USED CAR MARKET SIZE ESTIMATES & FORECAST, BY FUEL TYPE, 2019-2032
    84. (USD BILLIONS)
    85. FORECAST, BY CAR TRANSMISSION, 2019-2032 (USD BILLIONS)
    86. USED CAR MARKET SIZE ESTIMATES & FORECAST, BY REGIONAL, 2019-2032 (USD BILLIONS)
    87. CAR BODY TYPE, 2019-2032 (USD BILLIONS)
    88. SIZE ESTIMATES & FORECAST, BY CAR BRAND, 2019-2032 (USD BILLIONS)
    89. GERMANY KENYA USED CAR MARKET SIZE ESTIMATES & FORECAST, BY CAR AGE, 2019-2032
    90. (USD BILLIONS)
    91. FORECAST, BY FUEL TYPE, 2019-2032 (USD BILLIONS)
    92. CAR MARKET SIZE ESTIMATES & FORECAST, BY CAR TRANSMISSION, 2019-2032 (USD BILLIONS)
    93. REGIONAL, 2019-2032 (USD BILLIONS)
    94. ESTIMATES & FORECAST, BY CAR BODY TYPE, 2019-2032 (USD BILLIONS)
    95. UK KENYA USED CAR MARKET SIZE ESTIMATES & FORECAST, BY CAR BRAND, 2019-2032
    96. (USD BILLIONS)
    97. BY CAR AGE, 2019-2032 (USD BILLIONS)
    98. ESTIMATES & FORECAST, BY FUEL TYPE, 2019-2032 (USD BILLIONS)
    99. UK KENYA USED CAR MARKET SIZE ESTIMATES & FORECAST, BY CAR TRANSMISSION, 2019-2032
    100. (USD BILLIONS)
    101. BY REGIONAL, 2019-2032 (USD BILLIONS)
    102. SIZE ESTIMATES & FORECAST, BY CAR BODY TYPE, 2019-2032 (USD BILLIONS)
    103. FRANCE KENYA USED CAR MARKET SIZE ESTIMATES & FORECAST, BY CAR BRAND, 2019-2032
    104. (USD BILLIONS)
    105. FORECAST, BY CAR AGE, 2019-2032 (USD BILLIONS)
    106. CAR MARKET SIZE ESTIMATES & FORECAST, BY FUEL TYPE, 2019-2032 (USD BILLIONS)
    107. TRANSMISSION, 2019-2032 (USD BILLIONS)
    108. SIZE ESTIMATES & FORECAST, BY REGIONAL, 2019-2032 (USD BILLIONS)
    109. RUSSIA KENYA USED CAR MARKET SIZE ESTIMATES & FORECAST, BY CAR BODY TYPE,
    110. 2032 (USD BILLIONS)
    111. & FORECAST, BY CAR BRAND, 2019-2032 (USD BILLIONS)
    112. USED CAR MARKET SIZE ESTIMATES & FORECAST, BY CAR AGE, 2019-2032 (USD BILLIONS)
    113. TYPE, 2019-2032 (USD BILLIONS)
    114. ESTIMATES & FORECAST, BY CAR TRANSMISSION, 2019-2032 (USD BILLIONS)
    115. RUSSIA KENYA USED CAR MARKET SIZE ESTIMATES & FORECAST, BY REGIONAL, 2019-2032
    116. (USD BILLIONS)
    117. FORECAST, BY CAR BODY TYPE, 2019-2032 (USD BILLIONS)
    118. USED CAR MARKET SIZE ESTIMATES & FORECAST, BY CAR BRAND, 2019-2032 (USD BILLIONS)
    119. AGE, 2019-2032 (USD BILLIONS)
    120. & FORECAST, BY FUEL TYPE, 2019-2032 (USD BILLIONS)
    121. USED CAR MARKET SIZE ESTIMATES & FORECAST, BY CAR TRANSMISSION, 2019-2032 (USD
    122. BILLIONS)
    123. BY REGIONAL, 2019-2032 (USD BILLIONS)
    124. SIZE ESTIMATES & FORECAST, BY CAR BODY TYPE, 2019-2032 (USD BILLIONS)
    125. SPAIN KENYA USED CAR MARKET SIZE ESTIMATES & FORECAST, BY CAR BRAND, 2019-2032
    126. (USD BILLIONS)
    127. FORECAST, BY CAR AGE, 2019-2032 (USD BILLIONS)
    128. CAR MARKET SIZE ESTIMATES & FORECAST, BY FUEL TYPE, 2019-2032 (USD BILLIONS)
    129. TRANSMISSION, 2019-2032 (USD BILLIONS)
    130. SIZE ESTIMATES & FORECAST, BY REGIONAL, 2019-2032 (USD BILLIONS)
    131. REST OF EUROPE KENYA USED CAR MARKET SIZE ESTIMATES & FORECAST, BY CAR BODY
    132. TYPE, 2019-2032 (USD BILLIONS)
    133. SIZE ESTIMATES & FORECAST, BY CAR BRAND, 2019-2032 (USD BILLIONS)
    134. REST OF EUROPE KENYA USED CAR MARKET SIZE ESTIMATES & FORECAST, BY CAR AGE,
    135. 2032 (USD BILLIONS)
    136. ESTIMATES & FORECAST, BY FUEL TYPE, 2019-2032 (USD BILLIONS)
    137. REST OF EUROPE KENYA USED CAR MARKET SIZE ESTIMATES & FORECAST, BY CAR TRANSMISSION,
    138. 2032 (USD BILLIONS)
    139. ESTIMATES & FORECAST, BY REGIONAL, 2019-2032 (USD BILLIONS)
    140. APAC KENYA USED CAR MARKET SIZE ESTIMATES & FORECAST, BY CAR BODY TYPE, 2019-2032
    141. (USD BILLIONS)
    142. BY CAR BRAND, 2019-2032 (USD BILLIONS)
    143. SIZE ESTIMATES & FORECAST, BY CAR AGE, 2019-2032 (USD BILLIONS)
    144. APAC KENYA USED CAR MARKET SIZE ESTIMATES & FORECAST, BY FUEL TYPE, 2019-2032
    145. (USD BILLIONS)
    146. BY CAR TRANSMISSION, 2019-2032 (USD BILLIONS)
    147. MARKET SIZE ESTIMATES & FORECAST, BY REGIONAL, 2019-2032 (USD BILLIONS)
    148. TYPE, 2019-2032 (USD BILLIONS)
    149. ESTIMATES & FORECAST, BY CAR BRAND, 2019-2032 (USD BILLIONS)
    150. CHINA KENYA USED CAR MARKET SIZE ESTIMATES & FORECAST, BY CAR AGE, 2019-2032
    151. (USD BILLIONS)
    152. FORECAST, BY FUEL TYPE, 2019-2032 (USD BILLIONS)
    153. CAR MARKET SIZE ESTIMATES & FORECAST, BY CAR TRANSMISSION, 2019-2032 (USD BILLIONS)
    154. 2032 (USD BILLIONS)
    155. & FORECAST, BY CAR BODY TYPE, 2019-2032 (USD BILLIONS)
    156. KENYA USED CAR MARKET SIZE ESTIMATES & FORECAST, BY CAR BRAND, 2019-2032 (USD
    157. BILLIONS)
    158. BY CAR AGE, 2019-2032 (USD BILLIONS)
    159. SIZE ESTIMATES & FORECAST, BY FUEL TYPE, 2019-2032 (USD BILLIONS)
    160. INDIA KENYA USED CAR MARKET SIZE ESTIMATES & FORECAST, BY CAR TRANSMISSION,
    161. 2032 (USD BILLIONS)
    162. & FORECAST, BY REGIONAL, 2019-2032 (USD BILLIONS)
    163. USED CAR MARKET SIZE ESTIMATES & FORECAST, BY CAR BODY TYPE, 2019-2032 (USD
    164. BILLIONS)
    165. BY CAR BRAND, 2019-2032 (USD BILLIONS)
    166. SIZE ESTIMATES & FORECAST, BY CAR AGE, 2019-2032 (USD BILLIONS)
    167. JAPAN KENYA USED CAR MARKET SIZE ESTIMATES & FORECAST, BY FUEL TYPE, 2019-2032
    168. (USD BILLIONS)
    169. FORECAST, BY CAR TRANSMISSION, 2019-2032 (USD BILLIONS)
    170. USED CAR MARKET SIZE ESTIMATES & FORECAST, BY REGIONAL, 2019-2032 (USD BILLIONS)
    171. BY CAR BODY TYPE, 2019-2032 (USD BILLIONS)
    172. CAR MARKET SIZE ESTIMATES & FORECAST, BY CAR BRAND, 2019-2032 (USD BILLIONS)
    173. BY CAR AGE, 2019-2032 (USD BILLIONS)
    174. MARKET SIZE ESTIMATES & FORECAST, BY FUEL TYPE, 2019-2032 (USD BILLIONS)
    175. CAR TRANSMISSION, 2019-2032 (USD BILLIONS)
    176. CAR MARKET SIZE ESTIMATES & FORECAST, BY REGIONAL, 2019-2032 (USD BILLIONS)
    177. CAR BODY TYPE, 2019-2032 (USD BILLIONS)
    178. MARKET SIZE ESTIMATES & FORECAST, BY CAR BRAND, 2019-2032 (USD BILLIONS)
    179. AGE, 2019-2032 (USD BILLIONS)
    180. ESTIMATES & FORECAST, BY FUEL TYPE, 2019-2032 (USD BILLIONS)
    181. MALAYSIA KENYA USED CAR MARKET SIZE ESTIMATES & FORECAST, BY CAR TRANSMISSION,
    182. 2032 (USD BILLIONS)
    183. & FORECAST, BY REGIONAL, 2019-2032 (USD BILLIONS)
    184. KENYA USED CAR MARKET SIZE ESTIMATES & FORECAST, BY CAR BODY TYPE, 2019-2032
    185. (USD BILLIONS)
    186. FORECAST, BY CAR BRAND, 2019-2032 (USD BILLIONS)
    187. USED CAR MARKET SIZE ESTIMATES & FORECAST, BY CAR AGE, 2019-2032 (USD BILLIONS)
    188. FUEL TYPE, 2019-2032 (USD BILLIONS)
    189. SIZE ESTIMATES & FORECAST, BY CAR TRANSMISSION, 2019-2032 (USD BILLIONS)
    190. 2032 (USD BILLIONS)
    191. & FORECAST, BY CAR BODY TYPE, 2019-2032 (USD BILLIONS)
    192. KENYA USED CAR MARKET SIZE ESTIMATES & FORECAST, BY CAR BRAND, 2019-2032 (USD
    193. BILLIONS)
    194. FORECAST, BY CAR AGE, 2019-2032 (USD BILLIONS)
    195. USED CAR MARKET SIZE ESTIMATES & FORECAST, BY FUEL TYPE, 2019-2032 (USD BILLIONS)
    196. BY CAR TRANSMISSION, 2019-2032 (USD BILLIONS)
    197. CAR MARKET SIZE ESTIMATES & FORECAST, BY REGIONAL, 2019-2032 (USD BILLIONS)
    198. BY CAR BODY TYPE, 2019-2032 (USD BILLIONS)
    199. CAR MARKET SIZE ESTIMATES & FORECAST, BY CAR BRAND, 2019-2032 (USD BILLIONS)
    200. BY CAR AGE, 2019-2032 (USD BILLIONS)
    201. MARKET SIZE ESTIMATES & FORECAST, BY FUEL TYPE, 2019-2032 (USD BILLIONS)
    202. CAR TRANSMISSION, 2019-2032 (USD BILLIONS)
    203. CAR MARKET SIZE ESTIMATES & FORECAST, BY REGIONAL, 2019-2032 (USD BILLIONS)
    204. BY CAR BODY TYPE, 2019-2032 (USD BILLIONS)
    205. USED CAR MARKET SIZE ESTIMATES & FORECAST, BY CAR BRAND, 2019-2032 (USD BILLIONS)
    206. BY CAR AGE, 2019-2032 (USD BILLIONS)
    207. MARKET SIZE ESTIMATES & FORECAST, BY FUEL TYPE, 2019-2032 (USD BILLIONS)
    208. BY CAR TRANSMISSION, 2019-2032 (USD BILLIONS)
    209. USED CAR MARKET SIZE ESTIMATES & FORECAST, BY REGIONAL, 2019-2032 (USD BILLIONS)
    210. CAR BODY TYPE, 2019-2032 (USD BILLIONS)
    211. SIZE ESTIMATES & FORECAST, BY CAR BRAND, 2019-2032 (USD BILLIONS)
    212. BRAZIL KENYA USED CAR MARKET SIZE ESTIMATES & FORECAST, BY CAR AGE, 2019-2032
    213. (USD BILLIONS)
    214. FORECAST, BY FUEL TYPE, 2019-2032 (USD BILLIONS)
    215. CAR MARKET SIZE ESTIMATES & FORECAST, BY CAR TRANSMISSION, 2019-2032 (USD BILLIONS)
    216. REGIONAL, 2019-2032 (USD BILLIONS)
    217. SIZE ESTIMATES & FORECAST, BY CAR BODY TYPE, 2019-2032 (USD BILLIONS)
    218. MEXICO KENYA USED CAR MARKET SIZE ESTIMATES & FORECAST, BY CAR BRAND, 2019-2032
    219. (USD BILLIONS)
    220. FORECAST, BY CAR AGE, 2019-2032 (USD BILLIONS)
    221. CAR MARKET SIZE ESTIMATES & FORECAST, BY FUEL TYPE, 2019-2032 (USD BILLIONS)
    222. CAR TRANSMISSION, 2019-2032 (USD BILLIONS)
    223. MARKET SIZE ESTIMATES & FORECAST, BY REGIONAL, 2019-2032 (USD BILLIONS)
    224. BODY TYPE, 2019-2032 (USD BILLIONS)
    225. SIZE ESTIMATES & FORECAST, BY CAR BRAND, 2019-2032 (USD BILLIONS)
    226. ARGENTINA KENYA USED CAR MARKET SIZE ESTIMATES & FORECAST, BY CAR AGE,
    227. 2032 (USD BILLIONS)
    228. & FORECAST, BY FUEL TYPE, 2019-2032 (USD BILLIONS)
    229. KENYA USED CAR MARKET SIZE ESTIMATES & FORECAST, BY CAR TRANSMISSION, 2019-2032
    230. (USD BILLIONS)
    231. FORECAST, BY REGIONAL, 2019-2032 (USD BILLIONS)
    232. KENYA USED CAR MARKET SIZE ESTIMATES & FORECAST, BY CAR BODY TYPE, 2019-2032
    233. (USD BILLIONS)
    234. ESTIMATES & FORECAST, BY CAR BRAND, 2019-2032 (USD BILLIONS)
    235. REST OF SOUTH AMERICA KENYA USED CAR MARKET SIZE ESTIMATES & FORECAST, BY CAR
    236. AGE, 2019-2032 (USD BILLIONS)
    237. CAR MARKET SIZE ESTIMATES & FORECAST, BY FUEL TYPE, 2019-2032 (USD BILLIONS)
    238. FORECAST, BY CAR TRANSMISSION, 2019-2032 (USD BILLIONS)
    239. SOUTH AMERICA KENYA USED CAR MARKET SIZE ESTIMATES & FORECAST, BY REGIONAL,
    240. 2032 (USD BILLIONS)
    241. & FORECAST, BY CAR BODY TYPE, 2019-2032 (USD BILLIONS)
    242. KENYA USED CAR MARKET SIZE ESTIMATES & FORECAST, BY CAR BRAND, 2019-2032 (USD
    243. BILLIONS)
    244. BY CAR AGE, 2019-2032 (USD BILLIONS)
    245. SIZE ESTIMATES & FORECAST, BY FUEL TYPE, 2019-2032 (USD BILLIONS)
    246. MEA KENYA USED CAR MARKET SIZE ESTIMATES & FORECAST, BY CAR TRANSMISSION,
    247. 2032 (USD BILLIONS)
    248. & FORECAST, BY REGIONAL, 2019-2032 (USD BILLIONS)
    249. KENYA USED CAR MARKET SIZE ESTIMATES & FORECAST, BY CAR BODY TYPE, 2019-2032
    250. (USD BILLIONS)
    251. & FORECAST, BY CAR BRAND, 2019-2032 (USD BILLIONS)
    252. KENYA USED CAR MARKET SIZE ESTIMATES & FORECAST, BY CAR AGE, 2019-2032 (USD
    253. BILLIONS)
    254. FORECAST, BY FUEL TYPE, 2019-2032 (USD BILLIONS)
    255. KENYA USED CAR MARKET SIZE ESTIMATES & FORECAST, BY CAR TRANSMISSION, 2019-2032
    256. (USD BILLIONS)
    257. & FORECAST, BY REGIONAL, 2019-2032 (USD BILLIONS)
    258. KENYA USED CAR MARKET SIZE ESTIMATES & FORECAST, BY CAR BODY TYPE, 2019-2032
    259. (USD BILLIONS)
    260. & FORECAST, BY CAR BRAND, 2019-2032 (USD BILLIONS)
    261. KENYA USED CAR MARKET SIZE ESTIMATES & FORECAST, BY CAR AGE, 2019-2032 (USD
    262. BILLIONS)
    263. FORECAST, BY FUEL TYPE, 2019-2032 (USD BILLIONS)
    264. USED CAR MARKET SIZE ESTIMATES & FORECAST, BY CAR TRANSMISSION, 2019-2032 (USD
    265. BILLIONS)
    266. FORECAST, BY REGIONAL, 2019-2032 (USD BILLIONS)
    267. USED CAR MARKET SIZE ESTIMATES & FORECAST, BY CAR BODY TYPE, 2019-2032 (USD
    268. BILLIONS)
    269. FORECAST, BY CAR BRAND, 2019-2032 (USD BILLIONS)
    270. USED CAR MARKET SIZE ESTIMATES & FORECAST, BY CAR AGE, 2019-2032 (USD BILLIONS)
    271. BY FUEL TYPE, 2019-2032 (USD BILLIONS)
    272. MARKET SIZE ESTIMATES & FORECAST, BY CAR TRANSMISSION, 2019-2032 (USD BILLIONS)
    273. BY REGIONAL, 2019-2032 (USD BILLIONS)
    274. MARKET SYNOPSIS
    275. US KENYA USED CAR MARKET ANALYSIS BY CAR BRAND
    276. CAR MARKET ANALYSIS BY CAR AGE
    277. BY FUEL TYPE
    278. KENYA USED CAR MARKET ANALYSIS BY CAR BODY TYPE
    279. CAR MARKET ANALYSIS BY CAR BRAND
    280. BY CAR AGE
    281. CANADA KENYA USED CAR MARKET ANALYSIS BY REGIONAL
    282. USED CAR MARKET ANALYSIS
    283. BY CAR BODY TYPE
    284. BRAND
    285. GERMANY KENYA USED CAR MARKET ANALYSIS BY FUEL TYPE
    286. KENYA USED CAR MARKET ANALYSIS BY CAR TRANSMISSION
    287. USED CAR MARKET ANALYSIS BY REGIONAL
    288. BY CAR BODY TYPE
    289. KENYA USED CAR MARKET ANALYSIS BY FUEL TYPE
    290. ANALYSIS BY CAR TRANSMISSION
    291. BY REGIONAL
    292. FRANCE KENYA USED CAR MARKET ANALYSIS BY CAR AGE
    293. USED CAR MARKET ANALYSIS BY FUEL TYPE
    294. ANALYSIS BY CAR TRANSMISSION
    295. BY REGIONAL
    296. RUSSIA KENYA USED CAR MARKET ANALYSIS BY CAR AGE
    297. USED CAR MARKET ANALYSIS BY FUEL TYPE
    298. ANALYSIS BY CAR TRANSMISSION
    299. BY REGIONAL
    300. ITALY KENYA USED CAR MARKET ANALYSIS BY CAR AGE
    301. USED CAR MARKET ANALYSIS BY FUEL TYPE
    302. ANALYSIS BY CAR TRANSMISSION
    303. BY REGIONAL
    304. SPAIN KENYA USED CAR MARKET ANALYSIS BY CAR AGE
    305. USED CAR MARKET ANALYSIS BY FUEL TYPE
    306. ANALYSIS BY CAR TRANSMISSION
    307. BY REGIONAL
    308. BODY TYPE
    309. BRAND
    310. APAC KENYA USED CAR MARKET ANALYSIS
    311. ANALYSIS BY CAR BODY TYPE
    312. BY CAR BRAND
    313. CHINA KENYA USED CAR MARKET ANALYSIS BY CAR TRANSMISSION
    314. KENYA USED CAR MARKET ANALYSIS BY REGIONAL
    315. MARKET ANALYSIS BY CAR BODY TYPE
    316. BY CAR BRAND
    317. INDIA KENYA USED CAR MARKET ANALYSIS BY CAR TRANSMISSION
    318. KENYA USED CAR MARKET ANALYSIS BY REGIONAL
    319. MARKET ANALYSIS BY CAR BODY TYPE
    320. BY CAR BRAND
    321. JAPAN KENYA USED CAR MARKET ANALYSIS BY CAR TRANSMISSION
    322. KENYA USED CAR MARKET ANALYSIS BY REGIONAL
    323. CAR MARKET ANALYSIS BY CAR BODY TYPE
    324. MARKET ANALYSIS BY CAR BRAND
    325. ANALYSIS BY CAR AGE
    326. BY FUEL TYPE
    327. TRANSMISSION
    328. MALAYSIA KENYA USED CAR MARKET ANALYSIS BY CAR BRAND
    329. KENYA USED CAR MARKET ANALYSIS BY CAR AGE
    330. MARKET ANALYSIS BY FUEL TYPE
    331. BY CAR TRANSMISSION
    332. REGIONAL
    333. THAILAND KENYA USED CAR MARKET ANALYSIS BY CAR AGE
    334. KENYA USED CAR MARKET ANALYSIS BY FUEL TYPE
    335. CAR MARKET ANALYSIS BY CAR TRANSMISSION
    336. MARKET ANALYSIS BY REGIONAL
    337. BY CAR BODY TYPE
    338. BRAND
    339. INDONESIA KENYA USED CAR MARKET ANALYSIS BY FUEL TYPE
    340. KENYA USED CAR MARKET ANALYSIS BY CAR TRANSMISSION
    341. USED CAR MARKET ANALYSIS BY REGIONAL
    342. MARKET ANALYSIS BY CAR BODY TYPE
    343. ANALYSIS BY CAR BRAND
    344. BY CAR AGE
    345. TYPE
    346. SOUTH AMERICA KENYA USED CAR MARKET ANALYSIS
    347. USED CAR MARKET ANALYSIS BY CAR BODY TYPE
    348. MARKET ANALYSIS BY CAR BRAND
    349. BY CAR AGE
    350. MEXICO KENYA USED CAR MARKET ANALYSIS BY CAR BODY TYPE
    351. KENYA USED CAR MARKET ANALYSIS BY CAR BRAND
    352. CAR MARKET ANALYSIS BY CAR AGE
    353. BY FUEL TYPE
    354. ARGENTINA KENYA USED CAR MARKET ANALYSIS BY CAR BODY TYPE
    355. ARGENTINA KENYA USED CAR MARKET ANALYSIS BY CAR BRAND
    356. KENYA USED CAR MARKET ANALYSIS BY CAR AGE
    357. CAR MARKET ANALYSIS BY FUEL TYPE
    358. ANALYSIS BY CAR TRANSMISSION
    359. BY REGIONAL
    360. BY CAR BODY TYPE
    361. BY CAR BRAND
    362. BY CAR AGE
    363. BY FUEL TYPE
    364. BY CAR TRANSMISSION
    365. ANALYSIS BY REGIONAL
    366. GCC COUNTRIES KENYA USED CAR MARKET ANALYSIS BY CAR BODY TYPE
    367. GCC COUNTRIES KENYA USED CAR MARKET ANALYSIS BY CAR BRAND
    368. GCC COUNTRIES KENYA USED CAR MARKET ANALYSIS BY CAR AGE
    369. KENYA USED CAR MARKET ANALYSIS BY FUEL TYPE
    370. USED CAR MARKET ANALYSIS BY CAR TRANSMISSION
    371. USED CAR MARKET ANALYSIS BY REGIONAL
    372. MARKET ANALYSIS BY CAR BODY TYPE
    373. ANALYSIS BY CAR BRAND
    374. BY CAR AGE
    375. TYPE
    376. REST OF MEA KENYA USED CAR MARKET ANALYSIS BY CAR BODY TYPE
    377. REST OF MEA KENYA USED CAR MARKET ANALYSIS BY CAR BRAND
    378. MEA KENYA USED CAR MARKET ANALYSIS BY CAR AGE
    379. USED CAR MARKET ANALYSIS BY FUEL TYPE
    380. MARKET ANALYSIS BY CAR TRANSMISSION
    381. MARKET ANALYSIS BY REGIONAL
    382. CAR MARKET
    383. OF KENYA USED CAR MARKET
    384. MARKET
    385. SUPPLY / VALUE CHAIN: KENYA USED CAR MARKET
    386. MARKET, BY CAR BODY TYPE, 2024 (% SHARE)
    387. BY CAR BODY TYPE, 2019 TO 2032 (USD Billions)
    388. BY CAR BRAND, 2024 (% SHARE)
    389. TO 2032 (USD Billions)
    390. (% SHARE)
    391. (USD Billions)
    392. KENYA USED CAR MARKET, BY REGIONAL, 2019 TO 2032 (USD Billions)
    393. BENCHMARKING OF MAJOR COMPETITORS

    TABLE OF CONTENTS

    1. EXECUTIVE SUMMARY 1.

    1. Market Overview 

    1.2. Key Findings 

    1.3. Market Segmentation 1.4. Competitive Landscape 1.5. Challenges and Opportunities 1.6. Future Outlook 2. MARKET INTRODUCTION 2.1. Definition 2.2. Scope of the study 2.2.1. Research Objective 2.2.2. Assumption 2.2.3. Limitations 3. RESEARCH METHODOLOGY 3.1. Overview 3.2. Data Mining 3.3. Secondary Research 3.4. Primary Research 3.4.1. Primary Interviews and Information Gathering Process 3.4.2. Breakdown of Primary Respondents 3.5. Forecasting Model 3.6. Market Size Estimation 3.6.1. Bottom-Up Approach 3.6.2. Top-Down Approach 3.7. Data Triangulation 3.8. Validation 4. MARKET DYNAMICS 4.1. Overview 4.2. Drivers 4.3. Restraints 4.4. Opportunities 5. MARKET FACTOR ANALYSIS 5.1. Value chain Analysis 5.2. Porter's Five Forces Analysis 5.2.1. Bargaining Power of Suppliers 5.2.2. Bargaining Power of Buyers 5.2.3. Threat of New Entrants 5.2.4. Threat of Substitutes 5.2.5. Intensity of Rivalry 5.3. COVID-19 Impact Analysis 5.3.1. Market Impact Analysis 5.3.2. Regional Impact 5.3.3. Opportunity and Threat Analysis 6. KENYA USED CAR MARKET, BY CAR BODY TYPE (USD BILLION) 6.1. Hatchbacks 6.2. Sedans 6.3. SUVs 6.4. MPVs 7. KENYA USED CAR MARKET, BY CAR BRAND (USD BILLION) 7.1. Toyota 7.2. Nissan 7.3. Mitsubishi 7.4. Subaru 7.5. Honda 8. KENYA USED CAR MARKET, BY CAR AGE (USD BILLION) 8.1. 1-3 Years 8.2. 4-6 Years 8.3. 7-9 Years 8.4. 10 Years and Above 9. KENYA USED CAR MARKET, BY FUEL TYPE (USD BILLION) 9.1. Petrol 9.2. Diesel 9.3. Hybrid 9.4. Electric 10. KENYA USED CAR MARKET, BY CAR TRANSMISSION (USD BILLION) 10.1. Manual 10.2. Automatic 10.3. CVT 11. KENYA USED CAR MARKET, BY REGIONAL (USD BILLION) 11.1. North America 11.1.1. US 11.1.2. Canada 11.2. Europe 11.2.1. Germany 11.2.2. UK 11.2.3. France 11.2.4. Russia 11.2.5. Italy 11.2.6. Spain 11.2.7. Rest of Europe 11.3. APAC 11.3.1. China 11.3.2. India 11.3.3. Japan 11.3.4. South Korea 11.3.5. Malaysia 11.3.6. Thailand 11.3.7. Indonesia 11.3.8. Rest of APAC 11.4. South America 11.4.1. Brazil 11.4.2. Mexico 11.4.3. Argentina 11.4.4. Rest of South America 11.5. MEA 11.5.1. GCC Countries 11.5.2. South Africa 11.5.3. Rest of MEA 12. COMPETITIVE LANDSCAPE 12.1. Overview 12.2. Competitive Analysis 12.3. Market share Analysis 12.4. Major Growth Strategy in the Kenya Used Car Market 12.5. Competitive Benchmarking 12.6. Leading Players in Terms of Number of Developments in the Kenya Used Car Market 12.7. Key developments and growth strategies 12.7.1. New Product Launch/Service Deployment 12.7.2. Merger & Acquisitions 12.7.3. Joint Ventures 12.8. Major Players Financial Matrix 12.8.1. Sales and Operating Income 12.8.2. Major Players R&D Expenditure. 2023 13. COMPANY PROFILES 13.1. Kia Kenya 13.1.1. Financial Overview 13.1.2. Products Offered 13.1.3. Key Developments 13.1.4. SWOT Analysis 13.1.5. Key Strategies 13.2. Isuzu Kenya 13.2.1. Financial Overview 13.2.2. Products Offered 13.2.3. Key Developments 13.2.4. SWOT Analysis 13.2.5. Key Strategies 13.3. MercedesBenz Kenya 13.3.1. Financial Overview 13.3.2. Products Offered 13.3.3. Key Developments 13.3.4. SWOT Analysis 13.3.5. Key Strategies 13.4. BMW Kenya 13.4.1. Financial Overview 13.4.2. Products Offered 13.4.3. Key Developments 13.4.4. SWOT Analysis 13.4.5. Key Strategies 13.5. Subaru Kenya 13.5.1. Financial Overview 13.5.2. Products Offered 13.5.3. Key Developments 13.5.4. SWOT Analysis 13.5.5. Key Strategies 13.6. Ford Kenya 13.6.1. Financial Overview 13.6.2. Products Offered 13.6.3. Key Developments 13.6.4. SWOT Analysis 13.6.5. Key Strategies 13.7. Toyota Kenya 13.7.1. Financial Overview 13.7.2. Products Offered 13.7.3. Key Developments 13.7.4. SWOT Analysis 13.7.5. Key Strategies 13.8. Honda Kenya 13.8.1. Financial Overview 13.8.2. Products Offered 13.8.3. Key Developments 13.8.4. SWOT Analysis 13.8.5. Key Strategies 13.9. Hyundai Kenya 13.9.1. Financial Overview 13.9.2. Products Offered 13.9.3. Key Developments 13.9.4. SWOT Analysis 13.9.5. Key Strategies 13.10. Mazda Kenya 13.10.1. Financial Overview 13.10.2. Products Offered 13.10.3. Key Developments 13.10.4. SWOT Analysis 13.10.5. Key Strategies 13.11. Nissan Kenya 13.11.1. Financial Overview 13.11.2. Products Offered 13.11.3. Key Developments 13.11.4. SWOT Analysis 13.11.5. Key Strategies 13.12. Mitsubishi Kenya 13.12.1. Financial Overview 13.12.2. Products Offered 13.12.3. Key Developments 13.12.4. SWOT Analysis 13.12.5. Key Strategies 13.13. Volkswagen Kenya 13.13.1. Financial Overview 13.13.2. Products Offered 13.13.3. Key Developments 13.13.4. SWOT Analysis 13.13.5. Key Strategies 14. APPENDIX 14.1. References 14.2. Related Reports LIST OF TABLESTABLE 1. LIST OF ASSUMPTIONS TABLE 2. NORTH AMERICA KENYA USED CAR MARKET SIZE ESTIMATES & FORECAST, BY CAR BODY TYPE, 2019-2032 (USD BILLIONS) TABLE 3. NORTH AMERICA KENYA USED CAR MARKET SIZE ESTIMATES & FORECAST, BY CAR BRAND, 2019-2032 (USD BILLIONS) TABLE 4. NORTH AMERICA KENYA USED CAR MARKET SIZE ESTIMATES & FORECAST, BY CAR AGE, 2019-2032 (USD BILLIONS) TABLE 5. NORTH AMERICA KENYA USED CAR MARKET SIZE ESTIMATES & FORECAST, BY FUEL TYPE, 2019-2032 (USD BILLIONS) TABLE 6. NORTH AMERICA KENYA USED CAR MARKET SIZE ESTIMATES & FORECAST, BY CAR TRANSMISSION, 2019-2032 (USD BILLIONS) TABLE 7. NORTH AMERICA KENYA USED CAR MARKET SIZE ESTIMATES & FORECAST, BY REGIONAL, 2019-2032 (USD BILLIONS) TABLE 8. US KENYA USED CAR MARKET SIZE ESTIMATES & FORECAST, BY CAR BODY TYPE, 2019-2032 (USD BILLIONS) TABLE 9. US KENYA USED CAR MARKET SIZE ESTIMATES & FORECAST, BY CAR BRAND, 2019-2032 (USD BILLIONS) TABLE 10. US KENYA USED CAR MARKET SIZE ESTIMATES & FORECAST, BY CAR AGE, 2019-2032 (USD BILLIONS) TABLE 11. US KENYA USED CAR MARKET SIZE ESTIMATES & FORECAST, BY FUEL TYPE, 2019-2032 (USD BILLIONS) TABLE 12. US KENYA USED CAR MARKET SIZE ESTIMATES & FORECAST, BY CAR TRANSMISSION, 2019-2032 (USD BILLIONS) TABLE 13. US KENYA USED CAR MARKET SIZE ESTIMATES & FORECAST, BY REGIONAL, 2019-2032 (USD BILLIONS) TABLE 14. CANADA KENYA USED CAR MARKET SIZE ESTIMATES & FORECAST, BY CAR BODY TYPE, 2019-2032 (USD BILLIONS) TABLE 15. CANADA KENYA USED CAR MARKET SIZE ESTIMATES & FORECAST, BY CAR BRAND, 2019-2032 (USD BILLIONS) TABLE 16. CANADA KENYA USED CAR MARKET SIZE ESTIMATES & FORECAST, BY CAR AGE, 2019-2032 (USD BILLIONS) TABLE 17. CANADA KENYA USED CAR MARKET SIZE ESTIMATES & FORECAST, BY FUEL TYPE, 2019-2032 (USD BILLIONS) TABLE 18. CANADA KENYA USED CAR MARKET SIZE ESTIMATES & FORECAST, BY CAR TRANSMISSION, 2019-2032 (USD BILLIONS) TABLE 19. CANADA KENYA USED CAR MARKET SIZE ESTIMATES & FORECAST, BY REGIONAL, 2019-2032 (USD BILLIONS) TABLE 20. EUROPE KENYA USED CAR MARKET SIZE ESTIMATES & FORECAST, BY CAR BODY TYPE, 2019-2032 (USD BILLIONS) TABLE 21. EUROPE KENYA USED CAR MARKET SIZE ESTIMATES & FORECAST, BY CAR BRAND, 2019-2032 (USD BILLIONS) TABLE 22. EUROPE KENYA USED CAR MARKET SIZE ESTIMATES & FORECAST, BY CAR AGE, 2019-2032 (USD BILLIONS) TABLE 23. EUROPE KENYA USED CAR MARKET SIZE ESTIMATES & FORECAST, BY FUEL TYPE, 2019-2032 (USD BILLIONS) TABLE 24. EUROPE KENYA USED CAR MARKET SIZE ESTIMATES & FORECAST, BY CAR TRANSMISSION, 2019-2032 (USD BILLIONS) TABLE 25. EUROPE KENYA USED CAR MARKET SIZE ESTIMATES & FORECAST, BY REGIONAL, 2019-2032 (USD BILLIONS) TABLE 26. GERMANY KENYA USED CAR MARKET SIZE ESTIMATES & FORECAST, BY CAR BODY TYPE, 2019-2032 (USD BILLIONS) TABLE 27. GERMANY KENYA USED CAR MARKET SIZE ESTIMATES & FORECAST, BY CAR BRAND, 2019-2032 (USD BILLIONS) TABLE 28. GERMANY KENYA USED CAR MARKET SIZE ESTIMATES & FORECAST, BY CAR AGE, 2019-2032 (USD BILLIONS) TABLE 29. GERMANY KENYA USED CAR MARKET SIZE ESTIMATES & FORECAST, BY FUEL TYPE, 2019-2032 (USD BILLIONS) TABLE 30. GERMANY KENYA USED CAR MARKET SIZE ESTIMATES & FORECAST, BY CAR TRANSMISSION, 2019-2032 (USD BILLIONS) TABLE 31. GERMANY KENYA USED CAR MARKET SIZE ESTIMATES & FORECAST, BY REGIONAL, 2019-2032 (USD BILLIONS) TABLE 32. UK KENYA USED CAR MARKET SIZE ESTIMATES & FORECAST, BY CAR BODY TYPE, 2019-2032 (USD BILLIONS) TABLE 33. UK KENYA USED CAR MARKET SIZE ESTIMATES & FORECAST, BY CAR BRAND, 2019-2032 (USD BILLIONS) TABLE 34. UK KENYA USED CAR MARKET SIZE ESTIMATES & FORECAST, BY CAR AGE, 2019-2032 (USD BILLIONS) TABLE 35. UK KENYA USED CAR MARKET SIZE ESTIMATES & FORECAST, BY FUEL TYPE, 2019-2032 (USD BILLIONS) TABLE 36. UK KENYA USED CAR MARKET SIZE ESTIMATES & FORECAST, BY CAR TRANSMISSION, 2019-2032 (USD BILLIONS) TABLE 37. UK KENYA USED CAR MARKET SIZE ESTIMATES & FORECAST, BY REGIONAL, 2019-2032 (USD BILLIONS) TABLE 38. FRANCE KENYA USED CAR MARKET SIZE ESTIMATES & FORECAST, BY CAR BODY TYPE, 2019-2032 (USD BILLIONS) TABLE 39. FRANCE KENYA USED CAR MARKET SIZE ESTIMATES & FORECAST, BY CAR BRAND, 2019-2032 (USD BILLIONS) TABLE 40. FRANCE KENYA USED CAR MARKET SIZE ESTIMATES & FORECAST, BY CAR AGE, 2019-2032 (USD BILLIONS) TABLE 41. FRANCE KENYA USED CAR MARKET SIZE ESTIMATES & FORECAST, BY FUEL TYPE, 2019-2032 (USD BILLIONS) TABLE 42. FRANCE KENYA USED CAR MARKET SIZE ESTIMATES & FORECAST, BY CAR TRANSMISSION, 2019-2032 (USD BILLIONS) TABLE 43. FRANCE KENYA USED CAR MARKET SIZE ESTIMATES & FORECAST, BY REGIONAL, 2019-2032 (USD BILLIONS) TABLE 44. RUSSIA KENYA USED CAR MARKET SIZE ESTIMATES & FORECAST, BY CAR BODY TYPE, 2019-2032 (USD BILLIONS) TABLE 45. RUSSIA KENYA USED CAR MARKET SIZE ESTIMATES & FORECAST, BY CAR BRAND, 2019-2032 (USD BILLIONS) TABLE 46. RUSSIA KENYA USED CAR MARKET SIZE ESTIMATES & FORECAST, BY CAR AGE, 2019-2032 (USD BILLIONS) TABLE 47. RUSSIA KENYA USED CAR MARKET SIZE ESTIMATES & FORECAST, BY FUEL TYPE, 2019-2032 (USD BILLIONS) TABLE 48. RUSSIA KENYA USED CAR MARKET SIZE ESTIMATES & FORECAST, BY CAR TRANSMISSION, 2019-2032 (USD BILLIONS) TABLE 49. RUSSIA KENYA USED CAR MARKET SIZE ESTIMATES & FORECAST, BY REGIONAL, 2019-2032 (USD BILLIONS) TABLE 50. ITALY KENYA USED CAR MARKET SIZE ESTIMATES & FORECAST, BY CAR BODY TYPE, 2019-2032 (USD BILLIONS) TABLE 51. ITALY KENYA USED CAR MARKET SIZE ESTIMATES & FORECAST, BY CAR BRAND, 2019-2032 (USD BILLIONS) TABLE 52. ITALY KENYA USED CAR MARKET SIZE ESTIMATES & FORECAST, BY CAR AGE, 2019-2032 (USD BILLIONS) TABLE 53. ITALY KENYA USED CAR MARKET SIZE ESTIMATES & FORECAST, BY FUEL TYPE, 2019-2032 (USD BILLIONS) TABLE 54. ITALY KENYA USED CAR MARKET SIZE ESTIMATES & FORECAST, BY CAR TRANSMISSION, 2019-2032 (USD BILLIONS) TABLE 55. ITALY KENYA USED CAR MARKET SIZE ESTIMATES & FORECAST, BY REGIONAL, 2019-2032 (USD BILLIONS) TABLE 56. SPAIN KENYA USED CAR MARKET SIZE ESTIMATES & FORECAST, BY CAR BODY TYPE, 2019-2032 (USD BILLIONS) TABLE 57. SPAIN KENYA USED CAR MARKET SIZE ESTIMATES & FORECAST, BY CAR BRAND, 2019-2032 (USD BILLIONS) TABLE 58. SPAIN KENYA USED CAR MARKET SIZE ESTIMATES & FORECAST, BY CAR AGE, 2019-2032 (USD BILLIONS) TABLE 59. SPAIN KENYA USED CAR MARKET SIZE ESTIMATES & FORECAST, BY FUEL TYPE, 2019-2032 (USD BILLIONS) TABLE 60. SPAIN KENYA USED CAR MARKET SIZE ESTIMATES & FORECAST, BY CAR TRANSMISSION, 2019-2032 (USD BILLIONS) TABLE 61. SPAIN KENYA USED CAR MARKET SIZE ESTIMATES & FORECAST, BY REGIONAL, 2019-2032 (USD BILLIONS) TABLE 62. REST OF EUROPE KENYA USED CAR MARKET SIZE ESTIMATES & FORECAST, BY CAR BODY TYPE, 2019-2032 (USD BILLIONS) TABLE 63. REST OF EUROPE KENYA USED CAR MARKET SIZE ESTIMATES & FORECAST, BY CAR BRAND, 2019-2032 (USD BILLIONS) TABLE 64. REST OF EUROPE KENYA USED CAR MARKET SIZE ESTIMATES & FORECAST, BY CAR AGE, 2019-2032 (USD BILLIONS) TABLE 65. REST OF EUROPE KENYA USED CAR MARKET SIZE ESTIMATES & FORECAST, BY FUEL TYPE, 2019-2032 (USD BILLIONS) TABLE 66. REST OF EUROPE KENYA USED CAR MARKET SIZE ESTIMATES & FORECAST, BY CAR TRANSMISSION, 2019-2032 (USD BILLIONS) TABLE 67. REST OF EUROPE KENYA USED CAR MARKET SIZE ESTIMATES & FORECAST, BY REGIONAL, 2019-2032 (USD BILLIONS) TABLE 68. APAC KENYA USED CAR MARKET SIZE ESTIMATES & FORECAST, BY CAR BODY TYPE, 2019-2032 (USD BILLIONS) TABLE 69. APAC KENYA USED CAR MARKET SIZE ESTIMATES & FORECAST, BY CAR BRAND, 2019-2032 (USD BILLIONS) TABLE 70. APAC KENYA USED CAR MARKET SIZE ESTIMATES & FORECAST, BY CAR AGE, 2019-2032 (USD BILLIONS) TABLE 71. APAC KENYA USED CAR MARKET SIZE ESTIMATES & FORECAST, BY FUEL TYPE, 2019-2032 (USD BILLIONS) TABLE 72. APAC KENYA USED CAR MARKET SIZE ESTIMATES & FORECAST, BY CAR TRANSMISSION, 2019-2032 (USD BILLIONS) TABLE 73. APAC KENYA USED CAR MARKET SIZE ESTIMATES & FORECAST, BY REGIONAL, 2019-2032 (USD BILLIONS) TABLE 74. CHINA KENYA USED CAR MARKET SIZE ESTIMATES & FORECAST, BY CAR BODY TYPE, 2019-2032 (USD BILLIONS) TABLE 75. CHINA KENYA USED CAR MARKET SIZE ESTIMATES & FORECAST, BY CAR BRAND, 2019-2032 (USD BILLIONS) TABLE 76. CHINA KENYA USED CAR MARKET SIZE ESTIMATES & FORECAST, BY CAR AGE, 2019-2032 (USD BILLIONS) TABLE 77. CHINA KENYA USED CAR MARKET SIZE ESTIMATES & FORECAST, BY FUEL TYPE, 2019-2032 (USD BILLIONS) TABLE 78. CHINA KENYA USED CAR MARKET SIZE ESTIMATES & FORECAST, BY CAR TRANSMISSION, 2019-2032 (USD BILLIONS) TABLE 79. CHINA KENYA USED CAR MARKET SIZE ESTIMATES & FORECAST, BY REGIONAL, 2019-2032 (USD BILLIONS) TABLE 80. INDIA KENYA USED CAR MARKET SIZE ESTIMATES & FORECAST, BY CAR BODY TYPE, 2019-2032 (USD BILLIONS) TABLE 81. INDIA KENYA USED CAR MARKET SIZE ESTIMATES & FORECAST, BY CAR BRAND, 2019-2032 (USD BILLIONS) TABLE 82. INDIA KENYA USED CAR MARKET SIZE ESTIMATES & FORECAST, BY CAR AGE, 2019-2032 (USD BILLIONS) TABLE 83. INDIA KENYA USED CAR MARKET SIZE ESTIMATES & FORECAST, BY FUEL TYPE, 2019-2032 (USD BILLIONS) TABLE 84. INDIA KENYA USED CAR MARKET SIZE ESTIMATES & FORECAST, BY CAR TRANSMISSION, 2019-2032 (USD BILLIONS) TABLE 85. INDIA KENYA USED CAR MARKET SIZE ESTIMATES & FORECAST, BY REGIONAL, 2019-2032 (USD BILLIONS) TABLE 86. JAPAN KENYA USED CAR MARKET SIZE ESTIMATES & FORECAST, BY CAR BODY TYPE, 2019-2032 (USD BILLIONS) TABLE 87. JAPAN KENYA USED CAR MARKET SIZE ESTIMATES & FORECAST, BY CAR BRAND, 2019-2032 (USD BILLIONS) TABLE 88. JAPAN KENYA USED CAR MARKET SIZE ESTIMATES & FORECAST, BY CAR AGE, 2019-2032 (USD BILLIONS) TABLE 89. JAPAN KENYA USED CAR MARKET SIZE ESTIMATES & FORECAST, BY FUEL TYPE, 2019-2032 (USD BILLIONS) TABLE 90. JAPAN KENYA USED CAR MARKET SIZE ESTIMATES & FORECAST, BY CAR TRANSMISSION, 2019-2032 (USD BILLIONS) TABLE 91. JAPAN KENYA USED CAR MARKET SIZE ESTIMATES & FORECAST, BY REGIONAL, 2019-2032 (USD BILLIONS) TABLE 92. SOUTH KOREA KENYA USED CAR MARKET SIZE ESTIMATES & FORECAST, BY CAR BODY TYPE, 2019-2032 (USD BILLIONS) TABLE 93. SOUTH KOREA KENYA USED CAR MARKET SIZE ESTIMATES & FORECAST, BY CAR BRAND, 2019-2032 (USD BILLIONS) TABLE 94. SOUTH KOREA KENYA USED CAR MARKET SIZE ESTIMATES & FORECAST, BY CAR AGE, 2019-2032 (USD BILLIONS) TABLE 95. SOUTH KOREA KENYA USED CAR MARKET SIZE ESTIMATES & FORECAST, BY FUEL TYPE, 2019-2032 (USD BILLIONS) TABLE 96. SOUTH KOREA KENYA USED CAR MARKET SIZE ESTIMATES & FORECAST, BY CAR TRANSMISSION, 2019-2032 (USD BILLIONS) TABLE 97. SOUTH KOREA KENYA USED CAR MARKET SIZE ESTIMATES & FORECAST, BY REGIONAL, 2019-2032 (USD BILLIONS) TABLE 98. MALAYSIA KENYA USED CAR MARKET SIZE ESTIMATES & FORECAST, BY CAR BODY TYPE, 2019-2032 (USD BILLIONS) TABLE 99. MALAYSIA KENYA USED CAR MARKET SIZE ESTIMATES & FORECAST, BY CAR BRAND, 2019-2032 (USD BILLIONS) TABLE 100. MALAYSIA KENYA USED CAR MARKET SIZE ESTIMATES & FORECAST, BY CAR AGE, 2019-2032 (USD BILLIONS) TABLE 101. MALAYSIA KENYA USED CAR MARKET SIZE ESTIMATES & FORECAST, BY FUEL TYPE, 2019-2032 (USD BILLIONS) TABLE 102. MALAYSIA KENYA USED CAR MARKET SIZE ESTIMATES & FORECAST, BY CAR TRANSMISSION, 2019-2032 (USD BILLIONS) TABLE 103. MALAYSIA KENYA USED CAR MARKET SIZE ESTIMATES & FORECAST, BY REGIONAL, 2019-2032 (USD BILLIONS) TABLE 104. THAILAND KENYA USED CAR MARKET SIZE ESTIMATES & FORECAST, BY CAR BODY TYPE, 2019-2032 (USD BILLIONS) TABLE 105. THAILAND KENYA USED CAR MARKET SIZE ESTIMATES & FORECAST, BY CAR BRAND, 2019-2032 (USD BILLIONS) TABLE 106. THAILAND KENYA USED CAR MARKET SIZE ESTIMATES & FORECAST, BY CAR AGE, 2019-2032 (USD BILLIONS) TABLE 107. THAILAND KENYA USED CAR MARKET SIZE ESTIMATES & FORECAST, BY FUEL TYPE, 2019-2032 (USD BILLIONS) TABLE 108. THAILAND KENYA USED CAR MARKET SIZE ESTIMATES & FORECAST, BY CAR TRANSMISSION, 2019-2032 (USD BILLIONS) TABLE 109. THAILAND KENYA USED CAR MARKET SIZE ESTIMATES & FORECAST, BY REGIONAL, 2019-2032 (USD BILLIONS) TABLE 110. INDONESIA KENYA USED CAR MARKET SIZE ESTIMATES & FORECAST, BY CAR BODY TYPE, 2019-2032 (USD BILLIONS) TABLE 111. INDONESIA KENYA USED CAR MARKET SIZE ESTIMATES & FORECAST, BY CAR BRAND, 2019-2032 (USD BILLIONS) TABLE 112. INDONESIA KENYA USED CAR MARKET SIZE ESTIMATES & FORECAST, BY CAR AGE, 2019-2032 (USD BILLIONS) TABLE 113. INDONESIA KENYA USED CAR MARKET SIZE ESTIMATES & FORECAST, BY FUEL TYPE, 2019-2032 (USD BILLIONS) TABLE 114. INDONESIA KENYA USED CAR MARKET SIZE ESTIMATES & FORECAST, BY CAR TRANSMISSION, 2019-2032 (USD BILLIONS) TABLE 115. INDONESIA KENYA USED CAR MARKET SIZE ESTIMATES & FORECAST, BY REGIONAL, 2019-2032 (USD BILLIONS) TABLE 116. REST OF APAC KENYA USED CAR MARKET SIZE ESTIMATES & FORECAST, BY CAR BODY TYPE, 2019-2032 (USD BILLIONS) TABLE 117. REST OF APAC KENYA USED CAR MARKET SIZE ESTIMATES & FORECAST, BY CAR BRAND, 2019-2032 (USD BILLIONS) TABLE 118. REST OF APAC KENYA USED CAR MARKET SIZE ESTIMATES & FORECAST, BY CAR AGE, 2019-2032 (USD BILLIONS) TABLE 119. REST OF APAC KENYA USED CAR MARKET SIZE ESTIMATES & FORECAST, BY FUEL TYPE, 2019-2032 (USD BILLIONS) TABLE 120. REST OF APAC KENYA USED CAR MARKET SIZE ESTIMATES & FORECAST, BY CAR TRANSMISSION, 2019-2032 (USD BILLIONS) TABLE 121. REST OF APAC KENYA USED CAR MARKET SIZE ESTIMATES & FORECAST, BY REGIONAL, 2019-2032 (USD BILLIONS) TABLE 122. SOUTH AMERICA KENYA USED CAR MARKET SIZE ESTIMATES & FORECAST, BY CAR BODY TYPE, 2019-2032 (USD BILLIONS) TABLE 123. SOUTH AMERICA KENYA USED CAR MARKET SIZE ESTIMATES & FORECAST, BY CAR BRAND, 2019-2032 (USD BILLIONS) TABLE 124. SOUTH AMERICA KENYA USED CAR MARKET SIZE ESTIMATES & FORECAST, BY CAR AGE, 2019-2032 (USD BILLIONS) TABLE 125. SOUTH AMERICA KENYA USED CAR MARKET SIZE ESTIMATES & FORECAST, BY FUEL TYPE, 2019-2032 (USD BILLIONS) TABLE 126. SOUTH AMERICA KENYA USED CAR MARKET SIZE ESTIMATES & FORECAST, BY CAR TRANSMISSION, 2019-2032 (USD BILLIONS) TABLE 127. SOUTH AMERICA KENYA USED CAR MARKET SIZE ESTIMATES & FORECAST, BY REGIONAL, 2019-2032 (USD BILLIONS) TABLE 128. BRAZIL KENYA USED CAR MARKET SIZE ESTIMATES & FORECAST, BY CAR BODY TYPE, 2019-2032 (USD BILLIONS) TABLE 129. BRAZIL KENYA USED CAR MARKET SIZE ESTIMATES & FORECAST, BY CAR BRAND, 2019-2032 (USD BILLIONS) TABLE 130. BRAZIL KENYA USED CAR MARKET SIZE ESTIMATES & FORECAST, BY CAR AGE, 2019-2032 (USD BILLIONS) TABLE 131. BRAZIL KENYA USED CAR MARKET SIZE ESTIMATES & FORECAST, BY FUEL TYPE, 2019-2032 (USD BILLIONS) TABLE 132. BRAZIL KENYA USED CAR MARKET SIZE ESTIMATES & FORECAST, BY CAR TRANSMISSION, 2019-2032 (USD BILLIONS) TABLE 133. BRAZIL KENYA USED CAR MARKET SIZE ESTIMATES & FORECAST, BY REGIONAL, 2019-2032 (USD BILLIONS) TABLE 134. MEXICO KENYA USED CAR MARKET SIZE ESTIMATES & FORECAST, BY CAR BODY TYPE, 2019-2032 (USD BILLIONS) TABLE 135. MEXICO KENYA USED CAR MARKET SIZE ESTIMATES & FORECAST, BY CAR BRAND, 2019-2032 (USD BILLIONS) TABLE 136. MEXICO KENYA USED CAR MARKET SIZE ESTIMATES & FORECAST, BY CAR AGE, 2019-2032 (USD BILLIONS) TABLE 137. MEXICO KENYA USED CAR MARKET SIZE ESTIMATES & FORECAST, BY FUEL TYPE, 2019-2032 (USD BILLIONS) TABLE 138. MEXICO KENYA USED CAR MARKET SIZE ESTIMATES & FORECAST, BY CAR TRANSMISSION, 2019-2032 (USD BILLIONS) TABLE 139. MEXICO KENYA USED CAR MARKET SIZE ESTIMATES & FORECAST, BY REGIONAL, 2019-2032 (USD BILLIONS) TABLE 140. ARGENTINA KENYA USED CAR MARKET SIZE ESTIMATES & FORECAST, BY CAR BODY TYPE, 2019-2032 (USD BILLIONS) TABLE 141. ARGENTINA KENYA USED CAR MARKET SIZE ESTIMATES & FORECAST, BY CAR BRAND, 2019-2032 (USD BILLIONS) TABLE 142. ARGENTINA KENYA USED CAR MARKET SIZE ESTIMATES & FORECAST, BY CAR AGE, 2019-2032 (USD BILLIONS) TABLE 143. ARGENTINA KENYA USED CAR MARKET SIZE ESTIMATES & FORECAST, BY FUEL TYPE, 2019-2032 (USD BILLIONS) TABLE 144. ARGENTINA KENYA USED CAR MARKET SIZE ESTIMATES & FORECAST, BY CAR TRANSMISSION, 2019-2032 (USD BILLIONS) TABLE 145. ARGENTINA KENYA USED CAR MARKET SIZE ESTIMATES & FORECAST, BY REGIONAL, 2019-2032 (USD BILLIONS) TABLE 146. REST OF SOUTH AMERICA KENYA USED CAR MARKET SIZE ESTIMATES & FORECAST, BY CAR BODY TYPE, 2019-2032 (USD BILLIONS) TABLE 147. REST OF SOUTH AMERICA KENYA USED CAR MARKET SIZE ESTIMATES & FORECAST, BY CAR BRAND, 2019-2032 (USD BILLIONS) TABLE 148. REST OF SOUTH AMERICA KENYA USED CAR MARKET SIZE ESTIMATES & FORECAST, BY CAR AGE, 2019-2032 (USD BILLIONS) TABLE 149. REST OF SOUTH AMERICA KENYA USED CAR MARKET SIZE ESTIMATES & FORECAST, BY FUEL TYPE, 2019-2032 (USD BILLIONS) TABLE 150. REST OF SOUTH AMERICA KENYA USED CAR MARKET SIZE ESTIMATES & FORECAST, BY CAR TRANSMISSION, 2019-2032 (USD BILLIONS) TABLE 151. REST OF SOUTH AMERICA KENYA USED CAR MARKET SIZE ESTIMATES & FORECAST, BY REGIONAL, 2019-2032 (USD BILLIONS) TABLE 152. MEA KENYA USED CAR MARKET SIZE ESTIMATES & FORECAST, BY CAR BODY TYPE, 2019-2032 (USD BILLIONS) TABLE 153. MEA KENYA USED CAR MARKET SIZE ESTIMATES & FORECAST, BY CAR BRAND, 2019-2032 (USD BILLIONS) TABLE 154. MEA KENYA USED CAR MARKET SIZE ESTIMATES & FORECAST, BY CAR AGE, 2019-2032 (USD BILLIONS) TABLE 155. MEA KENYA USED CAR MARKET SIZE ESTIMATES & FORECAST, BY FUEL TYPE, 2019-2032 (USD BILLIONS) TABLE 156. MEA KENYA USED CAR MARKET SIZE ESTIMATES & FORECAST, BY CAR TRANSMISSION, 2019-2032 (USD BILLIONS) TABLE 157. MEA KENYA USED CAR MARKET SIZE ESTIMATES & FORECAST, BY REGIONAL, 2019-2032 (USD BILLIONS) TABLE 158. GCC COUNTRIES KENYA USED CAR MARKET SIZE ESTIMATES & FORECAST, BY CAR BODY TYPE, 2019-2032 (USD BILLIONS) TABLE 159. GCC COUNTRIES KENYA USED CAR MARKET SIZE ESTIMATES & FORECAST, BY CAR BRAND, 2019-2032 (USD BILLIONS) TABLE 160. GCC COUNTRIES KENYA USED CAR MARKET SIZE ESTIMATES & FORECAST, BY CAR AGE, 2019-2032 (USD BILLIONS) TABLE 161. GCC COUNTRIES KENYA USED CAR MARKET SIZE ESTIMATES & FORECAST, BY FUEL TYPE, 2019-2032 (USD BILLIONS) TABLE 162. GCC COUNTRIES KENYA USED CAR MARKET SIZE ESTIMATES & FORECAST, BY CAR TRANSMISSION, 2019-2032 (USD BILLIONS) TABLE 163. GCC COUNTRIES KENYA USED CAR MARKET SIZE ESTIMATES & FORECAST, BY REGIONAL, 2019-2032 (USD BILLIONS) TABLE 164. SOUTH AFRICA KENYA USED CAR MARKET SIZE ESTIMATES & FORECAST, BY CAR BODY TYPE, 2019-2032 (USD BILLIONS) TABLE 165. SOUTH AFRICA KENYA USED CAR MARKET SIZE ESTIMATES & FORECAST, BY CAR BRAND, 2019-2032 (USD BILLIONS) TABLE 166. SOUTH AFRICA KENYA USED CAR MARKET SIZE ESTIMATES & FORECAST, BY CAR AGE, 2019-2032 (USD BILLIONS) TABLE 167. SOUTH AFRICA KENYA USED CAR MARKET SIZE ESTIMATES & FORECAST, BY FUEL TYPE, 2019-2032 (USD BILLIONS) TABLE 168. SOUTH AFRICA KENYA USED CAR MARKET SIZE ESTIMATES & FORECAST, BY CAR TRANSMISSION, 2019-2032 (USD BILLIONS) TABLE 169. SOUTH AFRICA KENYA USED CAR MARKET SIZE ESTIMATES & FORECAST, BY REGIONAL, 2019-2032 (USD BILLIONS) TABLE 170. REST OF MEA KENYA USED CAR MARKET SIZE ESTIMATES & FORECAST, BY CAR BODY TYPE, 2019-2032 (USD BILLIONS) TABLE 171. REST OF MEA KENYA USED CAR MARKET SIZE ESTIMATES & FORECAST, BY CAR BRAND, 2019-2032 (USD BILLIONS) TABLE 172. REST OF MEA KENYA USED CAR MARKET SIZE ESTIMATES & FORECAST, BY CAR AGE, 2019-2032 (USD BILLIONS) TABLE 173. REST OF MEA KENYA USED CAR MARKET SIZE ESTIMATES & FORECAST, BY FUEL TYPE, 2019-2032 (USD BILLIONS) TABLE 174. REST OF MEA KENYA USED CAR MARKET SIZE ESTIMATES & FORECAST, BY CAR TRANSMISSION, 2019-2032 (USD BILLIONS) TABLE 175. REST OF MEA KENYA USED CAR MARKET SIZE ESTIMATES & FORECAST, BY REGIONAL, 2019-2032 (USD BILLIONS) TABLE 176. PRODUCT LAUNCH/PRODUCT DEVELOPMENT/APPROVAL TABLE 177. ACQUISITION/PARTNERSHIP LIST OF FIGURESFIGURE 1. MARKET SYNOPSIS FIGURE 2. NORTH AMERICA KENYA USED CAR MARKET ANALYSIS FIGURE 3. US KENYA USED CAR MARKET ANALYSIS BY CAR BODY TYPE FIGURE 4. US KENYA USED CAR MARKET ANALYSIS BY CAR BRAND FIGURE 5. US KENYA USED CAR MARKET ANALYSIS BY CAR AGE FIGURE 6. US KENYA USED CAR MARKET ANALYSIS BY FUEL TYPE FIGURE 7. US KENYA USED CAR MARKET ANALYSIS BY CAR TRANSMISSION FIGURE 8. US KENYA USED CAR MARKET ANALYSIS BY REGIONAL FIGURE 9. CANADA KENYA USED CAR MARKET ANALYSIS BY CAR BODY TYPE FIGURE 10. CANADA KENYA USED CAR MARKET ANALYSIS BY CAR BRAND FIGURE 11. CANADA KENYA USED CAR MARKET ANALYSIS BY CAR AGE FIGURE 12. CANADA KENYA USED CAR MARKET ANALYSIS BY FUEL TYPE FIGURE 13. CANADA KENYA USED CAR MARKET ANALYSIS BY CAR TRANSMISSION FIGURE 14. CANADA KENYA USED CAR MARKET ANALYSIS BY REGIONAL FIGURE 15. EUROPE KENYA USED CAR MARKET ANALYSIS FIGURE 16. GERMANY KENYA USED CAR MARKET ANALYSIS BY CAR BODY TYPE FIGURE 17. GERMANY KENYA USED CAR MARKET ANALYSIS BY CAR BRAND FIGURE 18. GERMANY KENYA USED CAR MARKET ANALYSIS BY CAR AGE FIGURE 19. GERMANY KENYA USED CAR MARKET ANALYSIS BY FUEL TYPE FIGURE 20. GERMANY KENYA USED CAR MARKET ANALYSIS BY CAR TRANSMISSION FIGURE 21. GERMANY KENYA USED CAR MARKET ANALYSIS BY REGIONAL FIGURE 22. UK KENYA USED CAR MARKET ANALYSIS BY CAR BODY TYPE FIGURE 23. UK KENYA USED CAR MARKET ANALYSIS BY CAR BRAND FIGURE 24. UK KENYA USED CAR MARKET ANALYSIS BY CAR AGE FIGURE 25. UK KENYA USED CAR MARKET ANALYSIS BY FUEL TYPE FIGURE 26. UK KENYA USED CAR MARKET ANALYSIS BY CAR TRANSMISSION FIGURE 27. UK KENYA USED CAR MARKET ANALYSIS BY REGIONAL FIGURE 28. FRANCE KENYA USED CAR MARKET ANALYSIS BY CAR BODY TYPE FIGURE 29. FRANCE KENYA USED CAR MARKET ANALYSIS BY CAR BRAND FIGURE 30. FRANCE KENYA USED CAR MARKET ANALYSIS BY CAR AGE FIGURE 31. FRANCE KENYA USED CAR MARKET ANALYSIS BY FUEL TYPE FIGURE 32. FRANCE KENYA USED CAR MARKET ANALYSIS BY CAR TRANSMISSION FIGURE 33. FRANCE KENYA USED CAR MARKET ANALYSIS BY REGIONAL FIGURE 34. RUSSIA KENYA USED CAR MARKET ANALYSIS BY CAR BODY TYPE FIGURE 35. RUSSIA KENYA USED CAR MARKET ANALYSIS BY CAR BRAND FIGURE 36. RUSSIA KENYA USED CAR MARKET ANALYSIS BY CAR AGE FIGURE 37. RUSSIA KENYA USED CAR MARKET ANALYSIS BY FUEL TYPE FIGURE 38. RUSSIA KENYA USED CAR MARKET ANALYSIS BY CAR TRANSMISSION FIGURE 39. RUSSIA KENYA USED CAR MARKET ANALYSIS BY REGIONAL FIGURE 40. ITALY KENYA USED CAR MARKET ANALYSIS BY CAR BODY TYPE FIGURE 41. ITALY KENYA USED CAR MARKET ANALYSIS BY CAR BRAND FIGURE 42. ITALY KENYA USED CAR MARKET ANALYSIS BY CAR AGE FIGURE 43. ITALY KENYA USED CAR MARKET ANALYSIS BY FUEL TYPE FIGURE 44. ITALY KENYA USED CAR MARKET ANALYSIS BY CAR TRANSMISSION FIGURE 45. ITALY KENYA USED CAR MARKET ANALYSIS BY REGIONAL FIGURE 46. SPAIN KENYA USED CAR MARKET ANALYSIS BY CAR BODY TYPE FIGURE 47. SPAIN KENYA USED CAR MARKET ANALYSIS BY CAR BRAND FIGURE 48. SPAIN KENYA USED CAR MARKET ANALYSIS BY CAR AGE FIGURE 49. SPAIN KENYA USED CAR MARKET ANALYSIS BY FUEL TYPE FIGURE 50. SPAIN KENYA USED CAR MARKET ANALYSIS BY CAR TRANSMISSION FIGURE 51. SPAIN KENYA USED CAR MARKET ANALYSIS BY REGIONAL FIGURE 52. REST OF EUROPE KENYA USED CAR MARKET ANALYSIS BY CAR BODY TYPE FIGURE 53. REST OF EUROPE KENYA USED CAR MARKET ANALYSIS BY CAR BRAND FIGURE 54. REST OF EUROPE KENYA USED CAR MARKET ANALYSIS BY CAR AGE FIGURE 55. REST OF EUROPE KENYA USED CAR MARKET ANALYSIS BY FUEL TYPE FIGURE 56. REST OF EUROPE KENYA USED CAR MARKET ANALYSIS BY CAR TRANSMISSION FIGURE 57. REST OF EUROPE KENYA USED CAR MARKET ANALYSIS BY REGIONAL FIGURE 58. APAC KENYA USED CAR MARKET ANALYSIS FIGURE 59. CHINA KENYA USED CAR MARKET ANALYSIS BY CAR BODY TYPE FIGURE 60. CHINA KENYA USED CAR MARKET ANALYSIS BY CAR BRAND FIGURE 61. CHINA KENYA USED CAR MARKET ANALYSIS BY CAR AGE FIGURE 62. CHINA KENYA USED CAR MARKET ANALYSIS BY FUEL TYPE FIGURE 63. CHINA KENYA USED CAR MARKET ANALYSIS BY CAR TRANSMISSION FIGURE 64. CHINA KENYA USED CAR MARKET ANALYSIS BY REGIONAL FIGURE 65. INDIA KENYA USED CAR MARKET ANALYSIS BY CAR BODY TYPE FIGURE 66. INDIA KENYA USED CAR MARKET ANALYSIS BY CAR BRAND FIGURE 67. INDIA KENYA USED CAR MARKET ANALYSIS BY CAR AGE FIGURE 68. INDIA KENYA USED CAR MARKET ANALYSIS BY FUEL TYPE FIGURE 69. INDIA KENYA USED CAR MARKET ANALYSIS BY CAR TRANSMISSION FIGURE 70. INDIA KENYA USED CAR MARKET ANALYSIS BY REGIONAL FIGURE 71. JAPAN KENYA USED CAR MARKET ANALYSIS BY CAR BODY TYPE FIGURE 72. JAPAN KENYA USED CAR MARKET ANALYSIS BY CAR BRAND FIGURE 73. JAPAN KENYA USED CAR MARKET ANALYSIS BY CAR AGE FIGURE 74. JAPAN KENYA USED CAR MARKET ANALYSIS BY FUEL TYPE FIGURE 75. JAPAN KENYA USED CAR MARKET ANALYSIS BY CAR TRANSMISSION FIGURE 76. JAPAN KENYA USED CAR MARKET ANALYSIS BY REGIONAL FIGURE 77. SOUTH KOREA KENYA USED CAR MARKET ANALYSIS BY CAR BODY TYPE FIGURE 78. SOUTH KOREA KENYA USED CAR MARKET ANALYSIS BY CAR BRAND FIGURE 79. SOUTH KOREA KENYA USED CAR MARKET ANALYSIS BY CAR AGE FIGURE 80. SOUTH KOREA KENYA USED CAR MARKET ANALYSIS BY FUEL TYPE FIGURE 81. SOUTH KOREA KENYA USED CAR MARKET ANALYSIS BY CAR TRANSMISSION FIGURE 82. SOUTH KOREA KENYA USED CAR MARKET ANALYSIS BY REGIONAL FIGURE 83. MALAYSIA KENYA USED CAR MARKET ANALYSIS BY CAR BODY TYPE FIGURE 84. MALAYSIA KENYA USED CAR MARKET ANALYSIS BY CAR BRAND FIGURE 85. MALAYSIA KENYA USED CAR MARKET ANALYSIS BY CAR AGE FIGURE 86. MALAYSIA KENYA USED CAR MARKET ANALYSIS BY FUEL TYPE FIGURE 87. MALAYSIA KENYA USED CAR MARKET ANALYSIS BY CAR TRANSMISSION FIGURE 88. MALAYSIA KENYA USED CAR MARKET ANALYSIS BY REGIONAL FIGURE 89. THAILAND KENYA USED CAR MARKET ANALYSIS BY CAR BODY TYPE FIGURE 90. THAILAND KENYA USED CAR MARKET ANALYSIS BY CAR BRAND FIGURE 91. THAILAND KENYA USED CAR MARKET ANALYSIS BY CAR AGE FIGURE 92. THAILAND KENYA USED CAR MARKET ANALYSIS BY FUEL TYPE FIGURE 93. THAILAND KENYA USED CAR MARKET ANALYSIS BY CAR TRANSMISSION FIGURE 94. THAILAND KENYA USED CAR MARKET ANALYSIS BY REGIONAL FIGURE 95. INDONESIA KENYA USED CAR MARKET ANALYSIS BY CAR BODY TYPE FIGURE 96. INDONESIA KENYA USED CAR MARKET ANALYSIS BY CAR BRAND FIGURE 97. INDONESIA KENYA USED CAR MARKET ANALYSIS BY CAR AGE FIGURE 98. INDONESIA KENYA USED CAR MARKET ANALYSIS BY FUEL TYPE FIGURE 99. INDONESIA KENYA USED CAR MARKET ANALYSIS BY CAR TRANSMISSION FIGURE 100. INDONESIA KENYA USED CAR MARKET ANALYSIS BY REGIONAL FIGURE 101. REST OF APAC KENYA USED CAR MARKET ANALYSIS BY CAR BODY TYPE FIGURE 102. REST OF APAC KENYA USED CAR MARKET ANALYSIS BY CAR BRAND FIGURE 103. REST OF APAC KENYA USED CAR MARKET ANALYSIS BY CAR AGE FIGURE 104. REST OF APAC KENYA USED CAR MARKET ANALYSIS BY FUEL TYPE FIGURE 105. REST OF APAC KENYA USED CAR MARKET ANALYSIS BY CAR TRANSMISSION FIGURE 106. REST OF APAC KENYA USED CAR MARKET ANALYSIS BY REGIONAL FIGURE 107. SOUTH AMERICA KENYA USED CAR MARKET ANALYSIS FIGURE 108. BRAZIL KENYA USED CAR MARKET ANALYSIS BY CAR BODY TYPE FIGURE 109. BRAZIL KENYA USED CAR MARKET ANALYSIS BY CAR BRAND FIGURE 110. BRAZIL KENYA USED CAR MARKET ANALYSIS BY CAR AGE FIGURE 111. BRAZIL KENYA USED CAR MARKET ANALYSIS BY FUEL TYPE FIGURE 112. BRAZIL KENYA USED CAR MARKET ANALYSIS BY CAR TRANSMISSION FIGURE 113. BRAZIL KENYA USED CAR MARKET ANALYSIS BY REGIONAL FIGURE 114. MEXICO KENYA USED CAR MARKET ANALYSIS BY CAR BODY TYPE FIGURE 115. MEXICO KENYA USED CAR MARKET ANALYSIS BY CAR BRAND FIGURE 116. MEXICO KENYA USED CAR MARKET ANALYSIS BY CAR AGE FIGURE 117. MEXICO KENYA USED CAR MARKET ANALYSIS BY FUEL TYPE FIGURE 118. MEXICO KENYA USED CAR MARKET ANALYSIS BY CAR TRANSMISSION FIGURE 119. MEXICO KENYA USED CAR MARKET ANALYSIS BY REGIONAL FIGURE 120. ARGENTINA KENYA USED CAR MARKET ANALYSIS BY CAR BODY TYPE FIGURE 121. ARGENTINA KENYA USED CAR MARKET ANALYSIS BY CAR BRAND FIGURE 122. ARGENTINA KENYA USED CAR MARKET ANALYSIS BY CAR AGE FIGURE 123. ARGENTINA KENYA USED CAR MARKET ANALYSIS BY FUEL TYPE FIGURE 124. ARGENTINA KENYA USED CAR MARKET ANALYSIS BY CAR TRANSMISSION FIGURE 125. ARGENTINA KENYA USED CAR MARKET ANALYSIS BY REGIONAL FIGURE 126. REST OF SOUTH AMERICA KENYA USED CAR MARKET ANALYSIS BY CAR BODY TYPE FIGURE 127. REST OF SOUTH AMERICA KENYA USED CAR MARKET ANALYSIS BY CAR BRAND FIGURE 128. REST OF SOUTH AMERICA KENYA USED CAR MARKET ANALYSIS BY CAR AGE FIGURE 129. REST OF SOUTH AMERICA KENYA USED CAR MARKET ANALYSIS BY FUEL TYPE FIGURE 130. REST OF SOUTH AMERICA KENYA USED CAR MARKET ANALYSIS BY CAR TRANSMISSION FIGURE 131. REST OF SOUTH AMERICA KENYA USED CAR MARKET ANALYSIS BY REGIONAL FIGURE 132. MEA KENYA USED CAR MARKET ANALYSIS FIGURE 133. GCC COUNTRIES KENYA USED CAR MARKET ANALYSIS BY CAR BODY TYPE FIGURE 134. GCC COUNTRIES KENYA USED CAR MARKET ANALYSIS BY CAR BRAND FIGURE 135. GCC COUNTRIES KENYA USED CAR MARKET ANALYSIS BY CAR AGE FIGURE 136. GCC COUNTRIES KENYA USED CAR MARKET ANALYSIS BY FUEL TYPE FIGURE 137. GCC COUNTRIES KENYA USED CAR MARKET ANALYSIS BY CAR TRANSMISSION FIGURE 138. GCC COUNTRIES KENYA USED CAR MARKET ANALYSIS BY REGIONAL FIGURE 139. SOUTH AFRICA KENYA USED CAR MARKET ANALYSIS BY CAR BODY TYPE FIGURE 140. SOUTH AFRICA KENYA USED CAR MARKET ANALYSIS BY CAR BRAND FIGURE 141. SOUTH AFRICA KENYA USED CAR MARKET ANALYSIS BY CAR AGE FIGURE 142. SOUTH AFRICA KENYA USED CAR MARKET ANALYSIS BY FUEL TYPE FIGURE 143. SOUTH AFRICA KENYA USED CAR MARKET ANALYSIS BY CAR TRANSMISSION FIGURE 144. SOUTH AFRICA KENYA USED CAR MARKET ANALYSIS BY REGIONAL FIGURE 145. REST OF MEA KENYA USED CAR MARKET ANALYSIS BY CAR BODY TYPE FIGURE 146. REST OF MEA KENYA USED CAR MARKET ANALYSIS BY CAR BRAND FIGURE 147. REST OF MEA KENYA USED CAR MARKET ANALYSIS BY CAR AGE FIGURE 148. REST OF MEA KENYA USED CAR MARKET ANALYSIS BY FUEL TYPE FIGURE 149. REST OF MEA KENYA USED CAR MARKET ANALYSIS BY CAR TRANSMISSION FIGURE 150. REST OF MEA KENYA USED CAR MARKET ANALYSIS BY REGIONAL FIGURE 151. KEY BUYING CRITERIA OF KENYA USED CAR MARKET FIGURE 152. RESEARCH PROCESS OF MRFR FIGURE 153. DRO ANALYSIS OF KENYA USED CAR MARKET FIGURE 154. DRIVERS IMPACT ANALYSIS: KENYA USED CAR MARKET FIGURE 155. RESTRAINTS IMPACT ANALYSIS: KENYA USED CAR MARKET FIGURE 156. SUPPLY / VALUE CHAIN: KENYA USED CAR MARKET FIGURE 157. KENYA USED CAR MARKET, BY CAR BODY TYPE, 2024 (% SHARE) FIGURE 158. KENYA USED CAR MARKET, BY CAR BODY TYPE, 2019 TO 2032 (USD Billions) FIGURE 159. KENYA USED CAR MARKET, BY CAR BRAND, 2024 (% SHARE) FIGURE 160. KENYA USED CAR MARKET, BY CAR BRAND, 2019 TO 2032 (USD Billions) FIGURE 161. KENYA USED CAR MARKET, BY CAR AGE, 2024 (% SHARE) FIGURE 162. KENYA USED CAR MARKET, BY CAR AGE, 2019 TO 2032 (USD Billions) FIGURE 163. KENYA USED CAR MARKET, BY FUEL TYPE, 2024 (% SHARE) FIGURE 164. KENYA USED CAR MARKET, BY FUEL TYPE, 2019 TO 2032 (USD Billions) FIGURE 165. KENYA USED CAR MARKET, BY CAR TRANSMISSION, 2024 (% SHARE) FIGURE 166. KENYA USED CAR MARKET, BY CAR TRANSMISSION, 2019 TO 2032 (USD Billions) FIGURE 167. KENYA USED CAR MARKET, BY REGIONAL, 2024 (% SHARE) FIGURE 168. KENYA USED CAR MARKET, BY REGIONAL, 2019 TO 2032 (USD Billions) FIGURE 169. BENCHMARKING OF MAJOR COMPETITORS

    Report Infographic
    Free Sample Request

    Kindly complete the form below to receive a free sample of this Report

    Customer Strories

    “I am very pleased with how market segments have been defined in a relevant way for my purposes (such as "Portable Freezers & refrigerators" and "last-mile"). In general the report is well structured. Thanks very much for your efforts.”

    Victoria Milne Founder
    Case Study

    Chemicals and Materials