• Cat-intel
  • MedIntelliX
  • Resources
  • About Us
  • Request Free Sample ×

    Kindly complete the form below to receive a free sample of this Report

    Leading companies partner with us for data-driven Insights

    clients tt-cursor

    Iron Ore Market

    ID: MRFR/E&P/6532-CR
    251 Pages
    Chitranshi Jaiswal
    June 2025

    Iron Ore Market Research Report Information by Product Type (Hematite, Magnetite, Limonite, Siderite, Others), by Form (Sinter Fines, Lumps, Pellets, Others), by End-Use Industry (Steel Manufacturing (Construction, Automotive & Transportation, Medical, Others) and Others) and Region (North America, Europe, Asia-Pacific, Latin America, Middle East & Africa) - Forecast till 2035

    Share:
    Download PDF ×

    We do not share your information with anyone. However, we may send you emails based on your report interest from time to time. You may contact us at any time to opt-out.

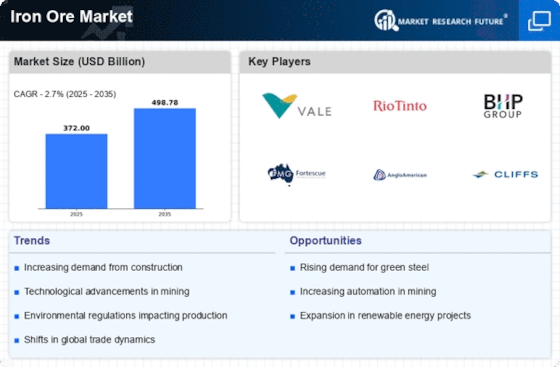
    Iron Ore Market Research Report – Forecast Till 2035 Infographic
    Purchase Options
    $ 4,950.0
    $ 5,950.0
    $ 7,250.0
    Table of Contents

    Iron Ore Market Summary

    As per Market Research Future Analysis, the global Iron Ore Market was valued at USD 336.48 Billion in 2024 and is projected to grow from USD 338.62 Billion in 2025 to USD 665.90 Billion by 2035, with a CAGR of 2.74% during the forecast period. The growth is driven by the construction industry's expansion and the increasing use of steel in automotive and transportation sectors. Hematite is the dominant product type, while sinter fines lead in form. The Asia-Pacific region, particularly China, is the largest producer and consumer of iron ore, significantly influencing global trade dynamics.

    Key Market Trends & Highlights

    Key trends shaping the Iron Ore Market include technological advancements and increasing demand across various sectors.

    • Iron Ore Market projected to reach USD 665.90 Billion by 2035.
    • Hematite segment expected to be the fastest-growing product type during the forecast period.
    • Asia-Pacific region, led by China, is the largest market for iron ore.
    • Steel Manufacturing segment dominated the market in 2024.

    Market Size & Forecast

    2024 Market Size USD 336.48 Billion
    2025 Market Size USD 338.62 Billion
    2035 Market Size USD 665.90 Billion
    CAGR (2025-2035) 2.74%
    Dominant Product Type in 2024 Hematite

    Major Players

    Key players include Vale S. A., Rio Tinto, BHP, Fortescue Metals Group Ltd, Ansteel Group Corporation Limited, ArcelorMittal, and Cleveland-Cliffs Inc.

    Iron Ore Market Trends

    The global iron ore market appears to be experiencing a shift towards increased demand driven by infrastructure projects and industrial activities, suggesting a potential tightening of supply in the near future.

    U.S. Geological Survey

    Iron Ore Market Drivers

    Global Economic Recovery

    The ongoing global economic recovery is a pivotal driver for the Global Iron Ore Market Industry. As economies rebound, industrial activities and construction projects are expected to surge, leading to increased demand for iron ore. Countries emerging from economic downturns are likely to invest heavily in infrastructure, further propelling the need for steel and, consequently, iron ore. This recovery phase is anticipated to bolster the market, with projections indicating a potential market size of 665.9 USD Billion by 2035. The Global Iron Ore Market Industry appears well-positioned to capitalize on this resurgence, with a compound annual growth rate of 6.4% from 2025 to 2035.

    Market Trends and Projections

    The Global Iron Ore Market Industry is characterized by various trends and projections that indicate its future trajectory. Current market analyses suggest a valuation of 336.5 USD Billion in 2024, with expectations of reaching 665.9 USD Billion by 2035. The compound annual growth rate of 6.4% from 2025 to 2035 highlights the industry's potential for growth. Factors such as increasing steel demand, technological advancements, and supportive government policies are likely to contribute to this upward trend. Additionally, emerging markets and urbanization are expected to play a crucial role in shaping the market landscape, making it a dynamic and evolving sector.

    Emerging Markets and Urbanization

    Emerging markets, particularly in Asia and Africa, are witnessing rapid urbanization, which is a significant driver for the Global Iron Ore Market Industry. As populations migrate to urban areas, the demand for housing, infrastructure, and transportation increases, necessitating higher steel production. Countries like India and Nigeria are experiencing substantial growth in urban populations, leading to a surge in construction activities. This trend suggests that the Global Iron Ore Market Industry will continue to expand, with projections indicating a market value of 336.5 USD Billion in 2024 and potentially reaching 665.9 USD Billion by 2035, driven by urbanization and industrialization.

    Rising Demand from Steel Industry

    The Global Iron Ore Market Industry experiences a robust demand driven primarily by the steel sector, which accounts for a substantial portion of iron ore consumption. In 2024, the market is valued at approximately 336.5 USD Billion, reflecting the ongoing expansion of infrastructure projects and construction activities worldwide. Countries such as China and India are leading this demand, as their urbanization efforts necessitate increased steel production. This trend suggests that the Global Iron Ore Market Industry will continue to thrive, potentially reaching a valuation of 665.9 USD Billion by 2035, with a compound annual growth rate of 6.4% projected from 2025 to 2035.

    Government Policies and Regulations

    Government policies and regulations play a crucial role in shaping the Global Iron Ore Market Industry. Many countries are implementing favorable policies to boost domestic production and attract foreign investment in the mining sector. For example, initiatives aimed at reducing export tariffs and enhancing infrastructure development are likely to facilitate smoother operations for iron ore producers. Additionally, environmental regulations are pushing companies to adopt sustainable practices, which may initially increase costs but ultimately lead to long-term benefits. As governments continue to support the mining industry, the Global Iron Ore Market Industry is expected to see sustained growth and stability.

    Technological Advancements in Mining

    Technological innovations in mining processes are significantly influencing the Global Iron Ore Market Industry. Automation and advanced extraction techniques enhance operational efficiency and reduce costs, enabling companies to meet the rising demand for iron ore. For instance, the adoption of autonomous vehicles and real-time data analytics in mines has improved productivity and safety. These advancements not only optimize resource utilization but also contribute to environmental sustainability, which is increasingly prioritized by stakeholders. As mining operations become more efficient, the Global Iron Ore Market Industry is likely to benefit from reduced production costs and increased output, further supporting market growth.

    Market Segment Insights

    Iron Ore System by Product Type Insights

    Based on Product Type, this segment includes Hematite, Magnetite, Limonite, Siderite, and Others. The Hematite segment dominated the global market in 2024, while it is projected to be the fastest–growing segment during the forecast period. Hematite is one of the most important ores of iron pellets. It was mined at various locations across the world. However, today's production comes from a few dozen large deposits where significant equipment investments allow companies to efficiently mine and process the ore. 

    Most ores are now mined from China, India, Australia, Russia, Ukraine, Brazil, Venezuela, South Africa, Canada, and the US. Hematite is majorly used to produce pigments, radiation shielding, healing stones, as a gem material, heavy media separation and its preparations, ballast, and other products. Hematite ore, due to its high iron content, the ore must undergo only a simple crushing, screening, and blending process before being deemed fit for steel production, thus making it suitable for various mining and steel producing companies.

    FIGURE 2: IRON ORE MARKET SHARE BY PRODUCT TYPE 2024 AND 2035 (USD BILLION)

     IRON ORE MARKET SHARE BY PRODUCT TYPE 2024 AND 2035

    Source: Secondary Research, Primary Research, MRFR Database and Analyst Review

    Iron Ore System by Form Insights

    Based on Form, this segment includes Mining Sites, Sinter Fines, Lumps, Pellets, and Others. The Sinter Fines segment dominated the global market in 2024, while the Pellets segment is projected to be the fastest–growing segment during the forecast period. Sinter fines are created in the sinter plants, where the product could be used in the blast furnace. The sinter fines are small, irregular nodules of iron mixed with small amounts of other minerals. 

    The sintering process is developed mainly to reduce the size of lump ore known as iron ore fines, which could not be charged directly in the blast furnace otherwise. Sintering is defined as the agglomeration of the iron ore fines (<8 mm, generally) by incipient fusion of fine mineral particles with heat produced by burning of coke breeze, uniformly distributed in raw mix bed. Sintering plants are generally associated with the production of hot metal in blast furnaces in integrated steel plants.

    The sintering process is a pre-treatment process to produce the charge material called a sinter for the blast furnace from iron ore fines.

    Iron Ore System by End-Use Industry Insights

    Based on End-Use Industry, this segment includes Steel Manufacturing (Construction, Automotive & Transportation, Medical, Others) and Others. The Steel Manufacturing segment dominated the global market in 2024, while the Steel Manufacturing (Medical) is projected to be the fastest–growing segment during the forecast period. Steel is created from iron ore, which is a naturally occurring combination of iron, oxygen, and other minerals. Steel is made from raw materials that are mined and then turned into steel using electric arc furnace and blast furnace/basic oxygen furnace. 

    Coke, iron ore, and limestone are used to make pig iron in the blast furnace. After 18 to 24 hours of reaction time, the cooked coal, termed coke, is taken from the oven. Cooled coke is screened into one- to four-inch chunks. Coke is a porous, hard black rock with ash and sulphur that is high in concentrated carbon (90-93 percent). Coke is particularly powerful when compared to raw coal. The permeability, heat, and gases needed to reduce and melt iron ore, pellets, and sinter are provided by the strong particles of coke with a high energy value.

    Iron Ore

    Regional Insights

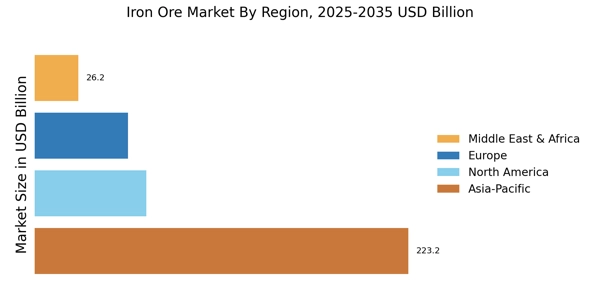
    Based on the Region, the global Iron Ore are segmented into North America, Europe, Asia-Pacific, Latin America and Middle East & Africa. Major demand factors driving the Asia-Pacific market are healthy growth of the construction industry and growing use of steel in the automotive and transportation industries. China produces the most iron ore in Asia-Pacific, followed by Japan, India, and Korea. Brazil, Germany, and Russia are among the world's most important iron ore producers. Iron ore production is expected to rise in Asia-Pacific because of rapid development and industrialization.

    China has traditionally been the primary engine of global iron ore sector growth, projected to continue in the coming years. Any change in the country's steel production has a big impact on worldwide iron ore trading.

    FIGURE 3: IRON ORE MARKET VOLUME, VALUE BY REGION 2024 AND 2035 (USD BILLION)

    IRON ORE MARKET VOLUME, VALUE BY REGION 2024 AND 2035

    Source: Secondary Research, Primary Research, MRFR Database, and Analyst Review

    Further, the countries considered in the scope of the Application Tracking System Market are the US, Canada, Germany, the UK, France, Spain, Italy, Russia, Belgium, Poland, Netherlands, China, Japan, India, Australia & New Zealand, Indonesia, South Korea, Brazil, Mexico, Argentina, Saudi Arabia, Iran, Israel, Turkey, South Africa, UAE and others.

    Key Players and Competitive Insights

    Many global, regional, and local vendors characterize the Iron Ore Market. The market is highly competitive, with all the players competing to gain market share. Intense competition, rapid advances in technology, frequent changes in government policies, and environmental regulations are key factors that confront market growth. The vendors compete based on cost, product quality, reliability, and government regulations. Vendors must provide cost-efficient, high-quality products to survive and succeed in an intensely competitive market.

    The major competitors in the market are Vale S. A., Rio Tinto, BHP, Fortescue Metals Group Ltd, Ansteel Group Corporation Limited, ArcelorMittal, METALLOINVEST MC LLC, LKAB, Cleveland-Cliffs Inc., HBIS GROUP, Anglo American plc, EVRAZ plc are among others. The Iron Ore Market is a consolidated market due to increasing competition, acquisitions, mergers and other strategic market developments and decisions to improve operational effectiveness.

    Key Companies in the Iron Ore Market market include

    Industry Developments

    May 2021: Metalloinvest signed new long-term contracts with leading Russian and international companies for the supply of iron ore products. Under these agreements, Metalloinvest will supply 3.6 mn tons of concentration and 12 mn tons of pellets per year from Lebedinsky GOK and Andrey Varichev Mikhailovsky GOK. The contract's terms range from one to three years.

    September 2021: ArcelorMittal has signed an agreement with the Government of Liberia to allow the firm to expand iron mining and logistics operations in the country. The two parties have signed an amendment to the Mineral Development Agreement (MDA) that would significantly increase the firm’s premium iron ore production while generating wider economic benefits for the country.

    August 2020: HBIS Group has signed an initial deal to develop the Pampa de Pongo iron ore mine in Peru alongside current license-holder Zhongrong Xinda. The joint venture is to set up companies to work on the first stage of mine, which also contains copper, cobalt, and gold reserves.

    November 2020: LKAB announced the successful production of the world’s first iron ore pellets with fossil-free fuels. Increased production of fossil fuel-free iron ore pallets will help create a value chain for fossil-free steel and reduce Sweden's total carbon dioxide emissions by 10 percent.

    December 2020: Cleveland-Cliffs Inc. completed the acquisition of ArcelorMittal USA. The acquisition is expected to help the company emerge as one of the leading steelmakers in the North American market.

    Iron Ore Market Segmentation

    Iron Ore by Product Type Outlook

    • Hematite
    • Magnetite
    • Limonite
    • Siderite
    • Others

    Iron Ore by Form Outlook

    • Sinter Fines
    • Lumps
    • Pellets
    • Others

    Iron Ore by Application Outlook

    • Steel Manufacturing
      • Construction
      • Automotive & Transportation
      • Medical
      • Others
    • Others

    Iron Ore Regional Outlook

    • North America
      • US
      • Canada
    • Europe
      • Germany
      • UK
      • France
      • Spain
      • Italy
      • Russia
      • Belgium
      • Poland
      • Netherlands
      • Rest of Europe
    • Asia-Pacific
      • China
      • India
      • Japan
      • Australia & New Zealand
      • Indonesia
      • South Korea
      • Rest of Asia-Pacific
    • Latin America
      • Brazil
      • Mexico
      • Argentina
      • Rest of South America
    • Middle East & Africa
      • Saudi Arabia
      • Iran
      • Israel
      • Turkey
      • South Africa
      • UAE
      • Rest of Middle East & Africa

    Future Outlook

    Iron Ore Market Future Outlook

    The Global Iron Ore Market is projected to grow at a 6.4% CAGR from 2024 to 2035, driven by increasing steel demand, technological advancements, and sustainable mining practices.

    New opportunities lie in:

    • Invest in advanced ore processing technologies to enhance yield and reduce waste.
    • Develop partnerships with renewable energy firms to power mining operations sustainably.
    • Explore emerging markets in Asia and Africa for new iron ore supply chains.

    By 2035, the Global Iron Ore Market is expected to be robust, reflecting strong demand and innovative practices.

    Market Segmentation

    Regional Outlook

    • US
    • Canada

    Iron Ore by Form Outlook

    • Sinter Fines
    • Lumps
    • Pellets
    • Others

    Iron Ore by Application Outlook

    • Construction
    • Automotive & Transportation
    • Medical
    • Others

    Iron Ore by Product Type Outlook

    • Hematite
    • Magnetite
    • Limonite
    • Siderite
    • Others

    Report Scope

    Report Attribute/Metric Details
    Market Size 2024 USD 336.48 Billion
    Market Size 2025 USD 338.62 Billion
    Market Size 2035 USD 665.90 Billion
    Compound Annual Growth Rate (CAGR) 2.74% (2025-2035)
    Base Year 2024
    Forecast Period 2025-2035
    Historical Data 2019-2023
    Forecast Units Volume, Value (Million Tons, USD Billion)
    Report Coverage Revenue Forecast, Competitive Landscape, Growth Factors, and Trends
    Segments Covered By Product Type, By Form, By End-Use Industry
    Geographies Covered North America, Europe, Asia Pacific, Latin America, Middle East & Africa
    Countries Covered The US, Canada, Germany, the UK, France, Spain, Italy, Russia, Belgium, Poland, Netherlands, China, Japan, India, Australia & New Zealand, Indonesia, South Korea, Brazil, Mexico, Argentina, Saudi Arabia, Iran, Israel, Turkey, South Africa, UAE
    Key Companies Profiled Vale S. A., Rio Tinto, BHP, Fortescue Metals Group Ltd, Ansteel Group Corporation Limited, ArcelorMittal, METALLOINVEST MC LLC, LKAB, Cleveland-Cliffs Inc., HBIS GROUP, Anglo American plc, EVRAZ plc
    Key Market Opportunities ·         Increasing adoption of iron oxide pigments in various applications
    Key Market Dynamics ·         Healthy growth of the construction industry ·         Growing use of steel in the automotive and transportation industries

    Market Highlights

    Author
    Chitranshi Jaiswal
    Research Analyst Level I

    In her 3 years of experience in the market research field, she has handled critical cross-domain projects. She has an in-depth knowledge of market estimation & analysis, problem-solving, primary as well as secondary research, and team management.She holds an engineering degree and is an MBA professional from a well-known university, capable of evaluating the market and competitive conditions. An exceptional strategist with excellent communication skills and a passion for delivering cutting-edge & practical insights for the market. Proficient in multi-tasking, and can successfully deal with competing demands, while maintaining complete confidentiality. Generated business through active client and project development, networking, and high-quality responses. Her knowledge and skills have helped in making solid business decisions, securing funding from investors, and avoiding business failures.

    Leave a Comment

    FAQs

    How much is the Global Iron Ore Market?

    USD 336.48 Billion is the Iron Ore Market in 2024

    Which Form holds the largest market share?

    The Sinter Fines segment by Form holds the largest market share and grows at a CAGR of 2.76% during the forecast period.

    Which region holds the largest market share in the Global Iron Ore Market?

    Asia-Pacific holds the largest market share in the Global Iron Ore Market.

    Who are the prominent players in the Global Iron Ore Market?

    Vale S. A., Rio Tinto, BHP, Fortescue Metals Group Ltd, Ansteel Group Corporation Limited, ArcelorMittal, METALLOINVEST MC LLC, LKAB, Cleveland-Cliffs Inc., HBIS GROUP, Anglo American plc, EVRAZ plc are the prominent players in the Global Iron Ore Market.

    Which Product Type segment led the Global Iron Ore Market?

    The Hematite segment dominated the market in 2024.

    1. EXECUTIVE SUMMARY
      1. MARKET ATTRACTIVENESS
    2. ANALYSIS
      1. GLOBAL IRON ORE MARKET, BY PRODUCT TYPE
        1. GLOBAL IRON
    3. ORE MARKET, BY FORM
      1. GLOBAL IRON ORE MARKET, BY END-USE INDUSTRY
    4. GLOBAL IRON ORE MARKET, BY REGION
    5. MARKET INTRODUCTION
      1. DEFINITION
      2. SCOPE OF THE STUDY
      3. MARKET STRUCTURE
    6. RESEARCH METHODOLOGY
      1. RESEARCH PROCESS
      2. PRIMARY RESEARCH
      3. SECONDARY RESEARCH
      4. MARKET SIZE ESTIMATION
      5. TOP-DOWN AND BOTTOM-UP APPROACHES
    7. FORECAST MODEL
      1. LIST OF ASSUMPTIONS & LIMITATIONS
    8. MARKET DYNAMICS
      1. INTRODUCTION
      2. DRIVERS
        1. HEALTHY GROWTH OF THE CONSTRUCTION
    9. INDUSTRY
      1. GROWING USE OF STEEL IN THE AUTOMOTIVE AND TRANSPORTATION INDUSTRIES
      2. RESTRAINTS
        1. STRINGENT GOVERNMENT REGULATIONS ON MINING ACTIVITIES
      3. OPPORTUNITIES
        1. INCREASING ADOPTION OF IRON OXIDE PIGMENTS IN VARIOUS
    10. APPLICATIONS
      1. CHALLENGES
        1. INCREASING EMPHASIS ON STEEL RECYCLING
    11. MARKET FACTOR ANALYSIS
      1. SUPPLY CHAIN ANALYSIS
        1. IRON ORE PROCESSING
    12. & PRODUCERS
      1. DISTRIBUTION & SALES CHANNEL
        1. END-USE INDUSTRY
      2. PORTER’S FIVE FORCES ANALYSIS
        1. THREAT OF NEW ENTRANTS
    13. BARGAINING POWER OF SUPPLIERS
      1. THREAT OF SUBSTITUTES
        1. BARGAINING
    14. POWER OF BUYERS
      1. INTENSITY OF RIVALRY
      2. PRICING OVERVIEW, BY REGION
    15. (USD/TON)
      1. IMPACT OF COVID-19 OUTBREAK ON THE GLOBAL IRON ORE MARKET
        1. OVERVIEW OF SUPPLY SCENARIO
        2. IMPACT ON IRON ORE SUPPLIERS AND MANUFACTURERS
        3. IMPACT ON IRON
    16. ORE END USERS
    17. GLOBAL IRON ORE MARKET, BY PRODUCT TYPE
      1. OVERVIEW
        1. IRON ORE: MARKET ESTIMATES & FORECAST BY PRODUCT TYPE, 2019–2030
        2. IRON ORE: MARKET ESTIMATES & FORECAST BY PRODUCT TYPE, 2019–2030
      2. HEMATITE
        1. HEMATITE: MARKET ESTIMATES & FORECAST BY REGION,2019–2030
      3. MAGNETITE
        1. MAGNETITE: MARKET ESTIMATES & FORECAST BY REGION,2019–2030
      4. LIMONITE
        1. LIMONITE: MARKET ESTIMATES & FORECAST BY REGION,2019–2030
      5. SIDERITE
        1. SIDERITE: MARKET ESTIMATES & FORECAST BY REGION,2019–2030
      6. OTHERS
        1. OTHERS: MARKET ESTIMATES & FORECAST BY REGION,2019–2030
    18. GLOBAL IRON ORE MARKET, BY FORM
      1. OVERVIEW
        1. IRON ORE: MARKET
    19. ESTIMATES & FORECAST BY FORM, 2019–2030
      1. IRON ORE: MARKET ESTIMATES
    20. & FORECAST BY FORM, 2019–2030
      1. SINTER FINES
        1. SINTER
    21. FINES: MARKET ESTIMATES & FORECAST BY REGION,2019–2030
      1. LUMPS
        1. LUMPS: MARKET ESTIMATES & FORECAST BY REGION,2019–2030
    22. PELLETS
      1. PELLETS: MARKET ESTIMATES & FORECAST BY REGION,2019–2030
      2. OTHERS
        1. OTHERS: MARKET ESTIMATES & FORECAST BY REGION,2019–2030
    23. GLOBAL IRON ORE MARKET, BY END-USE INDUSTRY
      1. OVERVIEW
        1. IRON
    24. ORE: MARKET ESTIMATES & FORECAST BY END-USE INDUSTRY, 2019–2030
    25. IRON ORE: MARKET ESTIMATES & FORECAST BY END-USE INDUSTRY, 2019–2030
      1. STEEL MANUFACTURING
        1. STEEL MANUFACTURING: MARKET ESTIMATES &
    26. FORECAST BY REGION,2019–2030
      1. OTHERS
        1. OTHERS: MARKET ESTIMATES
    27. & FORECAST BY REGION,2019–2030
    28. GLOBAL IRON ORE MARKET, BY REGION
      1. OVERVIEW
      2. NORTH AMERICA
        1. US
        2. CANADA
      3. EUROPE
        1. GERMANY
        2. UK
        3. FRANCE
        4. SPAIN
        5. ITALY
        6. RUSSIA
        7. BELGIUM
        8. POLAND
        9. NETHERLANDS
    29. REST OF EUROPE
      1. ASIA-PACIFIC
        1. CHINA
        2. JAPAN
    30. INDIA
      1. AUSTRALIA & NEW ZEALAND
        1. INDONESIA
        2. SOUTH
    31. KOREA
      1. REST OF ASIA-PACIFIC
      2. LATIN AMERICA
        1. BRAZIL
        2. MEXICO
        3. ARGENTINA
        4. REST OF LATIN AMERICA
      3. MIDDLE
    32. EAST & AFRICA
      1. SAUDI ARABIA
        1. IRAN
        2. ISRAEL
    33. TURKEY
      1. SOUTH AFRICA
        1. UAE
        2. REST OF THE MIDDLE EAST
    34. & AFRICA
    35. COMPETITIVE LANDSCAPE
      1. INTRODUCTION
      2. MARKET
    36. STRATEGY ANALYSIS
      1. KEY DEVELOPMENTS & GROWTH STRATEGIES
      2. COMPETITIVE
    37. BENCHMARKING
    38. COMPANY PROFILES
      1. VALE S.A.
        1. COMPANY OVERVIEW
        2. FINANCIAL OVERVIEW
        3. PRODUCTS OFFERED
        4. KEY DEVELOPMENTS
        5. SWOT ANALYSIS
        6. KEY STRATEGIES
      2. RIO TINTO
    39. COMPANY OVERVIEW
      1. FINANCIAL OVERVIEW
        1. PRODUCTS OFFERED
        2. KEY DEVELOPMENTS
        3. SWOT ANALYSIS
        4. KEY STRATEGIES
      2. BHP
        1. COMPANY OVERVIEW
        2. FINANCIAL OVERVIEW
    40. PRODUCTS OFFERED
      1. KEY DEVELOPMENT
        1. SWOT ANALYSIS
    41. KEY STRATEGIES
      1. FORTESCUE METALS GROUP LTD
        1. COMPANY OVERVIEW
        2. FINANCIAL OVERVIEW
        3. PRODUCTS OFFERED
        4. KEY DEVELOPMENTS
        5. SWOT ANALYSIS
        6. KEY STRATEGIES
      2. ANSTEEL GROUP CORPORATION
    42. LIMITED
      1. COMPANY OVERVIEW
        1. FINANCIAL OVERVIEW
    43. PRODUCTS OFFERED
      1. KEY DEVELOPMENTS
        1. SWOT ANALYSIS
    44. KEY STRATEGIES
      1. ARCELORMITTAL
        1. COMPANY OVERVIEW
    45. FINANCIAL OVERVIEW
      1. PRODUCTS OFFERED
        1. KEY DEVELOPMENTS
        2. SWOT ANALYSIS
        3. KEY STRATEGIES
      2. METALLOINVEST MC LLC
        1. COMPANY OVERVIEW
        2. FINANCIAL OVERVIEW
        3. PRODUCTS OFFERED
        4. KEY DEVELOPMENTS
        5. SWOT ANALYSIS
        6. KEY STRATEGIES
      3. LKAB
        1. COMPANY OVERVIEW
        2. FINANCIAL OVERVIEW
    46. PRODUCTS OFFERED
      1. SWOT ANALYSIS
        1. KEY STRATEGIES
    47. CLEVELAND-CLIFFS INC.
      1. COMPANY OVERVIEW
        1. FINANCIAL OVERVIEW
        2. PRODUCTS OFFERED
        3. KEY DEVELOPMENT
        4. SWOT ANALYSIS
        5. KEY STRATEGIES
      2. HBIS GROUP
        1. COMPANY OVERVIEW
    48. FINANCIAL OVERVIEW
      1. PRODUCTS OFFERED
        1. KEY DEVELOPMENTS
        2. SWOT ANALYSIS
        3. KEY STRATEGIES
      2. ANGLO AMERICAN PLC
        1. COMPANY OVERVIEW
        2. FINANCIAL OVERVIEW
        3. PRODUCTS
    49. OFFERED
      1. KEY DEVELOPMENT
        1. SWOT ANALYSIS
        2. KEY
    50. STRATEGIES
      1. EVRAZ PLC
        1. COMPANY OVERVIEW
        2. FINANCIAL
    51. OVERVIEW
      1. PRODUCTS OFFERED
        1. KEY DEVELOPMENTS
    52. SWOT ANALYSIS
      1. KEY STRATEGIES
    53. APPENDIX
      1. REFERENCES
      2. RELATED REPORTS
    54. & LIMITATIONS
    55. PRICING OVERVIEW, BY REGION (USD/TON)
    56. FORECAST, BY PRODUCT TYPE, 2019–2030 (USD MILLION)
    57. ESTIMATES & FORECAST, BY PRODUCT TYPE, 2019–2030 (MILLION TONS)
    58. HEMATITE MARKET ESTIMATES & FORECAST, BY REGION, 2019–2030 (USD MILLION)
    59. TONS)
    60. (USD MILLION)
    61. –2030 (MILLION TONS)
    62. BY REGION, 2019–2030 (USD MILLION)
    63. & FORECAST, BY REGION, 2019–2030 (MILLION TONS)
    64. MARKET ESTIMATES & FORECAST, BY REGION, 2019–2030 (USD MILLION)
    65. SIDERITE MARKET ESTIMATES & FORECAST, BY REGION, 2019–2030 (MILLION
    66. TONS)
    67. (USD MILLION)
    68. (MILLION TONS)
    69. –2030 (USD MILLION)
    70. BY FORM, 2019–2030 (MILLION TONS)
    71. & FORECAST, BY REGION, 2019–2030 (USD MILLION)
    72. MARKET ESTIMATES & FORECAST, BY REGION, 2019–2030 (MILLION TONS)
    73. LUMPS MARKET ESTIMATES & FORECAST, BY REGION, 2019–2030 (USD MILLION)
    74. TONS)
    75. (USD MILLION)
    76. –2030 (MILLION TONS)
    77. BY REGION, 2019–2030 (USD MILLION)
    78. FORECAST, BY REGION, 2019–2030 (MILLION TONS)
    79. ESTIMATES & FORECAST, BY END-USE INDUSTRY, 2019–2030 (USD MILLION)
    80. (MILLION TONS)
    81. BY REGION, 2019–2030 (USD MILLION)
    82. ESTIMATES & FORECAST, BY REGION, 2019–2030 (MILLION TONS)
    83. IRON ORE MARKET ESTIMATES & FORECAST, BY STEEL MANUFACTURING, 2019–2030
    84. (USD MILLION)
    85. –2030 (MILLION TONS)
    86. BY REGION, 2019–2030 (USD MILLION)
    87. FORECAST, BY REGION, 2019–2030 (MILLION TONS)
    88. MARKET, BY REGION, 2019–2030 (USD MILLION)
    89. BY REGION, 2019–2030 (MILLION TONS)
    90. MARKET, BY COUNTRY, 2019–2030 (USD MILLION)
    91. ORE MARKET, BY COUNTRY, 2019–2030 (MILLION TONS)
    92. IRON ORE MARKET, BY PRODUCT TYPE, 2019–2030 (USD MILLION)
    93. AMERICA: IRON ORE MARKET, BY PRODUCT TYPE, 2019–2030 (MILLION TONS)
    94. NORTH AMERICA: IRON ORE MARKET, BY FORM, 2019–2030 (USD MILLION)
    95. NORTH AMERICA: IRON ORE MARKET, BY FORM, 2019–2030 (MILLION TONS)
    96. NORTH AMERICA: IRON ORE MARKET, BY END-USE INDUSTRY, 2019–2030 (USD MILLION)
    97. (MILLION TONS)
    98. –2030 (USD MILLION)
    99. MANUFACTURING, 2019–2030 (MILLION TONS)
    100. BY PRODUCT TYPE, 2019–2030 (USD MILLION)
    101. BY PRODUCT TYPE, 2019–2030 (MILLION TONS)
    102. BY FORM, 2019–2030 (USD MILLION)
    103. –2030 (MILLION TONS)
    104. –2030 (USD MILLION)
    105. –2030 (MILLION TONS)
    106. –2030 (USD MILLION)
    107. –2030 (MILLION TONS)
    108. TYPE, 2019–2030 (USD MILLION)
    109. TYPE, 2019–2030 (MILLION TONS)
    110. –2030 (USD MILLION)
    111. (MILLION TONS)
    112. (USD MILLION)
    113. (MILLION TONS)
    114. (USD MILLION)
    115. (MILLION TONS)
    116. (USD MILLION)
    117. (MILLION TONS)
    118. (USD MILLION)
    119. (MILLION TONS)
    120. MILLION)
    121. TONS)
    122. (USD MILLION)
    123. (MILLION TONS)
    124. (USD MILLION)
    125. (MILLION TONS)
    126. (USD MILLION)
    127. (MILLION TONS)
    128. (USD MILLION)
    129. TONS)
    130. (USD MILLION)
    131. (MILLION TONS)
    132. (USD MILLION)
    133. (MILLION TONS)
    134. (USD MILLION)
    135. (MILLION TONS)
    136. MILLION)
    137. TONS)
    138. MILLION)
    139. (MILLION TONS)
    140. MILLION)
    141. TONS)
    142. (USD MILLION)
    143. (MILLION TONS)
    144. (USD MILLION)
    145. (MILLION TONS)
    146. (USD MILLION)
    147. (MILLION TONS)
    148. MILLION)
    149. TONS)
    150. (USD MILLION)
    151. (MILLION TONS)
    152. (USD MILLION)
    153. (MILLION TONS)
    154. (USD MILLION)
    155. (MILLION TONS)
    156. MILLION)
    157. TONS)
    158. (USD MILLION)
    159. (MILLION TONS)
    160. (USD MILLION)
    161. (MILLION TONS)
    162. (USD MILLION)
    163. (MILLION TONS)
    164. (USD MILLION)
    165. TONS)
    166. (USD MILLION)
    167. (MILLION TONS)
    168. (USD MILLION)
    169. (MILLION TONS)
    170. (USD MILLION)
    171. (MILLION TONS)
    172. (USD MILLION)
    173. (MILLION TONS)
    174. (USD MILLION)
    175. (MILLION TONS)
    176. –2030 (USD MILLION)
    177. MANUFACTURING, 2019–2030 (MILLION TONS)
    178. BY PRODUCT TYPE, 2019–2030 (USD MILLION)
    179. BY PRODUCT TYPE, 2019–2030 (MILLION TONS)
    180. MARKET, BY FORM, 2019–2030 (USD MILLION)
    181. BY FORM, 2019–2030 (MILLION TONS)
    182. BY END-USE INDUSTRY, 2019–2030 (USD MILLION)
    183. MARKET, BY END-USE INDUSTRY, 2019–2030 (MILLION TONS)
    184. IRON ORE MARKET, BY STEEL MANUFACTURING, 2019–2030 (USD MILLION)
    185. POLAND: IRON ORE MARKET, BY STEEL MANUFACTURING, 2019–2030 (MILLION TONS)
    186. MILLION)
    187. (MILLION TONS)
    188. (USD MILLION)
    189. (MILLION TONS)
    190. –2030 (USD MILLION)
    191. INDUSTRY, 2019–2030 (MILLION TONS)
    192. BY STEEL MANUFACTURING, 2019–2030 (USD MILLION)
    193. IRON ORE MARKET, BY STEEL MANUFACTURING, 2019–2030 (MILLION TONS)
    194. REST OF EUROPE: IRON ORE MARKET, BY PRODUCT TYPE, 2019–2030 (USD MILLION)
    195. TONS)
    196. MILLION)
    197. (MILLION TONS)
    198. –2030 (USD MILLION)
    199. END-USE INDUSTRY, 2019–2030 (MILLION TONS)
    200. IRON ORE MARKET, BY STEEL MANUFACTURING, 2019–2030 (USD MILLION)
    201. REST OF EUROPE: IRON ORE MARKET, BY STEEL MANUFACTURING, 2019–2030 (MILLION
    202. TONS)
    203. (USD MILLION)
    204. (MILLION TONS)
    205. (USD MILLION)
    206. (MILLION TONS)
    207. (USD MILLION)
    208. (MILLION TONS)
    209. –2030 (USD MILLION)
    210. INDUSTRY, 2019–2030 (MILLION TONS)
    211. BY STEEL MANUFACTURING, 2019–2030 (USD MILLION)
    212. IRON ORE MARKET, BY STEEL MANUFACTURING, 2019–2030 (MILLION TONS)
    213. CHINA: IRON ORE MARKET, BY PRODUCT TYPE, 2019–2030 (USD MILLION)
    214. CHINA: IRON ORE MARKET, BY PRODUCT TYPE, 2019–2030 (MILLION TONS)
    215. CHINA: IRON ORE MARKET, BY FORM, 2019–2030 (USD MILLION)
    216. CHINA: IRON ORE MARKET, BY FORM, 2019–2030 (MILLION TONS)
    217. IRON ORE MARKET, BY END-USE INDUSTRY, 2019–2030 (USD MILLION)
    218. CHINA: IRON ORE MARKET, BY END-USE INDUSTRY, 2019–2030 (MILLION TONS)
    219. CHINA: IRON ORE MARKET, BY STEEL MANUFACTURING, 2019–2030 (USD MILLION)
    220. TONS)
    221. MILLION)
    222. (MILLION TONS)
    223. MILLION)
    224. TONS)
    225. (USD MILLION)
    226. (MILLION TONS)
    227. (USD MILLION)
    228. (MILLION TONS)
    229. (USD MILLION)
    230. (MILLION TONS)
    231. MILLION)
    232. TONS)
    233. (USD MILLION)
    234. (MILLION TONS)
    235. (USD MILLION)
    236. (MILLION TONS)
    237. TYPE, 2019–2030 (USD MILLION)
    238. IRON ORE MARKET, BY PRODUCT TYPE, 2019–2030 (MILLION TONS)
    239. AUSTRALIA & NEW ZEALAND: IRON ORE MARKET, BY FORM, 2019–2030 (USD MILLION)
    240. (MILLION TONS)
    241. INDUSTRY, 2019–2030 (USD MILLION)
    242. IRON ORE MARKET, BY END-USE INDUSTRY, 2019–2030 (MILLION TONS)
    243. AUSTRALIA & NEW ZEALAND: IRON ORE MARKET, BY STEEL MANUFACTURING, 2019–2030
    244. (USD MILLION)
    245. MANUFACTURING, 2019–2030 (MILLION TONS)
    246. MARKET, BY PRODUCT TYPE, 2019–2030 (USD MILLION)
    247. IRON ORE MARKET, BY PRODUCT TYPE, 2019–2030 (MILLION TONS)
    248. INDONESIA: IRON ORE MARKET, BY FORM, 2019–2030 (USD MILLION)
    249. INDONESIA: IRON ORE MARKET, BY FORM, 2019–2030 (MILLION TONS)
    250. INDONESIA: IRON ORE MARKET, BY END-USE INDUSTRY, 2019–2030 (USD MILLION)
    251. TONS)
    252. (USD MILLION)
    253. –2030 (MILLION TONS)
    254. TYPE, 2019–2030 (USD MILLION)
    255. BY PRODUCT TYPE, 2019–2030 (MILLION TONS)
    256. ORE MARKET, BY FORM, 2019–2030 (USD MILLION)
    257. ORE MARKET, BY FORM, 2019–2030 (MILLION TONS)
    258. IRON ORE MARKET, BY END-USE INDUSTRY, 2019–2030 (USD MILLION)
    259. SOUTH KOREA: IRON ORE MARKET, BY END-USE INDUSTRY, 2019–2030 (MILLION TONS)
    260. (USD MILLION)
    261. –2030 (MILLION TONS)
    262. BY PRODUCT TYPE, 2019–2030 (USD MILLION)
    263. IRON ORE MARKET, BY PRODUCT TYPE, 2019–2030 (MILLION TONS)
    264. REST OF ASIA-PACIFIC: IRON ORE MARKET, BY FORM, 2019–2030 (USD MILLION)
    265. TONS)
    266. –2030 (USD MILLION)
    267. BY END-USE INDUSTRY, 2019–2030 (MILLION TONS)
    268. IRON ORE MARKET, BY STEEL MANUFACTURING, 2019–2030 (USD MILLION)
    269. REST OF ASIA-PACIFIC: IRON ORE MARKET, BY STEEL MANUFACTURING, 2019–2030
    270. (MILLION TONS)
    271. (USD MILLION)
    272. (MILLION TONS)
    273. (USD MILLION)
    274. (MILLION TONS)
    275. (USD MILLION)
    276. (MILLION TONS)
    277. –2030 (USD MILLION)
    278. END-USE INDUSTRY, 2019–2030 (MILLION TONS)
    279. ORE MARKET, BY STEEL MANUFACTURING, 2019–2030 (USD MILLION)
    280. LATIN AMERICA: IRON ORE MARKET, BY STEEL MANUFACTURING, 2019–2030 (MILLION
    281. TONS)
    282. MILLION)
    283. (MILLION TONS)
    284. (USD MILLION)
    285. TONS)
    286. (USD MILLION)
    287. (MILLION TONS)
    288. (USD MILLION)
    289. (MILLION TONS)
    290. (USD MILLION)
    291. (MILLION TONS)
    292. (USD MILLION)
    293. TONS)
    294. (USD MILLION)
    295. (MILLION TONS)
    296. (USD MILLION)
    297. (MILLION TONS)
    298. (USD MILLION)
    299. (MILLION TONS)
    300. (USD MILLION)
    301. (MILLION TONS)
    302. (USD MILLION)
    303. (MILLION TONS)
    304. –2030 (USD MILLION)
    305. MANUFACTURING, 2019–2030 (MILLION TONS)
    306. IRON ORE MARKET, BY PRODUCT TYPE, 2019–2030 (USD MILLION)
    307. OF LATIN AMERICA: IRON ORE MARKET, BY PRODUCT TYPE, 2019–2030 (MILLION TONS)
    308. MILLION)
    309. (MILLION TONS)
    310. INDUSTRY, 2019–2030 (USD MILLION)
    311. ORE MARKET, BY END-USE INDUSTRY, 2019–2030 (MILLION TONS)
    312. OF LATIN AMERICA: IRON ORE MARKET, BY STEEL MANUFACTURING, 2019–2030 (USD
    313. MILLION)
    314. –2030 (MILLION TONS)
    315. MARKET, BY COUNTRY, 2019–2030 (USD MILLION)
    316. AFRICA: IRON ORE MARKET, BY COUNTRY, 2019–2030 (MILLION TONS)
    317. MIDDLE EAST & AFRICA: IRON ORE MARKET, BY PRODUCT TYPE, 2019–2030 (USD
    318. MILLION)
    319. –2030 (MILLION TONS)
    320. MARKET, BY FORM, 2019–2030 (USD MILLION)
    321. AFRICA: IRON ORE MARKET, BY FORM, 2019–2030 (MILLION TONS)
    322. MIDDLE EAST & AFRICA: IRON ORE MARKET, BY END-USE INDUSTRY, 2019–2030
    323. (USD MILLION)
    324. INDUSTRY, 2019–2030 (MILLION TONS)
    325. IRON ORE MARKET, BY STEEL MANUFACTURING, 2019–2030 (USD MILLION)
    326. MIDDLE EAST & AFRICA: IRON ORE MARKET, BY STEEL MANUFACTURING, 2019–2030
    327. (MILLION TONS)
    328. (USD MILLION)
    329. (MILLION TONS)
    330. (USD MILLION)
    331. (MILLION TONS)
    332. –2030 (USD MILLION)
    333. INDUSTRY, 2019–2030 (MILLION TONS)
    334. BY STEEL MANUFACTURING, 2019–2030 (USD MILLION)
    335. IRON ORE MARKET, BY STEEL MANUFACTURING, 2019–2030 (MILLION TONS)
    336. IRAN: IRON ORE MARKET, BY PRODUCT TYPE, 2019–2030 (USD MILLION)
    337. IRAN: IRON ORE MARKET, BY PRODUCT TYPE, 2019–2030 (MILLION TONS)
    338. IRAN: IRON ORE MARKET, BY FORM, 2019–2030 (USD MILLION)
    339. IRAN: IRON ORE MARKET, BY FORM, 2019–2030 (MILLION TONS)
    340. IRON ORE MARKET, BY END-USE INDUSTRY, 2019–2030 (USD MILLION)
    341. IRAN: IRON ORE MARKET, BY END-USE INDUSTRY, 2019–2030 (MILLION TONS)
    342. IRAN: IRON ORE MARKET, BY STEEL MANUFACTURING, 2019–2030 (USD MILLION)
    343. TONS)
    344. MILLION)
    345. (MILLION TONS)
    346. (USD MILLION)
    347. TONS)
    348. (USD MILLION)
    349. (MILLION TONS)
    350. (USD MILLION)
    351. (MILLION TONS)
    352. (USD MILLION)
    353. (MILLION TONS)
    354. (USD MILLION)
    355. TONS)
    356. (USD MILLION)
    357. (MILLION TONS)
    358. (USD MILLION)
    359. (MILLION TONS)
    360. (USD MILLION)
    361. (MILLION TONS)
    362. (USD MILLION)
    363. (MILLION TONS)
    364. –2030 (USD MILLION)
    365. INDUSTRY, 2019–2030 (MILLION TONS)
    366. BY STEEL MANUFACTURING, 2019–2030 (USD MILLION)
    367. IRON ORE MARKET, BY STEEL MANUFACTURING, 2019–2030 (MILLION TONS)
    368. UAE: IRON ORE MARKET, BY PRODUCT TYPE, 2019–2030 (USD MILLION)
    369. UAE: IRON ORE MARKET, BY PRODUCT TYPE, 2019–2030 (MILLION TONS)
    370. UAE: IRON ORE MARKET, BY FORM, 2019–2030 (USD MILLION)
    371. UAE: IRON ORE MARKET, BY FORM, 2019–2030 (MILLION TONS)
    372. IRON ORE MARKET, BY END-USE INDUSTRY, 2019–2030 (USD MILLION)
    373. UAE: IRON ORE MARKET, BY END-USE INDUSTRY, 2019–2030 (MILLION TONS)
    374. UAE: IRON ORE MARKET, BY STEEL MANUFACTURING, 2019–2030 (USD MILLION)
    375. TONS)
    376. TYPE, 2019–2030 (USD MILLION)
    377. AFRICA: IRON ORE MARKET, BY PRODUCT TYPE, 2019–2030 (MILLION TONS)
    378. REST OF THE MIDDLE EAST & AFRICA: IRON ORE MARKET, BY FORM, 2019–2030
    379. (USD MILLION)
    380. BY FORM, 2019–2030 (MILLION TONS)
    381. AFRICA: IRON ORE MARKET, BY END-USE INDUSTRY, 2019–2030 (USD MILLION)
    382. REST OF THE MIDDLE EAST & AFRICA: IRON ORE MARKET, BY END-USE INDUSTRY,
    383. –2030 (MILLION TONS)
    384. IRON ORE MARKET, BY STEEL MANUFACTURING, 2019–2030 (USD MILLION)
    385. REST OF THE MIDDLE EAST & AFRICA: IRON ORE MARKET, BY STEEL MANUFACTURING,
    386. –2030 (MILLION TONS)
    387. OFFERED
    388. ANSTEEL GROUP CORPORATION LIMITED: PRODUCTS OFFERED
    389. PRODUCTS OFFERED
    390. MC LLC: PRODUCTS OFFERED
    391. CLEVELAND-CLIFFS INC.: PRODUCTS OFFERED
    392. KEY DEVELOPMENTS
    393. GROUP: KEY DEVELOPMENTS
    394. EVRAZ PLC: PRODUCTS OFFERED
    395. LIST
    396. OF FIGURES
    397. GLOBAL IRON ORE MARKET, 2020
    398. TYPE
    399. IRON ORE MARKET ANALYSIS BY END-USE INDUSTRY
    400. ANALYSIS BY REGION
    401. RESEARCH PROCESS OF MRFR
    402. COUNTRY-WISE TOP 10 AUTOMOTIVE PRODUCERS, 2020
    403. GROWTH IN MILLIONS
    404. IMPACT ANALYSIS
    405. IRON ORE BENEFICIATION
    406. IRON ORE MARKET
    407. (USD MILLION)
    408. TO 2030 (MILLION TONS)
    409. (USD MILLION)
    410. TONS)
    411. MILLION)
    412. (MILLION TONS)
    413. (USD MILLION)
    414. (MILLION TONS)
    415. (% SHARE)
    416. SHARE)
    417. SHARE)
    418. BENCHMARKING
    419. VALE S.A.: SWOT ANALYSIS
    420. OVERVIEW SNAPSHOT
    421. ANSTEEL GROUP CORPORATION LIMITED: FINANCIAL OVERVIEW SNAPSHOT
    422. ANSTEEL GROUP CORPORATION LIMITED: SWOT ANALYSIS
    423. OVERVIEW SNAPSHOT
    424. MC LLC: FINANCIAL OVERVIEW SNAPSHOT
    425. INC.: SWOT ANALYSIS
    426. AMERICAN PLC: FINANCIAL OVERVIEW SNAPSHOT
    427. ANALYSIS
    428. PLC: SWOT ANALYSIS

    Global Iron Or Market Outlook (Million Tons, USD Billion,2019-2035)

    Global Iron Ore, By Product Type (Million Tons, USD Billion,2019-2035)

    • Hematite
    • Magnetite
    • Limonite
    • Siderite
    • Others

    Global Iron Ore, By Form (Million Tons, USD Billion,2019-2035)

    • Sinter Fines
    • Lumps
    • Pellets
    • Others

    Global Iron Ore, By End-Use Industry (Million Tons, USD Billion,2019-2035)

    • Steel Manufacturing
    • Construction
    • Automotive & Transportation
    • Medical
    • Others
    • Others

    North America Outlook (Million Tons, USD Billion,2019-2035)

    North America Iron Ore, By Product Type (Million Tons, USD Billion,2019-2035)

    • Hematite
    • Magnetite
    • Limonite
    • Siderite
    • Others

    North America Iron Ore, By Form (Million Tons, USD Billion,2019-2035)

    • Sinter Fines
    • Lumps
    • Pellets
    • Others

    North America Iron Ore, By End-Use Industry (Million Tons, USD Billion,2019-2035)

    • Steel Manufacturing
    • Construction
    • Automotive & Transportation
    • Medical
    • Others
    • Others


    US Outlook (Million Tons, USD Billion,2019-2035)

    US Iron Ore, By Product Type (Million Tons, USD Billion,2019-2035)

    • Hematite
    • Magnetite
    • Limonite
    • Siderite
    • Others


    US Iron Ore, By Form (Million Tons, USD Billion,2019-2035)

    • Sinter Fines
    • Lumps
    • Pellets
    • Others

    US Iron Ore, By End-Use Industry (Million Tons, USD Billion,2019-2035)

    • Steel Manufacturing
    • Construction
    • Automotive & Transportation
    • Medical
    • Others
    • Others


    Canada Outlook (Million Tons, USD Billion,2019-2035)


    Canada Iron Ore, By Product Type (Million Tons, USD Billion,2019-2035)

    • Hematite
    • Magnetite
    • Limonite
    • Siderite
    • Others


    Canada Iron Ore, By Form (Million Tons, USD Billion,2019-2035)

    • Sinter Fines
    • Lumps
    • Pellets
    • Others


    Canada Iron Ore, By End-Use Industry (Million Tons, USD Billion,2019-2035)

    • Steel Manufacturing
    • Construction
    • Automotive & Transportation
    • Medical
    • Others
    • Others


    Europe Outlook (Million Tons, USD Billion,2019-2035)


    Europe Iron Ore, By Product Type (Million Tons, USD Billion,2019-2035)

    • Hematite
    • Magnetite
    • Limonite
    • Siderite
    • Others


    Europe Iron Ore, By Form (Million Tons, USD Billion,2019-2035)

    • Sinter Fines
    • Lumps
    • Pellets
    • Others


    Europe Iron Ore, By End-Use Industry (Million Tons, USD Billion,2019-2035)

    • Steel Manufacturing
    • Construction
    • Automotive & Transportation
    • Medical
    • Others
    • Others


    Germany Outlook (Million Tons, USD Billion,2019-2035)


    Germany Iron Ore, By Product Type (Million Tons, USD Billion,2019-2035)

    • Hematite
    • Magnetite
    • Limonite
    • Siderite
    • Others


    Germany Iron Ore, By Form (Million Tons, USD Billion,2019-2035)

    • Sinter Fines
    • Lumps
    • Pellets
    • Others


    Germany Iron Ore, By End-Use Industry (Million Tons, USD Billion,2019-2035)

    • Steel Manufacturing
    • Construction
    • Automotive & Transportation
    • Medical
    • Others
    • Others


    UK Outlook (Million Tons, USD Billion,2019-2035)


    UK Iron Ore, By Product Type (Million Tons, USD Billion,2019-2035)

    • Hematite
    • Magnetite
    • Limonite
    • Siderite
    • Others


    UK Iron Ore, By Form (Million Tons, USD Billion,2019-2035)

    • Sinter Fines
    • Lumps
    • Pellets
    • Others


    UK Iron Ore, By End-Use Industry (Million Tons, USD Billion,2019-2035)

    • Steel Manufacturing
    • Construction
    • Automotive & Transportation
    • Medical
    • Others
    • Others


    France Outlook (Million Tons, USD Billion,2019-2035)


    France Iron Ore, By Product Type (Million Tons, USD Billion,2019-2035)

    • Hematite
    • Magnetite
    • Limonite
    • Siderite
    • Others


    France Iron Ore, By Form (Million Tons, USD Billion,2019-2035)

    • Sinter Fines
    • Lumps
    • Pellets
    • Others


    France Iron Ore, By End-Use Industry (Million Tons, USD Billion,2019-2035)

    • Steel Manufacturing
    • Construction
    • Automotive & Transportation
    • Medical
    • Others
    • Others


    Spain Outlook (Million Tons, USD Billion,2019-2035)


    Spain Iron Ore, By Product Type (Million Tons, USD Billion,2019-2035)

    • Hematite
    • Magnetite
    • Limonite
    • Siderite
    • Others


    Spain Iron Ore, By Form (Million Tons, USD Billion,2019-2035)

    • Sinter Fines
    • Lumps
    • Pellets
    • Others


    Spain Iron Ore, By End-Use Industry (Million Tons, USD Billion,2019-2035)

    • Steel Manufacturing
    • Construction
    • Automotive & Transportation
    • Medical
    • Others
    • Others


    Italy Outlook (Million Tons, USD Billion,2019-2035)


    Italy Iron Ore, By Product Type (Million Tons, USD Billion,2019-2035)

    • Hematite
    • Magnetite
    • Limonite
    • Siderite
    • Others


    Italy Iron Ore, By Form (Million Tons, USD Billion,2019-2035)

    • Sinter Fines
    • Lumps
    • Pellets
    • Others


    Italy Iron Ore, By End-Use Industry (Million Tons, USD Billion,2019-2035)

    • Steel Manufacturing
    • Construction
    • Automotive & Transportation
    • Medical
    • Others
    • Others


    Russia Outlook (Million Tons, USD Billion,2019-2035)


    Russia Iron Ore, By Product Type (Million Tons, USD Billion,2019-2035)

    • Hematite
    • Magnetite
    • Limonite
    • Siderite
    • Others


    Russia Iron Ore, By Form (Million Tons, USD Billion,2019-2035)

    • Sinter Fines
    • Lumps
    • Pellets
    • Others


    Russia Iron Ore, By End-Use Industry (Million Tons, USD Billion,2019-2035)

    • Steel Manufacturing
    • Construction
    • Automotive & Transportation
    • Medical
    • Others
    • Others


    Belgium Outlook (Million Tons, USD Billion,2019-2035)


    Belgium Iron Ore, By Product Type (Million Tons, USD Billion,2019-2035)

    • Hematite
    • Magnetite
    • Limonite
    • Siderite
    • Others


    Belgium Iron Ore, By Form (Million Tons, USD Billion,2019-2035)

    • Sinter Fines
    • Lumps
    • Pellets
    • Others


    Belgium Iron Ore, By End-Use Industry (Million Tons, USD Billion,2019-2035)

    • Steel Manufacturing
    • Construction
    • Automotive & Transportation
    • Medical
    • Others
    • Others


    Poland Outlook (Million Tons, USD Billion,2019-2035)


    Poland Iron Ore, By Product Type (Million Tons, USD Billion,2019-2035)

    • Hematite
    • Magnetite
    • Limonite
    • Siderite
    • Others


    Poland Iron Ore, By Form (Million Tons, USD Billion,2019-2035)

    • Sinter Fines
    • Lumps
    • Pellets
    • Others


    Poland Iron Ore, By End-Use Industry (Million Tons, USD Billion,2019-2035)

    • Steel Manufacturing
    • Construction
    • Automotive & Transportation
    • Medical
    • Others
    • Others


    Netherlands Outlook (Million Tons, USD Billion,2019-2035)


    Netherlands Iron Ore, By Product Type (Million Tons, USD Billion,2019-2035)

    • Hematite
    • Magnetite
    • Limonite
    • Siderite
    • Others


    Netherlands Iron Ore, By Form (Million Tons, USD Billion,2019-2035)

    • Sinter Fines
    • Lumps
    • Pellets
    • Others


    Netherlands Iron Ore, By End-Use Industry (Million Tons, USD Billion,2019-2035)

    • Steel Manufacturing
    • Construction
    • Automotive & Transportation
    • Medical
    • Others
    • Others


    Rest of Europe Outlook (Million Tons, USD Billion,2019-2035)


    Rest of Europe Iron Ore, By Product Type (Million Tons, USD Billion,2019-2035)

    • Hematite
    • Magnetite
    • Limonite
    • Siderite
    • Others


    Rest of Europe Iron Ore, By Form (Million Tons, USD Billion,2019-2035)

    • Sinter Fines
    • Lumps
    • Pellets
    • Others


    Rest of Europe Iron Ore, By End-Use Industry (Million Tons, USD Billion,2019-2035)

    • Steel Manufacturing
    • Construction
    • Automotive & Transportation
    • Medical
    • Others
    • Others


    Asia-Pacific Outlook (Million Tons, USD Billion,2019-2035)


    Asia-Pacific Iron Ore, By Product Type (Million Tons, USD Billion,2019-2035)

    • Hematite
    • Magnetite
    • Limonite
    • Siderite
    • Others


    Asia-Pacific Iron Ore, By Form (Million Tons, USD Billion,2019-2035)

    • Sinter Fines
    • Lumps
    • Pellets
    • Others


    Asia-Pacific Iron Ore, By End-Use Industry (Million Tons, USD Billion,2019-2035)

    • Steel Manufacturing
    • Construction
    • Automotive & Transportation
    • Medical
    • Others
    • Others


    China Outlook (Million Tons, USD Billion,2019-2035)


    China Iron Ore, By Product Type (Million Tons, USD Billion,2019-2035)

    • Hematite
    • Magnetite
    • Limonite
    • Siderite
    • Others


    China Iron Ore, By Form (Million Tons, USD Billion,2019-2035)

    • Sinter Fines
    • Lumps
    • Pellets
    • Others


    China Iron Ore, By End-Use Industry (Million Tons, USD Billion,2019-2035)

    • Steel Manufacturing
    • Construction
    • Automotive & Transportation
    • Medical
    • Others
    • Others


    Japan Outlook (Million Tons, USD Billion,2019-2035)


    Japan Iron Ore, By Product Type (Million Tons, USD Billion,2019-2035)

    • Hematite
    • Magnetite
    • Limonite
    • Siderite
    • Others


    Japan Iron Ore, By Form (Million Tons, USD Billion,2019-2035)

    • Sinter Fines
    • Lumps
    • Pellets
    • Others


    Japan Iron Ore, By End-Use Industry (Million Tons, USD Billion,2019-2035)

    • Steel Manufacturing
    • Construction
    • Automotive & Transportation
    • Medical
    • Others
    • Others


    India Outlook (Million Tons, USD Billion,2019-2035)


    India Iron Ore, By Product Type (Million Tons, USD Billion,2019-2035)

    • Hematite
    • Magnetite
    • Limonite
    • Siderite
    • Others


    India Iron Ore, By Form (Million Tons, USD Billion,2019-2035)

    • Sinter Fines
    • Lumps
    • Pellets
    • Others


    India Iron Ore, By End-Use Industry (Million Tons, USD Billion,2019-2035)

    • Steel Manufacturing
    • Construction
    • Automotive & Transportation
    • Medical
    • Others
    • Others


    Australia & New Zealand Outlook (Million Tons, USD Billion,2019-2035)


    Australia & New Zealand Iron Ore, By Product Type (Million Tons, USD Billion,2019-2035)

    • Hematite
    • Magnetite
    • Limonite
    • Siderite
    • Others


    Australia & New Zealand Iron Ore, By Form (Million Tons, USD Billion,2019-2035)

    • Sinter Fines
    • Lumps
    • Pellets
    • Others


    Australia & New Zealand Iron Ore, By End-Use Industry (Million Tons, USD Billion,2019-2035)

    • Steel Manufacturing
    • Construction
    • Automotive & Transportation
    • Medical
    • Others
    • Others


    Indonesia Outlook (Million Tons, USD Billion,2019-2035)


    Indonesia Iron Ore, By Product Type (Million Tons, USD Billion,2019-2035)

    • Hematite
    • Magnetite
    • Limonite
    • Siderite
    • Others


    Indonesia Iron Ore, By Form (Million Tons, USD Billion,2019-2035)

    • Sinter Fines
    • Lumps
    • Pellets
    • Others


    Indonesia Iron Ore, By End-Use Industry (Million Tons, USD Billion,2019-2035)

    • Steel Manufacturing
    • Construction
    • Automotive & Transportation
    • Medical
    • Others
    • Others


    South Korea Outlook (Million Tons, USD Billion,2019-2035)


    South Korea Iron Ore, By Product Type (Million Tons, USD Billion,2019-2035)

    • Hematite
    • Magnetite
    • Limonite
    • Siderite
    • Others


    South Korea Iron Ore, By Form (Million Tons, USD Billion,2019-2035)

    • Sinter Fines
    • Lumps
    • Pellets
    • Others


    South Korea Iron Ore, By End-Use Industry (Million Tons, USD Billion,2019-2035)

    • Steel Manufacturing
    • Construction
    • Automotive & Transportation
    • Medical
    • Others
    • Others


    Rest of Asia-Pacific Outlook (Million Tons, USD Billion,2019-2035)


    Rest of Asia-Pacific Iron Ore, By Product Type (Million Tons, USD Billion,2019-2035)

    • Hematite
    • Magnetite
    • Limonite
    • Siderite
    • Others


    Rest of Asia-Pacific Iron Ore, By Form (Million Tons, USD Billion,2019-2035)

    • Sinter Fines
    • Lumps
    • Pellets
    • Others


    Rest of Asia-Pacific Iron Ore, By End-Use Industry (Million Tons, USD Billion,2019-2035)

    • Steel Manufacturing
    • Construction
    • Automotive & Transportation
    • Medical
    • Others
    • Others


    Latin America Outlook (Million Tons, USD Billion,2019-2035)


    Latin America Iron Ore, By Product Type (Million Tons, USD Billion,2019-2035)

    • Hematite
    • Magnetite
    • Limonite
    • Siderite
    • Others


    Latin America Iron Ore, By Form (Million Tons, USD Billion,2019-2035)

    • Sinter Fines
    • Lumps
    • Pellets
    • Others


    Latin America Iron Ore, By End-Use Industry (Million Tons, USD Billion,2019-2035)

    • Steel Manufacturing
    • Construction
    • Automotive & Transportation
    • Medical
    • Others
    • Others


    Brazil Outlook (Million Tons, USD Billion,2019-2035)


    Brazil Iron Ore, By Product Type (Million Tons, USD Billion,2019-2035)

    • Hematite
    • Magnetite
    • Limonite
    • Siderite
    • Others


    Brazil Iron Ore, By Form (Million Tons, USD Billion,2019-2035)

    • Sinter Fines
    • Lumps
    • Pellets
    • Others


    Brazil Iron Ore, By End-Use Industry (Million Tons, USD Billion,2019-2035)

    • Steel Manufacturing
    • Construction
    • Automotive & Transportation
    • Medical
    • Others
    • Others


    Mexico Outlook (Million Tons, USD Billion,2019-2035)


    Mexico Iron Ore, By Product Type (Million Tons, USD Billion,2019-2035)

    • Hematite
    • Magnetite
    • Limonite
    • Siderite
    • Others


    Mexico Iron Ore, By Form (Million Tons, USD Billion,2019-2035)

    • Sinter Fines
    • Lumps
    • Pellets
    • Others


    Mexico Iron Ore, By End-Use Industry (Million Tons, USD Billion,2019-2035)

    • Steel Manufacturing
    • Construction
    • Automotive & Transportation
    • Medical
    • Others
    • Others


    Argentina Outlook (Million Tons, USD Billion,2019-2035)


    Argentina Iron Ore, By Product Type (Million Tons, USD Billion,2019-2035)

    • Hematite
    • Magnetite
    • Limonite
    • Siderite
    • Others


    Argentina Iron Ore, By Form (Million Tons, USD Billion,2019-2035)

    • Sinter Fines
    • Lumps
    • Pellets
    • Others


    Argentina Iron Ore, By End-Use Industry (Million Tons, USD Billion,2019-2035)

    • Steel Manufacturing
    • Construction
    • Automotive & Transportation
    • Medical
    • Others
    • Others


    Rest of Latin America Outlook (Million Tons, USD Billion,2019-2035)


    Rest of Latin America Iron Ore, By Product Type (Million Tons, USD Billion,2019-2035)

    • Hematite
    • Magnetite
    • Limonite
    • Siderite
    • Others


    Rest of Latin America Iron Ore, By Form (Million Tons, USD Billion,2019-2035)

    • Sinter Fines
    • Lumps
    • Pellets
    • Others


    Rest of Latin America Iron Ore, By End-Use Industry (Million Tons, USD Billion,2019-2035)

    • Steel Manufacturing
    • Construction
    • Automotive & Transportation
    • Medical
    • Others
    • Others


    Middle East & Africa Outlook (Million Tons, USD Billion,2019-2035)


    Middle East & Africa Iron Ore, By Product Type (Million Tons, USD Billion,2019-2035)

    • Hematite
    • Magnetite
    • Limonite
    • Siderite
    • Others


    Middle East & Africa Iron Ore, By Form (Million Tons, USD Billion,2019-2035)

    • Sinter Fines
    • Lumps
    • Pellets
    • Others


    Middle East & Africa Iron Ore, By End-Use Industry (Million Tons, USD Billion,2019-2035)

    • Steel Manufacturing
    • Construction
    • Automotive & Transportation
    • Medical
    • Others
    • Others


    Saudi Arabia Outlook (Million Tons, USD Billion,2019-2035)


    Saudi Arabia Iron Ore, By Product Type (Million Tons, USD Billion,2019-2035)

    • Hematite
    • Magnetite
    • Limonite
    • Siderite
    • Others


    Saudi Arabia Iron Ore, By Form (Million Tons, USD Billion,2019-2035)

    • Sinter Fines
    • Lumps
    • Pellets
    • Others


    Saudi Arabia Iron Ore, By End-Use Industry (Million Tons, USD Billion,2019-2035)

    • Steel Manufacturing
    • Construction
    • Automotive & Transportation
    • Medical
    • Others
    • Others


    Iran Outlook (Million Tons, USD Billion,2019-2035)


    Iran Iron Ore, By Product Type (Million Tons, USD Billion,2019-2035)

    • Hematite
    • Magnetite
    • Limonite
    • Siderite
    • Others


    Iran Iron Ore, By Form (Million Tons, USD Billion,2019-2035)

    • Sinter Fines
    • Lumps
    • Pellets
    • Others


    Iran Iron Ore, By End-Use Industry (Million Tons, USD Billion,2019-2035)

    • Steel Manufacturing
    • Construction
    • Automotive & Transportation
    • Medical
    • Others
    • Others


    Israel Iron Ore, By Product Type (Million Tons, USD Billion,2019-2035)

    • Hematite
    • Magnetite
    • Limonite
    • Siderite
    • Others


    Israel Iron Ore, By Form (Million Tons, USD Billion,2019-2035)

    • Sinter Fines
    • Lumps
    • Pellets
    • Others


    Israel Iron Ore, By End-Use Industry (Million Tons, USD Billion,2019-2035)

    • Steel Manufacturing
    • Construction
    • Automotive & Transportation
    • Medical
    • Others
    • Others


    Turkey Outlook (Million Tons, USD Billion,2019-2035)


    Turkey Iron Ore, By Product Type (Million Tons, USD Billion,2019-2035)

    • Hematite
    • Magnetite
    • Limonite
    • Siderite
    • Others


    Turkey Iron Ore, By Form (Million Tons, USD Billion,2019-2035)

    • Sinter Fines
    • Lumps
    • Pellets
    • Others


    Turkey Iron Ore, By End-Use Industry (Million Tons, USD Billion,2019-2035)

    • Steel Manufacturing
    • Construction
    • Automotive & Transportation
    • Medical
    • Others
    • Others


    South Africa Outlook (Million Tons, USD Billion,2019-2035)


    South Africa Iron Ore, By Product Type (Million Tons, USD Billion,2019-2035)

    • Hematite
    • Magnetite
    • Limonite
    • Siderite
    • Others


    South Africa Iron Ore, By Form (Million Tons, USD Billion,2019-2035)

    • Sinter Fines
    • Lumps
    • Pellets
    • Others


    South Africa Iron Ore, By End-Use Industry (Million Tons, USD Billion,2019-2035)

    • Steel Manufacturing
    • Construction
    • Automotive & Transportation
    • Medical
    • Others
    • Others


    UAE Outlook (Million Tons, USD Billion,2019-2035)


    UAE Iron Ore, By Product Type (Million Tons, USD Billion,2019-2035)

    • Hematite
    • Magnetite
    • Limonite
    • Siderite
    • Others


    UAE Iron Ore, By Form (Million Tons, USD Billion,2019-2035)

    • Sinter Fines
    • Lumps
    • Pellets
    • Others


    UAE Iron Ore, By End-Use Industry (Million Tons, USD Billion,2019-2035)

    • Steel Manufacturing
    • Construction
    • Automotive & Transportation
    • Medical
    • Others
    • Others


    Rest of Middle East & Africa Outlook (Million Tons, USD Billion,2019-2035)


    Rest of Middle East & Africa Iron Ore, By Product Type (Million Tons, USD Billion,2019-2035)

    • Hematite
    • Magnetite
    • Limonite
    • Siderite
    • Others


    Rest of Middle East & Africa Iron Ore, By Form (Million Tons, USD Billion,2019-2035)

    • Sinter Fines
    • Lumps
    • Pellets
    • Others


    Rest of Middle East & Africa Iron Ore, By End-Use Industry (Million Tons, USD Billion,2019-2035)

    • Steel Manufacturing
    • Construction
    • Automotive & Transportation
    • Medical
    • Others
    • Others
    Iron Ore Market Research Report – Forecast Till 2035 Infographic
    Free Sample Request

    Kindly complete the form below to receive a free sample of this Report

    Customer Strories

    “I am very pleased with how market segments have been defined in a relevant way for my purposes (such as "Portable Freezers & refrigerators" and "last-mile"). In general the report is well structured. Thanks very much for your efforts.”

    Victoria Milne Founder
    Case Study

    Chemicals and Materials