Immersive Analytics Market Share
Immersive Analytics Market Research Report: Information By Offering (Hardware, Solution And Services), By Application (Education & Training, Sales & Marketing, Design & Visualization, Strategy Planning and Other Applications), By End-Use Industry (Healthcare, Media & Entertainment, Automotive & Transportation, Construction, Government & Defense, And Other End Use Industr...

Market Summary
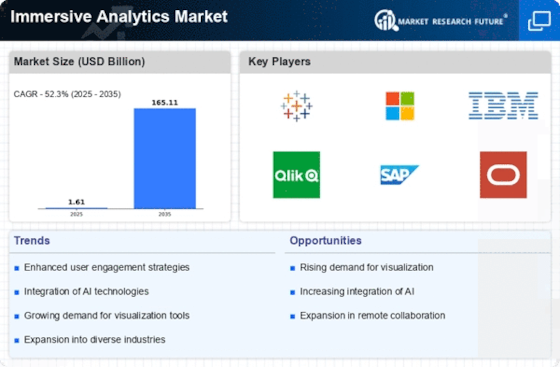
As per Market Research Future Analysis, the Immersive Analytics Market is projected to grow from USD 2.45 billion in 2025 to USD 165.11 billion by 2035, with a compound annual growth rate (CAGR) of 52.30% during the forecast period. The market was valued at USD 1.61 billion in 2024, driven by the increasing complexity of data and the need for advanced data visualization techniques. Immersive analytics utilizes VR and AR technologies to enhance data exploration and decision-making, particularly in sectors like healthcare and finance.
Key Market Trends & Highlights
Key trends driving the Immersive Analytics Market include rising data complexity and the demand for innovative visualization solutions.
- Market Size in 2024: USD 1.61 billion
- CAGR from 2025 to 2035: 52.30%
- Healthcare segment dominated the market in 2022
Market Size & Forecast
2024 Market Size | USD 1.61 billion |
2035 Market Size | USD 165.11 billion |
CAGR | 52.30% |
Major Players
Key players include Microsoft Corporation, IBM Corporation, Accenture PLC, Google LLC (Alphabet Inc.), SAP SE, Meta Platforms, Inc., HTC Corporation, HP Inc., Tibco Software, Inc., and Magic Leap, Inc.
Market Trends
Increasing data complexity is driving the market growth
Immersive analytics, which makes use of tools like virtual reality (VR) and augmented reality (AR), is particularly positioned to take on the challenges posed by this data landscape, opening up new possibilities for data exploration and reasoned decision-making.
Additionally, the need for more sophisticated and understandable data visualization approaches is driven by the complexity of data that is rising. When dealing with large datasets or data that spans multiple dimensions, traditional 2D charts and graphs can quickly overload. By creating immersive 3D data environments, immersive analytics offers a solution by allowing users to see and interact with complex data in previously unthinkable ways.
Users can immerse themselves in their data within these immersive environments and examine it from a variety of perspectives. For instance, financial experts may use VR headsets to navigate a three-dimensional representation of market data, more easily seeing trends and anomalies than they could on a flat screen. To gain a greater understanding of medical issues, healthcare workers can use augmented reality to superimpose patient data onto a 3D model of the human body. It is now possible to discover insights inside complex datasets that could otherwise remain hidden thanks to this intuitive and interactive method to data analysis.
Additionally, as data complexity develops, there is a greater need for data-driven decision-making that is skilled and efficient. In order to meet this need, immersive analytics is crucial since it helps users understand data more quickly. Users can interact with data in real-time, magnify specific data points, remove irrelevant data, and discover patterns more quickly and precisely in immersive environments. Faster decision-making is especially important in sectors where timely information might give competitive benefits, including finance and manufacturing. Thus, driving the Web3 in E-Commerce & Retail market revenue.
The integration of immersive analytics technologies into various sectors is poised to enhance decision-making processes and foster innovative solutions, reflecting a growing recognition of their potential benefits.
U.S. Department of Commerce
Immersive Analytics Market Market Drivers
Rising Demand for Data Visualization
The Global Immersive Analytics Market Industry experiences a surge in demand for advanced data visualization tools. Organizations increasingly seek to transform complex data sets into intuitive visual formats, enabling better decision-making. As of 2024, the market is valued at 1.27 USD Billion, reflecting a growing recognition of the importance of data interpretation in various sectors. Industries such as healthcare and finance are particularly focused on leveraging immersive analytics to enhance operational efficiency and customer engagement. This trend indicates a broader shift towards data-driven strategies, which could potentially contribute to the market's expansion.
Market Segment Insights
Immersive Analytics Offering Insights
The immersive analytics market segmentation, based on offering includes hardware, solution and services. The solution segment dominated the market in the immersive analytics market. This is because businesses and organizations are starting to see the importance of immersive analytics for data-driven decision-making. Furthermore, the development of immersive analytics software is being accelerated by the hardware for VR and AR becoming more widely available, powerful, and affordable. As a result, this encourages the development of sophisticated and user-centered immersive analytics systems.
Figure 2: Immersive analytics Market, by Distribution channel, 2022 & 2032 (USD Billion)
Source: Secondary Research, Primary Research, Market Research Future Database and Analyst Review
Immersive analytics Application Insights
The immersive analytics market segmentation, based on application, includes education & training, sales & marketing, design & visualization, strategy planning and other applications. The design & visualization segment held considerable market share in the immersive analytics market. Designers who work with data that is progressively becoming more complicated and dimensional include architects, product designers, and engineers. Immersive analytics provides a practical solution for visualizing and interacting with this complex data, elevating the design procedure.
It enables users to interact with 3D models, prototypes, and simulations in a more intuitive and immersive way, which eventually leads to improved accuracy and innovation during the design phase.
Immersive analytics Industry Vertical Insights
The immersive analytics market segmentation, based on industry vertical, includes healthcare, media & entertainment, automotive & transportation, construction, government & defense, and other end use industries. The healthcare segment dominated the market in 2022. Immersive technologies have great potential, especially for increasing innovation in precision medicine, according to some study in the medical and therapeutic domains. The research community is becoming more interested in using immersive technology in the processing of genetic data. Incorporating immersive technologies to produce more understandable human-computer interactions that improve the quality of perception and engagement is the goal of genomic data analytics research.
Virtual reality (VR) and other immersive technologies have the power to make the virtual environment seem incredibly real to users, improving learning outcomes with lower performance errors and higher accuracy.
Get more detailed insights about Immersive Analytics Market Research Report – Forecast till 2034
Regional Insights
By region, the study provides the market insights into North America, Europe, Asia-Pacific and Rest of the World. The North America immersive analytics market dominated this market in 2022 (45.80%). This is due to the region's cutting-edge technological infrastructure and strong tech environment. Additionally, this region's thriving financial services sector is implementing immersive analytics to gain a competitive edge. Further, the U.S. immersive analytics market held the largest market share, and the Canada immersive analytics market was the fastest growing market in the North America region.
Further, the major countries studied in the market report are The U.S., Canada, German, France, the UK, Italy, Spain, China, Japan, India, Australia, South Korea, and Brazil.
Figure 3: IMMERSIVE ANALYTICS MARKET SHARE BY REGION 2022 (USD Billion)
Source: Secondary Research, Primary Research, Market Research Future Database and Analyst Review
Europe immersive analytics market accounts for the second-largest market share. This is because data security and privacy are becoming more important in the area. Further, the German immersive analytics market held the largest market share and the UK immersive analytics market was the fastest growing market in the European region
The Asia-Pacific immersive analytics Market is expected to grow at the fastest CAGR from 2023 to 2032. This is due to the region's quick economic growth, digital transformation, and growing use of cutting-edge technology across a range of business verticals. Moreover, China’s immersive analytics market held the largest market share, and the Indian immersive analytics market was the fastest growing market in the Asia-Pacific region.
Key Players and Competitive Insights
Leading market players are investing heavily in research and development in order to expand their product lines, which will help the Immersive analytics market, grow even more. Market participants are also undertaking a variety of strategic activities to expand their footprint, with important market developments including new product launches, contractual agreements, mergers and acquisitions, higher investments, and collaboration with other organizations. To expand and survive in a more competitive and rising market climate, immersive analytics industry must offer cost-effective items.
Manufacturing locally to minimize operational costs is one of the key business tactics used by manufacturers in the immersive analytics industry to benefit clients and increase the market sector. In recent years, the immersive analytics industry has offered some of the most significant advantages to medicine. Major players in the immersive analytics market, including Microsoft Corporation, IBM Corporation, Accenture PLC, Google LLC (Alphabet Inc.), SAP SE, Meta Platforms, Inc., HTC Corporation, HP, Inc., Tibco Software, Inc. (Vista Equity Partners), Magic Leap, Inc. and others, are attempting to increase market demand by investing in research and development operations.
Enterprise application software and related services are offered by SAP SE, also referred to as SAP. Enterprise resource planning, intelligent technologies, financial management, analytics, people engagement, human resources, digital supply chain, spend management, network, customer relationship management, and customer experience are just a few of the many solutions the company provides. SAP focuses in providing enterprise applications and commercial software designed for analytics, mobile platforms, cloud computing, database management, and technology operations.
Energy and utilities, consumer goods, financial services, transportation and logistics, aerospace and defense, chemicals, healthcare, retail, government, higher education and research, real estate, media, and telecommunications are just a few of the numerous industries represented by its customers. With business activities throughout the Middle East, Africa, Europe, the Americas, and the Asia-Pacific area, SAP maintains a presence. Its headquarters are in Baden-Wurttemberg, Germany.
One of the most well-known professional services companies in the world, Accenture is renowned for its dedication to supporting top corporations, governments, and other organizations in strengthening their digital infrastructure, accelerating revenue development, streamlining operations, and improving public services. The company's operations are firmly focused on producing significant, measurable benefits on a broad scale. Accenture is well-known for its extraordinary talent pool and creative approach. With a workforce of 732,000 people serving clients in more than 120 countries, Accenture is a leader.
Accenture uses its large ecosystem of contacts to drive revolutionary change in the fast changing technological landscape of today. The unique value proposition of the company combines technological know-how with unrivalled industry knowledge, specialized capabilities, and a capacity for worldwide delivery. Accenture's track record of achieving real-world results, made possible by its wide array of services, solutions, and assets across Strategy & Consulting, Operations, Technology, Industry X, and Accenture Song, further solidifies the company's reputation.
Key Companies in the Immersive Analytics Market market include


Industry Developments
March 2023: With the introduction of immersive, intelligent, and immediate analytics capabilities, TIBCO introduced a number of updates to their analytics package. These improvements enable consumers to take well-informed decisions and benefit from speedier, smarter insights. The revolutionary updates to TIBCO Spotfire® and other scalable analytics solutions close the gap between learning and acting, accelerating decision-making and lowering operational costs.
April 2022: ListenFirst unveiled ListenFirst University, an intensive social analytics training program. With this introduction, new ListenFirst platform users have an expedited opportunity to improve their social analytics abilities, helping them to find relevant information more quickly. As a result, the return on investment for marketing expenditures is improved.
Future Outlook
Immersive Analytics Market Future Outlook
The Immersive Analytics Market is projected to grow at a remarkable 52.30% CAGR from 2025 to 2035, driven by advancements in data visualization and increasing demand for immersive experiences.
New opportunities lie in:
- Develop AI-driven analytics tools for real-time data interpretation.
- Create industry-specific immersive solutions to enhance decision-making processes.
- Leverage partnerships with tech firms to integrate AR/VR capabilities into analytics platforms.
By 2035, the Immersive Analytics Market is expected to be a pivotal force in data-driven decision-making.
Market Segmentation
Immersive Analytics Offering Outlook
- Hardware
- Solution
- Services
Immersive analytics Regional Outlook
- U.S.
- Canada
Immersive Analytics Application Outlook
- Education & Training
- Sales & Marketing
- Design & Visualization
- Strategy Planning
- Other Applications
Immersive Analytics End-Use Industry Outlook
- Healthcare
- Media & Entertainment
- Automotive & Transportation
- Construction
- Government & Defense
- Other End Use Industries
Report Scope
Report Attribute/Metric | Details |
Market Size 2024 | 1.61 (USD Billion) |
Market Size 2025 | 2.45 (USD Billion) |
Market Size 2035 | 165.11 (USD Billion) |
Compound Annual Growth Rate (CAGR) | 52.30% (2025 - 2035) |
Report Coverage | Revenue Forecast, Competitive Landscape, Growth Factors, and Trends |
Base Year | 2024 |
Market Forecast Period | 2025 - 2035 |
Historical Data | 2019 - 2023 |
Market Forecast Units | USD Billion |
Segments Covered | Offering, Application, End Use Industry and Region |
Geographies Covered | North America, Europe, Asia Pacific, and the Rest of the World |
Countries Covered | The U.S., Canada, German, France, UK, Italy, Spain, China, Japan, India, Australia, South Korea, and Brazil |
Key Companies Profiled | Microsoft Corporation, IBM Corporation, Accenture PLC, Google LLC (Alphabet Inc.), SAP SE, Meta Platforms, Inc., HTC Corporation, HP, Inc., Tibco Software, Inc. (Vista Equity Partners), and Magic Leap, Inc.. |
Key Market Opportunities | Increasing emphasis on remote work and collaboration |
Key Market Dynamics | Increasing complexity of data across industries |
Market Highlights
Author
Latest Comments
This is a great article! Really helped me understand the topic better.
Thanks for sharing this. I’ve bookmarked it for later reference.
FAQs
How much is the Immersive analytics market?
The Immersive analytics market size was valued at USD 1.61 Billion in 2024.
What is the growth rate of the Immersive analytics market?
The market is projected to grow at a CAGR of 52.30% during the forecast period, 2025-2034.
Which region held the largest market share in the Immersive analytics market?
North America had the largest share in the market
Who are the key players in the Immersive analytics market?
The key players in the market are Google (US), IBM (US), Microsoft (US), AWS (US), NVIDIA (US), Intel (US), Qualcomm (US), Arm (UK), AMD (US), MediaTek (Taiwan), Oracle (US), Salesforce (US), NXP (Netherlands), Lattice (Oregon), Octonion (Switzerland), NeuroPace (US), Siemens (Germany), HPE (US), LUIS Technology (Germany), Code Time Technologies (Canada), HiSilicon (China), and SiMa.ai (US).
Which offering led the Immersive analytics market?
The software category dominated the market in 2022.
Which data type had the largest market share in the Immersive analytics market?
The numeric data type had the largest share in the market.
-
Table of Contents
-
Executive Summary
-
Market Introduction
- Definition
-
Scope of the Study
- Research Objective
- Assumptions
- Limitations
-
Research Methodology
- Overview
- Data Mining
- Secondary Research
-
Primary Research
- Primary Interviews and Information Gathering Process
- Breakdown of Primary Respondents
- Forecasting Modality
-
Market Size Estimation
- Bottom-up Approach
- Top-Down Approach
- Data Triangulation
- Validation
-
MARKET DYNAMICS
- Overview
- Drivers
- Restraints
- Opportunities
-
MARKET FACTOR ANALYSIS
- Value Chain Analysis
-
Porter’s Five Forces Analysis
- Bargaining Power of Suppliers
- Bargaining Power of Buyers
- Threat of New Entrants
- Threat of Substitutes
- Intensity of Rivalry
-
COVID-19 Impact Analysis
- Market Impact Analysis
- Regional Impact
- Opportunity and Threat Analysis
-
GLOBAL IMMERSIVE ANALYTICS, BY OFFERING
- Overview
- Hardware
- Solutions
- Services
-
GLOBAL IMMERSIVE ANALYTICS, BY VERTICAL
- Overview
- Healthcare
- Media & Entertainment
- Automotive & Transportation
- Construction
- Government & Defense
- Other End Use Industries
-
GLOBAL IMMERSIVE ANALYTICS, BY APPLICATION
- Overview
- Education & Training
- Sales & Marketing
- Design & Visualization
- Strategy Planning
- Other Applications
-
GLOBAL IMMERSIVE ANALYTICS, BY REGION
- Overview
-
North America
- U.S.
- Canada
-
Europe
- Germany
- France
- U.K
- Italy
- Spain
- Rest of Europe
-
Asia-Pacific
- China
- India
- Japan
- South Korea
- Australia
- Rest of Asia-Pacific
-
Rest of the World
- Middle East
- Africa
- Latin America
-
Competitive Landscape
- Overview
- Competitive Analysis
- Market Share Analysis
- Major Growth Strategy in the Global Immersive analytics,
- Competitive Benchmarking
- Leading Players in Terms of Number of Developments in the Global Immersive analytics,
-
Key developments and Growth Strategies
- New Offering Launch/Vertical Deployment
- Merger & Acquisitions
- Joint Ventures
-
Major Players Financial Matrix
- Sales & Operating Income, 2022
- Major Players R&D Expenditure. 2022
-
COMPANY PROFILES
-
Microsoft Corporation
- Company Overview
- Financial Overview
- Offerings Offered
- Key Developments
- SWOT Analysis
- Key Strategies
-
IBM Corporation
- Company Overview
- Financial Overview
- Offerings Offered
- Key Developments
- SWOT Analysis
- Key Strategies
-
Accenture PLC
- Company Overview
- Financial Overview
- Offerings Offered
- Key Developments
- SWOT Analysis
- Key Strategies
-
Google LLC (Alphabet Inc.)
- Company Overview
- Financial Overview
- Offerings Offered
- Key Developments
- SWOT Analysis
- Key Strategies
-
SAP SE
- Company Overview
- Financial Overview
- Offerings Offered
- Key Developments
- SWOT Analysis
- Key Strategies
-
Meta Platforms, Inc.
- Company Overview
- Financial Overview
- Offerings Offered
- Key Developments
- SWOT Analysis
- Key Strategies
-
HTC Corporation
- Company Overview
- Financial Overview
- Offerings Offered
- Key Developments
- SWOT Analysis
- Key Strategies
-
HP, Inc.
- Company Overview
- Financial Overview
- Offerings Offered
- Key Developments
- SWOT Analysis
- Key Strategies
-
Tibco Software, Inc.
- Company Overview
- Financial Overview
- Offerings Offered
- Key Developments
- SWOT Analysis
- Key Strategies
-
Magic Leap, Inc.
- Company Overview
- Financial Overview
- Offerings Offered
- Key Developments
- SWOT Analysis
- Key Strategies
-
Microsoft Corporation
-
APPENDIX
- References
- Related Reports
-
-
List of Tables and Figures
- LIST OF TABLES
- TABLE 1 GLOBAL IMMERSIVE ANALYTICS, SYNOPSIS, 2018-2032
- TABLE 2 GLOBAL IMMERSIVE ANALYTICS, ESTIMATES & FORECAST, 2018-2032 (USD BILLION)
- TABLE 3 GLOBAL IMMERSIVE ANALYTICS, BY OFFERING, 2018-2032 (USD BILLION)
- TABLE 4 GLOBAL IMMERSIVE ANALYTICS, BY VERTICAL, 2018-2032 (USD BILLION)
- TABLE 5 GLOBAL IMMERSIVE ANALYTICS, BY APPLICATION, 2018-2032 (USD BILLION)
- TABLE 6 NORTH AMERICA IMMERSIVE ANALYTICS, BY OFFERING, 2018-2032 (USD BILLION)
- TABLE 7 NORTH AMERICA IMMERSIVE ANALYTICS, BY VERTICAL, 2018-2032 (USD BILLION)
- TABLE 8 NORTH AMERICA IMMERSIVE ANALYTICS, BY APPLICATION, 2018-2032 (USD BILLION)
- TABLE 9 NORTH AMERICA IMMERSIVE ANALYTICS, BY COUNTRY, 2018-2032 (USD BILLION)
- TABLE 10 U.S. IMMERSIVE ANALYTICS, BY OFFERING, 2018-2032 (USD BILLION)
- TABLE 11 U.S. IMMERSIVE ANALYTICS, BY VERTICAL, 2018-2032 (USD BILLION)
- TABLE 12 U.S. IMMERSIVE ANALYTICS, BY APPLICATION, 2018-2032 (USD BILLION)
- TABLE 13 CANADA IMMERSIVE ANALYTICS, BY OFFERING, 2018-2032 (USD BILLION)
- TABLE 14 CANADA IMMERSIVE ANALYTICS, BY VERTICAL, 2018-2032 (USD BILLION)
- TABLE 15 CANADA IMMERSIVE ANALYTICS, BY APPLICATION, 2018-2032 (USD BILLION)
- TABLE 16 EUROPE IMMERSIVE ANALYTICS, BY OFFERING, 2018-2032 (USD BILLION)
- TABLE 17 EUROPE IMMERSIVE ANALYTICS, BY VERTICAL, 2018-2032 (USD BILLION)
- TABLE 18 EUROPE IMMERSIVE ANALYTICS, BY APPLICATION, 2018-2032 (USD BILLION)
- TABLE 19 EUROPE IMMERSIVE ANALYTICS, BY COUNTRY, 2018-2032 (USD BILLION)
- TABLE 20 GERMANY IMMERSIVE ANALYTICS, BY OFFERING, 2018-2032 (USD BILLION)
- TABLE 21 GERMANY IMMERSIVE ANALYTICS, BY VERTICAL, 2018-2032 (USD BILLION)
- TABLE 22 GERMANY IMMERSIVE ANALYTICS, BY APPLICATION, 2018-2032 (USD BILLION)
- TABLE 23 FRANCE IMMERSIVE ANALYTICS, BY OFFERING, 2018-2032 (USD BILLION)
- TABLE 24 FRANCE IMMERSIVE ANALYTICS, BY VERTICAL, 2018-2032 (USD BILLION)
- TABLE 25 FRANCE IMMERSIVE ANALYTICS, BY APPLICATION, 2018-2032 (USD BILLION)
- TABLE 26 ITALY IMMERSIVE ANALYTICS, BY OFFERING, 2018-2032 (USD BILLION)
- TABLE 27 ITALY IMMERSIVE ANALYTICS, BY VERTICAL, 2018-2032 (USD BILLION)
- TABLE 28 ITALY IMMERSIVE ANALYTICS, BY APPLICATION, 2018-2032 (USD BILLION)
- TABLE 29 SPAIN IMMERSIVE ANALYTICS, BY OFFERING, 2018-2032 (USD BILLION)
- TABLE 30 SPAIN IMMERSIVE ANALYTICS, BY VERTICAL, 2018-2032 (USD BILLION)
- TABLE 31 SPAIN IMMERSIVE ANALYTICS, BY APPLICATION, 2018-2032 (USD BILLION)
- TABLE 32 U.K IMMERSIVE ANALYTICS, BY OFFERING, 2018-2032 (USD BILLION)
- TABLE 33 U.K IMMERSIVE ANALYTICS, BY VERTICAL, 2018-2032 (USD BILLION)
- TABLE 34 U.K IMMERSIVE ANALYTICS, BY APPLICATION, 2018-2032 (USD BILLION)
- TABLE 35 REST OF EUROPE IMMERSIVE ANALYTICS, BY OFFERING, 2018-2032 (USD BILLION)
- TABLE 36 REST OF EUROPE IMMERSIVE ANALYTICS, BY VERTICAL, 2018-2032 (USD BILLION)
- TABLE 37 REST OF EUROPE IMMERSIVE ANALYTICS, BY APPLICATION, 2018-2032 (USD BILLION)
- TABLE 38 ASIA PACIFIC IMMERSIVE ANALYTICS, BY OFFERING, 2018-2032 (USD BILLION)
- TABLE 39 ASIA PACIFIC IMMERSIVE ANALYTICS, BY VERTICAL, 2018-2032 (USD BILLION)
- TABLE 40 ASIA PACIFIC IMMERSIVE ANALYTICS, BY APPLICATION, 2018-2032 (USD BILLION)
- TABLE 41 ASIA PACIFIC IMMERSIVE ANALYTICS, BY COUNTRY, 2018-2032 (USD BILLION)
- TABLE 42 JAPAN IMMERSIVE ANALYTICS, BY OFFERING, 2018-2032 (USD BILLION)
- TABLE 43 JAPAN IMMERSIVE ANALYTICS, BY VERTICAL, 2018-2032 (USD BILLION)
- TABLE 44 JAPAN IMMERSIVE ANALYTICS, BY APPLICATION, 2018-2032 (USD BILLION)
- TABLE 45 CHINA IMMERSIVE ANALYTICS, BY OFFERING, 2018-2032 (USD BILLION)
- TABLE 46 CHINA IMMERSIVE ANALYTICS, BY VERTICAL, 2018-2032 (USD BILLION)
- TABLE 47 CHINA IMMERSIVE ANALYTICS, BY APPLICATION, 2018-2032 (USD BILLION)
- TABLE 48 INDIA IMMERSIVE ANALYTICS, BY OFFERING, 2018-2032 (USD BILLION)
- TABLE 49 INDIA IMMERSIVE ANALYTICS, BY VERTICAL, 2018-2032 (USD BILLION)
- TABLE 50 INDIA IMMERSIVE ANALYTICS, BY APPLICATION, 2018-2032 (USD BILLION)
- TABLE 51 AUSTRALIA IMMERSIVE ANALYTICS, BY OFFERING, 2018-2032 (USD BILLION)
- TABLE 52 AUSTRALIA IMMERSIVE ANALYTICS, BY VERTICAL, 2018-2032 (USD BILLION)
- TABLE 53 AUSTRALIA IMMERSIVE ANALYTICS, BY APPLICATION, 2018-2032 (USD BILLION)
- TABLE 54 SOUTH KOREA IMMERSIVE ANALYTICS, BY OFFERING, 2018-2032 (USD BILLION)
- TABLE 55 SOUTH KOREA IMMERSIVE ANALYTICS, BY VERTICAL, 2018-2032 (USD BILLION)
- TABLE 56 SOUTH KOREA IMMERSIVE ANALYTICS, BY APPLICATION, 2018-2032 (USD BILLION)
- TABLE 57 REST OF ASIA-PACIFIC IMMERSIVE ANALYTICS, BY OFFERING, 2018-2032 (USD BILLION)
- TABLE 58 REST OF ASIA-PACIFIC IMMERSIVE ANALYTICS, BY VERTICAL, 2018-2032 (USD BILLION)
- TABLE 59 REST OF ASIA-PACIFIC IMMERSIVE ANALYTICS, BY APPLICATION, 2018-2032 (USD BILLION)
- TABLE 60 REST OF WORLD IMMERSIVE ANALYTICS, BY OFFERING, 2018-2032 (USD BILLION)
- TABLE 61 REST OF WORLD IMMERSIVE ANALYTICS, BY VERTICAL, 2018-2032 (USD BILLION)
- TABLE 62 REST OF WORLD IMMERSIVE ANALYTICS, BY APPLICATION, 2018-2032 (USD BILLION)
- TABLE 63 REST OF WORLD IMMERSIVE ANALYTICS, BY COUNTRY, 2018-2032 (USD BILLION)
- TABLE 64 MIDDLE EAST IMMERSIVE ANALYTICS, BY OFFERING, 2018-2032 (USD BILLION)
- TABLE 65 MIDDLE EAST IMMERSIVE ANALYTICS, BY VERTICAL, 2018-2032 (USD BILLION)
- TABLE 66 MIDDLE EAST IMMERSIVE ANALYTICS, BY APPLICATION, 2018-2032 (USD BILLION)
- TABLE 67 AFRICA IMMERSIVE ANALYTICS, BY OFFERING, 2018-2032 (USD BILLION)
- TABLE 68 AFRICA IMMERSIVE ANALYTICS, BY VERTICAL, 2018-2032 (USD BILLION)
- TABLE 69 AFRICA IMMERSIVE ANALYTICS, BY APPLICATION, 2018-2032 (USD BILLION)
- TABLE 70 LATIN AMERICA IMMERSIVE ANALYTICS, BY OFFERING, 2018-2032 (USD BILLION)
- TABLE 71 LATIN AMERICA IMMERSIVE ANALYTICS, BY VERTICAL, 2018-2032 (USD BILLION)
- TABLE 72 LATIN AMERICA IMMERSIVE ANALYTICS, BY APPLICATION, 2018-2032 (USD BILLION) LIST OF FIGURES
- FIGURE 1 RESEARCH PROCESS
- FIGURE 2 MARKET STRUCTURE FOR THE GLOBAL IMMERSIVE ANALYTICS
- FIGURE 3 MARKET DYNAMICS FOR THE GLOBAL IMMERSIVE ANALYTICS
- FIGURE 4 GLOBAL IMMERSIVE ANALYTICS, SHARE (%), BY OFFERING, 2022
- FIGURE 5 GLOBAL IMMERSIVE ANALYTICS, SHARE (%), BY VERTICAL, 2022
- FIGURE 6 GLOBAL IMMERSIVE ANALYTICS, SHARE (%), BY APPLICATION, 2022
- FIGURE 7 GLOBAL IMMERSIVE ANALYTICS, SHARE (%), BY REGION, 2022
- FIGURE 8 NORTH AMERICA: IMMERSIVE ANALYTICS, SHARE (%), BY REGION, 2022
- FIGURE 9 EUROPE: IMMERSIVE ANALYTICS, SHARE (%), BY REGION, 2022
- FIGURE 10 ASIA-PACIFIC: IMMERSIVE ANALYTICS, SHARE (%), BY REGION, 2022
- FIGURE 11 REST OF THE WORLD: IMMERSIVE ANALYTICS, SHARE (%), BY REGION, 2022
- FIGURE 12 GLOBAL IMMERSIVE ANALYTICS: COMPANY SHARE ANALYSIS, 2022 (%)
- FIGURE 13 MICROSOFT CORPORATION.: FINANCIAL OVERVIEW SNAPSHOT
- FIGURE 14 MICROSOFT CORPORATION.: SWOT ANALYSIS
- FIGURE 15 IBM CORPORATION.: FINANCIAL OVERVIEW SNAPSHOT
- FIGURE 16 IBM CORPORATION.: SWOT ANALYSIS
- FIGURE 17 ACCENTURE PLC.: FINANCIAL OVERVIEW SNAPSHOT
- FIGURE 18 ACCENTURE PLC.: SWOT ANALYSIS
- FIGURE 19 GOOGLE LLC (ALPHABET INC.) .: FINANCIAL OVERVIEW SNAPSHOT
- FIGURE 20 GOOGLE LLC (ALPHABET INC.) .: SWOT ANALYSIS
- FIGURE 21 HTC CORPORATION.: FINANCIAL OVERVIEW SNAPSHOT
- FIGURE 22 HTC CORPORATION.: SWOT ANALYSIS
- FIGURE 23 SAP SE.: FINANCIAL OVERVIEW SNAPSHOT
- FIGURE 24 SAP SE.: SWOT ANALYSIS
- FIGURE 25 HP, INC. .: FINANCIAL OVERVIEW SNAPSHOT
- FIGURE 26 HP, INC. .: SWOT ANALYSIS
- FIGURE 27 MAGIC LEAP, INC. .: FINANCIAL OVERVIEW SNAPSHOT
- FIGURE 28 MAGIC LEAP, INC. .: SWOT ANALYSIS
- FIGURE 29 META PLATFORMS, INC. .: FINANCIAL OVERVIEW SNAPSHOT
- FIGURE 30 META PLATFORMS, INC. .: SWOT ANALYSIS
- FIGURE 31 TIBCO SOFTWARE, INC. .: FINANCIAL OVERVIEW SNAPSHOT
- FIGURE 32 TIBCO SOFTWARE, INC. .: SWOT ANALYSIS
Immersive Analytics Market Segmentation
Immersive Analytics Market Offering Outlook (USD Billion, 2018-2032)
- Hardware
- Solutions
- Services
Immersive Analytics Market Application Outlook (USD Billion, 2018-2032)
- Education & Training
- Sales & Marketing
- Design & Visualization
- Strategy Planning
- Other Applications
Immersive Analytics Market End-Use Industry Outlook (USD Billion, 2018-2032)
- Healthcare
- Media & Entertainment
- Automotive & Transportation
- Construction
- Government & Defense
- Other End Use Industries
Immersive Analytics Market Regional Outlook (USD Billion, 2018-2032)
North America Outlook (USD Billion, 2018-2032)
- Immersive Analytics Market by Offering
- Hardware
- Solutions
- Services
- Immersive Analytics Market by Application
- Education & Training
- Sales & Marketing
- Design & Visualization
- Strategy Planning
- Other Applications
- Immersive Analytics Market by End-Use Industry
- Healthcare
- Media & Entertainment
- Automotive & Transportation
- Construction
- Government & Defense
- Other End Use Industries
US Outlook (USD Billion, 2018-2032)
- Immersive Analytics Market by Offering
- Hardware
- Solutions
- Services
- Immersive Analytics Market by Application
- Education & Training
- Sales & Marketing
- Design & Visualization
- Strategy Planning
- Other Applications
- Immersive Analytics Market by End-Use Industry
- Healthcare
- Media & Entertainment
- Automotive & Transportation
- Construction
- Government & Defense
- Other End Use Industries
Canada Outlook (USD Billion, 2018-2032)
- Immersive Analytics Market by Offering
- Hardware
- Solutions
- Services
- Immersive Analytics Market by Application
- Education & Training
- Sales & Marketing
- Design & Visualization
- Strategy Planning
- Other Applications
- Immersive Analytics Market by End-Use Industry
- Healthcare
- Media & Entertainment
- Automotive & Transportation
- Construction
- Government & Defense
- Other End Use Industries
- Immersive Analytics Market by Offering
Europe Outlook (USD Billion, 2018-2032)
- Immersive Analytics Market by Offering
- Hardware
- Solutions
- Services
- Immersive Analytics Market by Application
- Education & Training
- Sales & Marketing
- Design & Visualization
- Strategy Planning
- Other Applications
- Immersive Analytics Market by End-Use Industry
- Healthcare
- Media & Entertainment
- Automotive & Transportation
- Construction
- Government & Defense
- Other End Use Industries
Germany Outlook (USD Billion, 2018-2032)
- Immersive Analytics Market by Offering
- Hardware
- Solutions
- Services
- Immersive Analytics Market by Application
- Education & Training
- Sales & Marketing
- Design & Visualization
- Strategy Planning
- Other Applications
- Immersive Analytics Market by End-Use Industry
- Healthcare
- Media & Entertainment
- Automotive & Transportation
- Construction
- Government & Defense
- Other End Use Industries
France Outlook (USD Billion, 2018-2032)
- Immersive Analytics Market by Offering
- Hardware
- Solutions
- Services
- Immersive Analytics Market by Application
- Education & Training
- Sales & Marketing
- Design & Visualization
- Strategy Planning
- Other Applications
- Immersive Analytics Market by End-Use Industry
- Healthcare
- Media & Entertainment
- Automotive & Transportation
- Construction
- Government & Defense
- Other End Use Industries
UK Outlook (USD Billion, 2018-2032)
- Immersive Analytics Market by Offering
- Hardware
- Solutions
- Services
- Immersive Analytics Market by Application
- Education & Training
- Sales & Marketing
- Design & Visualization
- Strategy Planning
- Other Applications
- Immersive Analytics Market by End-Use Industry
- Healthcare
- Media & Entertainment
- Automotive & Transportation
- Construction
- Government & Defense
- Other End Use Industries
Italy Outlook (USD Billion, 2018-2032)
- Immersive Analytics Market by Offering
- Hardware
- Solutions
- Services
- Immersive Analytics Market by Application
- Education & Training
- Sales & Marketing
- Design & Visualization
- Strategy Planning
- Other Applications
- Immersive Analytics Market by End-Use Industry
- Healthcare
- Media & Entertainment
- Automotive & Transportation
- Construction
- Government & Defense
- Other End Use Industries
Spain Outlook (USD Billion, 2018-2032)
- Immersive Analytics Market by Offering
- Hardware
- Solutions
- Services
- Immersive Analytics Market by Application
- Education & Training
- Sales & Marketing
- Design & Visualization
- Strategy Planning
- Other Applications
- Immersive Analytics Market by End-Use Industry
- Healthcare
- Media & Entertainment
- Automotive & Transportation
- Construction
- Government & Defense
- Other End Use Industries
Rest Of Europe Outlook (USD Billion, 2018-2032)
- Immersive Analytics Market by Offering
- Hardware
- Solutions
- Services
- Immersive Analytics Market by Application
- Education & Training
- Sales & Marketing
- Design & Visualization
- Strategy Planning
- Other Applications
- Immersive Analytics Market by End-Use Industry
- Healthcare
- Media & Entertainment
- Automotive & Transportation
- Construction
- Government & Defense
- Other End Use Industries
- Immersive Analytics Market by Offering
Asia-Pacific Outlook (USD Billion, 2018-2032)
- Immersive Analytics Market by Offering
- Hardware
- Solutions
- Services
- Immersive Analytics Market by Application
- Education & Training
- Sales & Marketing
- Design & Visualization
- Strategy Planning
- Other Applications
- Immersive Analytics Market by End-Use Industry
- Healthcare
- Media & Entertainment
- Automotive & Transportation
- Construction
- Government & Defense
- Other End Use Industries
China Outlook (USD Billion, 2018-2032)
- Immersive Analytics Market by Offering
- Hardware
- Solutions
- Services
- Immersive Analytics Market by Application
- Education & Training
- Sales & Marketing
- Design & Visualization
- Strategy Planning
- Other Applications
- Immersive Analytics Market by End-Use Industry
- Healthcare
- Media & Entertainment
- Automotive & Transportation
- Construction
- Government & Defense
- Other End Use Industries
Japan Outlook (USD Billion, 2018-2032)
- Immersive Analytics Market by Offering
- Hardware
- Solutions
- Services
- Immersive Analytics Market by Application
- Education & Training
- Sales & Marketing
- Design & Visualization
- Strategy Planning
- Other Applications
- Immersive Analytics Market by End-Use Industry
- Healthcare
- Media & Entertainment
- Automotive & Transportation
- Construction
- Government & Defense
- Other End Use Industries
India Outlook (USD Billion, 2018-2032)
- Immersive Analytics Market by Offering
- Hardware
- Solutions
- Services
- Immersive Analytics Market by Application
- Education & Training
- Sales & Marketing
- Design & Visualization
- Strategy Planning
- Other Applications
- Immersive Analytics Market by End-Use Industry
- Healthcare
- Media & Entertainment
- Automotive & Transportation
- Construction
- Government & Defense
- Other End Use Industries
Australia Outlook (USD Billion, 2018-2032)
- Immersive Analytics Market by Offering
- Hardware
- Solutions
- Services
- Immersive Analytics Market by Application
- Education & Training
- Sales & Marketing
- Design & Visualization
- Strategy Planning
- Other Applications
- Immersive Analytics Market by End-Use Industry
- Healthcare
- Media & Entertainment
- Automotive & Transportation
- Construction
- Government & Defense
- Other End Use Industries
Rest of Asia-Pacific Outlook (USD Billion, 2018-2032)
- Immersive Analytics Market by Offering
- Hardware
- Solutions
- Services
- Immersive Analytics Market by Application
- Education & Training
- Sales & Marketing
- Design & Visualization
- Strategy Planning
- Other Applications
- Immersive Analytics Market by End-Use Industry
- Healthcare
- Media & Entertainment
- Automotive & Transportation
- Construction
- Government & Defense
- Other End Use Industries
- Immersive Analytics Market by Offering
Rest of the World Outlook (USD Billion, 2018-2032)
- Immersive Analytics Market by Offering
- Hardware
- Solutions
- Services
- Immersive Analytics Market by Application
- Education & Training
- Sales & Marketing
- Design & Visualization
- Strategy Planning
- Other Applications
- Immersive Analytics Market by End-Use Industry
- Healthcare
- Media & Entertainment
- Automotive & Transportation
- Construction
- Government & Defense
- Other End Use Industries
Middle East Outlook (USD Billion, 2018-2032)
- Immersive Analytics Market by Offering
- Hardware
- Solutions
- Services
- Immersive Analytics Market by Application
- Education & Training
- Sales & Marketing
- Design & Visualization
- Strategy Planning
- Other Applications
- Immersive Analytics Market by End-Use Industry
- Healthcare
- Media & Entertainment
- Automotive & Transportation
- Construction
- Government & Defense
- Other End Use Industries
Africa Outlook (USD Billion, 2018-2032)
- Immersive Analytics Market by Offering
- Hardware
- Solutions
- Services
- Immersive Analytics Market by Application
- Education & Training
- Sales & Marketing
- Design & Visualization
- Strategy Planning
- Other Applications
- Immersive Analytics Market by End-Use Industry
- Healthcare
- Media & Entertainment
- Automotive & Transportation
- Construction
- Government & Defense
- Other End Use Industries
Latin America Outlook (USD Billion, 2018-2032)
- Immersive Analytics Market by Offering
- Hardware
- Solutions
- Services
- Immersive Analytics Market by Application
- Education & Training
- Sales & Marketing
- Design & Visualization
- Strategy Planning
- Other Applications
- Immersive Analytics Market by End-Use Industry
- Healthcare
- Media & Entertainment
- Automotive & Transportation
- Construction
- Government & Defense
- Other End Use Industries
- Immersive Analytics Market by Offering

Free Sample Request
Kindly complete the form below to receive a free sample of this Report
Customer Strories
“I am very pleased with how market segments have been defined in a relevant way for my purposes (such as "Portable Freezers & refrigerators" and "last-mile"). In general the report is well structured. Thanks very much for your efforts.”
Leave a Comment