• Cat-intel
  • MedIntelliX
  • Resources
  • About Us
  • Hero Background
    English
    Chinese
    French
    Japanese
    Korean
    German
    Spanish

    Gum Rosin Market Share

    ID: MRFR/CnM/6957-CR
    100 Pages
    Priya Nagrale
    December 2022

    Gum Rosin Market Research Report Information by Type (WW, WG, K, X, and Others), By Product Type (Adhesive & Sealants, Rubber, Paint & Coatings, Printing Inks, Food & Beverage, and Others), And By Region (North America, Europe, Asia-Pacific, And Rest Of The World) –Market Forecast Till 2035

    Share:
    Download PDF ×

    We do not share your information with anyone. However, we may send you emails based on your report interest from time to time. You may contact us at any time to opt-out.

    Gum Rosin Market Infographic
    $ 4,950.0
    $ 5,950.0
    $ 7,250.0

    Market Share

    Gum Rosin Market Share Analysis

    In countries like Brazil and Argentina, private investors either buy or lease land to grow densely packed plantation forests. Skilled workers, known as "tappers," are hired directly or through tapping businesses to collect oleoresin. This agricultural approach guides how forests are managed and tapping methods are organized. The tappers work for companies that maintain pine tree plantations, where they have access to modern equipment and receive fair pay. The use of advanced molecular pine tree genetics and chemical stimulants by PCI (Pine Chemical Industry) has increased oleoresin production in pine trees. With research and development (R&D), a single worker can now tap 7,000-10,000 trees annually, a significant increase from the previous 1,500-2,000 trees using standard PCI techniques. In a commercial setting, a single tapper can tap four to six times more trees compared to a natural forest in the same time frame. Additionally, the average oleoresin yield from tapping trees in a plantation forest is nearly three times that of a natural forest. Advances in forestry management, tapping technology, molecular genetics research, and hybrid pine tree development contribute to increased oleoresin production and value. This has led to a notable shift in the PCI business model, with businesses collaborating with academic institutions and trade associations to enhance the economic value and production of pine forests. The role of a pine tapper and the required skills are evolving. African countries have the potential to produce naval gum stores by utilizing large areas of underutilized pine trees. Some indications suggest that this potential is being realized in certain cases. Malawi, for instance, has over 50,000 hectares of mature pines in the north, with potential viability for commercial tapping, especially with P. elliottii. However, the country may not become a major international producer of naval stores. In Uganda, tapping operations for P. caribaea have started on a small scale. Other countries like Tanzania and Zambia possess significant pine forests, but their suitability and capacity for naval gum store production are yet to be proven. South Africa focuses its tapping operations on extensive plantings of P. elliottii and P. caribaea in northern Natal's Lake St Lucia area. The resulting rosin and turpentine are mostly consumed in the United States. P. elliottii grown in the Machakos area of southern Kenya is used to produce gum rosin, with total resin production showing a slight increase. All rosins are modified and sold to local paper mills for use as sizing agents. Moreover, industries using gum rosin, such as adhesives and sealants, rubber, paints & coatings, and food & beverages, are growing in the region. For example, the South African government allocated USD 51.7 Billion in the 2022 budget for infrastructure development, potentially driving demand for construction materials and boosting the gum rosin market in the forecast period. Similarly, in the Middle East, the growth in end-use industries, infrastructure development, and the rubber industry pose an opportunity for manufacturers to expand in the developing regions of Latin America, the Middle East, and South Africa.

    Market Summary

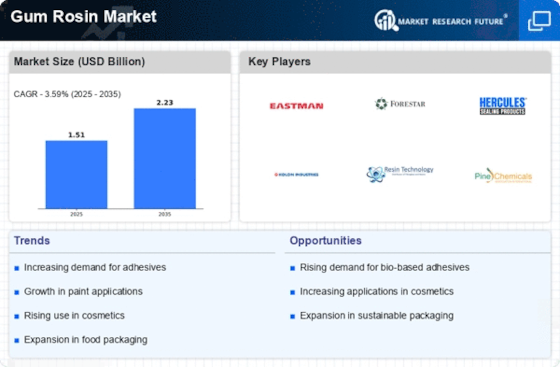
    The Global Gum Rosin Market is projected to grow from 1.51 USD Billion in 2024 to 2.23 USD Billion by 2035, reflecting a steady growth trajectory.

    Key Market Trends & Highlights

    Gum Rosin Key Trends and Highlights

    • The market is expected to experience a compound annual growth rate (CAGR) of 3.58 percent from 2025 to 2035.
    • By 2035, the market valuation is anticipated to reach 2.22 USD Billion, indicating robust growth potential.
    • in 2024, the market is valued at 1.51 USD Billion, establishing a solid foundation for future expansion.
    • Growing adoption of natural resins due to increasing environmental awareness is a major market driver.

    Market Size & Forecast

    2024 Market Size 1.51 (USD Billion)
    2035 Market Size 2.23 (USD Billion)
    CAGR (2025-2035) 3.59%
    Largest Regional Market Share in 2024 south_america)

    Major Players

    Wuzhou Pine Chemicals Ltd., Jinggu Forestry Chemical Co., Ltd., Jiangmen Xinhui Overseas Chinese Industry Development Co., Ltd., Wuzhou Sun Shine Forestry and Chemicals Co., Ltd., Grupo RB, Forestar Chemical Co., Ltd., Perum Perhutani, PT. Naval Overseas, Punjab Rosin and Chemicals Work, PinoPine, Arakawa Chemical Industries, Borealis AG

    Market Trends

    Rising demand from a variety of end-use applications is driving the market growth.

    The rising demand for various end-use applications is driving the market CAGR for gum rosin. With rising need from various end-use purposes, most gum rosin is now processed using chemicals instead of naturally produced. It is mostly made up of abietic & pimaric acids, with trace quantities of neutral chemicals. Because of its intrinsic acidity and other chemical qualities, it may be transformed into a wide range of downstream derivatives utilized for various purposes. Among the derivatives are sodium chloride, ester compounds, anhydride of maleic adducts, and polymerized rosins.

    The bulk of their uses is in manufacturing glues, paper sizing substances, printing ink, solders & fluxes, different surface finishes, insulation substances for electronic devices, synthetic rubber-based chewing gums, detergents and soaps, and other items.

    Additionally, the producer has the opportunity to grow in the expanding region. Individual investors acquire or lease property in nations such as Argentina and Brazil to produce tightly spaced plantation trees. Trained laborers, known as "tappers," are either engaged or employed by "tapping companies" to gather oleoresin. This agricultural idea describes and organizes ways of managing forests and tapping. Tappers work for firms that manage pine plantations, employ advanced technology, and are adequately compensated. PCI's utilization of innovative scientific pine genetics and chemical boosters has enhanced oleoresin manufacturing in pine trees.

    Previously, one worker could tap roughly 1,500-2,000 trees each year using normal PCI procedures; now, through R&D, the total has climbed to 7,000-10,000 trees yearly.

    COVID-19 has influenced the worldwide sales of gum rosins. Retailers, distributors, and e-commerce merchants have entered into long-term contracts with the supplier to guarantee that the finished product is available at various places when needed. While some disruption to supply chains is inevitable, there is cause to be optimistic if prior experiences are considered. The hazards associated with lean manufacturing; affordable supply chains were visually portrayed in COVID-19. By SIAM, sales of passenger cars in India fell 51% in March 2020 to 143,014 units.

    In addition, industrial vehicle sales decreased 88% to 13,027 units, while sales of two-wheeled vehicles dropped 40% to 866,849 units. It also emphasized the significance of strengthening supply-chain resilience skills. The market will likely pick up speed after the epidemic has been contained.

    For instance, based on the Rubber Board, synthetic rubber output in India climbed by 15.0% to 380,772 tons in 2018-19, up from 331,221 tons in 2017-18. In contrast, synthetic rubber usage climbed 8.3% yearly to 686,325 tons in 2018-19 from 633,975 tons in 2017-18. As a result, a rapid increase in synthetic rubber manufacturing is propelling the worldwide gum rosin market. Thus, it is anticipated that demand for Gum Rosin will increase throughout the projection timeframe due to the rising demand from various end-use applications.

    Thus, driving the Gum Rosin market revenue.May 2023- The sole US distributor for a leading global supplier of wood-rosin-based beverage additives, T&R Chemicals, Inc., has filed a complaint in California court charging competitors Farbest Brands (New Jersey) and Caragum International (Marseille, France) with incorrect advertising and unfair competition in knowingly and intentionally labeling, selling and distributing their glycerol-ester beverage additive. T&R's lawsuit contends that Caragum and Farbest falsely claim that the wood-rosin glycerol ester they sell in the United States is actually a different product that is less expensive and not approved for use in most countries in the world.

    The president of T&R, Vasilios Fotopoulos, said that by making fake and false claims about the product they are selling, Caragum and Farbest are misleading their customers, generating an unfair playing field and destroying the integrity of the rosin industry.

    The global gum rosin market is poised for growth, driven by increasing demand in various applications such as adhesives, inks, and coatings, which reflects a broader trend towards natural and sustainable materials.

    U.S. Department of Agriculture

    Gum Rosin Market Market Drivers

    Market Growth Projections

    Rising Demand in Adhesives and Sealants

    The Global Gum Rosin Market Industry experiences a notable surge in demand due to its extensive application in adhesives and sealants. As industries such as construction and automotive expand, the need for high-performance adhesives increases. Gum rosin serves as a key ingredient in formulating these products, enhancing their bonding properties. For instance, the global adhesives market is projected to grow significantly, with gum rosin playing a crucial role in this expansion. This trend is expected to contribute to the market's growth, with the Global Gum Rosin Market anticipated to reach 1.51 USD Billion by 2024.

    Growth in the Paints and Coatings Sector

    The Global Gum Rosin Market Industry benefits from the increasing utilization of gum rosin in the paints and coatings sector. As environmental regulations tighten, manufacturers seek natural resins like gum rosin for their eco-friendly properties. This shift towards sustainable materials is driving demand, particularly in the production of water-based paints and coatings. The market for paints and coatings is projected to grow, further bolstering the gum rosin market. The anticipated growth in this sector aligns with the overall market trajectory, with projections indicating a rise to 2.22 USD Billion by 2035.

    Increasing Use in Food Packaging Applications

    The Global Gum Rosin Market Industry is experiencing growth due to the rising use of gum rosin in food packaging applications. As the food industry seeks sustainable and biodegradable materials, gum rosin emerges as a viable option. Its natural properties make it suitable for creating coatings and adhesives that comply with food safety regulations. This trend aligns with the global push towards sustainable packaging solutions, driving demand for gum rosin. As the food packaging sector continues to expand, the gum rosin market is likely to benefit, contributing to its overall growth.

    Expanding Applications in Personal Care Products

    The Global Gum Rosin Market Industry is witnessing an expansion in applications within the personal care sector. Gum rosin is increasingly incorporated into cosmetics and personal care formulations due to its emulsifying and thickening properties. As consumer preferences shift towards natural and organic products, the demand for gum rosin is likely to increase. This trend is supported by the growing awareness of the benefits of using natural ingredients in personal care. Consequently, the market for gum rosin is expected to experience a steady growth rate, contributing to the overall market expansion.

    Technological Advancements in Processing Techniques

    The Global Gum Rosin Market Industry is influenced by technological advancements in processing techniques, which enhance the efficiency and quality of gum rosin production. Innovations in extraction and refining processes lead to higher yields and improved product characteristics. These advancements not only reduce production costs but also enable manufacturers to meet the evolving demands of various industries. As a result, the market is likely to benefit from increased production capabilities, fostering growth. The anticipated compound annual growth rate of 3.58% from 2025 to 2035 further underscores the positive impact of these technological developments.

    Market Segment Insights

    Gum Rosin Type Insights

    The Gum Rosin market segmentation, based on type, includes WW, WG, K, X, and Others. WW category dominated the market, accounting for 48% of market revenue (USD 0.7  billion) in 2022. Increasing the use of the WW-Type category in sizing paper to retain patterns and colors is one of the important aspects that will drive overall demand. It is used for excellent quality and performance in adhesives and synthetic rubber applications.

    Figure 1: Gum Rosin Market, by Type, 2022 & 2032 (USD Billion)

    Source: Secondary Research, Primary Research, Market Research Future Database, and Analyst Review

    Gum Rosin Product Type Insights

    The Gum Rosin market segmentation, based on Product Type, includes Adhesive & Sealants, Rubber, Paint & Coatings, Printing Inks, Food & Beverage, and Others. The adhesive & sealants category generated the most income of about 30% (USD 0.4 billion) in 2022. The increased use of adhesives in the vehicle and construction industries drives demand for this category. The increase in vehicle manufacturing and residential and commercial building projects is causing an increase in demand for adhesives and sealants, which will improve total market demand.

    Get more detailed insights about Gum Rosin Market Research Report - Global Forecast till 2032

    Regional Insights

    By region, the research provides market insights into North America, Europe, Asia-Pacific, and the Rest of the World. The North American Gum Rosin market area will dominate this market, owing to a strong expansion in application sectors such as glues, inks for printing, artificial rubber, and paper sizing. In addition, the growing number of end-use industries will boost market growth in this region.

    Further, the major countries studied in the market report are the US, Canada, German, France, the UK, Italy, Spain, China, Japan, India, Australia, South Korea, and Brazil.

    Figure 2: Gum Rosin Market Share by Region 2022 (USD Billion)

    Gum Rosin Market Share by Region

    Source: Secondary Research, Primary Research, Market Research Future Database, and Analyst Review

    Europe region’s Gum Rosin market is expected to grow and expand significantly at a fast growth rate due to the rapid industrial expansion and improved consumer habits that have resulted in an increase in demand for superior goods from end-use sectors, including automotive and construction & building. Further, the German Gum Rosin market holds the largest market share, and the UK Gum Rosin Market is anticipated to grow and expand rapidly in the European region during the projected timeframe.

    The Asia-Pacific Gum Rosin Market accounts for the second-highest market revenue during the projected timeframe. This is because of growing adhesives in emerging economies such as China and India, boosting the overall market demand. Moreover, China’s Gum Rosin market held the largest market share, and the Indian Gum Rosin market was the fastest-growing market in the APAC region.

    Key Players and Competitive Insights

    Leading market players invested heavily in research and development (R&D) to scale up their manufacturing units and product lines, which will help the Gum Rosin market grow worldwide. Market participants are also undertaking various organic or inorganic strategic approaches to strengthen and expand their footprint, with important market developments including new product portfolios, contractual deals, mergers and acquisitions, capital expenditure, higher investments, and strategic alliances with other organizations. Businesses are also coming up with marketing strategies such as digital marketing, social media influencing, and content marketing to increase their scope of profit earnings.

    The Gum Rosin industry must offer cost-effective and sustainable options to survive in a highly fragmented and dynamic market climate.

    Manufacturing locally to minimize operational expenses and offer aftermarket services to customers is one of the key business strategies organizations use in the Gum Rosin industry to benefit customers and capture untapped market share and revenue. The Gum Rosin industry has recently offered significant advantages to the automotive industry. Moreover, more industry participants are utilizing and adopting cutting-edge technology has grown substantially.

    Major players in the Gum Rosin market, including Wuzhou Pine Chemicals Ltd., Jinggu Forestry Chemical Co., Ltd., Jiangmen Xinhui Overseas Chinese Industry Development Co., Ltd., Wuzhou Sun Shine Forestry and Chemicals Co., Ltd., Grupo RB, Forestar Chemical Co., Ltd., Perum Perhutani, PT. Naval Overseas, Punjab Rosin and Chemicals Work, and  PinoPine, are attempting to expand market share and demand by investing in research and development (R&D) operations to produce sustainable and affordable solutions.

    Arakawa Chemical Industries produces and distributes resins for inks used in printing and paper chemicals. It is a major provider of excellent, ecologically friendly chemical substances utilized in producing adhesives and related products, sealing compounds, inks for printing, pigments, plastics, finishes, rubber, electronic devices, and other items. Several of their goods target significant markets in Japan and are being expanded throughout the continent of America. The organization sells its goods in other countries, particularly in Asia. The organization's four segments are Papermaking Chemicals, Coating, Adhesive, and Functional Materials. The organization also offers non-life insurance products and property brokerage solutions.

    Arakawa Chemical Industries Ltd agreed to partner with Forestar Chemical Co. Ltd in 2021 to boost their gum rosin manufacturing capacity.

    Borealis AG provides chemical and plastic solutions. It was established in 1994 and is headquartered in Vienna, Austria. It is a leader in sophisticated and ecological polyolefin solutions and a European leader in polyolefin recycling. They have become the market leader in chemical bases and fertilizers in Europe. Polyolefins, basic chemicals, and fertilizers are also available from the organization. Borealis services the transportation, pipe & connections, power, and medical sectors worldwide. In 2020, Borealis AG introduced a new marketing strategy for its gum rosin sealants and adhesives line of goods, which includes gum rosin-based items.

    Key Companies in the Gum Rosin Market market include

    Industry Developments

    • Q2 2024: Henkel launches new bio-based hot melt adhesives incorporating gum rosin Henkel announced the launch of a new line of bio-based hot melt adhesives that utilize gum rosin as a key tackifier, targeting sustainable packaging and construction applications.

    Future Outlook

    Gum Rosin Market Future Outlook

    The Global Gum Rosin Market is projected to grow at a 3.59% CAGR from 2025 to 2035, driven by increasing demand in adhesives, inks, and coatings.

    New opportunities lie in:

    • Develop bio-based gum rosin products to meet sustainability demands.
    • Expand into emerging markets with tailored marketing strategies.
    • Invest in R&D for innovative applications in the cosmetics industry.

    By 2035, the market is expected to exhibit robust growth, reflecting evolving consumer preferences and technological advancements.

    Market Segmentation

    Gum Rosin Type Outlook

    • WW
    • WG
    • K
    • X
    • Others

    Gum Rosin Regional Outlook

    • US
    • Canada

    Gum Rosin Product Type Outlook

    • Adhesive & Sealants
    • Rubber
    • Paint & Coatings
    • Printing Inks
    • Food & Beverage
    • Others

    Report Scope

    Report Attribute/Metric Details
    Market Size 2024 USD 1.51 Billion
    Market Size 2035 2.23 (Value (USD Billion))
    Compound Annual Growth Rate (CAGR) 3.59% (2025 - 2035)
    Base Year 2024
    Market Forecast Period 2025 - 2035
    Historical Data 2018- 2022
    Market Forecast Units Value (USD Billion)
    Report Coverage Revenue Forecast, Market Competitive Landscape, Growth Factors, and Trends
    Segments Covered Type, Product Type, and Region
    Geographies Covered North America, Europe, Asia Pacific, and the Rest of the World
    Countries Covered The US, Canada, German, France, UK, Italy, Spain, China, Japan, India, Australia, South Korea, and Brazil
    Key Companies Profiled  Wuzhou Pine Chemicals Ltd., Jinggu Forestry Chemical Co., Ltd., Jiangmen Xinhui Overseas Chinese Industry Development Co., Ltd., Wuzhou Sun Shine Forestry and Chemicals Co., Ltd., Grupo RB, Forestar Chemical Co., Ltd., Perum Perhutani, PT. Naval Overseas, Punjab Rosin and Chemicals Work, and  PinoPine
    Key Market Opportunities Opportunity for the firm to expand in emerging economies
    Key Market Dynamics Rising needs from a variety of end-use Industries
    Market Size 2025 1.56 (Value (USD Billion))

    Market Highlights

    Author

    Priya Nagrale
    Senior Research Analyst

    She holds an experience of about 6+ years in market research and business consulting, working under the spectrum of information communication technology, telecommunications and semiconductor domains. aarti conceptualizes and implements a scalable business strategy and provides strategic leadership to the clients. her expertise lies in market estimation, competitive intelligence, pipeline analysis, customer assessment, etc.

    Leave a Comment

    Latest Comments

    John Doe
    john@example.com

    This is a great article! Really helped me understand the topic better.

    Posted on July 23, 2025, 10:15 AM
    Jane Smith
    jane@domain.com

    Thanks for sharing this. I’ve bookmarked it for later reference.

    Posted on July 22, 2025, 7:45 PM

    FAQs

    How much is the Gum Rosin Market?

    The Gum Rosin Market size was valued at USD 1.45 Billion in 2023.

    What is the growth rate of the Gum Rosin Market?

    The Gum Rosin Market is projected to grow at a CAGR of 3.59% during the forecast period, 2024-2032.

    Which region held the largest market share in the Gum Rosin Market?

    North America had the largest share of the Gum Rosin Market.

    Who are the key players in the Gum Rosin Market?

    The key players in the Gum Rosin Market are Wuzhou Pine Chemicals Ltd., Jinggu Forestry Chemical Co., Ltd., Jiangmen Xinhui Overseas Chinese Industry Development Co., Ltd., Wuzhou Sun Shine Forestry and Chemicals Co., Ltd., Grupo RB, Forestar Chemical Co., Ltd., Perum Perhutani, PT. Naval Overseas, Punjab Rosin and Chemicals Work.

    Which type led the Gum Rosin Market?

    The WW-Type category dominated the Gum Rosin Market in 2023.

    Which Product Type had the largest market share in the Gum Rosin Market?

    Adhesive & Sealants had the largest share in the Gum Rosin Market.

    1. Table of Contents
    2. Executive Summary 15
      1. MARKET ATTRACTIVENESS ANALYSIS 17
        1. GUM ROSIN MARKET, BY TYPE 18
        2. GUM ROSIN MARKET, BY APPLICATION 19
        3. GUM ROSIN MARKET, BY REGION 20
    3. Market Introduction 21
      1. DEFINITION 21
      2. Scope of the Study 21
      3. MARKET STRUCTURE 22
    4. Research Methodology 23
      1. RESEARCH PROCESS 23
      2. PRIMARY RESEARCH 24
      3. SECONDARY RESEARCH 25
      4. MARKET SIZE ESTIMATION 25
      5. TOP-DOWN AND Bottom-up Approach 26
      6. FORECAST MODEL 27
      7. LIST OF ASSUMPTIONS & LIMITATIONS 28
    5. MARKET DYNAMICS 29
      1. INTRODUCTION 29
      2. DRIVERS 30
        1. INCREASING DEMAND FROM VARIOUS END-USE APPLICATIONS 30
        2. EXTENSIVE USAGE AS A BINDER IN ADHESIVES FOR THE CONSTRUCTION INDUSTRY 32
      3. RESTRAINTS 34
        1. AVAILABILITY OF ALTERNATIVE SOLUTIONS 34
      4. OPPORTUNITIES 35
        1. OPPORTUNITY FOR THE MANUFACTURER TO EXPAND IN THE DEVELOPING REGION OF LATIN AMERICA,
    6. THE MIDDLE EAST, AND AFRICA 35
      1. CHALLENGES 36
        1. FLUCTUATING COST OF GUM ROSIN IN THE MARKET 36
    7. MARKET FACTOR ANALYSIS 38
      1. SUPPLY CHAIN ANALYSIS 38
        1. RAW MATERIAL SUPPLIERS 38
        2. MANUFACTURERS 39
        3. DISTRIBUTION & SALES CHANNEL 39
        4. END USERS 39
      2. PORTER''S FIVE FORCES ANALYSIS 40
        1. THREAT OF NEW ENTRANTS 41
        2. BARGAINING POWER OF SUPPLIERS 41
        3. THREAT OF SUBSTITUTES 41
        4. BARGAINING POWER OF BUYERS 42
        5. INTENSITY OF RIVALRY 42
      3. PRICING ANALYSIS, BY REGION (USD/TON) 2019-2030 42
      4. IMPACT OF COVID-19 ON THE GLOBAL GUM ROSIN MARKET 43
        1. IMPACT OF COVID-19 ON THE SUPPLY CHAIN OF GUM ROSIN MARKET 43
        2. QUALITATIVE ANALYSIS OF CHANGES IN DEMAND FROM END-USERS 44
    8. GLOBAL GUM ROSIN MARKET, BY TYPE 45
      1. OVERVIEW 45
      2. WW 47
      3. WG 49
      4. K 50
      5. X 51
      6. OTHERS 52
    9. GLOBAL GUM ROSIN MARKET, BY APPLICATION 54
      1. OVERVIEW 54
      2. ADHESIVES & SEALANTS 57
      3. RUBBER 58
      4. PAINTS & COATINGS 59
      5. PRINTING INKS 60
      6. FOOD & BEVERAGE 61
      7. OTHERS 62
    10. GLOBAL GUM ROSIN MARKET, BY REGION 64
      1. OVERVIEW 64
      2. NORTH AMERICA 66
        1. US 69
        2. CANADA 71
      3. EUROPE 74
        1. GERMANY 77
        2. UK 79
        3. FRANCE 81
        4. SPAIN 83
        5. ITALY 85
        6. RUSSIA 87
        7. REST OF EUROPE 89
      4. ASIA PACIFIC 91
        1. CHINA 94
        2. JAPAN 96
        3. INDIA 98
        4. SOUTH KOREA 100
        5. AUSTRALIA & NEW ZEALAND 102
        6. REST OF ASIA-PACIFIC 104
      5. LATIN AMERICA 106
        1. BRAZIL 109
        2. MEXICO 111
        3. ARGENTINA 113
        4. REST OF LATIN AMERICA 115
      6. MIDDLE EAST & AFRICA 117
        1. GCC COUNTRIES 120
        2. TURKEY 122
        3. ISRAEL 124
        4. SOUTH AFRICA 126
        5. REST OF MIDDLE EAST & AFRICA 128
    11. Competitive Landscape 130
      1. COMPETITIVE OVERVIEW 130
      2. KEY DEVELOPMENTS 130
      3. GLOBAL MARKET STRATEGY ANALYSIS 130
      4. COMPETITIVE BENCHMARKING 131
    12. COMPANY PROFILES 132
      1. WUZHOU PINE CHEMICALS LTD. 132
        1. COMPANY OVERVIEW 132
        2. FINANCIAL OVERVIEW 132
        3. PRODUCTS OFFERED 132
        4. KEY DEVELOPMENTS 132
        5. SWOT ANALYSIS 133
        6. KEY STRATEGIES 133
      2. JINGGU FORESTRY CHEMICAL CO., LTD. 134
        1. COMPANY OVERVIEW 134
        2. FINANCIAL OVERVIEW 134
        3. PRODUCTS OFFERED 134
        4. KEY DEVELOPMENTS 134
        5. SWOT ANALYSIS 135
        6. KEY STRATEGIES 135
      3. JIANGMEN XINHUI OVERSEAS CHINESE INDUSTRY DEVELOPMENT CO., LTD. 136
        1. COMPANY OVERVIEW 136
        2. FINANCIAL OVERVIEW 136
        3. PRODUCTS OFFERED 136
        4. KEY DEVELOPMENTS 136
        5. SWOT ANALYSIS 137
        6. KEY STRATEGIES 137
      4. WUZHOU SUN SHINE FORESTRY AND CHEMICALS CO., LTD. 138
        1. COMPANY OVERVIEW 138
        2. FINANCIAL OVERVIEW 138
        3. PRODUCTS OFFERED 138
        4. KEY DEVELOPMENTS 138
        5. SWOT ANALYSIS 139
        6. KEY STRATEGIES 139
      5. GRUPO RB 140
        1. COMPANY OVERVIEW 140
        2. FINANCIAL OVERVIEW 140
        3. PRODUCTS OFFERED 140
        4. KEY DEVELOPMENTS 140
        5. SWOT ANALYSIS 141
        6. KEY STRATEGIES 141
      6. FORESTAR CHEMICAL CO., LTD. 142
        1. COMPANY OVERVIEW 142
        2. FINANCIAL OVERVIEW 142
        3. PRODUCTS OFFERED 142
        4. KEY DEVELOPMENTS 142
        5. SWOT ANALYSIS 143
        6. KEY STRATEGIES 143
      7. PERUM PERHUTANI 144
        1. COMPANY OVERVIEW 144
        2. FINANCIAL OVERVIEW 145
        3. PRODUCTS OFFERED 145
        4. KEY DEVELOPMENTS 145
        5. SWOT ANALYSIS 146
        6. KEY STRATEGIES 146
      8. PT. NAVAL OVERSEAS 147
        1. COMPANY OVERVIEW 147
        2. FINANCIAL OVERVIEW 147
        3. PRODUCTS OFFERED 147
        4. KEY DEVELOPMENTS 147
        5. SWOT ANALYSIS 148
        6. KEY STRATEGIES 148
      9. PUNJAB ROSIN AND CHEMICALS WORK 149
        1. COMPANY OVERVIEW 149
        2. FINANCIAL OVERVIEW 149
        3. PRODUCTS OFFERED 149
        4. KEY DEVELOPMENTS 149
        5. SWOT ANALYSIS 150
        6. KEY STRATEGIES 150
      10. PINOPINE 151
        1. COMPANY OVERVIEW 151
        2. FINANCIAL OVERVIEW 151
        3. PRODUCTS OFFERED 151
        4. KEY DEVELOPMENTS 151
        5. SWOT ANALYSIS 152
        6. KEY STRATEGIES 152
    13. APPENDIX 153
      1. REFERENCES 153
    14. List of Tables and Figures
      1. LIST OF TABLES
      2. TABLE 1 LIST OF ASSUMPTIONS & LIMITATIONS 28
      3. TABLE 2 TYPICAL ISOMERIC COMPONENTS 31
      4. TABLE 3 PRICING OVERVIEW, BY REGION 42
      5. TABLE 4 GUM ROSIN MARKET ESTIMATES & FORECAST, BY TYPE, 2023-2032 (USD MILLION) 46
      6. TABLE 5 GUM ROSIN MARKET ESTIMATES & FORECAST, BY TYPE, 2023-2032 (KILO TONS) 47
      7. TABLE 6 WW: GUM ROSIN MARKET ESTIMATES & FORECAST, BY REGION, 2023-2032 (USD MILLION) 47
      8. TABLE 7 WW: MARKET ESTIMATES & FORECAST, BY REGION, 2023-2032 (KILO TONS) 48
      9. TABLE 8 WG: GUM ROSIN MARKET ESTIMATES & FORECAST, BY REGION, 2023-2032 (USD MILLION) 49
      10. TABLE 9 WG: GUM ROSIN MARKET ESTIMATES & FORECAST, BY REGION, 2023-2032 (KILO TONS) 49
      11. TABLE 10 K: GUM ROSIN MARKET ESTIMATES & FORECAST, BY REGION, 2023-2032 (USD MILLION) 50
      12. TABLE 11 K: GUM ROSIN MARKET ESTIMATES & FORECAST, BY REGION, 2023-2032 (KILO TONS) 50
      13. TABLE 12 X: GUM ROSIN MARKET ESTIMATES & FORECAST, BY REGION, 2023-2032 (USD MILLION) 51
      14. TABLE 13 X: GUM ROSIN MARKET ESTIMATES & FORECAST, BY REGION, 2023-2032 (KILO TONS) 52
      15. TABLE 14 OTHERS: GUM ROSIN MARKET ESTIMATES & FORECAST, BY REGION, 2023-2032 (USD MILLION) 52
      16. TABLE 15 OTHERS: GUM ROSIN MARKET ESTIMATES & FORECAST, BY REGION, 2023-2032 (KILO TONS) 53
      17. TABLE 16 GUM ROSIN MARKET ESTIMATES & FORECAST, BY APPLICATION, 2023-2032 (USD MILLION) 55
      18. TABLE 17 GUM ROSIN MARKET ESTIMATES & FORECAST, BY APPLICATION, 2023-2032 (KILO TONS) 56
      19. TABLE 18 ADHESIVES & SEALANTS MARKET ESTIMATES & FORECAST, BY REGION, 2023-2032 (USD MILLION) 57
      20. TABLE 19 ADHESIVES & SEALANTS MARKET ESTIMATES & FORECAST, BY REGION, 2023-2032 (KILO TONS) 57
      21. TABLE 20 ADHESIVES & SEALANTS MARKET ESTIMATES & FORECAST, BY REGION, 2023-2032 (USD MILLION) 58
      22. TABLE 21 ADHESIVES & SEALANTS MARKET ESTIMATES & FORECAST, BY REGION, 2023-2032 (KILO TONS) 58
      23. TABLE 22 ADHESIVES & SEALANTS MARKET ESTIMATES & FORECAST, BY REGION, 2023-2032 (USD MILLION) 59
      24. TABLE 23 ADHESIVES & SEALANTS MARKET ESTIMATES & FORECAST, BY REGION, 2023-2032 (KILO TONS) 59
      25. TABLE 24 ADHESIVES & SEALANTS MARKET ESTIMATES & FORECAST, BY REGION, 2023-2032 (USD MILLION) 60
      26. TABLE 25 ADHESIVES & SEALANTS MARKET ESTIMATES & FORECAST, BY REGION, 2023-2032 (KILO TONS) 60
      27. TABLE 26 ADHESIVES & SEALANTS MARKET ESTIMATES & FORECAST, BY REGION, 2023-2032 (USD MILLION) 61
      28. TABLE 27 ADHESIVES & SEALANTS MARKET ESTIMATES & FORECAST, BY REGION, 2023-2032 (KILO TONS) 61
      29. TABLE 28 ADHESIVES & SEALANTS MARKET ESTIMATES & FORECAST, BY REGION, 2023-2032 (USD MILLION) 62
      30. TABLE 29 ADHESIVES & SEALANTS MARKET ESTIMATES & FORECAST, BY REGION, 2023-2032 (KILO TONS) 63
      31. TABLE 30 GLOBAL GUM ROSIN MARKET, BY REGION, 2023-2032 (USD MILLION) 65
      32. TABLE 31 GLOBAL GUM ROSIN MARKET, BY REGION, 2023-2032 (KILO TONS) 66
      33. TABLE 32 NORTH AMERICA: GUM ROSIN MARKET, BY COUNTRY, 2023-2032 (USD MILLION) 66
      34. TABLE 33 NORTH AMERICA: GUM ROSIN MARKET, BY COUNTRY, 2023-2032 (KILO TONS) 67
      35. TABLE 34 NORTH AMERICA: GUM ROSIN MARKET, BY TYPE, 2023-2032 (USD MILLION) 67
      36. TABLE 35 NORTH AMERICA: GUM ROSIN MARKET, BY TYPE, 2023-2032 (KILO TONS) 68
      37. TABLE 36 NORTH AMERICA: GUM ROSIN MARKET, BY APPLICATION, 2023-2032 (USD MILLION) 68
      38. TABLE 37 NORTH AMERICA: GUM ROSIN MARKET, BY APPLICATION, 2023-2032 (KILO TONS) 69
      39. TABLE 38 US: GUM ROSIN MARKET, BY TYPE, 2023-2032 (USD MILLION) 69
      40. TABLE 39 US: GUM ROSIN MARKET, BY TYPE, 2023-2032 (KILO TONS) 70
      41. TABLE 40 US: GUM ROSIN MARKET, BY APPLICATION, 2023-2032 (USD MILLION) 70
      42. TABLE 41 US: GUM ROSIN MARKET, BY APPLICATION, 2023-2032 (KILO TONS) 71
      43. TABLE 42 CANADA: GUM ROSIN MARKET, BY TYPE, 2023-2032 (USD MILLION) 71
      44. TABLE 43 CANADA: GUM ROSIN MARKET, BY TYPE, 2023-2032 (KILO TONS) 72
      45. TABLE 44 CANADA: GUM ROSIN MARKET, BY APPLICATION, 2023-2032 (USD MILLION) 72
      46. TABLE 45 CANADA: GUM ROSIN MARKET, BY APPLICATION, 2023-2032 (KILO TONS) 73
      47. TABLE 46 EUROPE: GUM ROSIN MARKET, BY COUNTRY, 2023-2032 (USD MILLION) 74
      48. TABLE 47 EUROPE: GUM ROSIN MARKET, BY COUNTRY, 2023-2032 (KILO TONS) 74
      49. TABLE 48 EUROPE: GUM ROSIN MARKET, BY TYPE, 2023-2032 (USD MILLION) 75
      50. TABLE 49 EUROPE: GUM ROSIN MARKET, BY TYPE, 2023-2032 (KILO TONS) 75
      51. TABLE 50 EUROPE: GUM ROSIN MARKET, BY APPLICATION, 2023-2032 (USD MILLION) 76
      52. TABLE 51 EUROPE: GUM ROSIN MARKET, BY APPLICATION, 2023-2032 (KILO TONS) 76
      53. TABLE 52 GERMANY: GUM ROSIN MARKET, BY TYPE, 2023-2032 (USD MILLION) 77
      54. TABLE 53 GERMANY: GUM ROSIN MARKET, BY TYPE, 2023-2032 (KILO TONS) 77
      55. TABLE 54 GERMANY: GUM ROSIN MARKET, BY APPLICATION, 2023-2032 (USD MILLION) 78
      56. TABLE 55 GERMANY: GUM ROSIN MARKET, BY APPLICATION, 2023-2032 (KILO TONS) 78
      57. TABLE 56 UK: GUM ROSIN MARKET, BY TYPE, 2023-2032 (USD MILLION) 79
      58. TABLE 57 UK: GUM ROSIN MARKET, BY TYPE, 2023-2032 (KILO TONS) 79
      59. TABLE 58 UK: GUM ROSIN MARKET, BY APPLICATION, 2023-2032 (USD MILLION) 80
      60. TABLE 59 UK: GUM ROSIN MARKET, BY APPLICATION, 2023-2032 (KILO TONS) 80
      61. TABLE 60 FRANCE: GUM ROSIN MARKET, BY TYPE, 2023-2032 (USD MILLION) 81
      62. TABLE 61 FRANCE: GUM ROSIN MARKET, BY TYPE, 2023-2032 (KILO TONS) 81
      63. TABLE 62 FRANCE: GUM ROSIN MARKET, BY APPLICATION, 2023-2032 (USD MILLION) 82
      64. TABLE 63 FRANCE: GUM ROSIN MARKET, BY APPLICATION, 2023-2032 (KILO TONS) 82
      65. TABLE 64 SPAIN: GUM ROSIN MARKET, BY TYPE, 2023-2032 (USD MILLION) 83
      66. TABLE 65 SPAIN: GUM ROSIN MARKET, BY TYPE, 2023-2032 (KILO TONS) 83
      67. TABLE 66 SPAIN: GUM ROSIN MARKET, BY APPLICATION, 2023-2032 (USD MILLION) 84
      68. TABLE 67 SPAIN: GUM ROSIN MARKET, BY APPLICATION, 2023-2032 (KILO TONS) 84
      69. TABLE 68 ITALY: GUM ROSIN MARKET, BY TYPE, 2023-2032 (USD MILLION) 85
      70. TABLE 69 ITALY: GUM ROSIN MARKET, BY TYPE, 2023-2032 (KILO TONS) 85
      71. TABLE 70 ITALY: GUM ROSIN MARKET, BY APPLICATION, 2023-2032 (USD MILLION) 86
      72. TABLE 71 ITALY: GUM ROSIN MARKET, BY APPLICATION, 2023-2032 (KILO TONS) 86
      73. TABLE 72 RUSSIA: GUM ROSIN MARKET, BY TYPE, 2023-2032 (USD MILLION) 87
      74. TABLE 73 RUSSIA: GUM ROSIN MARKET, BY TYPE, 2023-2032 (KILO TONS) 87
      75. TABLE 74 RUSSIA: GUM ROSIN MARKET, BY APPLICATION, 2023-2032 (USD MILLION) 88
      76. TABLE 75 RUSSIA: GUM ROSIN MARKET, BY APPLICATION, 2023-2032 (KILO TONS) 88
      77. TABLE 76 REST OF EUROPE: GUM ROSIN MARKET, BY TYPE, 2023-2032 (USD MILLION) 89
      78. TABLE 77 REST OF EUROPE: GUM ROSIN MARKET, BY TYPE, 2023-2032 (KILO TONS) 89
      79. TABLE 78 REST OF EUROPE: GUM ROSIN MARKET, BY APPLICATION, 2023-2032 (USD MILLION) 90
      80. TABLE 79 REST OF EUROPE: GUM ROSIN MARKET, BY APPLICATION, 2023-2032 (KILO TONS) 90
      81. TABLE 80 ASIA PACIFIC: GUM ROSIN MARKET, BY COUNTRY, 2023-2032 (USD MILLION) 91
      82. TABLE 81 ASIA PACIFIC: GUM ROSIN MARKET, BY COUNTRY, 2023-2032 (KILO TONS) 91
      83. TABLE 82 ASIA PACIFIC: GUM ROSIN MARKET, BY TYPE, 2023-2032 (USD MILLION) 92
      84. TABLE 83 ASIA PACIFIC: GUM ROSIN MARKET, BY TYPE, 2023-2032 (KILO TONS) 92
      85. TABLE 84 ASIA PACIFIC: GUM ROSIN MARKET, BY APPLICATION, 2023-2032 (USD MILLION) 93
      86. TABLE 85 ASIA PACIFIC: GUM ROSIN MARKET, BY APPLICATION, 2023-2032 (KILO TONS) 93
      87. TABLE 86 CHINA: GUM ROSIN MARKET, BY TYPE, 2023-2032 (USD MILLION) 94
      88. TABLE 87 CHINA: GUM ROSIN MARKET, BY TYPE, 2023-2032 (KILO TONS) 94
      89. TABLE 88 CHINA: GUM ROSIN MARKET, BY APPLICATION, 2023-2032 (USD MILLION) 95
      90. TABLE 89 CHINA: GUM ROSIN MARKET, BY APPLICATION, 2023-2032 (KILO TONS) 95
      91. TABLE 90 JAPAN: GUM ROSIN MARKET, BY TYPE, 2023-2032 (USD MILLION) 96
      92. TABLE 91 JAPAN: GUM ROSIN MARKET, BY TYPE, 2023-2032 (KILO TONS) 96
      93. TABLE 92 JAPAN: GUM ROSIN MARKET, BY APPLICATION, 2023-2032 (USD MILLION) 97
      94. TABLE 93 JAPAN: GUM ROSIN MARKET, BY APPLICATION, 2023-2032 (KILO TONS) 97
      95. TABLE 94 INDIA: GUM ROSIN MARKET, BY TYPE, 2023-2032 (USD MILLION) 98
      96. TABLE 95 INDIA: GUM ROSIN MARKET, BY TYPE, 2023-2032 (KILO TONS) 98
      97. TABLE 96 INDIA: GUM ROSIN MARKET, BY APPLICATION, 2023-2032 (USD MILLION) 99
      98. TABLE 97 INDIA: GUM ROSIN MARKET, BY APPLICATION, 2023-2032 (KILO TONS) 99
      99. TABLE 98 SOUTH KOREA: GUM ROSIN MARKET, BY TYPE, 2023-2032 (USD MILLION) 100
      100. TABLE 99 SOUTH KOREA: GUM ROSIN MARKET, BY TYPE, 2023-2032 (KILO TONS) 100
      101. TABLE 100 SOUTH KOREA: GUM ROSIN MARKET, BY APPLICATION, 2023-2032 (USD MILLION) 101
      102. TABLE 101 SOUTH KOREA: GUM ROSIN MARKET, BY APPLICATION, 2023-2032 (KILO TONS) 101
      103. TABLE 102 AUSTRALIA & NEW ZEALAND: GUM ROSIN MARKET, BY TYPE, 2023-2032 (USD MILLION) 102
      104. TABLE 103 AUSTRALIA & NEW ZEALAND: GUM ROSIN MARKET, BY TYPE, 2023-2032 (KILO TONS) 102
      105. TABLE 104 AUSTRALIA & NEW ZEALAND: GUM ROSIN MARKET, BY APPLICATION, 2023-2032 (USD MILLION) 103
      106. TABLE 105 AUSTRALIA & NEW ZEALAND: GUM ROSIN MARKET, BY APPLICATION, 2023-2032 (KILO TONS) 103
      107. TABLE 106 REST OF ASIA-PACIFIC: GUM ROSIN MARKET, BY TYPE, 2023-2032 (USD MILLION) 104
      108. TABLE 107 REST OF ASIA-PACIFIC: GUM ROSIN MARKET, BY TYPE, 2023-2032 (KILO TONS) 104
      109. TABLE 108 REST OF ASIA-PACIFIC: GUM ROSIN MARKET, BY APPLICATION, 2023-2032 (USD MILLION) 105
      110. TABLE 109 REST OF ASIA-PACIFIC: GUM ROSIN MARKET, BY APPLICATION, 2023-2032 (KILO TONS) 105
      111. TABLE 110 LATIN AMERICA: GUM ROSIN MARKET, BY COUNTRY, 2023-2032 (USD MILLION) 106
      112. TABLE 111 LATIN AMERICA: GUM ROSIN MARKET, BY COUNTRY, 2023-2032 (KILO TONS) 106
      113. TABLE 112 LATIN AMERICA: GUM ROSIN MARKET, BY TYPE, 2023-2032 (USD MILLION) 107
      114. TABLE 113 LATIN AMERICA: GUM ROSIN MARKET, BY TYPE, 2023-2032 (KILO TONS) 107
      115. TABLE 114 LATIN AMERICA: GUM ROSIN MARKET, BY APPLICATION, 2023-2032 (USD MILLION) 108
      116. TABLE 115 LATIN AMERICA: GUM ROSIN MARKET, BY APPLICATION, 2023-2032 (KILO TONS) 108
      117. TABLE 116 BRAZIL: GUM ROSIN MARKET, BY TYPE, 2023-2032 (USD MILLION) 109
      118. TABLE 117 BRAZIL: GUM ROSIN MARKET, BY TYPE, 2023-2032 (KILO TONS) 109
      119. TABLE 118 BRAZIL: GUM ROSIN MARKET, BY APPLICATION, 2023-2032 (USD MILLION) 110
      120. TABLE 119 BRAZIL: GUM ROSIN MARKET, BY APPLICATION, 2023-2032 (KILO TONS) 110
      121. TABLE 120 MEXICO: GUM ROSIN MARKET, BY TYPE, 2023-2032 (USD MILLION) 111
      122. TABLE 121 MEXICO: GUM ROSIN MARKET, BY TYPE, 2023-2032 (KILO TONS) 111
      123. TABLE 122 MEXICO: GUM ROSIN MARKET, BY APPLICATION, 2023-2032 (USD MILLION) 112
      124. TABLE 123 MEXICO: GUM ROSIN MARKET, BY APPLICATION, 2023-2032 (KILO TONS) 112
      125. TABLE 124 ARGENTINA: GUM ROSIN MARKET, BY TYPE, 2023-2032 (USD MILLION) 113
      126. TABLE 125 ARGENTINA: GUM ROSIN MARKET, BY TYPE, 2023-2032 (KILO TONS) 113
      127. TABLE 126 ARGENTINA: GUM ROSIN MARKET, BY APPLICATION, 2023-2032 (USD MILLION) 114
      128. TABLE 127 ARGENTINA: GUM ROSIN MARKET, BY APPLICATION, 2023-2032 (KILO TONS) 114
      129. TABLE 128 REST OF LATIN AMERICA: GUM ROSIN MARKET, BY TYPE, 2023-2032 (USD MILLION) 115
      130. TABLE 129 REST OF LATIN AMERICA: GUM ROSIN MARKET, BY TYPE, 2023-2032 (KILO TONS) 115
      131. TABLE 130 REST OF LATIN AMERICA: GUM ROSIN MARKET, BY APPLICATION, 2023-2032 (USD MILLION) 116
      132. TABLE 131 REST OF LATIN AMERICA: GUM ROSIN MARKET, BY APPLICATION, 2023-2032 (KILO TONS) 116
      133. TABLE 132 MIDDLE EAST & AFRICA: GUM ROSIN MARKET, BY COUNTRY, 2023-2032 (USD MILLION) 117
      134. TABLE 133 MIDDLE EAST & AFRICA: GUM ROSIN MARKET, BY COUNTRY, 2023-2032 (KILO TONS) 117
      135. TABLE 134 MIDDLE EAST & AFRICA: GUM ROSIN MARKET, BY TYPE, 2023-2032 (USD MILLION) 118
      136. TABLE 135 MIDDLE EAST & AFRICA: GUM ROSIN MARKET, BY TYPE, 2023-2032 (KILO TONS) 118
      137. TABLE 136 MIDDLE EAST & AFRICA: GUM ROSIN MARKET, BY APPLICATION, 2023-2032 (USD MILLION) 119
      138. TABLE 137 MIDDLE EAST & AFRICA: GUM ROSIN MARKET, BY APPLICATION, 2023-2032 (KILO TONS) 119
      139. TABLE 138 GCC COUNTRIES: GUM ROSIN MARKET, BY TYPE, 2023-2032 (USD MILLION) 120
      140. TABLE 139 GCC COUNTRIES: GUM ROSIN MARKET, BY TYPE, 2023-2032 (KILO TONS) 120
      141. TABLE 140 GCC COUNTRIES: GUM ROSIN MARKET, BY APPLICATION, 2023-2032 (USD MILLION) 121
      142. TABLE 141 GCC COUNTRIES: GUM ROSIN MARKET, BY APPLICATION, 2023-2032 (KILO TONS) 121
      143. TABLE 142 TURKEY: GUM ROSIN MARKET, BY TYPE, 2023-2032 (USD MILLION) 122
      144. TABLE 143 TURKEY: GUM ROSIN MARKET, BY TYPE, 2023-2032 (KILO TONS) 122
      145. TABLE 144 TURKEY: GUM ROSIN MARKET, BY APPLICATION, 2023-2032 (USD MILLION) 123
      146. TABLE 145 TURKEY: GUM ROSIN MARKET, BY APPLICATION, 2023-2032 (KILO TONS) 123
      147. TABLE 146 ISRAEL: GUM ROSIN MARKET, BY TYPE, 2023-2032 (USD MILLION) 124
      148. TABLE 147 ISRAEL: GUM ROSIN MARKET, BY TYPE, 2023-2032 (KILO TONS) 124
      149. TABLE 148 ISRAEL: GUM ROSIN MARKET, BY APPLICATION, 2023-2032 (USD MILLION) 125
      150. TABLE 149 ISRAEL: GUM ROSIN MARKET, BY APPLICATION, 2023-2032 (KILO TONS) 125
      151. TABLE 150 SOUTH AFRICA: GUM ROSIN MARKET, BY TYPE, 2023-2032 (USD MILLION) 126
      152. TABLE 151 SOUTH AFRICA: GUM ROSIN MARKET, BY TYPE, 2023-2032 (KILO TONS) 126
      153. TABLE 152 SOUTH AFRICA: GUM ROSIN MARKET, BY APPLICATION, 2023-2032 (USD MILLION) 127
      154. TABLE 153 SOUTH AFRICA: GUM ROSIN MARKET, BY APPLICATION, 2023-2032 (KILO TONS) 127
      155. TABLE 154 REST OF MIDDLE EAST & AFRICA: GUM ROSIN MARKET, BY TYPE, 2023-2032 (USD MILLION) 128
      156. TABLE 155 REST OF MIDDLE EAST & AFRICA: GUM ROSIN MARKET, BY TYPE, 2023-2032 (KILO TONS) 128
      157. TABLE 156 REST OF MIDDLE EAST & AFRICA: GUM ROSIN MARKET, BY APPLICATION, 2023-2032 (USD MILLION) 129
      158. TABLE 157 REST OF MIDDLE EAST & AFRICA: GUM ROSIN MARKET, BY APPLICATION, 2023-2032 (KILO TONS) 129
      159. TABLE 158 WUZHOU PINE CHEMICALS LTD.: PRODUCTS OFFERED 132
      160. TABLE 159 JINGGU FORESTRY CHEMICAL CO., LTD.: PRODUCTS OFFERED 134
      161. TABLE 160 JIANGMEN XINHUI OVERSEAS CHINESE INDUSTRY DEVELOPMENT CO., LTD.: PRODUCTS OFFERED 136
      162. TABLE 161 WUZHOU SUN SHINE FORESTRY AND CHEMICALS CO., LTD.: PRODUCTS OFFERED 138
      163. TABLE 162 GRUPO RB: PRODUCTS OFFERED 140
      164. TABLE 163 FORESTAR CHEMICAL CO., LTD.: PRODUCTS OFFERED 142
      165. TABLE 164 PERUM PERHUTANI: PRODUCTS OFFERED 145
      166. TABLE 165 PT. NAVAL OVERSEAS: PRODUCTS OFFERED 147
      167. TABLE 166 PUNJAB ROSIN AND CHEMICALS WORK: PRODUCTS OFFERED 149
      168. TABLE 167 PINOPINE: PRODUCTS OFFERED 151   LIST OF FIGURES
      169. FIGURE 1 MARKET SYNOPSIS 16
      170. FIGURE 2 MARKET ATTRACTIVENESS ANALYSIS: GUM ROSIN MARKET, 2020 17
      171. FIGURE 3 GUM ROSIN MARKET ANALYSIS BY TYPE 18
      172. FIGURE 4 GUM ROSIN MARKET ANALYSIS BY APPLICATION 19
      173. FIGURE 5 GUM ROSIN MARKET ANALYSIS BY REGION 20
      174. FIGURE 6 GUM ROSIN MARKET: MARKET STRUCTURE 22
      175. FIGURE 7 RESEARCH PROCESS OF MRFR 23
      176. FIGURE 8 MARKET DYNAMICS OVERVIEW 30
      177. FIGURE 9 GLOBAL PAPER CONSUMPTION - 2023-2032 (MILLION METRIC TONS) 32
      178. FIGURE 10 GLOBAL CONSTRUCTION MARKET, 2020-2030 (USD TRILLION) 33
      179. FIGURE 11 DRIVERS IMPACT ANALYSIS 33
      180. FIGURE 12 RESTRAINTS IMPACT ANALYSIS 34
      181. FIGURE 13 GLOBAL GUM ROSIN EXPORTS 37
      182. FIGURE 14 GLOBAL GUM ROSIN PRODUCTION 37
      183. FIGURE 15 SUPPLY CHAIN ANALYSIS FOR THE GUM ROSIN MARKET 38
      184. FIGURE 16 PORTER''S FIVE FORCES ANALYSIS OF THE GLOBAL GUM ROSIN MARKET 40
      185. FIGURE 17 GLOBAL GUM ROSIN MARKET, BY TYPE, 2023-2032 (USD MILLION) 45
      186. FIGURE 18 GLOBAL GUM ROSIN MARKET, BY TYPE, 2023-2032 (KILO TONS) 46
      187. FIGURE 19 GLOBAL GUM ROSIN MARKET, BY APPLICATION, 2023-2032 (USD MILLION) 54
      188. FIGURE 20 GLOBAL GUM ROSIN MARKET, BY APPLICATION, 2023-2032 (KILO TONS) 55
      189. FIGURE 21 GLOBAL GUM ROSIN MARKET, BY REGION, 2023-2032 (USD MILLION) 64
      190. FIGURE 22 GLOBAL GUM ROSIN MARKET, BY REGION, 2023-2032 (KILO TONS) 65
      191. FIGURE 23 COMPETITIVE BENCHMARKING 131
      192. FIGURE 24 WUZHOU PINE CHEMICALS LTD.: SWOT ANALYSIS 133
      193. FIGURE 25 JINGGU FORESTRY CHEMICAL CO., LTD.: SWOT ANALYSIS 135
      194. FIGURE 26 JIANGMEN XINHUI OVERSEAS CHINESE INDUSTRY DEVELOPMENT CO., LTD.: SWOT ANALYSIS 137
      195. FIGURE 27 WUZHOU SUN SHINE FORESTRY AND CHEMICALS CO., LTD.: SWOT ANALYSIS 139
      196. FIGURE 28 GRUPO RB: SWOT ANALYSIS 141
      197. FIGURE 29 FORESTAR CHEMICAL CO., LTD.: SWOT ANALYSIS 143
      198. FIGURE 30 PERUM PERHUTANI: FINANCIAL OVERVIEW SNAPSHOT 145
      199. FIGURE 31 PERUM PERHUTANI: SWOT ANALYSIS 146
      200. FIGURE 32 PT. NAVAL OVERSEAS: SWOT ANALYSIS 148
      201. FIGURE 33 PUNJAB ROSIN AND CHEMICALS WORK: SWOT ANALYSIS 150
      202. FIGURE 34 PINOPINE: SWOT ANALYSIS 152

    Gum Rosin Type Outlook (USD Billion, 2018-2032)

    • WW
    • WG
    • K
    • X
    • Others

    Gum Rosin Product Type Outlook (USD Billion, 2018-2032)

    • Adhesive & Sealants
    • Rubber
    • Paint & Coatings
    • Printing Inks
    • Food & Beverage
    • Others

    Gum Rosin Regional Outlook (USD Billion, 2018-2032)

    • North America Outlook (USD Billion, 2018-2032)

      • North America Gum Rosin by Type
        • WW
        • WG
        • K
        • X
        • Others
      • North America Gum Rosin by Product Type
        • Adhesive & Sealants
        • Rubber
        • Paint & Coatings
        • Printing Inks
        • Food & Beverage
        • Others
      • US Outlook (USD Billion, 2018-2032)

      • US Gum Rosin by Type
        • WW
        • WG
        • K
        • X
        • Others
      • US Gum Rosin by Product Type
        • Adhesive & Sealants
        • Rubber
        • Paint & Coatings
        • Printing Inks
        • Food & Beverage
        • Others
      • Canada Outlook (USD Billion, 2018-2032)

      • Canada Gum Rosin by Type
        • WW
        • WG
        • K
        • X
        • Others
      • Canada Gum Rosin by Product Type
        • Adhesive & Sealants
        • Rubber
        • Paint & Coatings
        • Printing Inks
        • Food & Beverage
        • Others
    • Europe Outlook (USD Billion, 2018-2032)

      • Europe Gum Rosin by Type
        • WW
        • WG
        • K
        • X
        • Others
      • Europe Gum Rosin by Product Type
        • Adhesive & Sealants
        • Rubber
        • Paint & Coatings
        • Printing Inks
        • Food & Beverage
        • Others
      • Germany Outlook (USD Billion, 2018-2032)

      • Germany Gum Rosin by Type
        • WW
        • WG
        • K
        • X
        • Others
      • Germany Gum Rosin by Product Type
        • Adhesive & Sealants
        • Rubber
        • Paint & Coatings
        • Printing Inks
        • Food & Beverage
        • Others
      • France Outlook (USD Billion, 2018-2032)

      • France Gum Rosin by Type
        • WW
        • WG
        • K
        • X
        • Others
      • France Gum Rosin by Product Type
        • Adhesive & Sealants
        • Rubber
        • Paint & Coatings
        • Printing Inks
        • Food & Beverage
        • Others
      • UK Outlook (USD Billion, 2018-2032)

      • UK Gum Rosin by Type
        • WW
        • WG
        • K
        • X
        • Others
      • UK Gum Rosin by Product Type
        • Adhesive & Sealants
        • Rubber
        • Paint & Coatings
        • Printing Inks
        • Food & Beverage
        • Others
      • Italy Outlook (USD Billion, 2018-2032)

      • Italy Gum Rosin by Type
        • WW
        • WG
        • K
        • X
        • Others
      • Italy Gum Rosin by Product Type
        • Adhesive & Sealants
        • Rubber
        • Paint & Coatings
        • Printing Inks
        • Food & Beverage
        • Others
      • Spain Outlook (USD Billion, 2018-2032)

      • Spain Gum Rosin by Type
        • WW
        • WG
        • K
        • X
        • Others
      • Spain Gum Rosin by Product Type
        • Adhesive & Sealants
        • Rubber
        • Paint & Coatings
        • Printing Inks
        • Food & Beverage
        • Others
      • Rest Of Europe Outlook (USD Billion, 2018-2032)

      • Rest Of Europe Gum Rosin by Type
        • WW
        • WG
        • K
        • X
        • Others
      • Rest Of Europe Gum Rosin by Product Type
        • Adhesive & Sealants
        • Rubber
        • Paint & Coatings
        • Printing Inks
        • Food & Beverage
        • Others
    • Asia-Pacific Outlook (USD Billion, 2018-2032)

      • Asia-Pacific Gum Rosin by Type
        • WW
        • WG
        • K
        • X
        • Others
      • Asia-Pacific Gum Rosin by Product Type
        • Adhesive & Sealants
        • Rubber
        • Paint & Coatings
        • Printing Inks
        • Food & Beverage
        • Others
      • China Outlook (USD Billion, 2018-2032)

      • China Gum Rosin by Type
        • WW
        • WG
        • K
        • X
        • Others
      • China Gum Rosin by Product Type
        • Adhesive & Sealants
        • Rubber
        • Paint & Coatings
        • Printing Inks
        • Food & Beverage
        • Others
      • Japan Outlook (USD Billion, 2018-2032)

      • Japan Gum Rosin by Type
        • WW
        • WG
        • K
        • X
        • Others
      • Japan Gum Rosin by Product Type
        • Adhesive & Sealants
        • Rubber
        • Paint & Coatings
        • Printing Inks
        • Food & Beverage
        • Others
      • India Outlook (USD Billion, 2018-2032)

      • India Gum Rosin by Type
        • WW
        • WG
        • K
        • X
        • Others
      • India Gum Rosin by Product Type
        • Adhesive & Sealants
        • Rubber
        • Paint & Coatings
        • Printing Inks
        • Food & Beverage
        • Others
      • Australia Outlook (USD Billion, 2018-2032)

      • Australia Gum Rosin by Type
        • WW
        • WG
        • K
        • X
        • Others
      • Australia Gum Rosin by Product Type
        • Adhesive & Sealants
        • Rubber
        • Paint & Coatings
        • Printing Inks
        • Food & Beverage
        • Others
      • Rest of Asia-Pacific Outlook (USD Billion, 2018-2032)

      • Rest of Asia-Pacific Gum Rosin by Type
        • WW
        • WG
        • K
        • X
        • Others
      • Rest of Asia-Pacific Gum Rosin by Product Type
        • Adhesive & Sealants
        • Rubber
        • Paint & Coatings
        • Printing Inks
        • Food & Beverage
        • Others
    • Rest of the World Outlook (USD Billion, 2018-2032)

      • Rest of the World Gum Rosin by Type
        • WW
        • WG
        • K
        • X
        • Others
      • Rest of the World Gum Rosin by Product Type
        • Adhesive & Sealants
        • Rubber
        • Paint & Coatings
        • Printing Inks
        • Food & Beverage
        • Others
      • Middle East Outlook (USD Billion, 2018-2032)

      • Middle East Gum Rosin by Type
        • WW
        • WG
        • K
        • X
        • Others
      • Middle East Gum Rosin by Product Type
        • Adhesive & Sealants
        • Rubber
        • Paint & Coatings
        • Printing Inks
        • Food & Beverage
        • Others
      • Africa Outlook (USD Billion, 2018-2032)

      • Africa Gum Rosin by Type
        • WW
        • WG
        • K
        • X
        • Others
      • Africa Gum Rosin by Product Type
        • Adhesive & Sealants
        • Rubber
        • Paint & Coatings
        • Printing Inks
        • Food & Beverage
        • Others
      • Latin America Outlook (USD Billion, 2018-2032)

      • Latin America Gum Rosin by Type
        • WW
        • WG
        • K
        • X
        • Others
      • Latin America Gum Rosin by Product Type
        • Adhesive & Sealants
        • Rubber
        • Paint & Coatings
        • Printing Inks
        • Food & Beverage
        • Others
    Infographic

    Free Sample Request

    Kindly complete the form below to receive a free sample of this Report

    Get Free Sample

    Customer Strories

    “I am very pleased with how market segments have been defined in a relevant way for my purposes (such as "Portable Freezers & refrigerators" and "last-mile"). In general the report is well structured. Thanks very much for your efforts.”

    Victoria Milne

    Founder
    Case Study
    Chemicals and Materials