• Cat-intel
  • MedIntelliX
  • Resources
  • About Us
  • Hero Background
    English
    Chinese
    French
    Japanese
    Korean
    German
    Spanish

    Graphical User Interface Design Software Market Share

    ID: MRFR/ICT/9228-CR
    100 Pages
    Shubham Munde
    October 2021

    Graphical User Interface Design Software Market Research Report: Information By Deployment (On Cloud and On-premises), By Organization Size (SMEs, and Large Enterprises), By Vertical (Automotive, IT & Telecommunication, Media & Entertainment, Medical & Healthcare, and Manufacturing), And By Region (North America, Europe, Asia-Pacific, And Rest Of The World) –Market Forecast Till 2035.

    Share:
    Download PDF ×

    We do not share your information with anyone. However, we may send you emails based on your report interest from time to time. You may contact us at any time to opt-out.

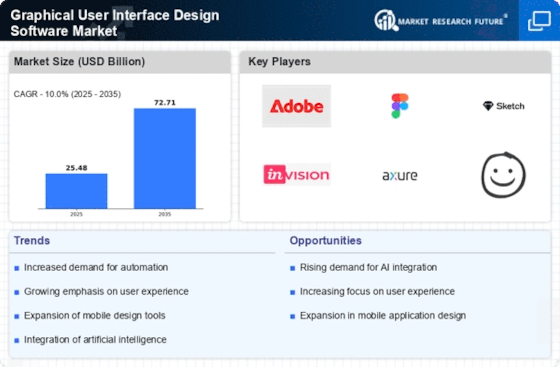
    Graphical User Interface Design Software Market Infographic
    Purchase Options

    Market Share

    Graphical User Interface Design Software Market Share Analysis

    As technology continues to advance rapidly, it's anticipated to create numerous lucrative opportunities for market players in the foreseeable future. Artificial Intelligence (AI) stands out as a widely discussed and versatile topic, finding applications across various domains, from matchmaking to autonomous vehicles. This trend has extended into the realm of user interface design tools.

    Presently, AI-based UI development products like Uizard are in their developmental stages and haven't yet matured to replace human UI developers. However, they serve as valuable assistants to UI developers, offering support and aiding in the design process. Over the next few years, the global market is poised to see advancements and refinements in AI products, potentially leading these assistants to assume more responsibilities currently handled by experienced UI developers.

    This shift indicates the importance for UI developers to adapt and prepare for evolving trends by acquiring new skills, often referred to as "reskilling." AI-based GUI design software is expected to revolutionize interface creation by offering more creativity and customization to meet the demands of future interfaces. Consequently, the rapid advancements in GUI design software, particularly those integrating AI, are foreseen to create enticing growth prospects for companies operating in the global GUI design software market.

    Small and medium enterprises (SMEs) worldwide are experiencing rapid growth, presenting substantial revenue prospects for the market. This growth is fueled by increased outsourcing to smaller interface design companies, offering more affordable development services. Additionally, SMEs have gained significant traction in software development, contributing to the demand for GUI design tools.

    GUI design tools are conveniently available through subscription-based, cloud-based models. This accessibility presents an opportunity for GUI design companies to expand their clientele and generate significant profits in the market. Moreover, creative interfaces have become a primary focus for application developers within SMEs, further driving the adoption of GUI design tools among them.

    The SME market segment is anticipated to demonstrate the quickest growth within the graphical user interface (GUI) design software market during the forecast period. Consequently, the escalating adoption of GUI design tools among SMEs is poised to create substantial growth opportunities for vendors operating in the global GUI design software market.

    Author
    Shubham Munde
    Research Analyst Level II

    With a technical background in information technology & semiconductors, Shubham has 4.5+ years of experience in market research and analytics with the tasks of data mining, analysis, and project execution. He is the POC for our clients, for their consulting projects running under the ICT/Semiconductor domain. Shubham holds a Bachelor’s in Information and Technology and a Master of Business Administration (MBA). Shubham has executed over 150 research projects for our clients under the brand name Market Research Future in the last 2 years. His core skill is building the research respondent relation for gathering the primary information from industry and market estimation for niche markets. He is having expertise in conducting secondary & primary research, market estimations, market projections, competitive analysis, analysing current market trends and market dynamics, deep-dive analysis on market scenarios, consumer behaviour, technological impact analysis, consulting, analytics, etc. He has worked on fortune 500 companies' syndicate and consulting projects along with several government projects. He has worked on the projects of top tech brands such as IBM, Google, Microsoft, AWS, Meta, Oracle, Cisco Systems, Samsung, Accenture, VMware, Schneider Electric, Dell, HP, Ericsson, and so many others. He has worked on Metaverse, Web 3.0, Zero-Trust security, cyber-security, blockchain, quantum computing, robotics, 5G technology, High-Performance computing, data centers, AI, automation, IT equipment, sensors, semiconductors, consumer electronics and so many tech domain projects.

    Leave a Comment

    FAQs

    How much is the Graphical User Interface Design Software market?

    The Graphical User Interface Design Software market size was valued at USD 22.85 Billion in 2023.

    What is the growth rate of the Graphical User Interface Design Software market?

    The market is projected to grow at a CAGR of 10.00% during the forecast period, 2024-2032.

    Which region held the largest market share in the Graphical User Interface Design Software market?

    Asia-Pacific had the largest share of the market.

    Who are the key players in the Graphical User Interface Design Software market?

    The key players in the market are Adobe (U.S.), Webflow (U.S.), Balsamiq Studios LLC (U.S.), Axure Software Solutions Inc. (U.S.), Altia Inc. (U.S.), Corel Corporation (U.S.), Figma (U.S.), Sketch B.V. (Netherlands), InVisionApp Inc. (U.S.), Caretta Software Ltd. (U.K.), Pidoco GmbH (Germany), Crank Software Inc. (Canada), Extron (U.K.).

    Which deployment led the Graphical User Interface Design Software market?

    The on-cloud category dominated the market in 2022.

    Which organization size had the largest market share in the Graphical User Interface Design Software market?

    SMEs had the largest share of the market.

    Which vertical had the largest Graphical User Interface Design Software market share?

    I.T. & Telecommunication had the largest share of the market.

    Market Summary

    As per Market Research Future Analysis, the Graphical User Interface Design Software Market is projected to grow from USD 25.48 Billion in 2024 to USD 72.71 Billion by 2035, with a CAGR of 10.00% during the forecast period. The market was valued at USD 25.48 Billion in 2024. Key drivers include the rising demand for user-friendly interfaces across industries such as automotive and medical, along with the growing emphasis on collaboration and prototyping tools. The on-cloud deployment segment is leading the market, particularly among SMEs, while the IT & telecommunication vertical generates the most revenue. North America is expected to dominate the market due to technological advancements and a strong presence of software companies.

    Key Market Trends & Highlights

    The market is witnessing significant trends that are shaping its future.

    • CAGR of 10.00% from 2024 to 2032.
    • On-cloud deployment segment is leading, driven by SMEs' demand for flexibility.
    • AI integration enhances productivity and automates repetitive tasks.
    • Low-code/no-code platforms democratize GUI design, expediting development.

    Market Size & Forecast

    2024 Market Size USD 25.48 Billion
    2035 Market Size USD 72.71 Billion
    CAGR 10.00%
    Largest Regional Market Share in 2024 North America.

    Major Players

    Key players include Adobe (U.S.), Figma (U.S.), Axure Software Solutions Inc. (U.S.), and Webflow (U.S.).

    Market Trends

    Growing emphasis on collaboration and prototyping tools is driving the market growth

    Market CAGR for graphical user interface design software is driven by the rising number of emphases on collaboration and prototyping tools. Collaboration and prototyping have become integral parts of the GUI design process, facilitating effective communication and feedback among designers, developers, and stakeholders. To cater to this need, graphical user interface design software has increasingly focused on providing robust collaboration and prototyping tools. These tools enable real-time collaboration, version control, and interactive prototyping, fostering iterative design and seamless collaboration among team members.

    The emphasis on collaboration and prototyping tools addresses the evolving needs of multidisciplinary design teams and the growing importance of user feedback. Real-time collaboration features allow designers to work together on a single interface, regardless of physical location, enhancing productivity and reducing coordination challenges. Interactive prototyping features enable designers to create and test functional prototypes, gathering valuable user feedback before the final implementation.

    Artificial intelligence has revolutionized various industries, and GUI design is no exception. AI-powered features are integrated into graphical user interface design software to enhance productivity, automate repetitive tasks, and provide intelligent design suggestions. Machine learning algorithms can analyze user behavior, preferences, and data patterns to generate personalized recommendations and optimize the user experience. A.I. capabilities in GUI design software offer multiple advantages. Firstly, they automate time-consuming tasks, such as resizing and aligning elements, freeing designers to focus on more creative aspects. Secondly, AI-powered design assistants can provide real-time feedback and suggestions, improving the efficiency and quality of the design process.

    Furthermore, A.I. algorithms can analyze user interactions and optimize GUIs based on user feedback, leading to more user-centric and intuitive interfaces.

    One of the notable trends in the graphical user interface design software market is the emergence of low-code and no-code platforms. These platforms enable users with minimal coding knowledge to design and develop GUIs through intuitive drag-and-drop interfaces and pre-built components. Low-code/no-code platforms empower non-technical users to create applications and interfaces rapidly, reducing the dependency on skilled developers. The rise of low-code/no-code media has several implications. Firstly, it democratizes the GUI design process, allowing individuals with limited coding expertise to participate actively.

    This trend has the potential to foster innovation by enabling a broader range of individuals to contribute to the development of software applications. Secondly, low-code/no-code platforms expedite the development process, allowing businesses to bring their applications to market faster. This trend aligns with the growing need for agile development methodologies and accelerated time-to-market.

    For instance, the graphical user interface design software market is undergoing significant transformations driven by key trends. The rise of low-code/no-code platforms democratizes GUI design, empowering non-technical users and accelerating application development. Integrating A.I. capabilities enhances productivity, automates repetitive tasks, and provides intelligent design suggestions. Additionally, the emphasis on collaboration and prototyping tools fosters effective communication, iterative design, and user feedback integration.

    As the demand for intuitive and visually appealing software applications continues to grow, these trends are expected to shape the future of GUI design software, enabling the creation of user-centric interfaces with increased efficiency and collaboration capabilities, driving the Graphical User Interface Design Software market revenue.

    The ongoing evolution of user experience design is reshaping the landscape of graphical user interface design software, as organizations increasingly prioritize intuitive and accessible digital interactions.

    U.S. Department of Commerce

    Graphical User Interface Design Software Market Market Drivers

    Market Growth Projections

    The Global Graphical User Interface Design Software Market Industry is projected to experience substantial growth in the coming years. With a market value of 235.94 USD Billion in 2024, the industry is expected to expand significantly, reaching 541.32 USD Billion by 2035. This growth trajectory indicates a compound annual growth rate of 7.84% from 2025 to 2035. Such projections reflect the increasing reliance on sophisticated design tools across various sectors, driven by the need for enhanced user experiences and improved interface functionality. The anticipated growth underscores the importance of GUI design software in shaping the future of digital interactions.

    Focus on Cross-Platform Compatibility

    Cross-platform compatibility emerges as a significant driver within the Global Graphical User Interface Design Software Market Industry. As organizations seek to reach wider audiences, the demand for software that functions seamlessly across multiple platforms intensifies. This requirement compels designers to utilize advanced GUI design tools that facilitate the creation of consistent user experiences, regardless of the device or operating system. The emphasis on cross-platform solutions is particularly pronounced in industries such as gaming and education, where user retention is closely linked to interface quality. This trend is likely to contribute to the market's expansion, as businesses prioritize versatile design solutions.

    Rising Demand for User-Centric Design

    The Global Graphical User Interface Design Software Market Industry experiences a notable surge in demand for user-centric design solutions. As businesses increasingly prioritize user experience, the need for intuitive and aesthetically pleasing interfaces becomes paramount. This trend is evident in sectors such as e-commerce and mobile applications, where user engagement directly correlates with design quality. Companies are investing in advanced GUI design tools to enhance usability and accessibility, thereby driving market growth. The industry's projected value of 235.94 USD Billion in 2024 underscores this shift towards prioritizing user experience in software design.

    Growing Importance of Data Visualization

    Data visualization is increasingly recognized as a crucial component of effective communication within the Global Graphical User Interface Design Software Market Industry. As organizations accumulate vast amounts of data, the ability to present this information in a visually appealing and comprehensible manner becomes essential. GUI design software that specializes in data visualization enables businesses to transform complex datasets into intuitive graphics, enhancing decision-making processes. This trend is particularly relevant in sectors such as finance and marketing, where data-driven insights are paramount. The rising demand for effective data visualization tools is likely to propel market growth in the coming years.

    Increased Adoption of Mobile Applications

    The proliferation of mobile applications significantly influences the Global Graphical User Interface Design Software Market Industry. As mobile devices become ubiquitous, businesses are compelled to develop applications that cater to diverse user needs. This trend necessitates the use of sophisticated GUI design software to create responsive and adaptive interfaces that function seamlessly across various devices. The growing emphasis on mobile-first design strategies is evident in sectors such as healthcare and finance, where user engagement is critical. Consequently, the market is poised for robust growth, with a compound annual growth rate of 7.84% projected from 2025 to 2035.

    Technological Advancements in Design Tools

    Technological advancements play a pivotal role in shaping the Global Graphical User Interface Design Software Market Industry. Innovations such as artificial intelligence and machine learning are being integrated into design software, enabling designers to create more efficient and effective interfaces. These technologies facilitate predictive analytics, allowing for data-driven design decisions that enhance user engagement. Furthermore, the rise of cloud-based solutions enables real-time collaboration among design teams, streamlining the design process. As a result, the market is expected to grow significantly, with a projected value of 541.32 USD Billion by 2035, reflecting the impact of these advancements.

    Market Segment Insights

    Graphical User Interface Design Software Deployment Insights

    The Graphical User Interface Design Software market segmentation, based on deployment, includes on-cloud and on-premises. The on-cloud segment dominated the market. This deployment method offers scalability, flexibility, and cost-effectiveness, making it popular among small and medium-sized enterprises (SMEs) and organizations looking for convenient remote access. The cloud-based segment is expected to grow substantially due to adoption of cloud computing technologies.

    Graphical User Interface Design Software Organization Size Insights

    The Graphical User Interface Design Software market segmentation, based on organization size, includes SMEs and large enterprises. The SMEs category generated the most income. These organizations often have limited resources and budget constraints, making cloud-based GUI design software attractive. GUI design software providers catering to SMEs typically offer affordable pricing plans, intuitive interfaces, and collaboration features to meet their needs.

    Graphical User Interface Design Software Vertical Insights

    The Graphical User Interface Design Software market segmentation, based on vertical, includes automotive, IT & telecommunication, media & entertainment, medical & healthcare, and manufacturing. The I.T. & telecommunication categories generated the most income. These industries heavily rely on software applications and platforms, and effective GUI design is crucial for enhancing user experiences. GUI design software providers catering to this vertical focus on features like prototyping, wireframing, and collaboration tools to enable efficient development and deployment of innovative user interfaces.

    Figure 2: Graphical User Interface Design Software Market, by Vertical, 2022 & 2032 (USD Billion)

    Source: Secondary Research, Primary Research, Market Research Future Database, and Analyst Review

    Get more detailed insights about Graphical User Interface Design Software Market Research Report—Global Forecast till 2035

    Regional Insights

    By region, the study provides market insights into North America, Europe, Asia-Pacific, and the Rest of the World. The North American Graphical User Interface Design Software market will have significant growth in this market due to the presence of major software companies and technological advancements in the region. The United States, in particular, is a key contributor to market growth, driven by the strong adoption of GUI design software in industries such as I.T., healthcare, and finance.

    The region's focus on innovation and user experience has fueled the demand for GUI design tools, leading to the development of new software solutions.

    Further, the major countries studied in the market report are The US, Canada, German, France, the U.K., Italy, Spain, China, Japan, India, Australia, South Korea, and Brazil.

    Figure 3: GRAPHICAL USER INTERFACE DESIGN SOFTWARE MARKET SHARE BY REGION 2022 (USD Billion)

    GRAPHICAL USER INTERFACE DESIGN SOFTWARE MARKET SHARE BY REGION 2022

    Source: Secondary Research, Primary Research, Market Research Future Database, and Analyst Review

    Europe's Graphical User Interface Design Software market has significant growth in market share due to the region's well-established I.T. infrastructure, coupled with the growing emphasis on digital transformation, which has increased the adoption of GUI design software across various sectors. Additionally, many design agencies and creative professionals have further boosted the demand for GUI design tools in Europe. Further, the German Graphical User Interface Design Software market held the largest market share, and the U.K. Graphical User Interface Design Software market was the significant-growing market in the European region.

    The Asia-Pacific Graphical User Interface Design Software Market will dominate the CAGR from 2023 to 2032. It is due to the increasing penetration of smartphones, rising internet connectivity, and the growth of e-commerce. Countries are at the forefront of this growth, with many software development firms and tech startups adopting GUI design software to enhance their products' user experience. The region's expanding I.T. industry and government initiatives to promote digitalization have also contributed to market growth.

    Moreover, China’s Graphical User Interface Design Software market had the largest market share, and the Indian Graphical User Interface Design Software market was the fastest-growing market in the Asia-Pacific region.

    Key Players and Competitive Insights

    Leading market players are investing heavily in research and development to expand their product lines, contributing even more to the Graphical User Interface Design Software market growth. Market participants are also undertaking various strategic activities to expand their footprint, with important market developments including new product launches, contractual agreements, mergers and acquisitions, higher investments, and collaboration with other organizations. The Graphical User Interface Design Software industry must offer cost-effective items to spread and survive in a more competitive and rising market climate.

    Manufacturing locally to minimize operational costs is one of the key business tactics manufacturers use in the Graphical User Interface Design Software industry to benefit clients and increase the market sector. The Graphical User Interface Design Software industry has offered some of the most significant medical advantages in recent years.

    Major players in the Graphical User Interface Design Software market, including Adobe (U.S.), Webflow (U.S.), Balsamiq Studios LLC (U.S.), Axure Software Solutions Inc. (U.S.), Altia Inc. (U.S.), Corel Corporation (U.S.), Figma (U.S.), Sketch B.V. (Netherlands), InVisionApp Inc. (U.S.), Caretta Software Ltd. (U.K.), Pidoco GmbH (Germany), Crank Software Inc. (Canada), Extron (U.K.), and others, are attempting to increase market demand by investing in research and development operations.

    Walter Woltosz’s Simulations Plus, Inc., founded in 1996 in Lancaster, California, United States, is a software company. It develops absorption, distribution, excretion, and toxicity modeling and simulation software for pharmaceutical, industrial chemicals, cosmetics, and food ingredients. Its products include GastroPlus, Med Chem Designer, membrane plus, and DDD Plus. In February 2023, Simulations Plus, Inc., a service that provides modeling and simulation software for pharmaceutical safety and adequacy, announced the release of NAFLDsym v2B Beta, a quantitative systems pharmacology software to support the development of treatments for nonalcoholic steatohepatitis (NASH).

    Dylan Field and Evan Wallace's Figma, founded in 2016, is a web application for interface design with offline features enabled by desktop applications for MacOS and Windows. It focuses on user interface and experience design utilizing various vector graphics editors and prototyping tools. In April 2021, Figma acquired Visly, a design tool for front-end engineers. The company has started using the device in its product stack for fast and excellent collaboration between design and engineering.

    Key Companies in the Graphical User Interface Design Software Market market include

    Industry Developments

    November 2022: Microsoft introduced a new U.I. experience for trying out computer vision with Vision Studio.

    August 2021: Adobe agreed to acquire Frameo.io, a cloud-based video collaboration platform.

    Future Outlook

    Graphical User Interface Design Software Market Future Outlook

    The Graphical User Interface Design Software Market is projected to grow at 10.00% CAGR from 2025 to 2035, driven by increasing demand for user-centric design and technological advancements.

    New opportunities lie in:

    • Develop AI-driven design tools to enhance user experience and streamline workflows.
    • Expand into emerging markets with localized software solutions tailored to regional needs.
    • Leverage cloud-based platforms for collaborative design processes and real-time feedback.

    By 2035, the market is expected to achieve substantial growth, reflecting evolving design needs and technological integration.

    Market Segmentation

    Graphical User Interface Design Software Regional Outlook

    • US
    • Canada

    Graphical User Interface Design Software Vertical Outlook

    • Automotive
    • IT & Telecommunication
    • Media & Entertainment
    • Medical & Healthcare
    • Manufacturing

    Graphical User Interface Design Software Deployment Outlook

    • On-Cloud
    • On-Premises

    Graphical User Interface Design Software Organization Size Outlook

    • SMEs
    • Large Enterprises

    Report Scope

    Report Attribute/Metric Details
    Market Size 2024 USD 25.47775 Billion
    Market Size 2035 72.71 (Value (USD Billion))
    Compound Annual Growth Rate (CAGR) 10.00% (2025 - 2035)
    Base Year 2024
    Market Forecast Period 2025 - 2035
    Historical Data 2018- 2022
    Market Forecast Units Value (USD Billion)
    Report Coverage Revenue Forecast, Market Competitive Landscape, Growth Factors, and Trends
    Segments Covered Deployment, Organization Size, Vertical, and Region
    Geographies Covered North America, Europe, Asia Pacific, and the Rest of the World
    Countries Covered The US, Canada, German, France, UK, Italy, Spain, China, Japan, India, Australia, South Korea, and Brazil
    Key Companies Profiled Adobe (U.S.), Webflow (U.S.), Balsamiq Studios LLC (U.S.), Axure Software Solutions Inc. (U.S.), Altia Inc. (U.S.), Corel Corporation (U.S.), Figma (U.S.), Sketch B.V. (Netherlands), InVisionApp Inc. (U.S.), Caretta Software Ltd. (U.K.), Pidoco GmbH (Germany), Crank Software Inc. (Canada), Extron (U.K.).
    Key Market Opportunities Rising adoption of graphical user interface among SMEs.
    Key Market Dynamics Rising demand for implementing user-friendly and attractive user interfaces.
    Market Size 2025 28.03 (Value (USD Billion))

    FAQs

    How much is the Graphical User Interface Design Software market?

    The Graphical User Interface Design Software market size was valued at USD 22.85 Billion in 2023.

    What is the growth rate of the Graphical User Interface Design Software market?

    The market is projected to grow at a CAGR of 10.00% during the forecast period, 2024-2032.

    Which region held the largest market share in the Graphical User Interface Design Software market?

    Asia-Pacific had the largest share of the market.

    Who are the key players in the Graphical User Interface Design Software market?

    The key players in the market are Adobe (U.S.), Webflow (U.S.), Balsamiq Studios LLC (U.S.), Axure Software Solutions Inc. (U.S.), Altia Inc. (U.S.), Corel Corporation (U.S.), Figma (U.S.), Sketch B.V. (Netherlands), InVisionApp Inc. (U.S.), Caretta Software Ltd. (U.K.), Pidoco GmbH (Germany), Crank Software Inc. (Canada), Extron (U.K.).

    Which deployment led the Graphical User Interface Design Software market?

    The on-cloud category dominated the market in 2022.

    Which organization size had the largest market share in the Graphical User Interface Design Software market?

    SMEs had the largest share of the market.

    Which vertical had the largest Graphical User Interface Design Software market share?

    I.T. & Telecommunication had the largest share of the market.

    1. SECTION I: EXECUTIVE SUMMARY AND KEY HIGHLIGHTS
      1. | 1.1 EXECUTIVE SUMMARY
      2. | | 1.1.1 Market Overview
      3. | | 1.1.2 Key Findings
      4. | | 1.1.3 Market Segmentation
      5. | | 1.1.4 Competitive Landscape
      6. | | 1.1.5 Challenges and Opportunities
      7. | | 1.1.6 Future Outlook
    2. SECTION II: SCOPING, METHODOLOGY AND MARKET STRUCTURE
      1. | 2.1 MARKET INTRODUCTION
      2. | | 2.1.1 Definition
      3. | | 2.1.2 Scope of the study
      4. | | | 2.1.2.1 Research Objective
      5. | | | 2.1.2.2 Assumption
      6. | | | 2.1.2.3 Limitations
      7. | 2.2 RESEARCH METHODOLOGY
      8. | | 2.2.1 Overview
      9. | | 2.2.2 Data Mining
      10. | | 2.2.3 Secondary Research
      11. | | 2.2.4 Primary Research
      12. | | | 2.2.4.1 Primary Interviews and Information Gathering Process
      13. | | | 2.2.4.2 Breakdown of Primary Respondents
      14. | | 2.2.5 Forecasting Model
      15. | | 2.2.6 Market Size Estimation
      16. | | | 2.2.6.1 Bottom-Up Approach
      17. | | | 2.2.6.2 Top-Down Approach
      18. | | 2.2.7 Data Triangulation
      19. | | 2.2.8 Validation
    3. SECTION III: QUALITATIVE ANALYSIS
      1. | 3.1 MARKET DYNAMICS
      2. | | 3.1.1 Overview
      3. | | 3.1.2 Drivers
      4. | | 3.1.3 Restraints
      5. | | 3.1.4 Opportunities
      6. | 3.2 MARKET FACTOR ANALYSIS
      7. | | 3.2.1 Value chain Analysis
      8. | | 3.2.2 Porter's Five Forces Analysis
      9. | | | 3.2.2.1 Bargaining Power of Suppliers
      10. | | | 3.2.2.2 Bargaining Power of Buyers
      11. | | | 3.2.2.3 Threat of New Entrants
      12. | | | 3.2.2.4 Threat of Substitutes
      13. | | | 3.2.2.5 Intensity of Rivalry
      14. | | 3.2.3 COVID-19 Impact Analysis
      15. | | | 3.2.3.1 Market Impact Analysis
      16. | | | 3.2.3.2 Regional Impact
      17. | | | 3.2.3.3 Opportunity and Threat Analysis
    4. SECTION IV: QUANTITATIVE ANALYSIS
      1. | 4.1 Information and Communications Technology, BY Deployment (USD Billion)
      2. | | 4.1.1 On-Cloud
      3. | | 4.1.2 On-Premises
      4. | 4.2 Information and Communications Technology, BY Organization Size (USD Billion)
      5. | | 4.2.1 SMEs
      6. | | 4.2.2 Large Enterprises
      7. | 4.3 Information and Communications Technology, BY Vertical (USD Billion)
      8. | | 4.3.1 Automotive
      9. | | 4.3.2 IT & Telecommunication
      10. | | 4.3.3 Media & Entertainment
      11. | | 4.3.4 Medical & Healthcare
      12. | | 4.3.5 Manufacturing
      13. | 4.4 Information and Communications Technology, BY Region (USD Billion)
      14. | | 4.4.1 North America
      15. | | | 4.4.1.1 US
      16. | | | 4.4.1.2 Canada
      17. | | 4.4.2 Europe
      18. | | | 4.4.2.1 Germany
      19. | | | 4.4.2.2 UK
      20. | | | 4.4.2.3 France
      21. | | | 4.4.2.4 Russia
      22. | | | 4.4.2.5 Italy
      23. | | | 4.4.2.6 Spain
      24. | | | 4.4.2.7 Rest of Europe
      25. | | 4.4.3 APAC
      26. | | | 4.4.3.1 China
      27. | | | 4.4.3.2 India
      28. | | | 4.4.3.3 Japan
      29. | | | 4.4.3.4 South Korea
      30. | | | 4.4.3.5 Malaysia
      31. | | | 4.4.3.6 Thailand
      32. | | | 4.4.3.7 Indonesia
      33. | | | 4.4.3.8 Rest of APAC
      34. | | 4.4.4 South America
      35. | | | 4.4.4.1 Brazil
      36. | | | 4.4.4.2 Mexico
      37. | | | 4.4.4.3 Argentina
      38. | | | 4.4.4.4 Rest of South America
      39. | | 4.4.5 MEA
      40. | | | 4.4.5.1 GCC Countries
      41. | | | 4.4.5.2 South Africa
      42. | | | 4.4.5.3 Rest of MEA
    5. SECTION V: COMPETITIVE ANALYSIS
      1. | 5.1 Competitive Landscape
      2. | | 5.1.1 Overview
      3. | | 5.1.2 Competitive Analysis
      4. | | 5.1.3 Market share Analysis
      5. | | 5.1.4 Major Growth Strategy in the Information and Communications Technology
      6. | | 5.1.5 Competitive Benchmarking
      7. | | 5.1.6 Leading Players in Terms of Number of Developments in the Information and Communications Technology
      8. | | 5.1.7 Key developments and growth strategies
      9. | | | 5.1.7.1 New Product Launch/Service Deployment
      10. | | | 5.1.7.2 Merger & Acquisitions
      11. | | | 5.1.7.3 Joint Ventures
      12. | | 5.1.8 Major Players Financial Matrix
      13. | | | 5.1.8.1 Sales and Operating Income
      14. | | | 5.1.8.2 Major Players R&D Expenditure. 2023
      15. | 5.2 Company Profiles
      16. | | 5.2.1 Adobe (US)
      17. | | | 5.2.1.1 Financial Overview
      18. | | | 5.2.1.2 Products Offered
      19. | | | 5.2.1.3 Key Developments
      20. | | | 5.2.1.4 SWOT Analysis
      21. | | | 5.2.1.5 Key Strategies
      22. | | 5.2.2 Figma (US)
      23. | | | 5.2.2.1 Financial Overview
      24. | | | 5.2.2.2 Products Offered
      25. | | | 5.2.2.3 Key Developments
      26. | | | 5.2.2.4 SWOT Analysis
      27. | | | 5.2.2.5 Key Strategies
      28. | | 5.2.3 Sketch (US)
      29. | | | 5.2.3.1 Financial Overview
      30. | | | 5.2.3.2 Products Offered
      31. | | | 5.2.3.3 Key Developments
      32. | | | 5.2.3.4 SWOT Analysis
      33. | | | 5.2.3.5 Key Strategies
      34. | | 5.2.4 InVision (US)
      35. | | | 5.2.4.1 Financial Overview
      36. | | | 5.2.4.2 Products Offered
      37. | | | 5.2.4.3 Key Developments
      38. | | | 5.2.4.4 SWOT Analysis
      39. | | | 5.2.4.5 Key Strategies
      40. | | 5.2.5 Axure (US)
      41. | | | 5.2.5.1 Financial Overview
      42. | | | 5.2.5.2 Products Offered
      43. | | | 5.2.5.3 Key Developments
      44. | | | 5.2.5.4 SWOT Analysis
      45. | | | 5.2.5.5 Key Strategies
      46. | | 5.2.6 Balsamiq (US)
      47. | | | 5.2.6.1 Financial Overview
      48. | | | 5.2.6.2 Products Offered
      49. | | | 5.2.6.3 Key Developments
      50. | | | 5.2.6.4 SWOT Analysis
      51. | | | 5.2.6.5 Key Strategies
      52. | | 5.2.7 Corel (CA)
      53. | | | 5.2.7.1 Financial Overview
      54. | | | 5.2.7.2 Products Offered
      55. | | | 5.2.7.3 Key Developments
      56. | | | 5.2.7.4 SWOT Analysis
      57. | | | 5.2.7.5 Key Strategies
      58. | | 5.2.8 Microsoft (US)
      59. | | | 5.2.8.1 Financial Overview
      60. | | | 5.2.8.2 Products Offered
      61. | | | 5.2.8.3 Key Developments
      62. | | | 5.2.8.4 SWOT Analysis
      63. | | | 5.2.8.5 Key Strategies
      64. | | 5.2.9 Canva (AU)
      65. | | | 5.2.9.1 Financial Overview
      66. | | | 5.2.9.2 Products Offered
      67. | | | 5.2.9.3 Key Developments
      68. | | | 5.2.9.4 SWOT Analysis
      69. | | | 5.2.9.5 Key Strategies
      70. | 5.3 Appendix
      71. | | 5.3.1 References
      72. | | 5.3.2 Related Reports
    6. LIST OF FIGURES
      1. | 6.1 MARKET SYNOPSIS
      2. | 6.2 NORTH AMERICA MARKET ANALYSIS
      3. | 6.3 US MARKET ANALYSIS BY DEPLOYMENT
      4. | 6.4 US MARKET ANALYSIS BY ORGANIZATION SIZE
      5. | 6.5 US MARKET ANALYSIS BY VERTICAL
      6. | 6.6 CANADA MARKET ANALYSIS BY DEPLOYMENT
      7. | 6.7 CANADA MARKET ANALYSIS BY ORGANIZATION SIZE
      8. | 6.8 CANADA MARKET ANALYSIS BY VERTICAL
      9. | 6.9 EUROPE MARKET ANALYSIS
      10. | 6.10 GERMANY MARKET ANALYSIS BY DEPLOYMENT
      11. | 6.11 GERMANY MARKET ANALYSIS BY ORGANIZATION SIZE
      12. | 6.12 GERMANY MARKET ANALYSIS BY VERTICAL
      13. | 6.13 UK MARKET ANALYSIS BY DEPLOYMENT
      14. | 6.14 UK MARKET ANALYSIS BY ORGANIZATION SIZE
      15. | 6.15 UK MARKET ANALYSIS BY VERTICAL
      16. | 6.16 FRANCE MARKET ANALYSIS BY DEPLOYMENT
      17. | 6.17 FRANCE MARKET ANALYSIS BY ORGANIZATION SIZE
      18. | 6.18 FRANCE MARKET ANALYSIS BY VERTICAL
      19. | 6.19 RUSSIA MARKET ANALYSIS BY DEPLOYMENT
      20. | 6.20 RUSSIA MARKET ANALYSIS BY ORGANIZATION SIZE
      21. | 6.21 RUSSIA MARKET ANALYSIS BY VERTICAL
      22. | 6.22 ITALY MARKET ANALYSIS BY DEPLOYMENT
      23. | 6.23 ITALY MARKET ANALYSIS BY ORGANIZATION SIZE
      24. | 6.24 ITALY MARKET ANALYSIS BY VERTICAL
      25. | 6.25 SPAIN MARKET ANALYSIS BY DEPLOYMENT
      26. | 6.26 SPAIN MARKET ANALYSIS BY ORGANIZATION SIZE
      27. | 6.27 SPAIN MARKET ANALYSIS BY VERTICAL
      28. | 6.28 REST OF EUROPE MARKET ANALYSIS BY DEPLOYMENT
      29. | 6.29 REST OF EUROPE MARKET ANALYSIS BY ORGANIZATION SIZE
      30. | 6.30 REST OF EUROPE MARKET ANALYSIS BY VERTICAL
      31. | 6.31 APAC MARKET ANALYSIS
      32. | 6.32 CHINA MARKET ANALYSIS BY DEPLOYMENT
      33. | 6.33 CHINA MARKET ANALYSIS BY ORGANIZATION SIZE
      34. | 6.34 CHINA MARKET ANALYSIS BY VERTICAL
      35. | 6.35 INDIA MARKET ANALYSIS BY DEPLOYMENT
      36. | 6.36 INDIA MARKET ANALYSIS BY ORGANIZATION SIZE
      37. | 6.37 INDIA MARKET ANALYSIS BY VERTICAL
      38. | 6.38 JAPAN MARKET ANALYSIS BY DEPLOYMENT
      39. | 6.39 JAPAN MARKET ANALYSIS BY ORGANIZATION SIZE
      40. | 6.40 JAPAN MARKET ANALYSIS BY VERTICAL
      41. | 6.41 SOUTH KOREA MARKET ANALYSIS BY DEPLOYMENT
      42. | 6.42 SOUTH KOREA MARKET ANALYSIS BY ORGANIZATION SIZE
      43. | 6.43 SOUTH KOREA MARKET ANALYSIS BY VERTICAL
      44. | 6.44 MALAYSIA MARKET ANALYSIS BY DEPLOYMENT
      45. | 6.45 MALAYSIA MARKET ANALYSIS BY ORGANIZATION SIZE
      46. | 6.46 MALAYSIA MARKET ANALYSIS BY VERTICAL
      47. | 6.47 THAILAND MARKET ANALYSIS BY DEPLOYMENT
      48. | 6.48 THAILAND MARKET ANALYSIS BY ORGANIZATION SIZE
      49. | 6.49 THAILAND MARKET ANALYSIS BY VERTICAL
      50. | 6.50 INDONESIA MARKET ANALYSIS BY DEPLOYMENT
      51. | 6.51 INDONESIA MARKET ANALYSIS BY ORGANIZATION SIZE
      52. | 6.52 INDONESIA MARKET ANALYSIS BY VERTICAL
      53. | 6.53 REST OF APAC MARKET ANALYSIS BY DEPLOYMENT
      54. | 6.54 REST OF APAC MARKET ANALYSIS BY ORGANIZATION SIZE
      55. | 6.55 REST OF APAC MARKET ANALYSIS BY VERTICAL
      56. | 6.56 SOUTH AMERICA MARKET ANALYSIS
      57. | 6.57 BRAZIL MARKET ANALYSIS BY DEPLOYMENT
      58. | 6.58 BRAZIL MARKET ANALYSIS BY ORGANIZATION SIZE
      59. | 6.59 BRAZIL MARKET ANALYSIS BY VERTICAL
      60. | 6.60 MEXICO MARKET ANALYSIS BY DEPLOYMENT
      61. | 6.61 MEXICO MARKET ANALYSIS BY ORGANIZATION SIZE
      62. | 6.62 MEXICO MARKET ANALYSIS BY VERTICAL
      63. | 6.63 ARGENTINA MARKET ANALYSIS BY DEPLOYMENT
      64. | 6.64 ARGENTINA MARKET ANALYSIS BY ORGANIZATION SIZE
      65. | 6.65 ARGENTINA MARKET ANALYSIS BY VERTICAL
      66. | 6.66 REST OF SOUTH AMERICA MARKET ANALYSIS BY DEPLOYMENT
      67. | 6.67 REST OF SOUTH AMERICA MARKET ANALYSIS BY ORGANIZATION SIZE
      68. | 6.68 REST OF SOUTH AMERICA MARKET ANALYSIS BY VERTICAL
      69. | 6.69 MEA MARKET ANALYSIS
      70. | 6.70 GCC COUNTRIES MARKET ANALYSIS BY DEPLOYMENT
      71. | 6.71 GCC COUNTRIES MARKET ANALYSIS BY ORGANIZATION SIZE
      72. | 6.72 GCC COUNTRIES MARKET ANALYSIS BY VERTICAL
      73. | 6.73 SOUTH AFRICA MARKET ANALYSIS BY DEPLOYMENT
      74. | 6.74 SOUTH AFRICA MARKET ANALYSIS BY ORGANIZATION SIZE
      75. | 6.75 SOUTH AFRICA MARKET ANALYSIS BY VERTICAL
      76. | 6.76 REST OF MEA MARKET ANALYSIS BY DEPLOYMENT
      77. | 6.77 REST OF MEA MARKET ANALYSIS BY ORGANIZATION SIZE
      78. | 6.78 REST OF MEA MARKET ANALYSIS BY VERTICAL
      79. | 6.79 KEY BUYING CRITERIA OF INFORMATION AND COMMUNICATIONS TECHNOLOGY
      80. | 6.80 RESEARCH PROCESS OF MRFR
      81. | 6.81 DRO ANALYSIS OF INFORMATION AND COMMUNICATIONS TECHNOLOGY
      82. | 6.82 DRIVERS IMPACT ANALYSIS: INFORMATION AND COMMUNICATIONS TECHNOLOGY
      83. | 6.83 RESTRAINTS IMPACT ANALYSIS: INFORMATION AND COMMUNICATIONS TECHNOLOGY
      84. | 6.84 SUPPLY / VALUE CHAIN: INFORMATION AND COMMUNICATIONS TECHNOLOGY
      85. | 6.85 INFORMATION AND COMMUNICATIONS TECHNOLOGY, BY DEPLOYMENT, 2024 (% SHARE)
      86. | 6.86 INFORMATION AND COMMUNICATIONS TECHNOLOGY, BY DEPLOYMENT, 2024 TO 2035 (USD Billion)
      87. | 6.87 INFORMATION AND COMMUNICATIONS TECHNOLOGY, BY ORGANIZATION SIZE, 2024 (% SHARE)
      88. | 6.88 INFORMATION AND COMMUNICATIONS TECHNOLOGY, BY ORGANIZATION SIZE, 2024 TO 2035 (USD Billion)
      89. | 6.89 INFORMATION AND COMMUNICATIONS TECHNOLOGY, BY VERTICAL, 2024 (% SHARE)
      90. | 6.90 INFORMATION AND COMMUNICATIONS TECHNOLOGY, BY VERTICAL, 2024 TO 2035 (USD Billion)
      91. | 6.91 BENCHMARKING OF MAJOR COMPETITORS
    7. LIST OF TABLES
      1. | 7.1 LIST OF ASSUMPTIONS
      2. | | 7.1.1
      3. | 7.2 North America MARKET SIZE ESTIMATES; FORECAST
      4. | | 7.2.1 BY DEPLOYMENT, 2025-2035 (USD Billion)
      5. | | 7.2.2 BY ORGANIZATION SIZE, 2025-2035 (USD Billion)
      6. | | 7.2.3 BY VERTICAL, 2025-2035 (USD Billion)
      7. | 7.3 US MARKET SIZE ESTIMATES; FORECAST
      8. | | 7.3.1 BY DEPLOYMENT, 2025-2035 (USD Billion)
      9. | | 7.3.2 BY ORGANIZATION SIZE, 2025-2035 (USD Billion)
      10. | | 7.3.3 BY VERTICAL, 2025-2035 (USD Billion)
      11. | 7.4 Canada MARKET SIZE ESTIMATES; FORECAST
      12. | | 7.4.1 BY DEPLOYMENT, 2025-2035 (USD Billion)
      13. | | 7.4.2 BY ORGANIZATION SIZE, 2025-2035 (USD Billion)
      14. | | 7.4.3 BY VERTICAL, 2025-2035 (USD Billion)
      15. | 7.5 Europe MARKET SIZE ESTIMATES; FORECAST
      16. | | 7.5.1 BY DEPLOYMENT, 2025-2035 (USD Billion)
      17. | | 7.5.2 BY ORGANIZATION SIZE, 2025-2035 (USD Billion)
      18. | | 7.5.3 BY VERTICAL, 2025-2035 (USD Billion)
      19. | 7.6 Germany MARKET SIZE ESTIMATES; FORECAST
      20. | | 7.6.1 BY DEPLOYMENT, 2025-2035 (USD Billion)
      21. | | 7.6.2 BY ORGANIZATION SIZE, 2025-2035 (USD Billion)
      22. | | 7.6.3 BY VERTICAL, 2025-2035 (USD Billion)
      23. | 7.7 UK MARKET SIZE ESTIMATES; FORECAST
      24. | | 7.7.1 BY DEPLOYMENT, 2025-2035 (USD Billion)
      25. | | 7.7.2 BY ORGANIZATION SIZE, 2025-2035 (USD Billion)
      26. | | 7.7.3 BY VERTICAL, 2025-2035 (USD Billion)
      27. | 7.8 France MARKET SIZE ESTIMATES; FORECAST
      28. | | 7.8.1 BY DEPLOYMENT, 2025-2035 (USD Billion)
      29. | | 7.8.2 BY ORGANIZATION SIZE, 2025-2035 (USD Billion)
      30. | | 7.8.3 BY VERTICAL, 2025-2035 (USD Billion)
      31. | 7.9 Russia MARKET SIZE ESTIMATES; FORECAST
      32. | | 7.9.1 BY DEPLOYMENT, 2025-2035 (USD Billion)
      33. | | 7.9.2 BY ORGANIZATION SIZE, 2025-2035 (USD Billion)
      34. | | 7.9.3 BY VERTICAL, 2025-2035 (USD Billion)
      35. | 7.10 Italy MARKET SIZE ESTIMATES; FORECAST
      36. | | 7.10.1 BY DEPLOYMENT, 2025-2035 (USD Billion)
      37. | | 7.10.2 BY ORGANIZATION SIZE, 2025-2035 (USD Billion)
      38. | | 7.10.3 BY VERTICAL, 2025-2035 (USD Billion)
      39. | 7.11 Spain MARKET SIZE ESTIMATES; FORECAST
      40. | | 7.11.1 BY DEPLOYMENT, 2025-2035 (USD Billion)
      41. | | 7.11.2 BY ORGANIZATION SIZE, 2025-2035 (USD Billion)
      42. | | 7.11.3 BY VERTICAL, 2025-2035 (USD Billion)
      43. | 7.12 Rest of Europe MARKET SIZE ESTIMATES; FORECAST
      44. | | 7.12.1 BY DEPLOYMENT, 2025-2035 (USD Billion)
      45. | | 7.12.2 BY ORGANIZATION SIZE, 2025-2035 (USD Billion)
      46. | | 7.12.3 BY VERTICAL, 2025-2035 (USD Billion)
      47. | 7.13 APAC MARKET SIZE ESTIMATES; FORECAST
      48. | | 7.13.1 BY DEPLOYMENT, 2025-2035 (USD Billion)
      49. | | 7.13.2 BY ORGANIZATION SIZE, 2025-2035 (USD Billion)
      50. | | 7.13.3 BY VERTICAL, 2025-2035 (USD Billion)
      51. | 7.14 China MARKET SIZE ESTIMATES; FORECAST
      52. | | 7.14.1 BY DEPLOYMENT, 2025-2035 (USD Billion)
      53. | | 7.14.2 BY ORGANIZATION SIZE, 2025-2035 (USD Billion)
      54. | | 7.14.3 BY VERTICAL, 2025-2035 (USD Billion)
      55. | 7.15 India MARKET SIZE ESTIMATES; FORECAST
      56. | | 7.15.1 BY DEPLOYMENT, 2025-2035 (USD Billion)
      57. | | 7.15.2 BY ORGANIZATION SIZE, 2025-2035 (USD Billion)
      58. | | 7.15.3 BY VERTICAL, 2025-2035 (USD Billion)
      59. | 7.16 Japan MARKET SIZE ESTIMATES; FORECAST
      60. | | 7.16.1 BY DEPLOYMENT, 2025-2035 (USD Billion)
      61. | | 7.16.2 BY ORGANIZATION SIZE, 2025-2035 (USD Billion)
      62. | | 7.16.3 BY VERTICAL, 2025-2035 (USD Billion)
      63. | 7.17 South Korea MARKET SIZE ESTIMATES; FORECAST
      64. | | 7.17.1 BY DEPLOYMENT, 2025-2035 (USD Billion)
      65. | | 7.17.2 BY ORGANIZATION SIZE, 2025-2035 (USD Billion)
      66. | | 7.17.3 BY VERTICAL, 2025-2035 (USD Billion)
      67. | 7.18 Malaysia MARKET SIZE ESTIMATES; FORECAST
      68. | | 7.18.1 BY DEPLOYMENT, 2025-2035 (USD Billion)
      69. | | 7.18.2 BY ORGANIZATION SIZE, 2025-2035 (USD Billion)
      70. | | 7.18.3 BY VERTICAL, 2025-2035 (USD Billion)
      71. | 7.19 Thailand MARKET SIZE ESTIMATES; FORECAST
      72. | | 7.19.1 BY DEPLOYMENT, 2025-2035 (USD Billion)
      73. | | 7.19.2 BY ORGANIZATION SIZE, 2025-2035 (USD Billion)
      74. | | 7.19.3 BY VERTICAL, 2025-2035 (USD Billion)
      75. | 7.20 Indonesia MARKET SIZE ESTIMATES; FORECAST
      76. | | 7.20.1 BY DEPLOYMENT, 2025-2035 (USD Billion)
      77. | | 7.20.2 BY ORGANIZATION SIZE, 2025-2035 (USD Billion)
      78. | | 7.20.3 BY VERTICAL, 2025-2035 (USD Billion)
      79. | 7.21 Rest of APAC MARKET SIZE ESTIMATES; FORECAST
      80. | | 7.21.1 BY DEPLOYMENT, 2025-2035 (USD Billion)
      81. | | 7.21.2 BY ORGANIZATION SIZE, 2025-2035 (USD Billion)
      82. | | 7.21.3 BY VERTICAL, 2025-2035 (USD Billion)
      83. | 7.22 South America MARKET SIZE ESTIMATES; FORECAST
      84. | | 7.22.1 BY DEPLOYMENT, 2025-2035 (USD Billion)
      85. | | 7.22.2 BY ORGANIZATION SIZE, 2025-2035 (USD Billion)
      86. | | 7.22.3 BY VERTICAL, 2025-2035 (USD Billion)
      87. | 7.23 Brazil MARKET SIZE ESTIMATES; FORECAST
      88. | | 7.23.1 BY DEPLOYMENT, 2025-2035 (USD Billion)
      89. | | 7.23.2 BY ORGANIZATION SIZE, 2025-2035 (USD Billion)
      90. | | 7.23.3 BY VERTICAL, 2025-2035 (USD Billion)
      91. | 7.24 Mexico MARKET SIZE ESTIMATES; FORECAST
      92. | | 7.24.1 BY DEPLOYMENT, 2025-2035 (USD Billion)
      93. | | 7.24.2 BY ORGANIZATION SIZE, 2025-2035 (USD Billion)
      94. | | 7.24.3 BY VERTICAL, 2025-2035 (USD Billion)
      95. | 7.25 Argentina MARKET SIZE ESTIMATES; FORECAST
      96. | | 7.25.1 BY DEPLOYMENT, 2025-2035 (USD Billion)
      97. | | 7.25.2 BY ORGANIZATION SIZE, 2025-2035 (USD Billion)
      98. | | 7.25.3 BY VERTICAL, 2025-2035 (USD Billion)
      99. | 7.26 Rest of South America MARKET SIZE ESTIMATES; FORECAST
      100. | | 7.26.1 BY DEPLOYMENT, 2025-2035 (USD Billion)
      101. | | 7.26.2 BY ORGANIZATION SIZE, 2025-2035 (USD Billion)
      102. | | 7.26.3 BY VERTICAL, 2025-2035 (USD Billion)
      103. | 7.27 MEA MARKET SIZE ESTIMATES; FORECAST
      104. | | 7.27.1 BY DEPLOYMENT, 2025-2035 (USD Billion)
      105. | | 7.27.2 BY ORGANIZATION SIZE, 2025-2035 (USD Billion)
      106. | | 7.27.3 BY VERTICAL, 2025-2035 (USD Billion)
      107. | 7.28 GCC Countries MARKET SIZE ESTIMATES; FORECAST
      108. | | 7.28.1 BY DEPLOYMENT, 2025-2035 (USD Billion)
      109. | | 7.28.2 BY ORGANIZATION SIZE, 2025-2035 (USD Billion)
      110. | | 7.28.3 BY VERTICAL, 2025-2035 (USD Billion)
      111. | 7.29 South Africa MARKET SIZE ESTIMATES; FORECAST
      112. | | 7.29.1 BY DEPLOYMENT, 2025-2035 (USD Billion)
      113. | | 7.29.2 BY ORGANIZATION SIZE, 2025-2035 (USD Billion)
      114. | | 7.29.3 BY VERTICAL, 2025-2035 (USD Billion)
      115. | 7.30 Rest of MEA MARKET SIZE ESTIMATES; FORECAST
      116. | | 7.30.1 BY DEPLOYMENT, 2025-2035 (USD Billion)
      117. | | 7.30.2 BY ORGANIZATION SIZE, 2025-2035 (USD Billion)
      118. | | 7.30.3 BY VERTICAL, 2025-2035 (USD Billion)
      119. | 7.31 PRODUCT LAUNCH/PRODUCT DEVELOPMENT/APPROVAL
      120. | | 7.31.1
      121. | 7.32 ACQUISITION/PARTNERSHIP
      122. | | 7.32.1

    Graphical User Interface Design Software Market Segmentation

    Graphical User Interface Design Software Deployment Outlook (USD Billion, 2018-2032)

    • On Cloud
    • On Premise

    Graphical User Interface Design Software Organization Size Outlook (USD Billion, 2018-2032)

    • SMEs
    • Large Enterprises

    Graphical User Interface Design Software Vertical Outlook (USD Billion, 2018-2032)

    • Automotive
    • IT & Telecommunication
    • Media & Entertainment
    • Medical & Healthcare
    • Manufacturing

    Graphical User Interface Design Software Regional Outlook (USD Billion, 2018-2032)

    • North America Outlook (USD Billion, 2018-2032)

      • North America Graphical User Interface Design Software by Deployment
        • On Cloud
        • On Premise
      • North America Graphical User Interface Design Software by Organization Size
        • SMEs
        • Large Enterprises
      • North America Graphical User Interface Design Software by Vertical
        • Automotive
        • IT & Telecommunication
        • Media & Entertainment
        • Medical & Healthcare
        • Manufacturing
      • US Outlook (USD Billion, 2018-2032)

      • US Graphical User Interface Design Software by Deployment
        • On Cloud
        • On Premise
      • US Graphical User Interface Design Software by Organization Size
        • SMEs
        • Large Enterprises
      • US Graphical User Interface Design Software by Vertical
        • Automotive
        • IT & Telecommunication
        • Media & Entertainment
        • Medical & Healthcare
        • Manufacturing
      • CANADA Outlook (USD Billion, 2018-2032)

      • CANADA Graphical User Interface Design Software by Deployment
        • On Cloud
        • On Premise
      • CANADA Graphical User Interface Design Software by Organization Size
        • SMEs
        • Large Enterprises
      • CANADA Graphical User Interface Design Software by Vertical
        • Automotive
        • IT & Telecommunication
        • Media & Entertainment
        • Medical & Healthcare
        • Manufacturing
    • Europe Outlook (USD Billion, 2018-2032)

      • Europe Graphical User Interface Design Software by Deployment
        • On Cloud
        • On Premise
      • Europe Graphical User Interface Design Software by Organization Size
        • SMEs
        • Large Enterprises
      • Europe Graphical User Interface Design Software by Vertical
        • Automotive
        • IT & Telecommunication
        • Media & Entertainment
        • Medical & Healthcare
        • Manufacturing
      • Germany Outlook (USD Billion, 2018-2032)

      • Germany Graphical User Interface Design Software by Deployment
        • On Cloud
        • On Premise
      • Germany Graphical User Interface Design Software by Organization Size
        • SMEs
        • Large Enterprises
      • Germany Graphical User Interface Design Software by Vertical
        • Automotive
        • IT & Telecommunication
        • Media & Entertainment
        • Medical & Healthcare
        • Manufacturing
      • France Outlook (USD Billion, 2018-2032)

      • France Graphical User Interface Design Software by Deployment
        • On Cloud
        • On Premise
      • France Graphical User Interface Design Software by Organization Size
        • SMEs
        • Large Enterprises
      • France Graphical User Interface Design Software by Vertical
        • Automotive
        • IT & Telecommunication
        • Media & Entertainment
        • Medical & Healthcare
        • Manufacturing
      • UK Outlook (USD Billion, 2018-2032)

      • UK Graphical User Interface Design Software by Deployment
        • On Cloud
        • On Premise
      • UK Graphical User Interface Design Software by Organization Size
        • SMEs
        • Large Enterprises
      • UK Graphical User Interface Design Software by Vertical
        • Automotive
        • IT & Telecommunication
        • Media & Entertainment
        • Medical & Healthcare
        • Manufacturing
      • ITALY Outlook (USD Billion, 2018-2032)

      • ITALY Graphical User Interface Design Software by Deployment
        • On Cloud
        • On Premise
      • ITALY Graphical User Interface Design Software by Organization Size
        • SMEs
        • Large Enterprises
      • ITALY Graphical User Interface Design Software by Vertical
        • Automotive
        • IT & Telecommunication
        • Media & Entertainment
        • Medical & Healthcare
        • Manufacturing
      • SPAIN Outlook (USD Billion, 2018-2032)

      • Spain Graphical User Interface Design Software by Deployment
        • On Cloud
        • On Premise
      • Spain Graphical User Interface Design Software by Organization Size
        • SMEs
        • Large Enterprises
      • Spain Graphical User Interface Design Software by Vertical
        • Automotive
        • IT & Telecommunication
        • Media & Entertainment
        • Medical & Healthcare
        • Manufacturing
      • Rest Of Europe Outlook (USD Billion, 2018-2032)

      • Rest Of Europe Graphical User Interface Design Software by Deployment
        • On Cloud
        • On Premise
      • Rest Of Europe Graphical User Interface Design Software by Organization Size
        • SMEs
        • Large Enterprises
      • Rest Of Europe Graphical User Interface Design Software by Vertical
        • Automotive
        • IT & Telecommunication
        • Media & Entertainment
        • Medical & Healthcare
        • Manufacturing
    • Asia-Pacific Outlook (USD Billion, 2018-2032)

      • Asia-Pacific Graphical User Interface Design Software by Deployment
        • On Cloud
        • On Premise
      • Asia-Pacific Graphical User Interface Design Software by Organization Size
        • SMEs
        • Large Enterprises
      • Asia-Pacific Graphical User Interface Design Software by Vertical
        • Automotive
        • IT & Telecommunication
        • Media & Entertainment
        • Medical & Healthcare
        • Manufacturing
      • China Outlook (USD Billion, 2018-2032)

      • China Graphical User Interface Design Software by Deployment
        • On Cloud
        • On Premise
      • China Graphical User Interface Design Software by Organization Size
        • SMEs
        • Large Enterprises
      • China Graphical User Interface Design Software by Vertical
        • Automotive
        • IT & Telecommunication
        • Media & Entertainment
        • Medical & Healthcare
        • Manufacturing
      • Japan Outlook (USD Billion, 2018-2032)

      • Japan Graphical User Interface Design Software by Deployment
        • On Cloud
        • On Premise
      • Japan Graphical User Interface Design Software by Organization Size
        • SMEs
        • Large Enterprises
      • Japan Graphical User Interface Design Software by Vertical
        • Automotive
        • IT & Telecommunication
        • Media & Entertainment
        • Medical & Healthcare
        • Manufacturing
      • India Outlook (USD Billion, 2018-2032)

      • India Graphical User Interface Design Software by Deployment
        • On Cloud
        • On Premise
      • India Graphical User Interface Design Software by Organization Size
        • SMEs
        • Large Enterprises
      • India Graphical User Interface Design Software by Vertical
        • Automotive
        • IT & Telecommunication
        • Media & Entertainment
        • Medical & Healthcare
        • Manufacturing
      • Australia Outlook (USD Billion, 2018-2032)

      • Australia Graphical User Interface Design Software by Deployment
        • On Cloud
        • On Premise
      • Australia Graphical User Interface Design Software by Organization Size
        • SMEs
        • Large Enterprises
      • Australia Graphical User Interface Design Software by Vertical
        • Automotive
        • IT & Telecommunication
        • Media & Entertainment
        • Medical & Healthcare
        • Manufacturing
      • Rest of Asia-Pacific Outlook (USD Billion, 2018-2032)

      • Rest of Asia-Pacific Graphical User Interface Design Software by Deployment
        • On Cloud
        • On Premise
      • Rest of Asia-Pacific Graphical User Interface Design Software by Organization Size
        • SMEs
        • Large Enterprises
      • Rest of Asia-Pacific Graphical User Interface Design Software by Vertical
        • Automotive
        • IT & Telecommunication
        • Media & Entertainment
        • Medical & Healthcare
        • Manufacturing
    • Rest of the World Outlook (USD Billion, 2018-2032)

      • Rest of the World Graphical User Interface Design Software by Deployment
        • On Cloud
        • On Premise
      • Rest of the World Graphical User Interface Design Software by Organization Size
        • SMEs
        • Large Enterprises
      • Rest of the World Graphical User Interface Design Software by Vertical
        • Automotive
        • IT & Telecommunication
        • Media & Entertainment
        • Medical & Healthcare
        • Manufacturing
      • Middle East Outlook (USD Billion, 2018-2032)

      • Middle East Graphical User Interface Design Software by Deployment
        • On Cloud
        • On Premise
      • Middle East Graphical User Interface Design Software by Organization Size
        • SMEs
        • Large Enterprises
      • Middle East Graphical User Interface Design Software by Vertical
        • Automotive
        • IT & Telecommunication
        • Media & Entertainment
        • Medical & Healthcare
        • Manufacturing
      • Africa Outlook (USD Billion, 2018-2032)

      • Africa Graphical User Interface Design Software by Deployment
        • On Cloud
        • On Premise
      • Africa Graphical User Interface Design Software by Organization Size
        • SMEs
        • Large Enterprises
      • Africa Graphical User Interface Design Software by Vertical
        • Automotive
        • IT & Telecommunication
        • Media & Entertainment
        • Medical & Healthcare
        • Manufacturing
      • Latin America Outlook (USD Billion, 2018-2032)

      • Latin America Graphical User Interface Design Software by Deployment
        • On Cloud
        • On Premise
      • Latin America Graphical User Interface Design Software by Organization Size
        • SMEs
        • Large Enterprises
      • Latin America Graphical User Interface Design Software by Vertical
        • Automotive
        • IT & Telecommunication
        • Media & Entertainment
        • Medical & Healthcare
        • Manufacturing
    Infographic

    Free Sample Request

    Kindly complete the form below to receive a free sample of this Report

    Get Free Sample

    Customer Strories

    “I am very pleased with how market segments have been defined in a relevant way for my purposes (such as "Portable Freezers & refrigerators" and "last-mile"). In general the report is well structured. Thanks very much for your efforts.”

    Victoria Milne

    Founder
    Case Study
    Chemicals and Materials

    Compare Licence

    ×
    Features License Type
    Single User Multiuser License Enterprise User
    Price $4,950 $5,950 $7,250
    Maximum User Access Limit 1 User Upto 10 Users Unrestricted Access Throughout the Organization
    Free Customization
    Direct Access to Analyst
    Deliverable Format
    Platform Access
    Discount on Next Purchase 10% 15% 15%
    Printable Versions